
Sample Category Title
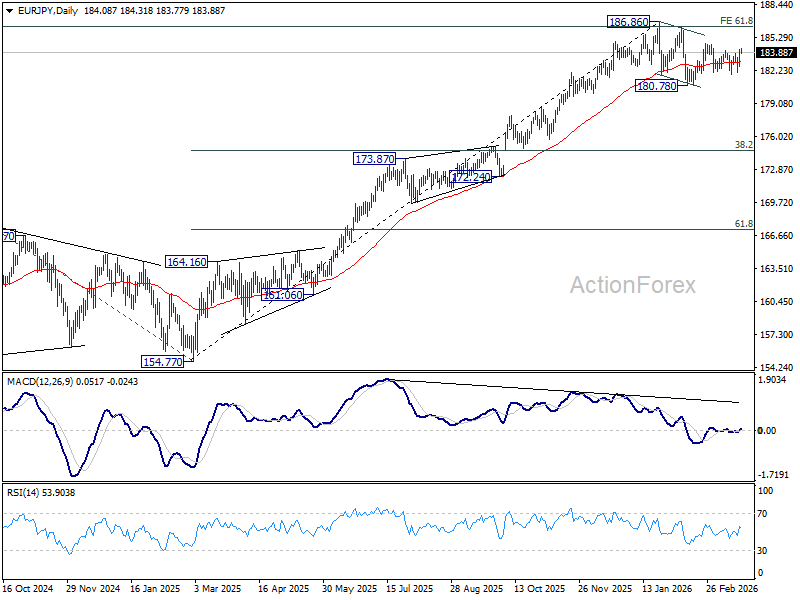
EUR/JPY Daily Outlook
Daily Pivots: (S1) 183.13; (P) 183.70; (R1) 184.83; More...
Intraday bias in EUR/JPY stays mildly on the upside from 184.75 resistance. Firm break there will resume the whole rise from 180.78 and target a retest on 186.86 high. For now, risk will stay mildly on the upside a long as 182.02 support holds, in case of retreat.
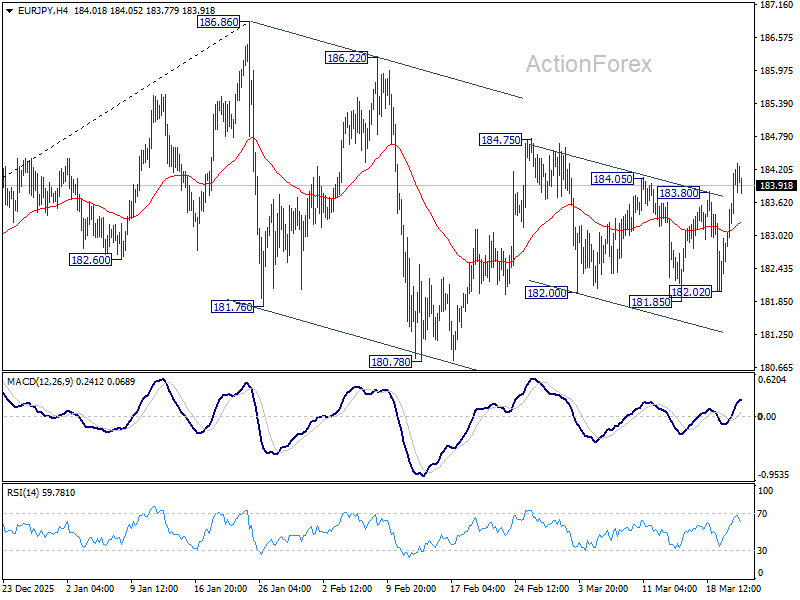
In the bigger picture, a medium term top could be in place at 186.86 and some more consolidations would be seen. Nevertheless, as long as 55 W EMA (now at 175.61) holds, the larger up trend from 114.42 (2020 low) remains intact. Firm break of 186.86 will pave the way to 78.6% projection of 124.37 (2022 low) to 175.41 (2025 high) from 154.77 at 194.88 next.
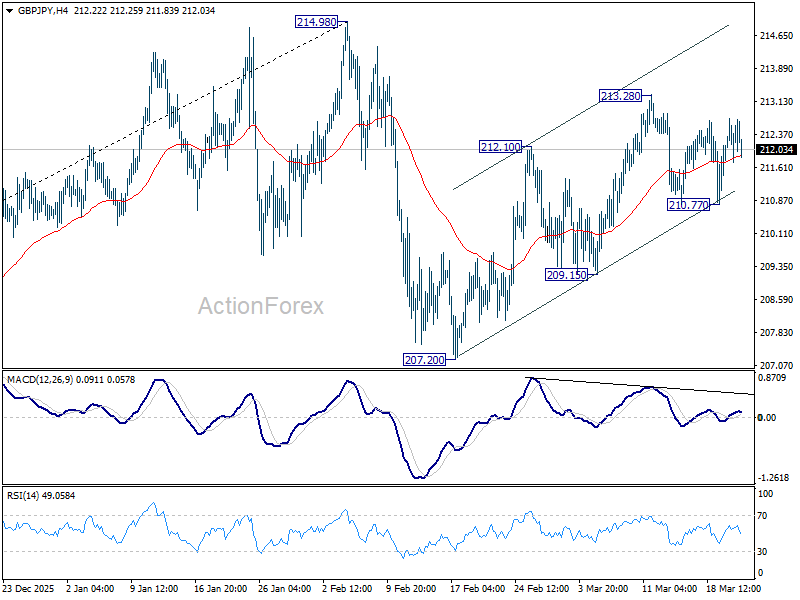
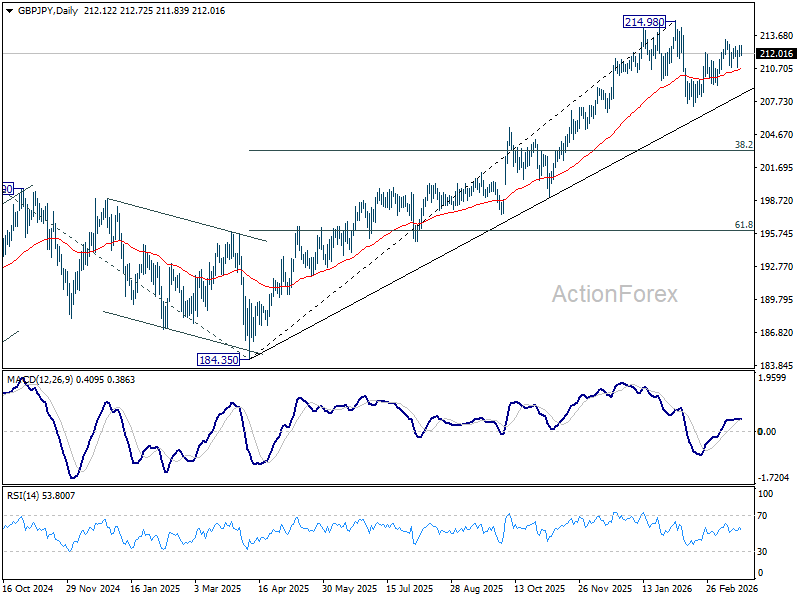
GBP/JPY Daily Outlook
Daily Pivots: (S1) 210.95; (P) 211.66; (R1) 212.51; More...
Intraday bias in GBP/JPY stays mildly on the upside at this point. Firm break of 213.28 resistance will resume the rally from 207.20 and target a retest on 214.98 high. For now, risk will stay mildly on the upside as long as 210.77 support holds, in case of retreat.
In the bigger picture, up trend from 123.94 (2020 low) is still in progress. Firm break of 214.98 will target 61.8% projection of 148.93 (2022 low) to 208.09 (2024 high) from 184.35 at 220.90. This will remain the favored case as long as 55 W EMA (now at 203.13) holds, even in case of another deep pullback.
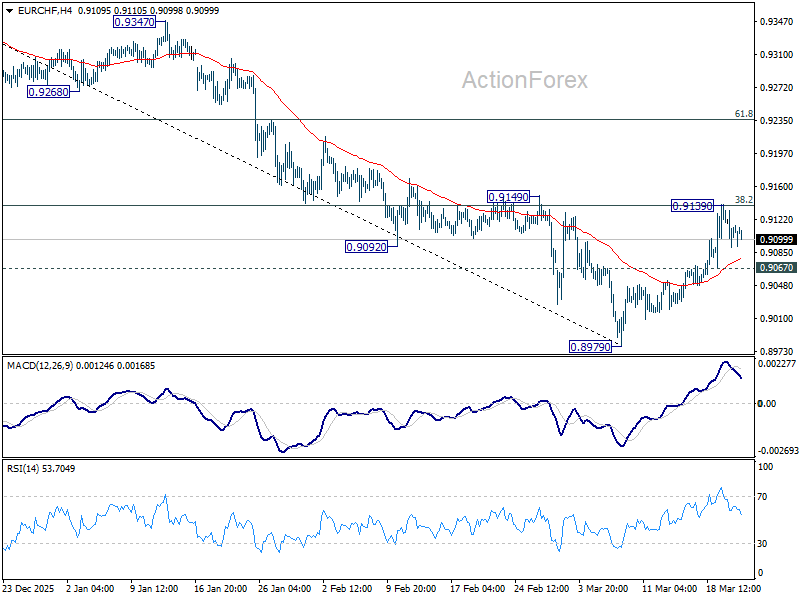
EUR/CHF Daily Outlook
Daily Pivots: (S1) 0.9094; (P) 0.9116; (R1) 0.9141; More....
Intraday bias in EUR/CHF remains neutral at this point. On the upside, firm break of 38.2% retracement of 0.9394 to 0.8979 at 0.9138 will extend the rebound from 0.8979 short term bottom to 61.8% retracement at 0.9235. On the downside, below 0.9067 minor support will turn intraday bias back to the downside for retesting 0.8979 low instead.
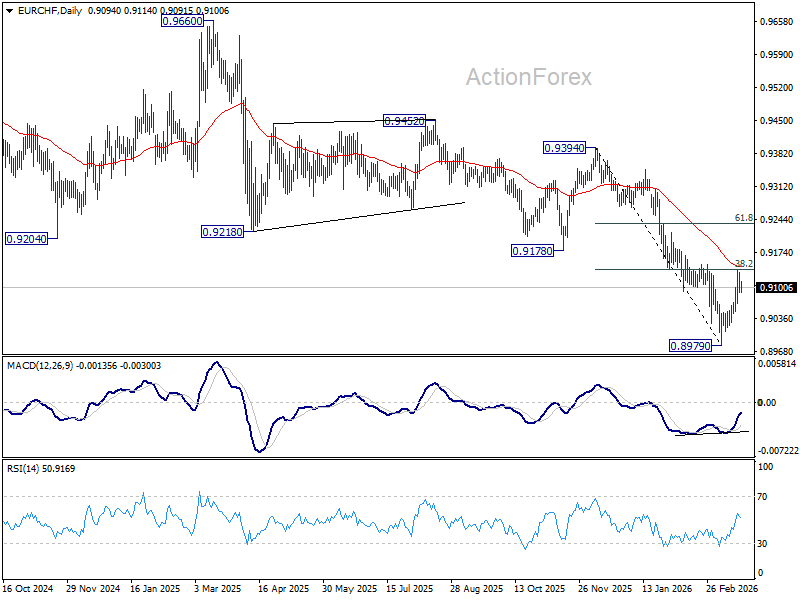
In the bigger picture, down trend from 0.9928 (2024 high) is still in progress. Next target is 61.8% projection of 1.1149 to 0.9407 from 0.9928 at 0.8851. Outlook will stay bearish as long as 0.9394 resistance holds, in case of rebound.
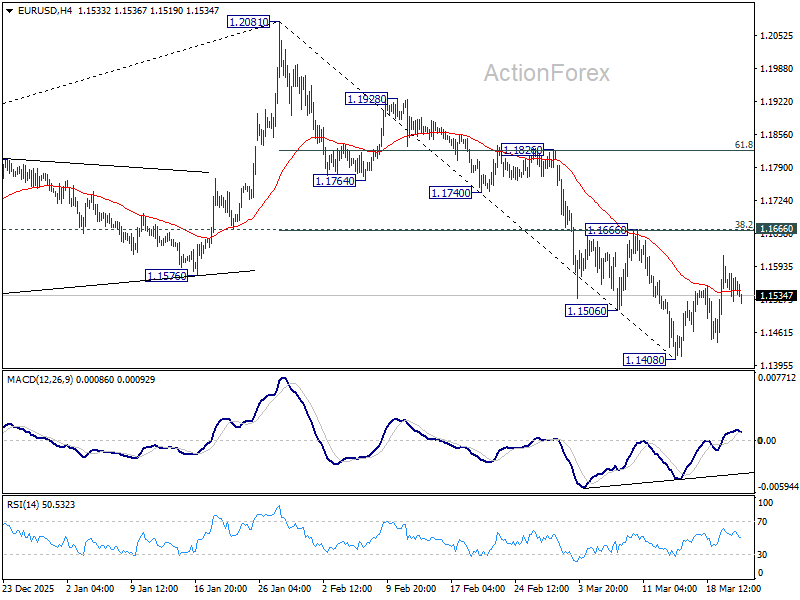
EUR/USD Daily Outlook
Daily Pivots: (S1) 1.1532; (P) 1.1565; (R1) 1.1605; More….
Intraday bias in EUR/USD remains neutral at this point. With 1.1666 cluster resistance (38.2% retracement of 1.2081 to 1.1408 at 1.1665) intact, further decline is still in favor. On the downside, below 1.1408 will resume the fall from 1.2081 to 38.2% retracement of 1.0176 to 1.2081 at 1.1353. However, decisive break of 1.1666 will argue that the fall from 1.2081 has completed, and turn bias back to the upside for 61.8% retracement of 1.2081 to 1.1408 at 1.1824.
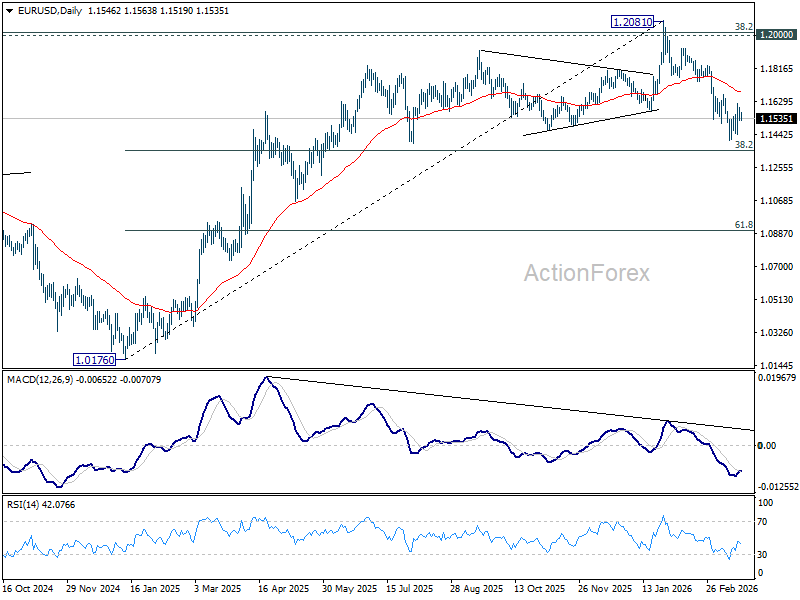
In the bigger picture, prior break of 55 W EMA (now at 1.1495) should confirm rejection by 1.2 key cluster resistance level. The whole up trend from 0.9534 (2022 low) might have completed as a three wave corrective rise too. Deeper fall is expected to long term channel support (now at 1.0528). Meanwhile, risk will stay on the downside as long as 1.2081 holds, even in case of strong rebound.
USD/JPY Daily Outlook
Daily Pivots: (S1) 158.08; (P) 158.74; (R1) 159.88; More...
Intraday bias in USD/JPY stays neutral at this point. Consolidation from 159.88 could extend with another falling leg. But downside should be contained by 38.2% retracement of 152.25 to 159.88 at 156.96. On the upside, break of 159.88 will target a test on 161.94 high.
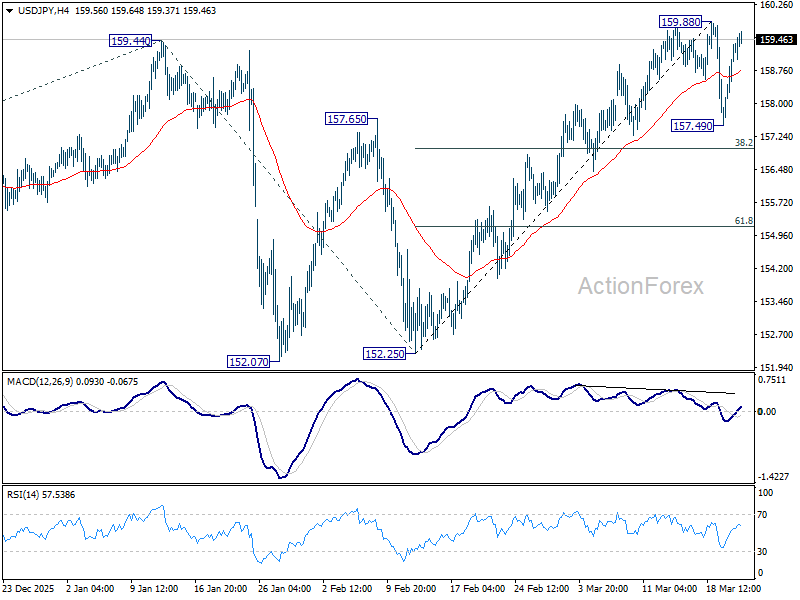
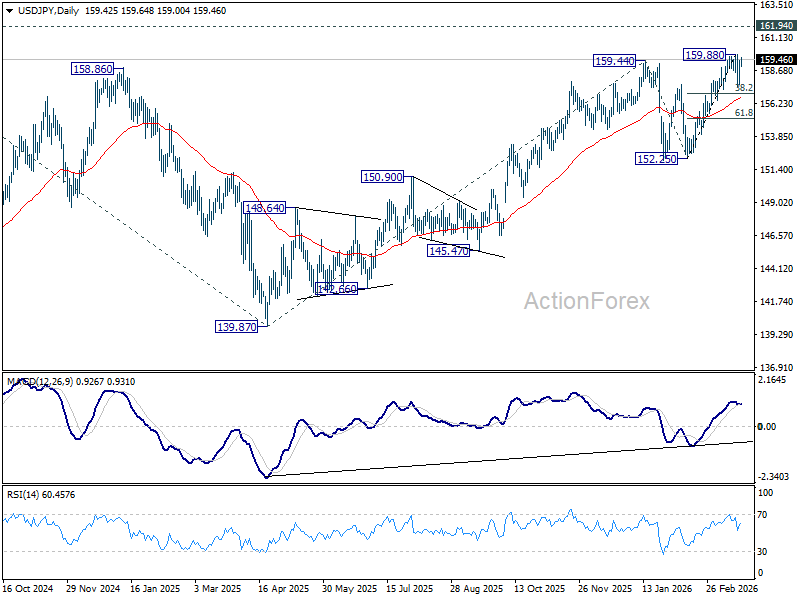
In the bigger picture, outlook is unchanged that corrective pattern from 161.94 (2024 high) should have completed with three waves at 139.87. Larger up trend from 102.58 (2021 low) could be ready to resume through 161.94. This will remain the favored case as long as 55 W EMA (now at 152.70) holds. Firm break of 161.94 will pave the way to 61.8% projection of 102.58 to 161.94 from 139.87 at 176.75.
GBP/USD Daily Outlook
Daily Pivots: (S1) 1.3279; (P) 1.3362; (R1) 1.3426; More...
Range trading continues in GBP/USD and intraday bias stays neutral. Further decline is in favor with 1.3482 resistance intact. On the downside, below 1.3216 will resume the fall from 1.3867 to 1.3008 structural support. However, decisive break of 1.3482 will argue that the fall from 1.3867 has completed, and turn bias back to the upside for 61.8% retracement of 1.3867 to 1.3216 at 1.3618.
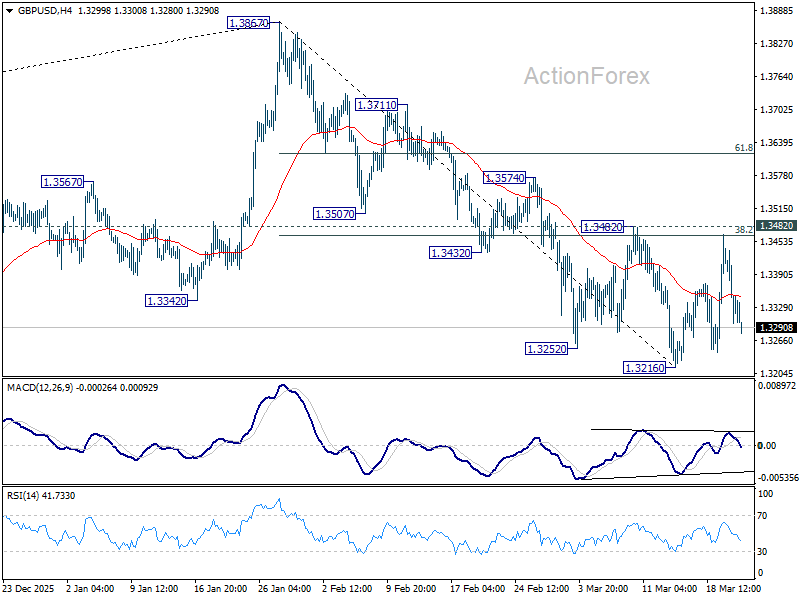
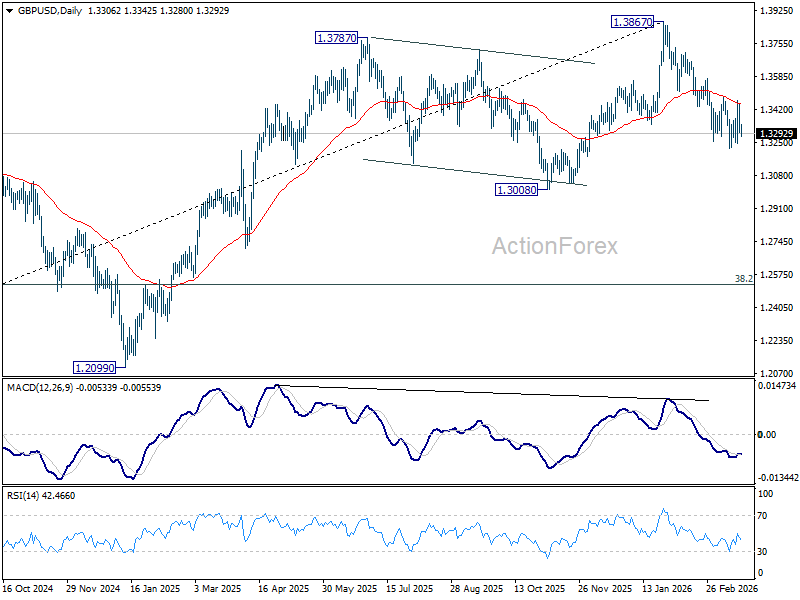
In the bigger picture, considering bearish divergence condition in both D and W MACD, a medium term top should be in place at 1.3867. Firm break of 1.3008 support will argue that fall from 1.3867 is at least correcting the rise from 1.0351 (2022 low) with risk of bearish reversal. That would open up further decline to 38.2% retracement of 1.0351 to 1.3867 at 1.2524. For now, medium term outlook will be neutral at best as long as 1.3867 resistance holds, or until further development.
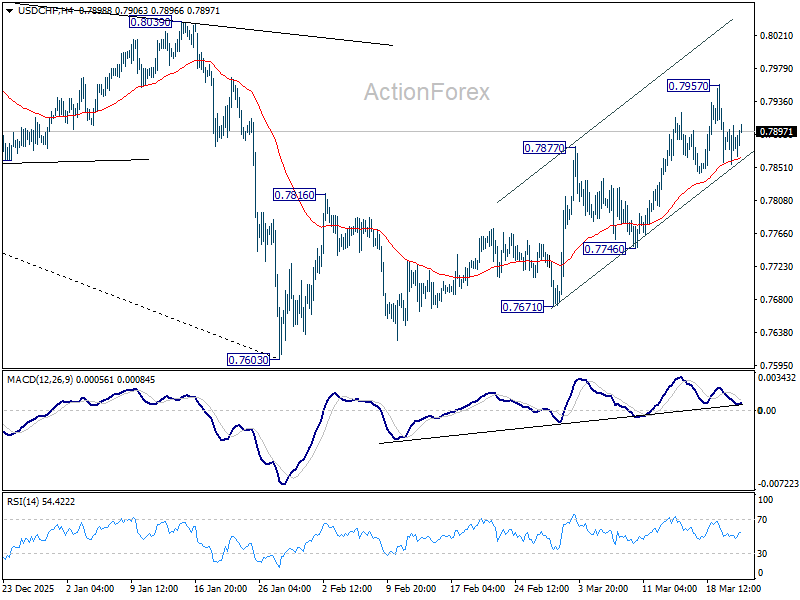
USD/CHF Daily Outlook
Daily Pivots: (S1) 0.7854; (P) 0.7880; (R1) 0.7905; More….
Intraday bias in USD/CHF stays neutral for the moment and more consolidations could be seen below 0.7957. As noted before, rise from 0.7603 should be correcting whole decline from 0.9200. Above 0.7957 will target 38.2% retracement of 0.9200 to 0.7603 at 0.8213. This will remain the favored case as long as 0.7746 support holds.
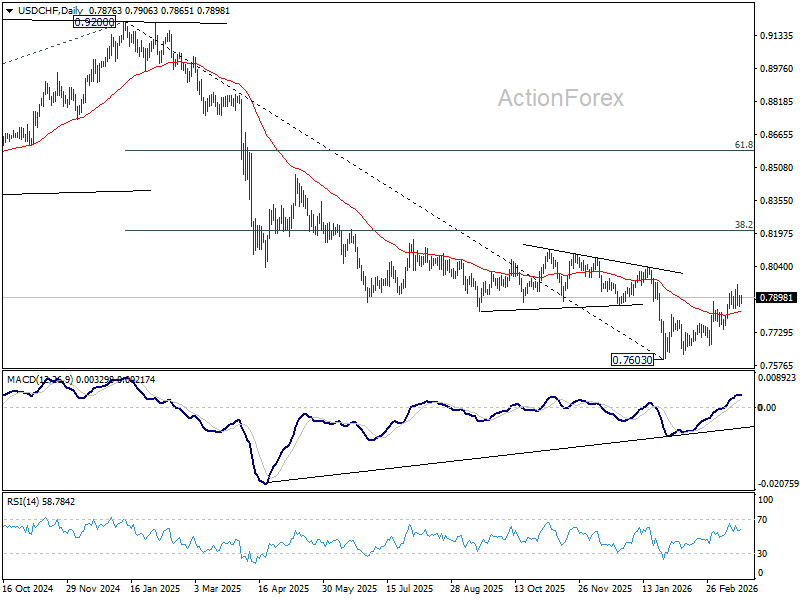
In the bigger picture, a medium term bottom should be in place at 0.7603 on bullish convergence condition in D MACD. Rebound from there is seen as correcting the fall from 0.9200 only. However, decisive break of 55 W EMA (now at 0.8085) will suggest that it's probably correcting the larger scale down trend from 1.0146 (2022 high). On the other hand, rejection by the 55 W EMA will setup down trend resumption to 100% projection of 1.0146 (2022 high) to 0.8332 from 0.9200 at 0.7382 at a later stage.
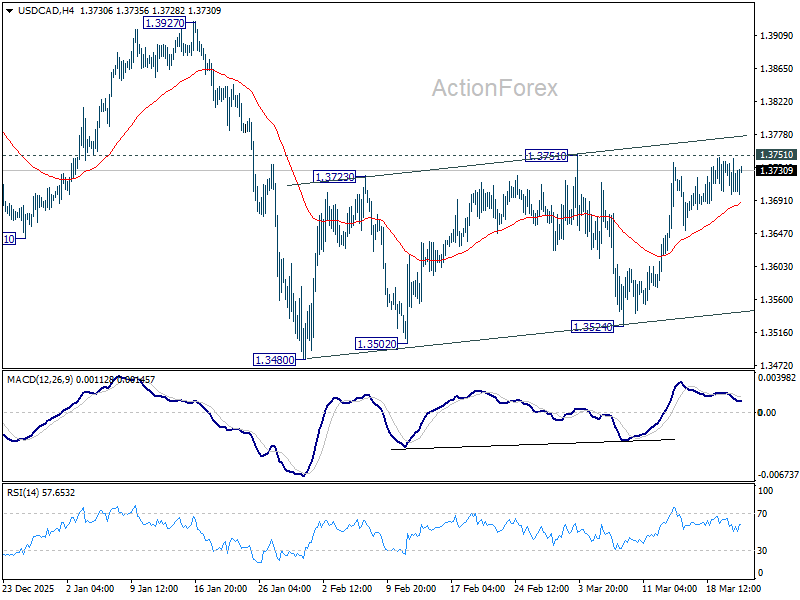
USD/CAD Daily Outlook
Daily Pivots: (S1) 1.3701; (P) 1.3725; (R1) 1.3750; More...
Intraday bias in USD/CAD stays neutral at this point. On the upside, firm break of 1.3751 resistance will suggest that stronger rebound is underway, and target 1.3927 resistance first. Meanwhile, break of 1.3524 support will bring resumption of whole down trend from 1.4791 through 1.3480 low.
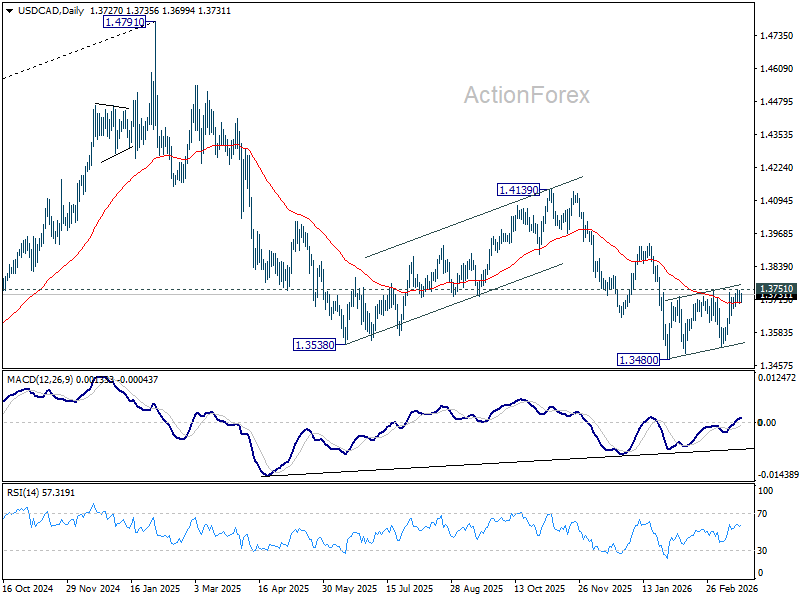
In the bigger picture, price actions from 1.4791 are seen as a corrective pattern to the whole up trend from 1.2005 (2021 low). Deeper fall could be seen, as the pattern extends, to 61.8% retracement of 1.2005 to 1.4791 at 1.3069. However, break of 1.3927 resistance will argue that the correction has completed with three waves down to 1.3480 already.
Narrative Changes Hands
We woke up to another rough week this morning after a weekend that failed to ease tensions in the Middle East. On the contrary, US President Donald Trump gave an ultimatum to Iran to reopen the Strait of Hormuz within 48 hours, otherwise he would “obliterate their power plants.” Iran responded by warning that it would target the region’s energy and desalination infrastructure—and we already had a preview of what that could look like last week.
Iranians appear more resilient than US and Israeli calculations had assumed, and there are growing warnings that this “operation” could turn into something bigger.
One interesting shift: markets are reacting less to Trump’s announcements—tweets and interviews alike—as the US is increasingly isolated in this conflict, with Western allies reluctant to step in. At the same time, the narrative is no longer fully in Washington’s hands, with Iran now shaping expectations and narrative on the ground. TACO hopes are fading.
Oil prices are higher this morning as risks build that regional energy infrastructure could suffer further damage, potentially triggering a larger and more prolonged energy shock. IEA’s Fatih Birol warned last week that this conflict could be the “greatest threat to global energy in history”—which can also be read as a reminder of the urgency to accelerate alternative energy efforts.
US crude started the week above $100 per barrel before easing slightly. Brent crude followed a similar path, jumping to $114pb before retreating toward $112pb. The relatively muted reaction compared to last week’s open suggests that: 1) markets are no longer pricing a quick resolution to the conflict, 2) the US is taking unusual steps such as easing constraints on some Iranian and Russian oil flows, and 3) higher oil prices are feeding into inflation expectations, pushing central bank bets in a more hawkish direction and raising stagflation risks.
In other words, slower global growth expectations could eventually temper demand. Recent price action suggests that the market is increasingly pricing an energy-shock-led slowdown as prices approach $120 per barrel—a level that may act as a near-term ceiling.
You may also ask: $120 for which crude? Because we are also seeing a growing divergence between WTI crude oil and Brent crude. These benchmarks reflect different markets: WTI is more US.-focused, while Brent is seaborne and far more exposed to global flows and geopolitical risks, especially tensions in the Middle East. As a result, when international risks rise, Brent tends to move higher, while WTI remains more anchored to domestic dynamics, widening the gap. In theory, arbitrage should bring them closer over time—but in practice, transport costs and export constraints mean the spread can persist for longer.
All that said, the medium-term outlook remains highly uncertain and markets are reacting. Nikkei futures are down more than 3% at the time of writing, China’s CSI 300 is off nearly 3%, and Korea’s Kospi is down over 6%. US and European futures also point to further losses at the open, while government bond yields are rising on two fronts: 1) higher short-term inflation risks, and 2) increased long-term fiscal pressures linked to military spending. The Trump administration has reportedly requested $200 billion from Congress to fund the Iran operation, adding to concerns after US debt surpassed $39 trillion.
As such, the US 10-year yield is pushing above 4.40%, its highest level since last summer. European moves are even more striking, with German and French 10-year yields at their highest since 2011, and the UK 10-year gilt yield nearing 5%—a level last seen in 2008—on speculation that the Bank of England (BoE) may need to shift from rate cuts to hikes to counter another energy-driven inflation shock. UK inflation update later this week will likely confirm that both headline and core CPI stand around 3% - above the BoE’s 2% target – and these figures reflect February prices – that was before energy prices spiked with the Middle East blast.
Rising rate expectations in Europe are not supporting the euro or sterling against a broadly stronger US dollar, as weaker growth expectations are currently outweighing rate differentials. That dynamic could shift later, but for now the dollar is benefiting from the geopolitical backdrop, alongside energy and defense stocks.
Gold, meanwhile, has not attracted the usual safe-haven inflows. A stronger dollar, rising global yields and the prior rally in gold prices are all weighing on demand. Gold has dropped to $1’358 per ounce this morning, below its 200-day moving average for the first time since last summer. The selloff could deepen if the dollar continues to strengthen and yields remain elevated, increasing the opportunity cost of holding non-yielding assets.
From a technical perspective, gold has entered a medium-term bearish consolidation below $1’610 per ounce—the 38.2% Fibonacci retracement of last year’s rally. A break below $1’335 could signal a deeper correction and potentially mark the end of the latest upward leg.
Trump Sets 48-Hour Deadline for Iran to Reopen Hormuz
In focus today
- In the euro area, the flash consumer confidence indicator for March is released, which will shed a first light on how consumer sentiment has reacted to the war in Iran and subsequent energy price increases.
- In Japan, February inflation is set to be released overnight. Fuel subsidies and subsiding food inflation has pulled inflation lower recently, with Bank of Japan's preferred measure, CPI excl. fresh food, at 2.0% in January for the first time in two years. This trend will also be reflected in February data, but what matters now is the occurring loss of purchasing power as energy prices surge and imports become pricier amid yen weakening. A Bank of Japan rate hike is on the cards, and we expect it to come in April.
- The key market events this week are tomorrow's March PMIs for the euro area, UK, and US, and Thursday's Norges Bank meeting. We expect a hold at 4%, consistent with signals at the rate meetings in December and January. On Wednesday, Riksbank minutes from Sweden will be released. Developments in the Middle East will naturally remain central.
Economic and market news
What happened over the weekend
In the Middle East, geopolitical tensions are intensifying as 'Operation Epic Fury' enters its fourth week, with ongoing airstrikes in Tehran this morning. Late on Saturday, Trump threatened to "obliterate" Iran's power plants within 48 hours if the Strait of Hormuz remains closed, while Iran has vowed counterattacks on US infrastructure across the region. An attempted strike on the US-UK base in Diego Garcia has sparked concerns over Tehran's long-range missile capabilities. On Friday, the US issued a 30-day waiver for the sale of Iranian oil loaded on vessels into the US, while Iraq declared force majeure on foreign-developed oil fields.
Oil prices were about unchanged at the market open compared to the close on Friday with Brent crude trading above USD110/bbl.
In central bank space, last week's packed meeting calendar was followed by mixed comments from policymakers. From the ECB, President Lagarde struck a balanced tone, likely reflecting divisions within the Governing Council. While Nagel hinted at a potential rate hike in April if inflation risks increase, other members appeared more measured, signalling a calmer approach compared to 2022. From the Fed, Governor Waller highlighted inflation concerns tied to oil shocks, suggesting caution is needed despite earlier dovish stances.
Equities: The risk-off sentiment that took hold last week lingers this morning. Asian markets have opened sharply lower this morning with Kospi -6%, Hang Seng -4% and Nikkei 225 -3%. Investors are reacting to Trump's Truth Social post over weekend, where he threatened to strike Iranian power infrastructure unless the Strait of Hormuz is fully opened within 48 hours.
The escalation puts investors in a difficult spot. Unlike the destruction of Nord Stream in 2022, which imposed a lasting constraint, this episode has, until now, looked more transitory. However, if energy infrastructure is hit, the shock risks turning permanent. This explains the negative reaction in Asia this morning. However, conversely, if the US can take control of the strait, it would be taken as risk positive. For the moment, investors are left guessing.
Many major equity benchmarks slipped into correction territory last week. Japan, Europe, emerging markets and Sweden all down at least 10%, while the US is only about 5% lower. For global portfolios, that US resilience is a relief. However, for investors in Europe it removes a potential source of positioning support that might otherwise help a rebound. Our correction monitor is still not signalling oversold conditions. With neither positioning nor valuation providing a clear cushion - equities were expensive going into this - oil will continue to set the tone this week. However, we see the debate shifting more to growth and demand destruction than central bank repricing.
FI and FX: After NOK, the EUR was the best performing G10 currency last week - a surprising feat since the pressure on energy prices remained high. Speculation in an ECB hike already at the next meeting in April has sent EUR interest rates higher and kept the EUR well supported. US yields started grinding higher last week and the market started to have second thoughts on whether the Fed would cut this year. Energy markets will likely continue to set the tone for FX and FI markets this week.