Sample Category Title
EUR/GBP Weekly Outlook
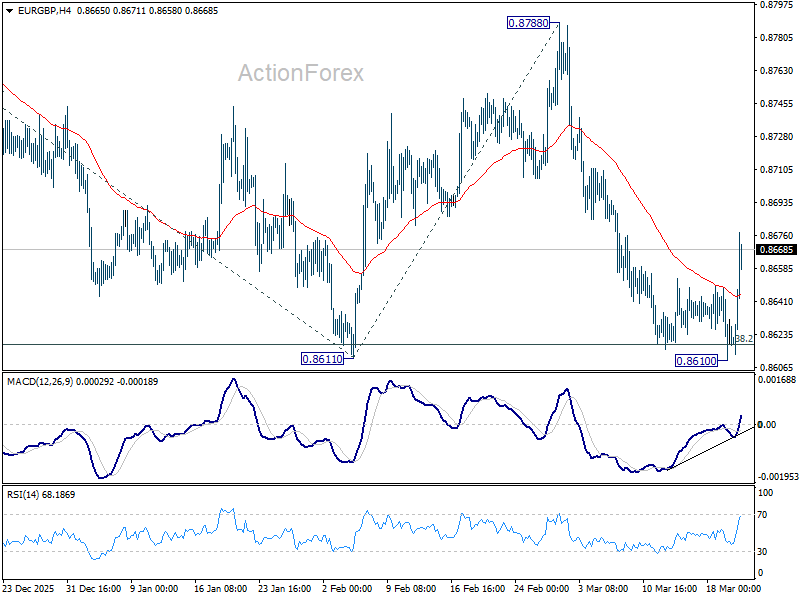
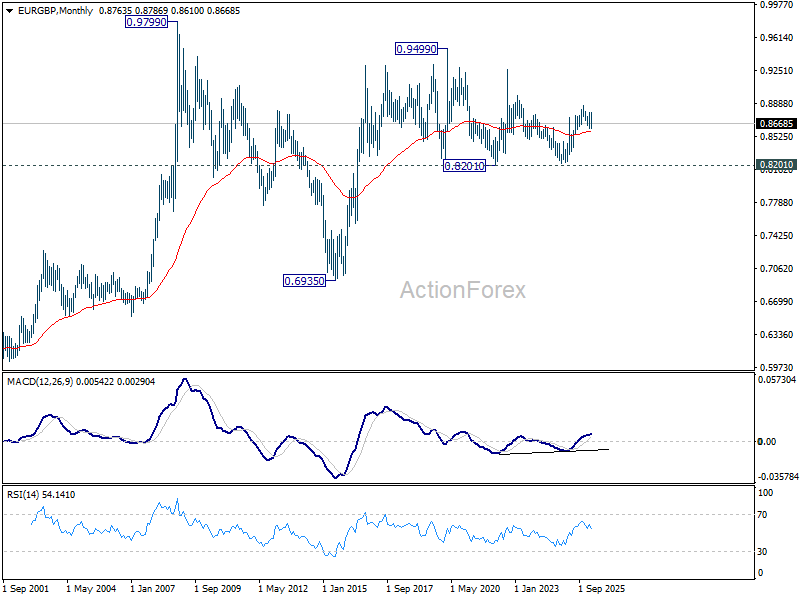
EUR/GBP edged lower to 0.8610 last week but rebounded notably since then. Initial bias remains neutral this week first. on the downside, firm break of 0.8611 will resume the whole fall from 0.8863 to 100% projection of 0.8863 to 0.8611 from 0.8788 at 0.8536. However, sustained break above 55 D EMA (now at 0.8685) will turn bias back to the upside for 0.8788 resistance instead.
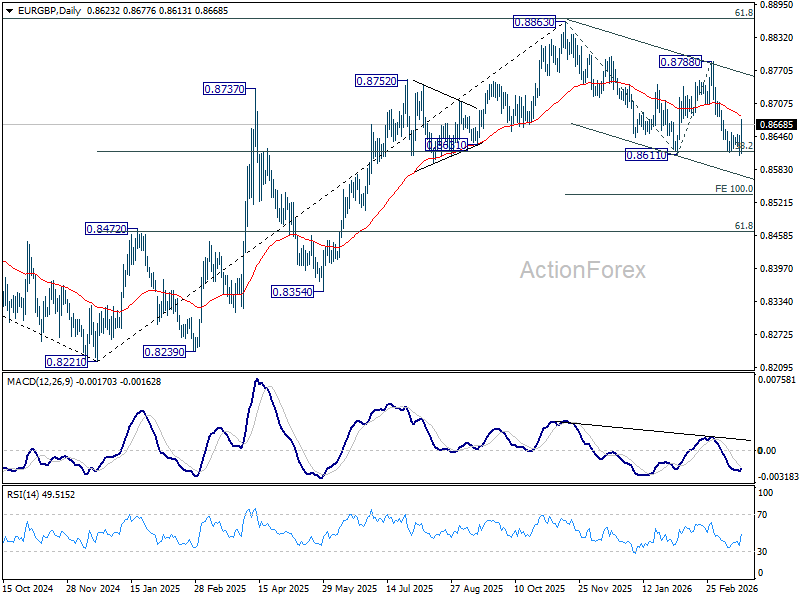
In the bigger picture, current development revived the case that whole rise from 0.8221 (2024 low) has completed at 0.8863, after rejection by 61.8% retracement of 0.9267 (2022 high) to 0.8221 at 0.8867. Sustained trading below 38.2% retracement of 0.8821 to 0.8863 at 0.8618 will confirm this case, and bring deeper fall to 61.8% retracement at 0.8466 at least. For now, medium term outlook is neutral at best as long as 0.8863 resistance holds.
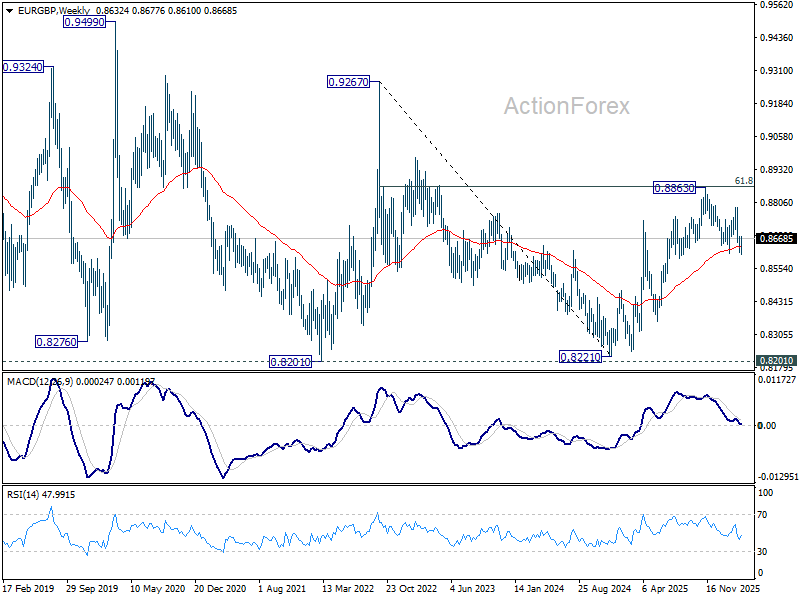
In the long term picture, price action from 0.9499 (2020 high) is seen as part of the long term range pattern from 0.9799 (2008 high). Range trading should continue between 0.8201 and 0.9499, until there is clear signal of imminent breakout.
EUR/AUD Weekly Outlook
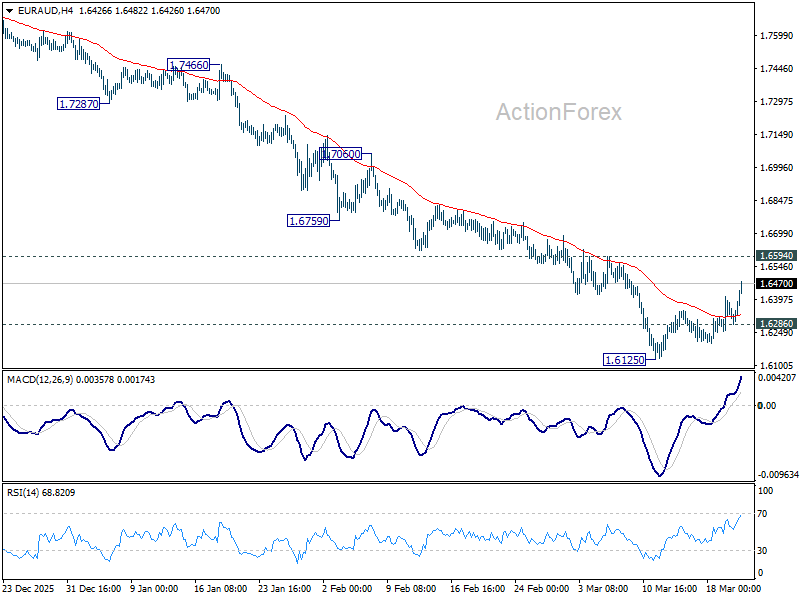
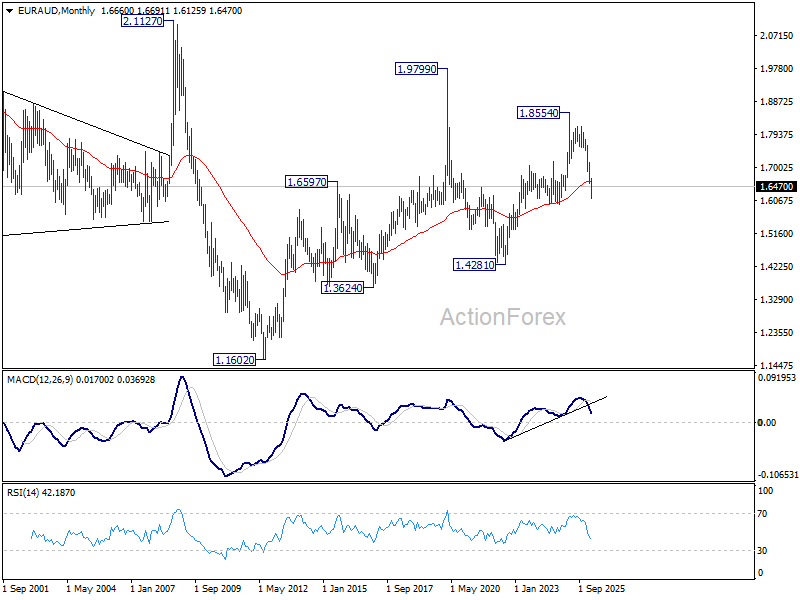
EUR/AUD recovered last week but upside is kept below 1.6594 resistance. Initial bias remains neutral this week first, and further decline remains in favor. Below 1.6286 will bring retest of 1.6125 low. Firm break there will resume larger fall from 1.8554 to 1.5913 fibonacci level next. Nevertheless, break of 1.6594 will indicate short term bottoming, and bring stronger rebound to 55 D EMA (now at 1.6776) and above.
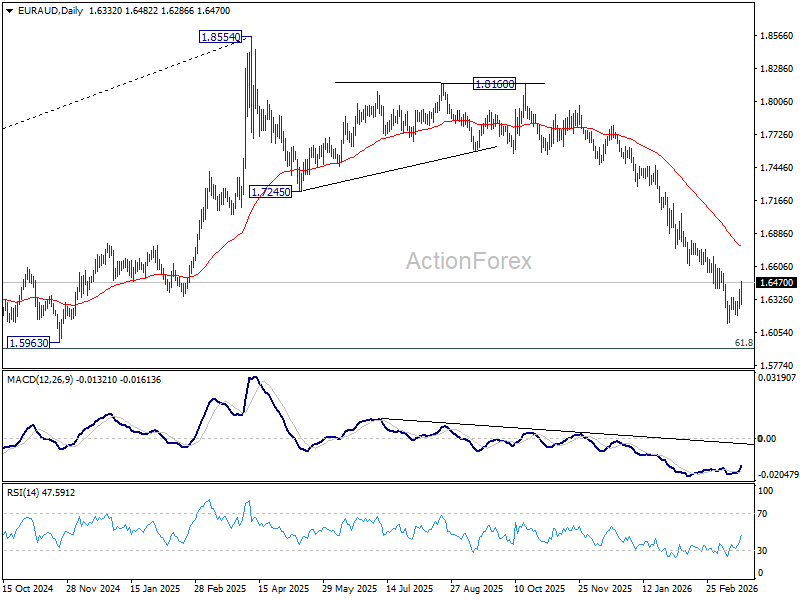
In the bigger picture, fall from 1.8554 medium term top is seen as reversing the whole up trend from 1.4281 (2022 low). Deeper decline should be seen to 61.8% retracement of 1.4281 to 1.8554 at 1.5913, which is slightly below 1.5963 structural support. Decisive break there will pave the way back to 1.4281. For now, risk will stay on the downside as long as 55 W EMA (now at 1.7245) holds, even in case of strong rebound.
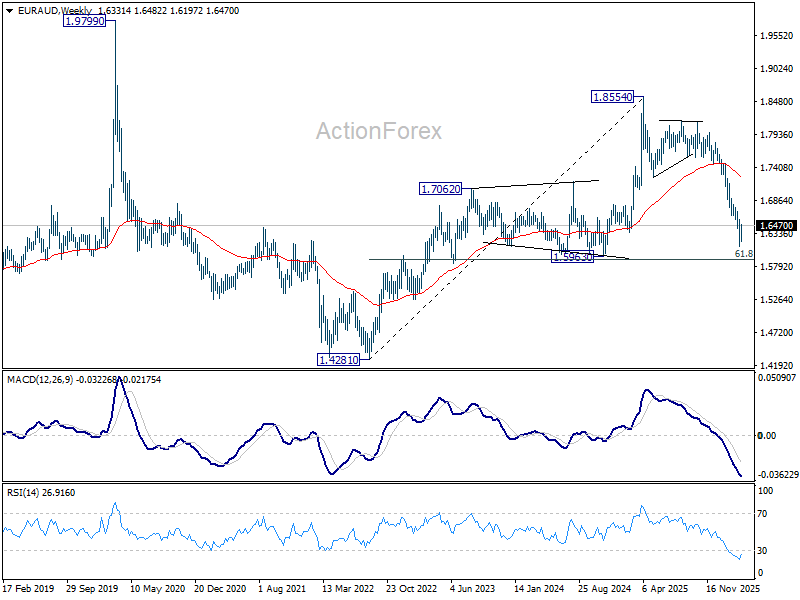
In the longer term picture, rise from 1.4281 is seen as the second leg of the pattern from 1.9799 (2020 high), which is part of the pattern from 2.1127 (2008 high). Current development argue that it has already completed at 1.8554. Sustained trading below 55 M EMA (now at 1.6592) will confirm this bearish case, and pave the way back towards 1.4281.
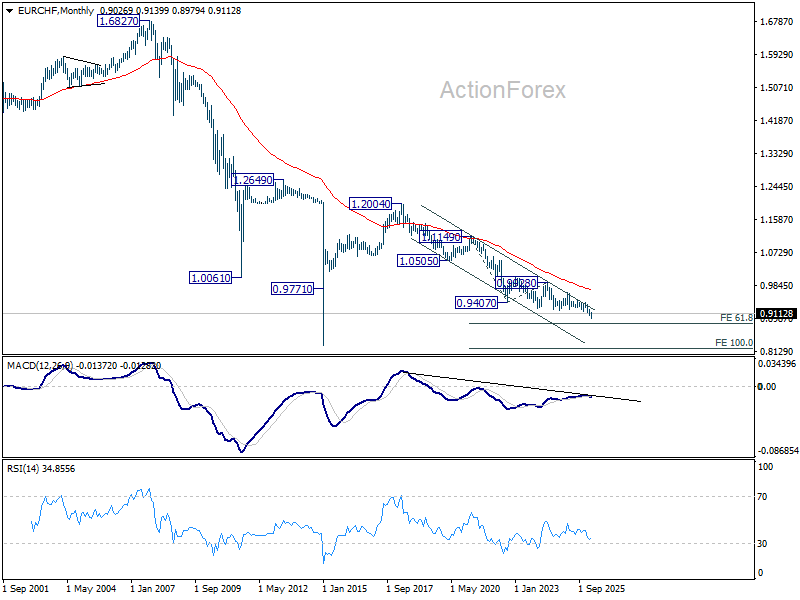
EUR/CHF Weekly Outlook
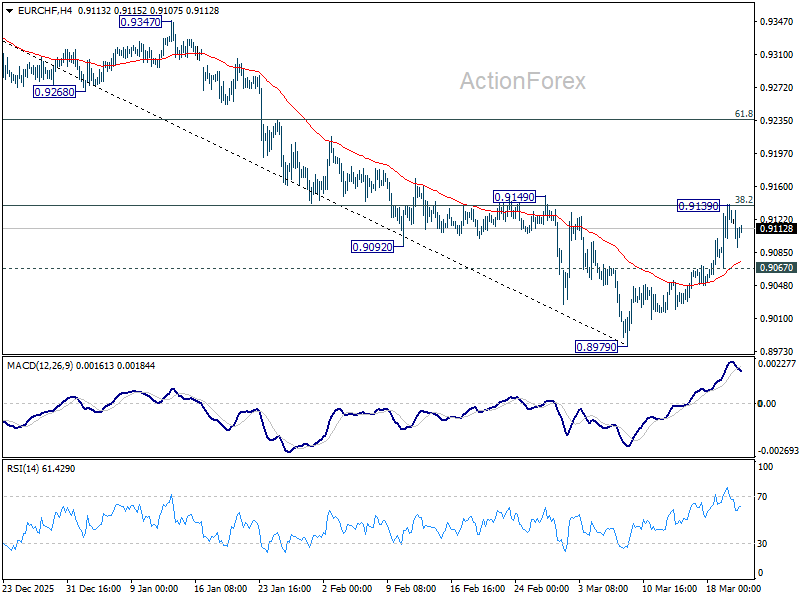
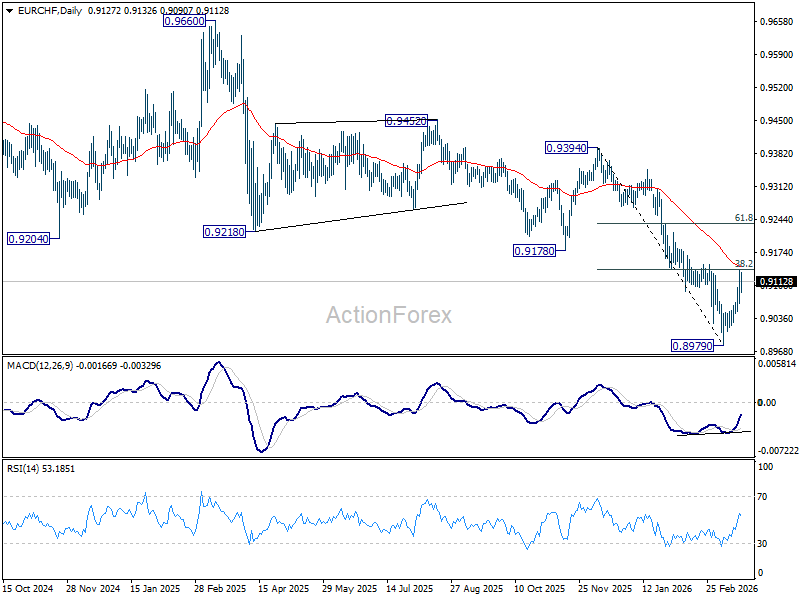
EUR/CHF's extended rebound last week confirms short term bottoming 0.8979. But a temporary top was formed after hitting 38.2% retracement of 0.9394 to 0.8979 at 0.9138. Initial bias is turned neutral this week first. On the upside, firm break of 0.9138/9 will target 61.8% retracement at 0.9235. On the downside, below 0.9067 minor support will turn intraday bias back to the downside for retesting 0.8979 low instead.
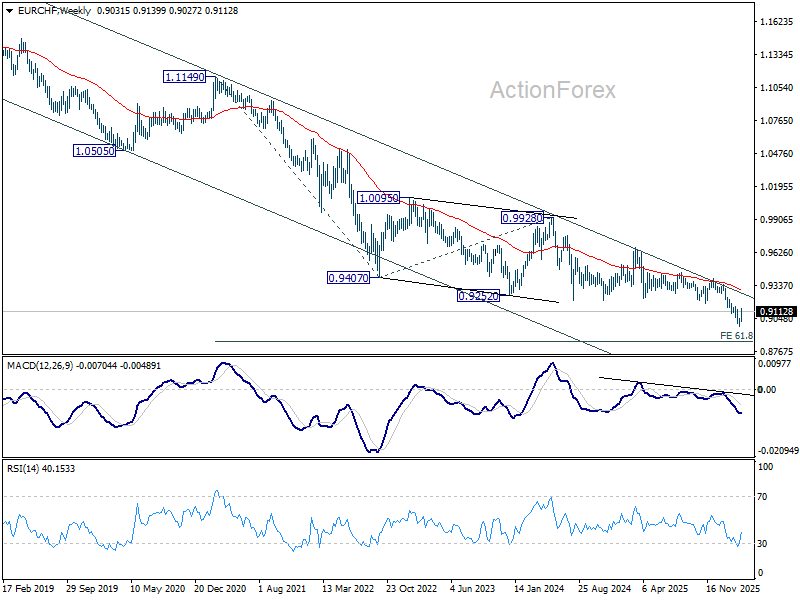
In the bigger picture, down trend from 0.9928 (2024 high) is still in progress. Next target is 61.8% projection of 1.1149 to 0.9407 from 0.9928 at 0.8851. Outlook will stay bearish as long as 0.9394 resistance holds, in case of rebound.
In the long term picture, EUR/CHF is holding well inside long term falling trend channel. Down trend from 1.2004 (2018 high) is still in progress. Outlook will continue to stay bearish as long as falling 55 M EMA (now at 0.9711) holds.
Dollar Slides as ECB Out-Hawks Fed Amid Oil Shock and Rising Inflation Risks
Dollar had every reason to rally last week, but instead ended as the worst performer among major currencies. Sharp selloff in global equities, surging Treasury yields, and escalating geopolitical risks would typically trigger strong safe-haven demand for the greenback. Yet, that relationship broke down.
The key driver behind this anomaly is the growing divergence in central bank expectations. Markets are increasingly pricing that some major central banks, particularly ECB, will turn more aggressive in tackling inflation, even as Fed remains relatively cautious. This shift came into focus following last week’s central bank "marathon", where policymakers effectively revealed how they intend to handle the energy-driven inflation shock.
As a result, policy divergence—not risk sentiment—dominated the FX markets. Euro was among the strongest performers, supported by rapidly rising expectations of ECB tightening. Sterling also held firm, with markets pricing in a meaningful probability of further tightening from BoE as energy-driven inflation risks build. In contrast, Dollar lagged as Fed’s “hawkish wait” stance failed to match the tightening momentum seen elsewhere.
Looking ahead, the key question is whether policy divergence will continue to dominate. As long as oil prices remain elevated and inflation risks persist, markets are likely to keep pricing tighter policy paths for ECB and BoE relative to Fed. This dynamic should continue to weigh on Dollar and support relative strength in European currencies. However, this pattern is not unconditional. A more extreme escalation in geopolitical tensions—triggering a liquidity shock or “peak fear” event—could restore Dollar’s safe-haven appeal.
Risk-Off Deepens as Equities Slide and Yields Break Higher
Risk aversion intensified further last week as global equity markets extended their selloff. DOW fell -2.1% to close at 45,577.47, bringing it closer to the key 45k medium-term support level. S&P 500 and NASDAQ also declined -1.9% and -2.1% respectively, with both indices confirming downside breakouts that signal a broader corrective phase.
At the same time, Treasury yields surged, with US 10-year yield breaking decisively above the 4.3 resistance level and moving toward the 4.4–4.5 zone. This move reflects a sharp repricing of inflation risks and expectations that central banks will maintain restrictive policies for longer.
Other asset classes reinforced the risk-off environment. Gold tumbled more than -10% to close below 4,500 level, driven by a combination of hawkish policy signals and forced liquidation dynamics. Meanwhile, Brent crude remained elevated above 110 after briefly spiking near 120, underscoring the persistent inflationary impulse from energy markets. In currencies, however, the pattern diverged sharply from expectations, with Dollar lagging while Euro outperformed.
Iran War Escalation Locks in Energy Shock as Oil Holds Elevated with Upside Risk
The Iran war has escalated into a sustained energy disruption, with both sides expanding the scope of attacks to critical infrastructure and strategic assets. Iran’s missile strikes on the U.S. Diego Garcia base mark a significant geographic expansion, while continued Israeli strikes on Iranian energy facilities signal a deliberate move to target economic lifelines rather than just military positions.
Retaliation has increasingly focused on energy supply chains. Iranian-linked strikes have disrupted LNG exports in Qatar, knocking out a meaningful portion of capacity, with estimates suggesting multi-year recovery timelines. At the same time, Iran's threats of broader asymmetric attacks reinforced the view that the conflict is unlikely to be contained quickly.
The Strait of Hormuz remains effectively constrained. While not fully closed in a formal sense, the combination of missile threats, drones, and naval disruption has sharply reduced safe passage. According to a mid-March 2026 Defense Intelligence Agency (DIA) assessment, the strait could remain functionally closed for anywhere between one to six months. This timeframe alone is sufficient to embed a prolonged supply shock into global markets, regardless of whether hostilities intensify further.
Oil markets have responded with a sustained risk premium. Brent’s move toward 120 and stabilization above 110 reflects ongoing supply concerns, while the widening spread with WTI underscores the uneven global impact. With no credible path to de-escalation and infrastructure damage likely to take years to repair, the bias remains toward sustained elevation in oil prices, with risks skewed toward further upside if the conflict escalates again. While a surge toward 200 remains a distant scenario, a firm break above 120 would likely pave the way toward 160.
ECB: Inflation Shock Already Beyond Baseline Projections, Forcing Tightening
ECB delivered the most consequential shift of last week’s seven major central bank meetings, not through a rate move, but via its updated inflation projections. By holding the deposit rate at 2.00% while sharply revising its outlook, the central bank effectively acknowledged that the inflation environment has shifted into a more dangerous phase.
In a rare move, ECB staff incorporated data up to March 11 into their projections—a significantly later cutoff than usual. This decision was critical. It showed that policymakers were not “looking through” the recent energy spike as a temporary distortion, but were instead treating it as a structural threat to price stability.
The projections themselves were built around three energy paths, but the baseline immediately revealed a disconnect. It assumes oil peaks at 90, producing inflation of 2.6% in 2026 (an upgrade from 1.9% in December forecast). That assumption has already been overtaken by events, with Brent holding firmly between 100 and 120.
This shifts attention squarely to the adverse scenario. Under that framework, inflation rises to around 3.5% in 2026 and remains elevated for longer, while growth weakens further. Crucially, this is no longer a tail risk—it closely resembles current market conditions.
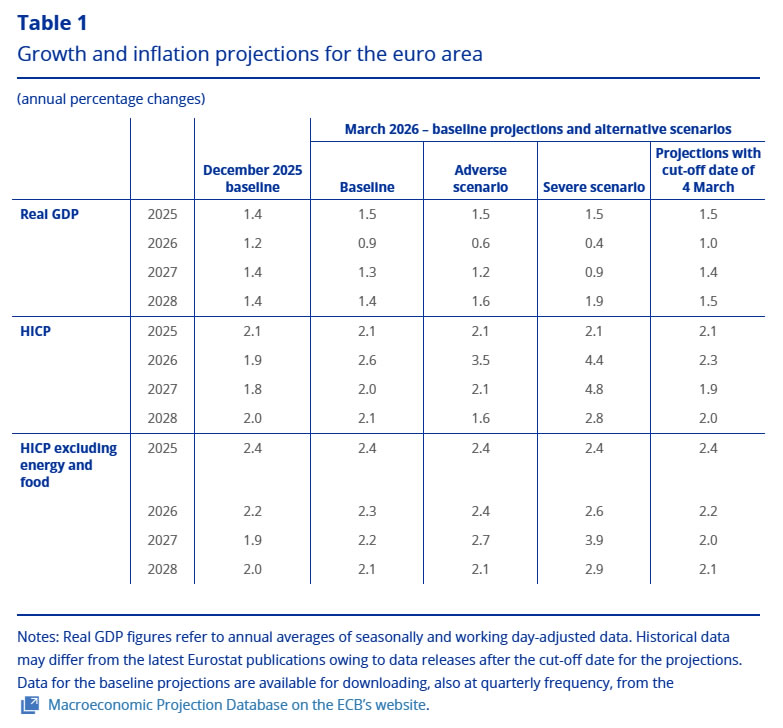
The implication is that ECB’s baseline is no longer the central case for markets. Instead, the “adverse” scenario has effectively become the working assumption. As long as energy prices remain elevated, the risk of second-round effects through wages and services increases materially, making it difficult for inflation to return to target.
That leaves ECB in a tightening position whether it formally acknowledges it or not. What is framed as conditional action is increasingly being interpreted as inevitable. In effect, ECB has entered a “forced tightening” phase, where policy will have to respond to inflation dynamics that are already unfolding.
Fed Holds Hawkish Wait as ECB Out-Hawks on Asymmetric Energy Shock
A key shift in last week’s macro landscape is the emergence of ECB “out-hawking” the Fed. This divergence is being driven by the asymmetric impact of the Iran war, which has forced ECB to respond to a direct inflation shock, while Fed remains in a more measured, wait-and-see stance.
Fed’s latest dot plot highlights this contrast. Despite the escalation in geopolitical tensions and higher energy prices, the median projection still points to one 25bps rate cut by the end of 2026, targeting a range of 3.25%–3.50%. While inflation forecasts were revised higher, with PCE seen at 2.7%, the adjustment was modest, signaling that policymakers do not yet see the need for a more aggressive response.
The underlying reason lies in structural differences. The U.S., as a net energy exporter, is partially insulated from the supply shock. Higher oil prices weigh on consumers, but they also support domestic production and investment, offsetting some of the drag. This contrasts sharply with Europe, where higher energy costs feed directly into inflation without a corresponding economic benefit.
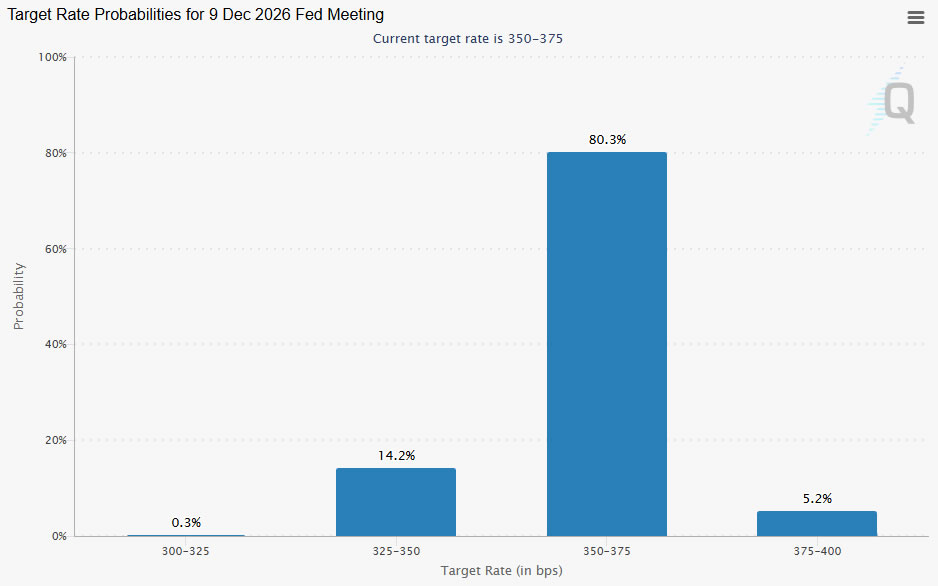
Market pricing reflects this dynamic. Expectations for a June rate cut have largely been removed, but there is little conviction around tightening. For December, markets assign around an 80% probability that rates remain unchanged at 3.50%–3.75%, indicating that the base case is for policy to stay restrictive for longer rather than shift higher.
In essence, Fed is in a “hawkish wait,” acknowledging inflation risks but holding back from immediate action. In contrast, markets increasingly view ECB as entering a “forced tightening” phase.
Inflation Shock Drives Yields Higher and Stocks Lower, Dollar Outlook Still Uncertain
Technical developments across key markets are reinforcing the shift toward rising inflation risks and tighter global financial conditions. With equities under pressure, yields breaking higher, and oil revisiting a key breakout level, the broader picture points to further stress ahead.
DOW
DOW’s extended decline last week continues to align with the view that the fall from 50,512.79 is still unfolding, with price now approaching a critical support zone around the 45k handle. This zone includes the 38.2% retracement of 36,611.78 to 50,512.79 at 45,202.26, as well as the 2024 peak at 45,071.29.
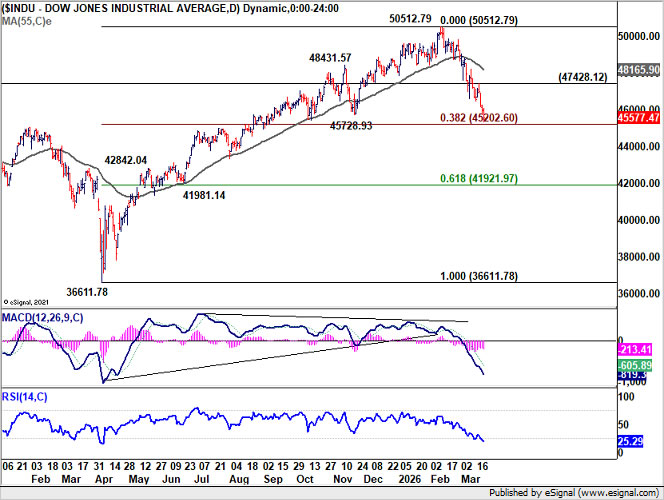
A strong rebound from this region, followed by a break above 47,428.12, would suggest that selling pressure has reached a near-term climax. Such a development would open the way for a recovery toward the 55 D EMA (now at 48,165.90) and potentially higher.
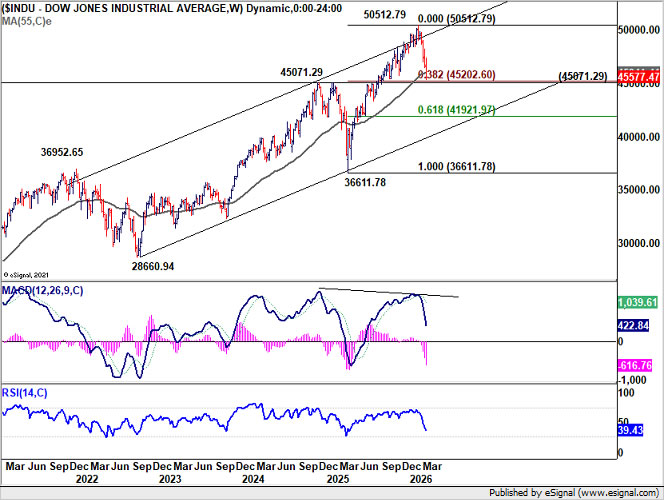
However, sustained break below 45k would signal a more significant shift, suggesting that the broader uptrend from 36,611.78 (2025 low) is reversing rather than correcting. In that case, downside targets would extend to the 61.8% retracement at 41,921.97, with further risk toward the multi-year channel floor around 40k.
10-Year Yield
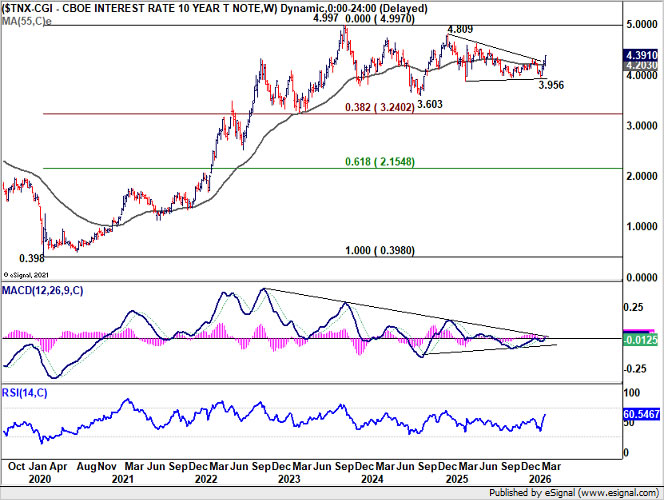
The 10-year Treasury yield’s rally from 3.965 accelerated last week, breaking decisively above the key 4.311 structural resistance level. This move suggests that the prior consolidation from the 4.809 (2025 high) has likely completed as a converging triangle, with five waves ending at 3.956.
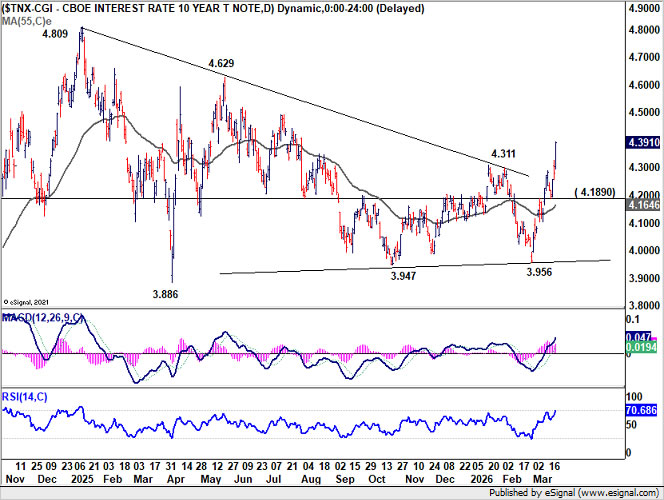
As long as 4.189 support holds, further upside is expected in the near term. The next key target is the 4.629 resistance zone.
Dollar Index
Dollar Index retreated last week but continues to hold above the 98.49 support level. While further rally remains possible, upside is likely to face strong resistance around 38.2% retracement of 110.17 to 99.55 at 101.13.
A break below 98.49 would suggest that the recovery from 95.55 has already completed, bringing a retest of that low into focus and keeping the medium-term outlook bearish.
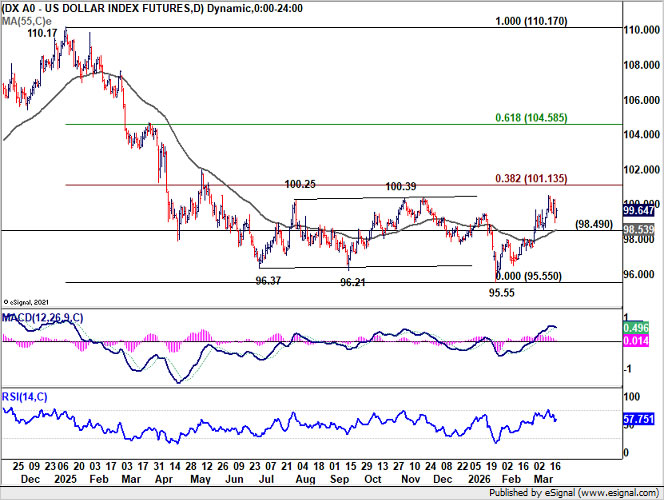
On the upside, however, sustained break above 101.13 would open the path toward 61.8% retracement at 104.58. Such a move would signal a more meaningful bullish reversal, marking the end of the broader downtrend from 110.17 (2025 high) or even 114.77 (2022 high).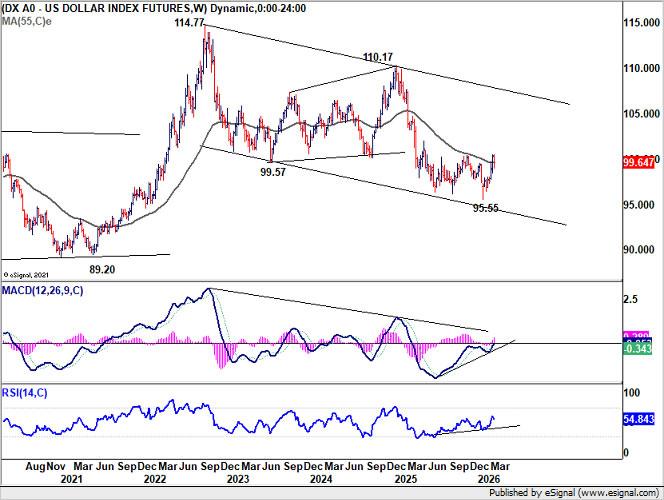
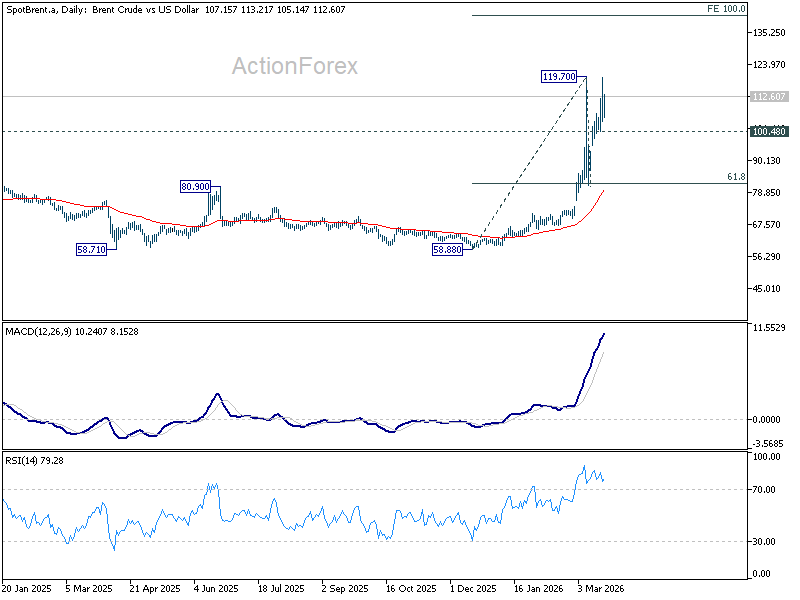
Brent Crude
For Brent crude, the key question is whether the 120 psychological level will cap further gains. A break below 100.48 support would indicate that the rebound from 81.41 has already completed, with the corrective pattern from 119.70 entering a third leg lower toward 81.41 support.
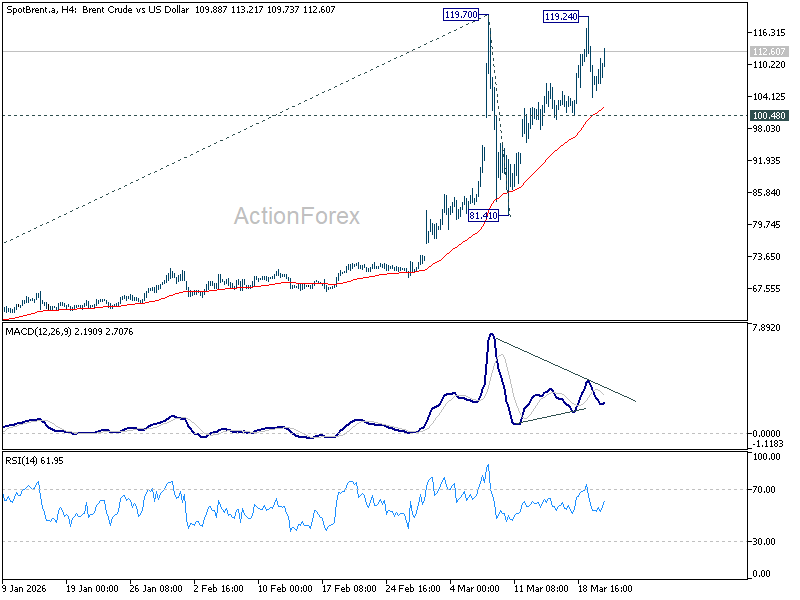
However, decisive break above 120 would signal resumption of the long-term uptrend. In that case, the next target would be the 100% projection of 58.88 to 119.70 from 81.41 at 142.43.
Near-term bias remains to the upside as long as 100.48 holds, with risks skewed toward a breakout given the ongoing supply shock and elevated geopolitical premium.
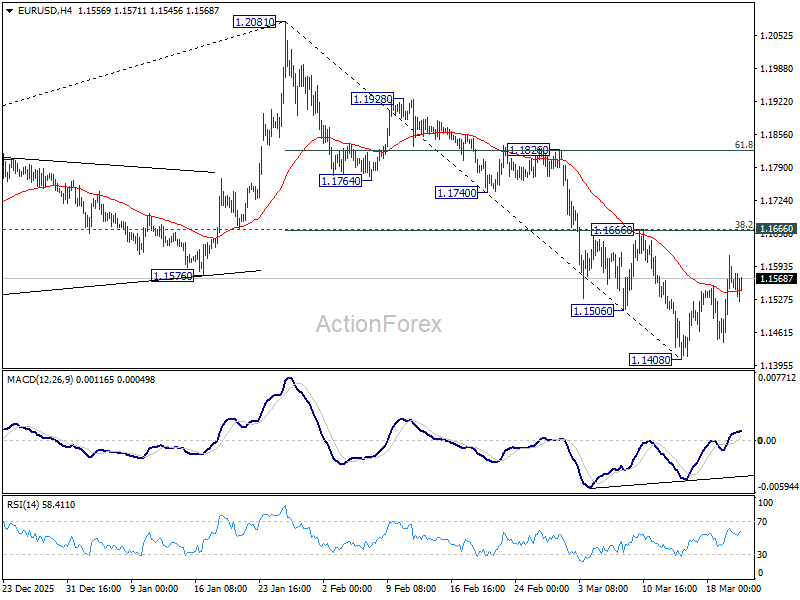
EUR/USD Weekly Outlook
EUR/USD recovered last week but upside is capped below 1.1666 cluster resistance (38.2% retracement of 1.2081 to 1.1408 at 1.1665). Initial bias remains neutral this week, and further decline is in favor. On the downside, below 1.1408 will resume the fall from 1.2081 to 38.2% retracement of 1.0176 to 1.2081 at 1.1353. However, decisive break of 1.1666 will argue that the fall from 1.2081 has completed, and turn bias back to the upside for 61.8% retracement of 1.2081 to 1.1408 at 1.1824.
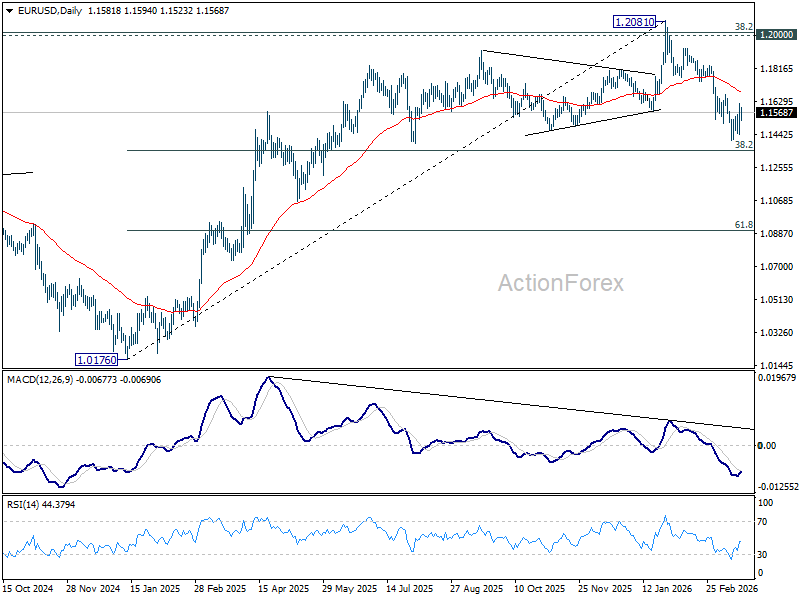
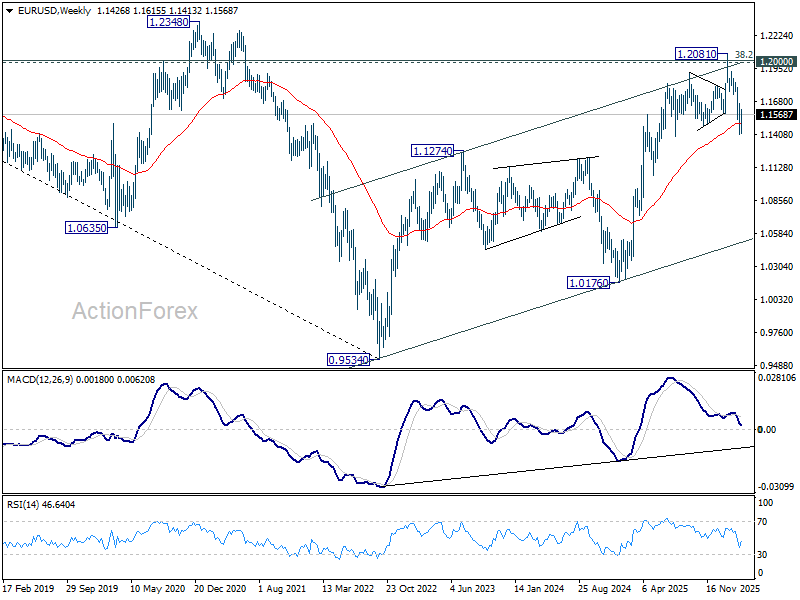
In the bigger picture, prior break of 55 W EMA (now at 1.1495) should confirm rejection by 1.2 key cluster resistance level. The whole up trend from 0.9534 (2022 low) might have completed as a three wave corrective rise too. Deeper fall is expected to long term channel support (now at 1.0528). Meanwhile, risk will stay on the downside as long as 1.2081 holds, even in case of strong rebound.
In the long term picture, 38.2% retracement of 1.6039 to 0.9534 at 1.2019, which is close to 1.2000 psychological level is the key for the outlook. Rejection by this level will keep the multi decade down trend from 1.6039 (2008 high) intact, and keep outlook neutral at best. However, decisive break of 1.2000/19, will suggest long term bullish trend reversal, and target 61.8% retracement at 1.3554.

Farewell, Rate Cuts – Markets Weekly Outlook
- Discover our Weekly Market Outlook, exploring themes and events that forged financial flows throughout the week.
- Large repricings changed the Market picture after the FOMC and major Central bank week.
- Get ready for next week's action by exploring upcoming events across global Markets.
Week in review – A new Market order
After all these talks throughout the beginning of the year about a New World Order, what fundamentally changed was the actual shift in Market pricing, which came progressively since the late January FOMC and kept looming over investors until this fateful week.
This week marked a new turn in Central Banking, with not less than 8 rate decisions across Majors, including the Bank of Japan, Bank of England, Royal Bank of Australia, the People's Bank of China, the Federal Reserve, Bank of Canada, the Swiss National Bank, and the European Central Bank.
The verdict? Only one actual change: A rate hike for the RBA.
But the true verdict was the swift repricing for hikes all around the globe, which brought headwinds to virtually all asset classes. Add to it longer expectations for the ongoing US-Iran-Israel War, and you get a spicy combo.
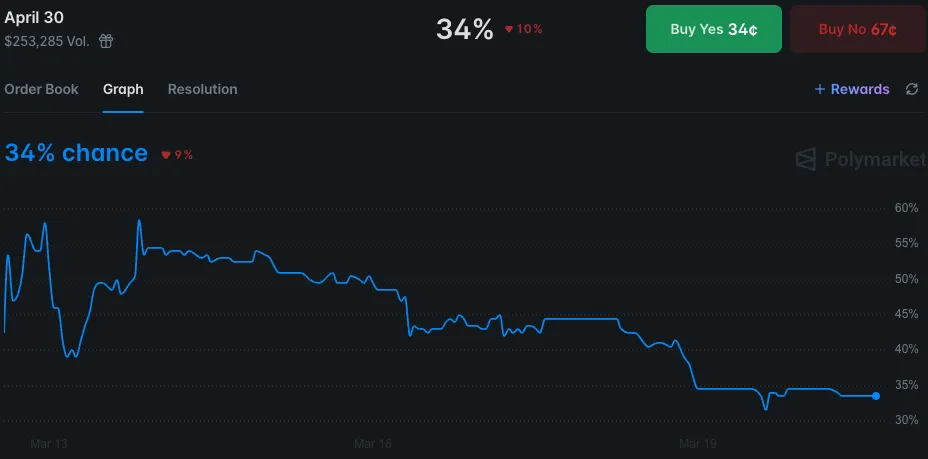
Prediction-Markets War Ending Date – Source: Polymarket – March 20, 2026
Neither Stocks, Metals, nor Bonds eat spicy, so they all puked. Global assets were only temporarily rejoicing in more optimistic hopes for the War just yesterday (Thursday 19th), but that faded quickly with President Trump's latest plan to occupy Iran's Kharg Island to apply pressure on Iran to stop blocking the Strait of Hormuz.
The idea shouldn't be too bad for Markets, but the issue here is that this would lengthen the Iran operations much longer.

Strait of Hormuz Traffic – Source: Hormuz Strait Monitor – March 20, 2026
Traffic is barely picking up after 20 days of conflict, and many large importers like Japan, India, and South Korea (including many others) are facing heavy pressure.
To learn more, I strongly invite you to check out this website – Some information is slightly outdated but explain the main factors affected by the de-facto closure with detail.
The largest Market visualization for such is the widening spreads between WTI (North American) and Brent (London) Crude.
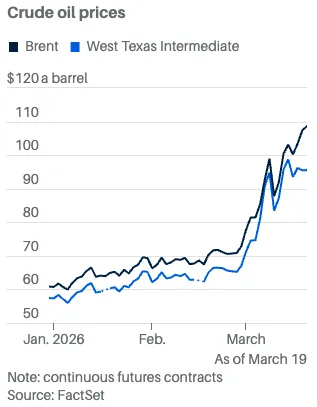
WTI vs Brent Spread – Source: Barron – March 20, 2026
After the FOMC Meeting, which was neither hawkish nor dovish all things considered, Fed Members have started to reappear, and their outlook isn't so bright. Fed's Waller really took a turn from his previously softer communications, insisting on the potential de-anchoring of inflation expectations if Oil prices remain so high. And rightfully so, as they've remained surprisingly stable since the beginning of March.
But Markets are ruthless, and with the turn in Central Bank communications, Gold, Bonds, and Stocks all took a significant hit. The two former got hit particularly hard, as the flight-to-safety not only failed to materialize but also backfired.
Weekly Performance across Asset Classes
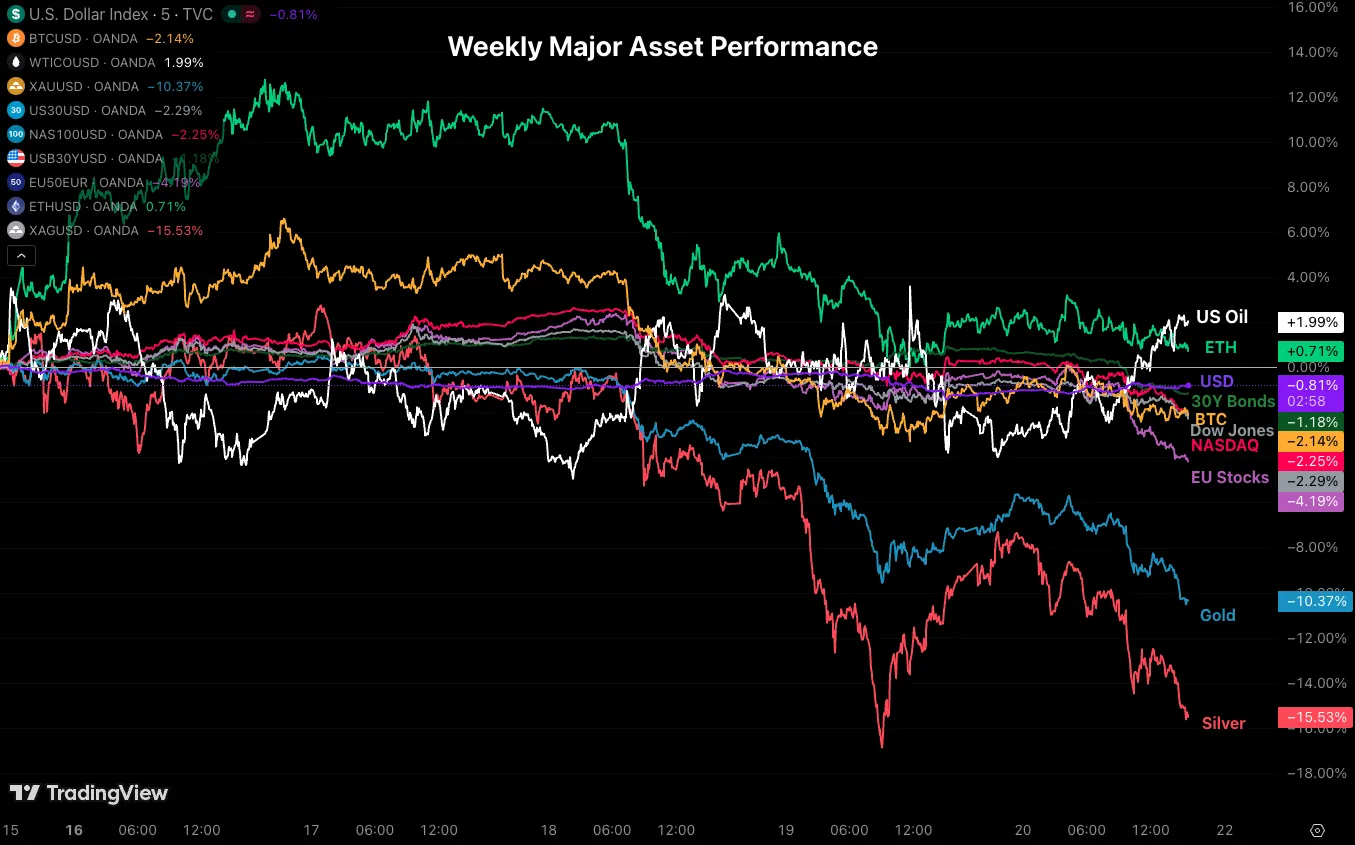
Weekly Asset Performance – March 20, 2026 – Source: TradingView
Metals were once again battered by the recent repricing across Central banks, putting a swift end to their year-long honeymoons.
This could actually be a good point to enter (slow and progressively) in case you missed the boat.
Gold and Silver could still easily retrace to their August levels ($3,500 and $40) so keep some bullets in case.
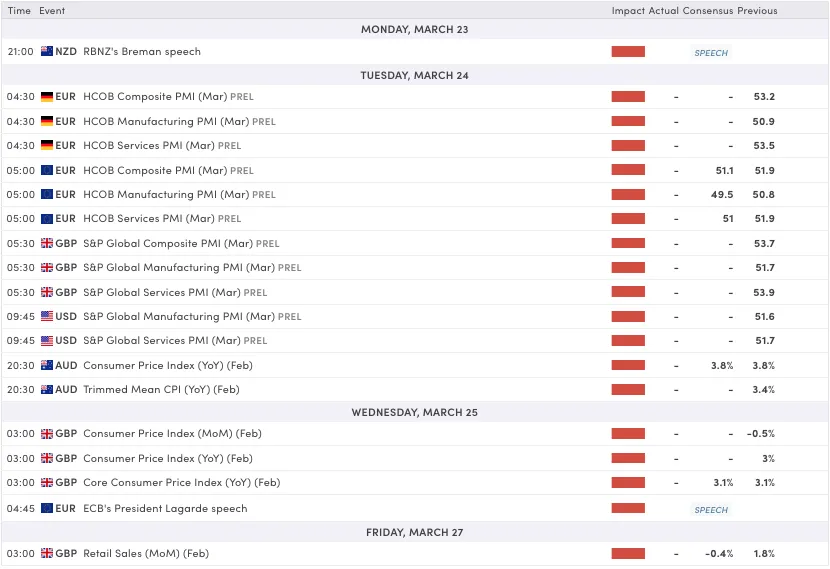
The Week Ahead – PMIs and Speeches
Next week will be calmer in terms of pure Central Banking, but Traders will still have to be attentive to the many Governor and CB Presidents speaking throughout next week, to get a better idea of who really turned the page on rate cuts and who didn't.
Asia Pacific Markets – Australian CPI
After this week's heavy Central Bank week for APAC Markets, things should be getting somewhat calmer, or at least more focused.
The pricing for the next Bank of Japan meeting is still uncertain, with a current 60% of hikes priced in – So traders will be paying close attention to the Japanese National CPI on Monday evening.
But Australia (and the AUD) will be taking the focus yet again. The RBA just hiked again to 4.10% this week and Tuesday's CPI should bring further clarity on upcoming decisions.
And don't forget RBNZ Governor Breman's speech on Monday.
Europe and UK Markets – Heavier focus on Europe and the UK
European Traders will await the streak of PMI releases on Tuesday, starting with France at 4:14 (ET), before Germany (4:30), The Eurozone (5:00) and the UK release at 5:30.
PMIs have moved Markets to a lesser extent as of late, but a hunch tells me that Markets will react much more to Economic growth releases in coming weeks, as it will be the final gauges for hikes.
The UK will come back at the center stage at on Wednesday with their CPI and PPI combo which will be definitely anchor (or delay) a potential BoE Rate Hike at the next meeting.
Retail Sales on Friday could also help to cement the decision.
For Euro traders, keep close attention to the thousands of speeches throughout next week.
North American Markets – Lighter week, with only PMIs for the US
The US will be back to the center stage, but without much to account for it.
Only US PMIs on Tuesday morning will provide economic clues for rate expectations. And as mentioned before, Economic performance data should become important again.
Of course, don't forget to check the classic Oil and US Dollar to help to find trades across Markets – Finally, pay close attention to Fed Speeches throughout next week to see where voters stand.
Those include Fed's Barr, Miran, Jefferson, Paulson and Logan.
Keep a close eye on geopolitical developments, particularly those involving the US-Iran war progess, as they are likely to continue influencing Commodity and broader Markets.
Next Week's High Tier Economic Events
For all market-moving economic releases and events, see the MarketPulse Economic Calendar. (High-tier data only)
March 20th Market Wrap
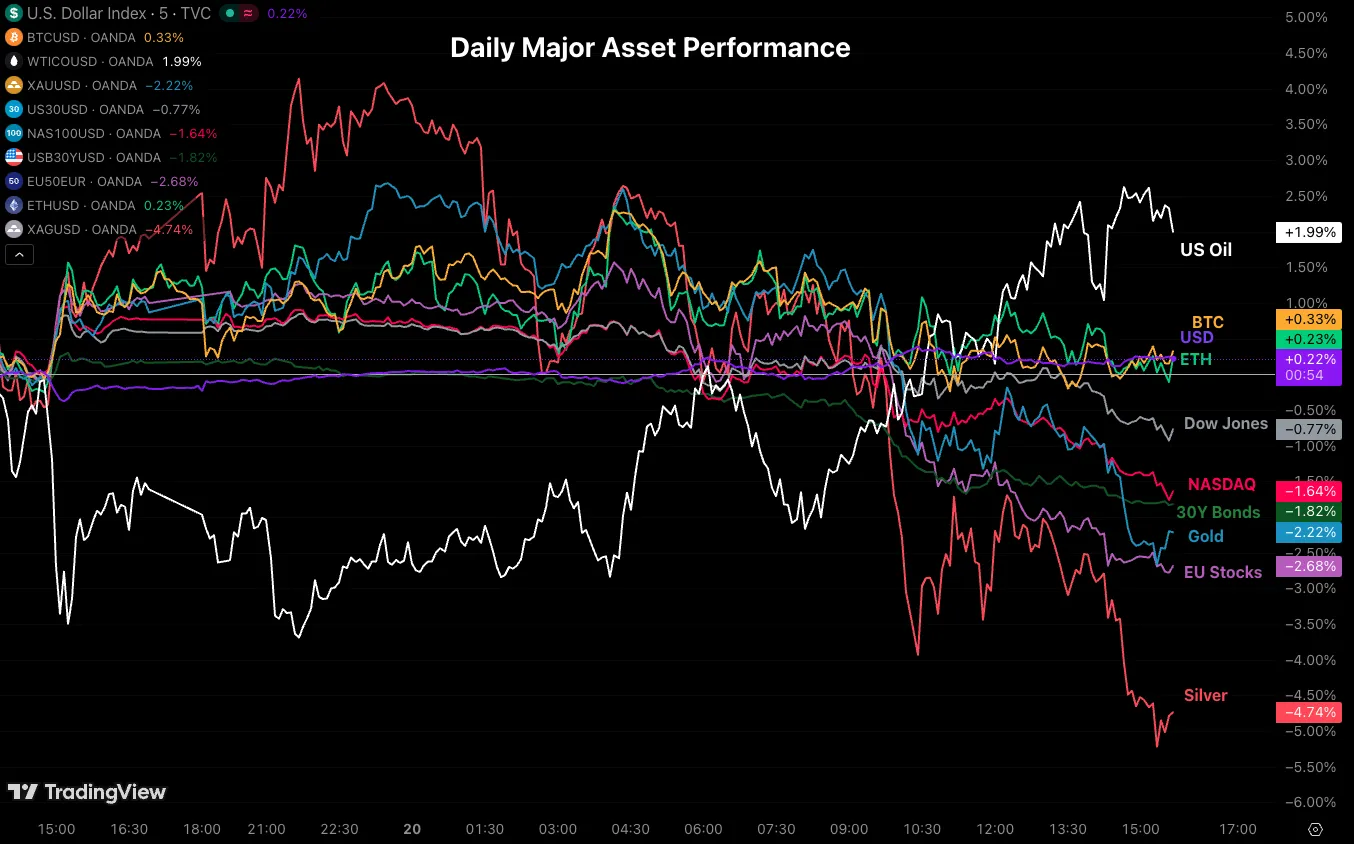
Cross-Asset Daily Performance, March 20, 2026 – Source: TradingView
Today marked another large shift in Markets, maybe the largest since the beginning of the Week, as traders pulled the plug on any hopes of cuts.
Metals, Bonds and Stocks got hurt the most, in order – But Cryptos are remaining quite resilient. I wouldn't be surprised to see them perform well next week.
Safe Trades and enjoy your weekend!
The Weekly Bottom Line: The Fed Pauses, Inflation Persists
Canadian Highlights
- The outlook is now clouded by the Iran conflict, overshadowing signs of easing inflation.
- Retail sales showed strong momentum early in the year, but higher energy prices are set to erode real spending in the coming months.
- Core inflation was near target with excess capacity in the economy, giving the BoC some buffer as the energy shock hits.
U.S. Highlights
- Energy markets remain volatile as physical damage and data opacity deepen uncertainty around the Middle East conflict.
- The Fed held rates steady, emphasizing caution as higher oil prices complicate the inflation outlook.
- Softer housing data underscore growing sensitivity to higher yields and tighter financial conditions.
Canada – What Might Have Been
This week’s data releases and Bank of Canada (BoC) statement describe a world that could have been, with a domestic backdrop that showed signs of easing inflation. The war in Iran has upended that. With escalatory strikes on energy infrastructure this week, WTI oil prices are holding at $94 (as of the time of writing). All the focus is now on how big and persistent the energy shock will be – with the prospect of stagflation looming.
It is unfortunate that households and businesses will face this new pinch, because this morning’s retail sales data sent some positive signals. Real volumes posted a solid gain in January, taking the three-month gain to 7.7% (annualized) and February’s preliminary estimate of the nominal figure showed another solid month could be expected. After a year of fits and starts, it looks like things were just starting to turn a corner. The expected surged in gasoline and energy prices in March will muddy the picture and likely eat into the real spending figures in the months ahead.
On the path of future inflation, this week’s economic news came as a silver lining. First off, it looks like inflation is going to be starting this shock from a pretty good place. Measures of near-term core inflation all showed signs of softening price momentum. The main measures were all roughly in line with the 2% target rate on a three-month annualized basis (Chart 1). Moreover, this trend has been building for a while – the rate of annualized change over the past six months showed the average of the BoC’s measures (1.7%), CPIX (2.5%) and CPI excluding food and energy (2.1%) all roughly in line with target. The positive progress suggests that officials were well on track to meet the 2% target before the most recent shock. These subdued near-term price changes despite the disruptions to supply chains from tariffs suggest that the economy is operating with some excess capacity.
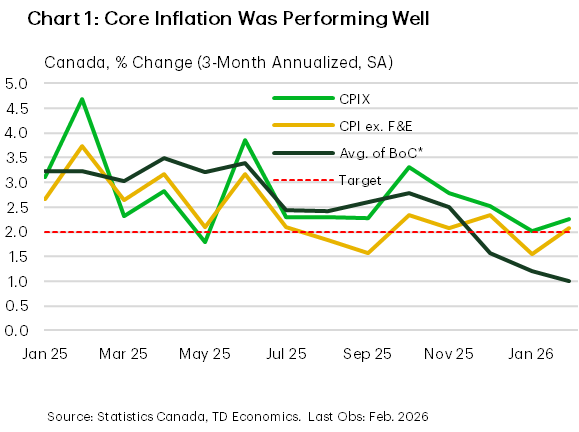
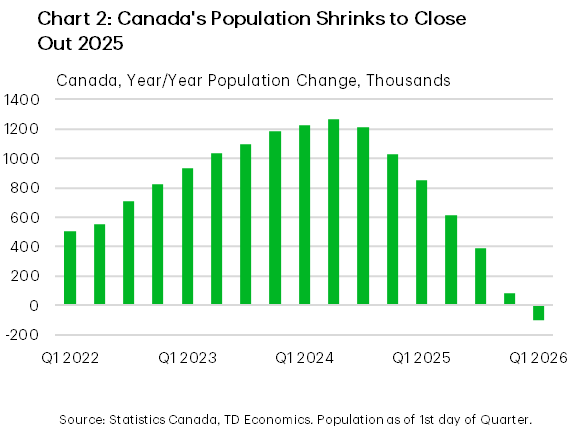
Another major development happening in the background is the country’s population turning modestly lower in 2025 (Chart 2). On the surface, declining population should help to relieve pressure on housing markets and weigh on rental growth, putting further downward pressure on shelter inflation. However, it is also leading to some tightening in labour supply, limiting spare capacity. On balance, we don’t see labour demand improving much in the coming months, but tighter labour supply will help to offset some rise in the unemployment rate.
A solid starting point for inflation and domestic excess capacity give the BoC some wiggle room to deal with the evolving energy shock. As a result, we see core measures of inflation moving only modestly higher in the coming months, before moderating into 2027. Absent a more meaningful softening in the economy, this is likely to keep the BoC on hold indefinitely.
U.S. – The Fed Pauses, Inflation Persists
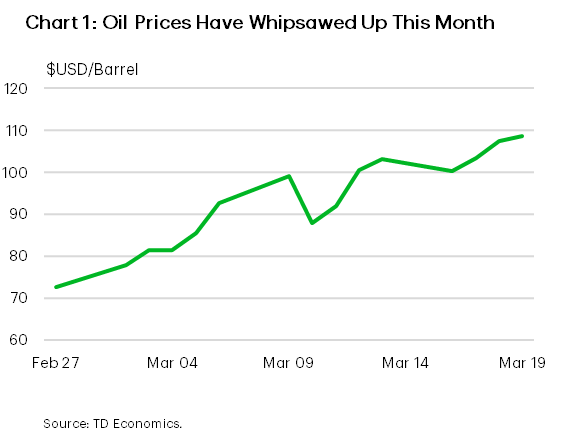
Financial markets remained on edge this week as the conflict in the Middle East escalated, with uncertainty expanding into physical energy supply rather than just shipping disruptions. Reports of damage to key oil and LNG facilities in the Gulf, including infrastructure that could take months—if not longer—to repair, have injected a persistent risk premium into energy markets. Oil prices have swung sharply day‑to‑day and remain well above pre‑conflict levels (Chart 1). This dynamic remains consistent with the base case in our Quarterly Economic Forecast, but risks of even higher prices are growing. Higher gasoline prices hurt consumer spending and the prolonged uncertainty raises downside risks in energy‑importing regions. We flagged these concerns this week in our State Economic Forecast, especially for states with higher exposure to transportation, manufacturing, and energy‑intensive industries.
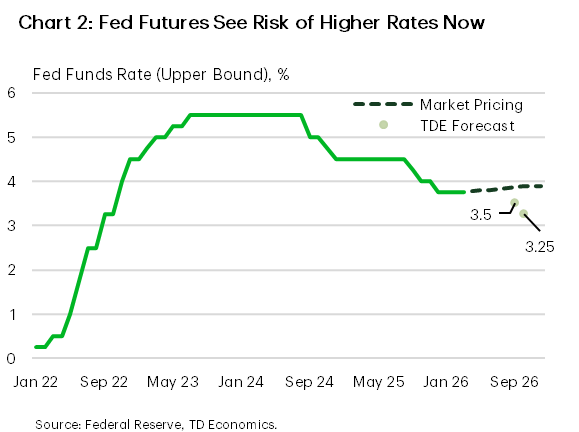
Against this backdrop, the Federal Reserve held its policy rate steady this week, as expected, but the statement was cautious. Chairman Powell acknowledged the heightened uncertainty stemming from the Middle East conflict, and revised projections showed higher inflation relative to December. The Fed continues to signal just one rate cut this year, reflecting concern that higher energy prices could slow the disinflation process at a time when core inflation is already proving sticky. Market reaction reinforced inflation concerns, with fed funds futures beginning to price a non‑trivial risk that the next move in rates may not be lower (Chart 2). Our commentary noted that the Fed appears intent on preserving flexibility, particularly given the risk that a prolonged energy shock could push the economy toward an uncomfortable mix of slower growth and firmer inflation.
Against this backdrop, markets continued to reprice risk this week in response to higher energy prices and a more cautious Federal Reserve. Equity markets struggled to find footing, while Treasury yields pushed higher as inflation risks moved back to the foreground. Incoming economic data offered a mixed picture. New home sales fell sharply in January, a reminder that interest‑rate‑sensitive sectors remain vulnerable to higher yields, though weather effects likely exaggerated the weakness. More broadly, the data flow reinforces that financial conditions are doing more of the near‑term adjustment work as the economy absorbs another external shock.
Looking ahead to next week, attention will undoubtedly remain on developments in the Middle East. Beyond the headlines, investors will also be watching how Fed officials are responding to the evolving situation and also the University of Michigan Consumer Sentiment Survey, a widely followed gauge of household confidence and inflation expectations. With energy prices and volatility high, these data could offer early signs of whether the current shock is beginning to weigh more materially on sentiment—or inflation expectations—an outcome that would further complicate the policy backdrop.
Summary 3/23 – 3/27
Monday, Mar 23, 2026
| GMT | Ccy | Events | Cons | Prev |
|---|---|---|---|---|
| 14:00 | USD | Construction Spending M/M Jan | 0.10% | 0.30% |
| 15:00 | EUR | Eurozone Consumer Confidence Mar P | -15 | -12 |
| 14:00 | USD |
| Construction Spending M/M Jan | |
| Consensus | 0.10% |
| Previous | 0.30% |
| 15:00 | EUR |
| Eurozone Consumer Confidence Mar P | |
| Consensus | -15 |
| Previous | -12 |
Tuesday, Mar 24, 2026
| GMT | Ccy | Events | Cons | Prev |
|---|---|---|---|---|
| 22:00 | AUD | Manufacturing PMI Mar P | 51 | |
| 22:00 | AUD | Services PMI Mar P | 52.8 | |
| 23:30 | JPY | National CPI Y/Y Feb | 1.50% | |
| 23:30 | JPY | National CPI Core Y/Y Feb | 1.70% | 2.00% |
| 23:30 | JPY | National CPI Core-Core Y/Y Feb | 2.60% | |
| 00:30 | JPY | Manufacturing PMI Mar P | 52.9 | 53 |
| 00:30 | JPY | Services PMI Mar P | 53.8 | |
| 08:15 | EUR | France Manufacturing PMI Mar P | 49 | 50.1 |
| 08:15 | EUR | France Services PMI Mar P | 49.2 | 49.6 |
| 08:30 | EUR | Germany Manufacturing PMI Mar P | 49.8 | 50.9 |
| 08:30 | EUR | Germany Services PMI Mar P | 52.5 | 53.5 |
| 09:00 | EUR | Eurozone Manufacturing PMI Mar P | 49.5 | 50.8 |
| 09:00 | EUR | Eurozone Services PMI Mar P | 50.8 | 51.9 |
| 09:30 | GBP | Manufacturing PMI Mar P | 51.1 | 51.7 |
| 09:30 | GBP | Services PMI Mar P | 53 | 53.9 |
| 12:30 | USD | Nonfarm Productivity Q4 | 2.40% | 2.80% |
| 12:30 | USD | Unit Labor Costs Q4 | 3.40% | 2.80% |
| 13:45 | USD | Manufacturing PMI Mar P | 51.5 | 51.6 |
| 13:45 | USD | Services PMI Mar P | 52 | 51.7 |
| 22:00 | AUD |
| Manufacturing PMI Mar P | |
| Consensus | |
| Previous | 51 |
| 22:00 | AUD |
| Services PMI Mar P | |
| Consensus | |
| Previous | 52.8 |
| 23:30 | JPY |
| National CPI Y/Y Feb | |
| Consensus | |
| Previous | 1.50% |
| 23:30 | JPY |
| National CPI Core Y/Y Feb | |
| Consensus | 1.70% |
| Previous | 2.00% |
| 23:30 | JPY |
| National CPI Core-Core Y/Y Feb | |
| Consensus | |
| Previous | 2.60% |
| 00:30 | JPY |
| Manufacturing PMI Mar P | |
| Consensus | 52.9 |
| Previous | 53 |
| 00:30 | JPY |
| Services PMI Mar P | |
| Consensus | |
| Previous | 53.8 |
| 08:15 | EUR |
| France Manufacturing PMI Mar P | |
| Consensus | 49 |
| Previous | 50.1 |
| 08:15 | EUR |
| France Services PMI Mar P | |
| Consensus | 49.2 |
| Previous | 49.6 |
| 08:30 | EUR |
| Germany Manufacturing PMI Mar P | |
| Consensus | 49.8 |
| Previous | 50.9 |
| 08:30 | EUR |
| Germany Services PMI Mar P | |
| Consensus | 52.5 |
| Previous | 53.5 |
| 09:00 | EUR |
| Eurozone Manufacturing PMI Mar P | |
| Consensus | 49.5 |
| Previous | 50.8 |
| 09:00 | EUR |
| Eurozone Services PMI Mar P | |
| Consensus | 50.8 |
| Previous | 51.9 |
| 09:30 | GBP |
| Manufacturing PMI Mar P | |
| Consensus | 51.1 |
| Previous | 51.7 |
| 09:30 | GBP |
| Services PMI Mar P | |
| Consensus | 53 |
| Previous | 53.9 |
| 12:30 | USD |
| Nonfarm Productivity Q4 | |
| Consensus | 2.40% |
| Previous | 2.80% |
| 12:30 | USD |
| Unit Labor Costs Q4 | |
| Consensus | 3.40% |
| Previous | 2.80% |
| 13:45 | USD |
| Manufacturing PMI Mar P | |
| Consensus | 51.5 |
| Previous | 51.6 |
| 13:45 | USD |
| Services PMI Mar P | |
| Consensus | 52 |
| Previous | 51.7 |
Wednesday, Mar 25, 2026
| GMT | Ccy | Events | Cons | Prev |
|---|---|---|---|---|
| 23:50 | JPY | BoJ Minutes | ||
| 00:30 | AUD | CPI M/M Feb | 0.10% | 0.40% |
| 00:30 | AUD | CPI Y/Y Feb | 3.80% | 3.80% |
| 00:30 | AUD | Trimmed Mean CPI M/M Feb | 0.30% | 0.30% |
| 00:30 | AUD | Trimmed Mean CPI Y/Y Feb | 3.30% | 3.30% |
| 07:00 | GBP | CPI Y/Y Feb | 3.00% | 3.00% |
| 07:00 | GBP | Core CPI Y/Y Feb | 3.10% | 3.10% |
| 07:00 | GBP | RPI Y/Y Feb | 3.70% | 3.80% |
| 07:00 | GBP | PPI - Input M/M Feb | 0.50% | 0.40% |
| 07:00 | GBP | PPI - Input Y/Y Feb | 0.40% | -0.20% |
| 07:00 | GBP | PPI - Output M/M Feb | 0.20% | 0.00% |
| 07:00 | GBP | PPI - Output Y/Y Feb | 2.60% | 2.50% |
| 07:00 | GBP | PPI Core Output M/M Feb | 0.20% | |
| 07:00 | GBP | PPI Core Output Y/Y Feb | 2.90% | |
| 09:00 | CHF | UBS Economic Expectations Mar | 9.8 | |
| 09:00 | EUR | Germany IFO Business Climate Mar | 86.3 | 88.6 |
| 09:00 | EUR | Germany IFO Current Assessment Mar | 86 | 86.7 |
| 09:00 | EUR | Germany IFO Expectations Mar | 86 | 90.5 |
| 12:30 | USD | Current Account (USD) Q4 | -211B | -226B |
| 12:30 | USD | Import Price Index M/M Feb | 0.20% | 0.20% |
| 14:30 | USD | Crude Oil Inventories (Mar 20) | -1.3M | 6.2M |
| 23:50 | JPY |
| BoJ Minutes | |
| Consensus | |
| Previous | |
| 00:30 | AUD |
| CPI M/M Feb | |
| Consensus | 0.10% |
| Previous | 0.40% |
| 00:30 | AUD |
| CPI Y/Y Feb | |
| Consensus | 3.80% |
| Previous | 3.80% |
| 00:30 | AUD |
| Trimmed Mean CPI M/M Feb | |
| Consensus | 0.30% |
| Previous | 0.30% |
| 00:30 | AUD |
| Trimmed Mean CPI Y/Y Feb | |
| Consensus | 3.30% |
| Previous | 3.30% |
| 07:00 | GBP |
| CPI Y/Y Feb | |
| Consensus | 3.00% |
| Previous | 3.00% |
| 07:00 | GBP |
| Core CPI Y/Y Feb | |
| Consensus | 3.10% |
| Previous | 3.10% |
| 07:00 | GBP |
| RPI Y/Y Feb | |
| Consensus | 3.70% |
| Previous | 3.80% |
| 07:00 | GBP |
| PPI - Input M/M Feb | |
| Consensus | 0.50% |
| Previous | 0.40% |
| 07:00 | GBP |
| PPI - Input Y/Y Feb | |
| Consensus | 0.40% |
| Previous | -0.20% |
| 07:00 | GBP |
| PPI - Output M/M Feb | |
| Consensus | 0.20% |
| Previous | 0.00% |
| 07:00 | GBP |
| PPI - Output Y/Y Feb | |
| Consensus | 2.60% |
| Previous | 2.50% |
| 07:00 | GBP |
| PPI Core Output M/M Feb | |
| Consensus | |
| Previous | 0.20% |
| 07:00 | GBP |
| PPI Core Output Y/Y Feb | |
| Consensus | |
| Previous | 2.90% |
| 09:00 | CHF |
| UBS Economic Expectations Mar | |
| Consensus | |
| Previous | 9.8 |
| 09:00 | EUR |
| Germany IFO Business Climate Mar | |
| Consensus | 86.3 |
| Previous | 88.6 |
| 09:00 | EUR |
| Germany IFO Current Assessment Mar | |
| Consensus | 86 |
| Previous | 86.7 |
| 09:00 | EUR |
| Germany IFO Expectations Mar | |
| Consensus | 86 |
| Previous | 90.5 |
| 12:30 | USD |
| Current Account (USD) Q4 | |
| Consensus | -211B |
| Previous | -226B |
| 12:30 | USD |
| Import Price Index M/M Feb | |
| Consensus | 0.20% |
| Previous | 0.20% |
| 14:30 | USD |
| Crude Oil Inventories (Mar 20) | |
| Consensus | -1.3M |
| Previous | 6.2M |
Thursday, Mar 26, 2026
| GMT | Ccy | Events | Cons | Prev |
|---|---|---|---|---|
| 23:50 | JPY | Corporate Service Price Index Y/Y Feb | 2.60% | 2.60% |
| 07:00 | EUR | Germany GfK Consumer Confidence Apr | -28.6 | -24.7 |
| 09:00 | EUR | Eurozone M3 Money Supply Y/Y Feb | 3.20% | 3.30% |
| 12:30 | USD | Initial Jobless Claims (Mar 20) | 211K | 205K |
| 14:30 | USD | Natural Gas Storage (Mar 20) | -49B | 35B |
| 23:50 | JPY |
| Corporate Service Price Index Y/Y Feb | |
| Consensus | 2.60% |
| Previous | 2.60% |
| 07:00 | EUR |
| Germany GfK Consumer Confidence Apr | |
| Consensus | -28.6 |
| Previous | -24.7 |
| 09:00 | EUR |
| Eurozone M3 Money Supply Y/Y Feb | |
| Consensus | 3.20% |
| Previous | 3.30% |
| 12:30 | USD |
| Initial Jobless Claims (Mar 20) | |
| Consensus | 211K |
| Previous | 205K |
| 14:30 | USD |
| Natural Gas Storage (Mar 20) | |
| Consensus | -49B |
| Previous | 35B |
Friday, Mar 27, 2026
| GMT | Ccy | Events | Cons | Prev |
|---|---|---|---|---|
| 00:01 | GBP | GfK Consumer Confidence Mar | -24 | -19 |
| 07:00 | GBP | Retail Sales M/M Feb | -0.30% | 1.80% |
| 14:00 | USD | UoM Consumer Sentiment Mar F | 55.5 | 55.5 |
| 14:00 | USD | UoM 1-Yr Inflation Expectations Mar F | 3.40% |
| 00:01 | GBP |
| GfK Consumer Confidence Mar | |
| Consensus | -24 |
| Previous | -19 |
| 07:00 | GBP |
| Retail Sales M/M Feb | |
| Consensus | -0.30% |
| Previous | 1.80% |
| 14:00 | USD |
| UoM Consumer Sentiment Mar F | |
| Consensus | 55.5 |
| Previous | 55.5 |
| 14:00 | USD |
| UoM 1-Yr Inflation Expectations Mar F | |
| Consensus | |
| Previous | 3.40% |
Week Ahead – Flash PMIs and UK, Japan and Australian CPI Data in Focus
- After hawkish Fed, dollar traders turn to preliminary PMI data.
- Pound set for a busy week amid inflation, PMI and retail sales numbers.
- Japan’s CPI to determine how likely an April BoJ hike is.
- Australia’s CPI could solidify the case for a third consecutive RBA hike.
- After the central bank spree, agenda becomes lighter.
Following a very busy week, with news about the war in the Middle East flowing continuously and seven major central banks deciding on monetary policy amidst all this geopolitical uncertainty and the profound energy crisis, the calendar becomes notably lighter next week.
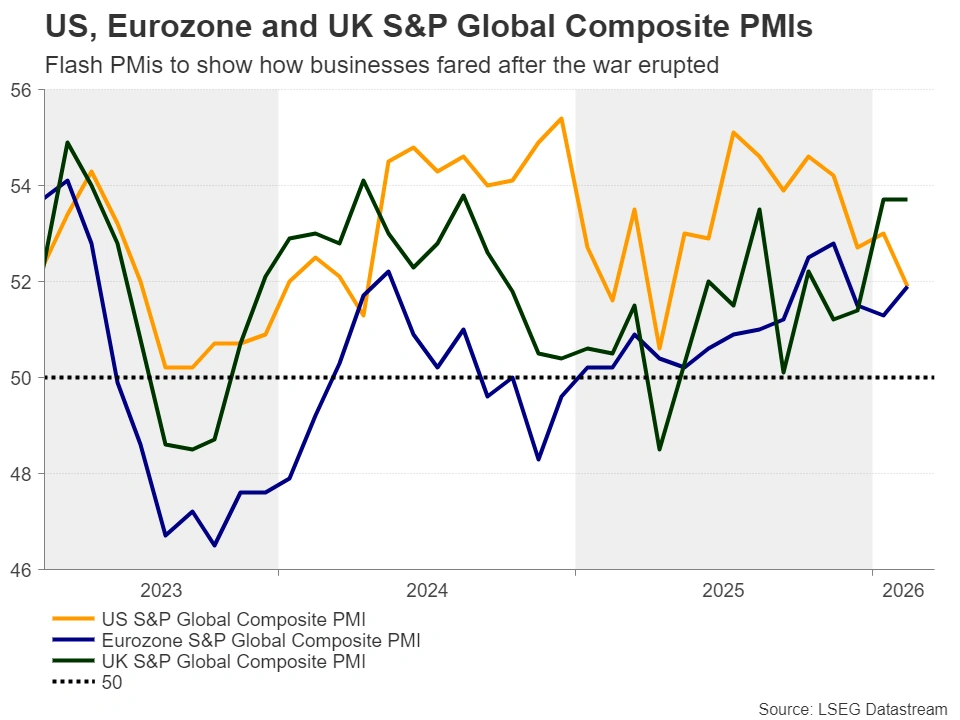
Of course, this does not mean that there are no data releases for traders to pay attention to. The spotlight may be on the preliminary PMIs for March from several major economies as they will provide a first glimpse of how business activity fared after the war erupted and what the impact of skyrocketing energy prices were.
How will the US PMIs impact Fed expectations?
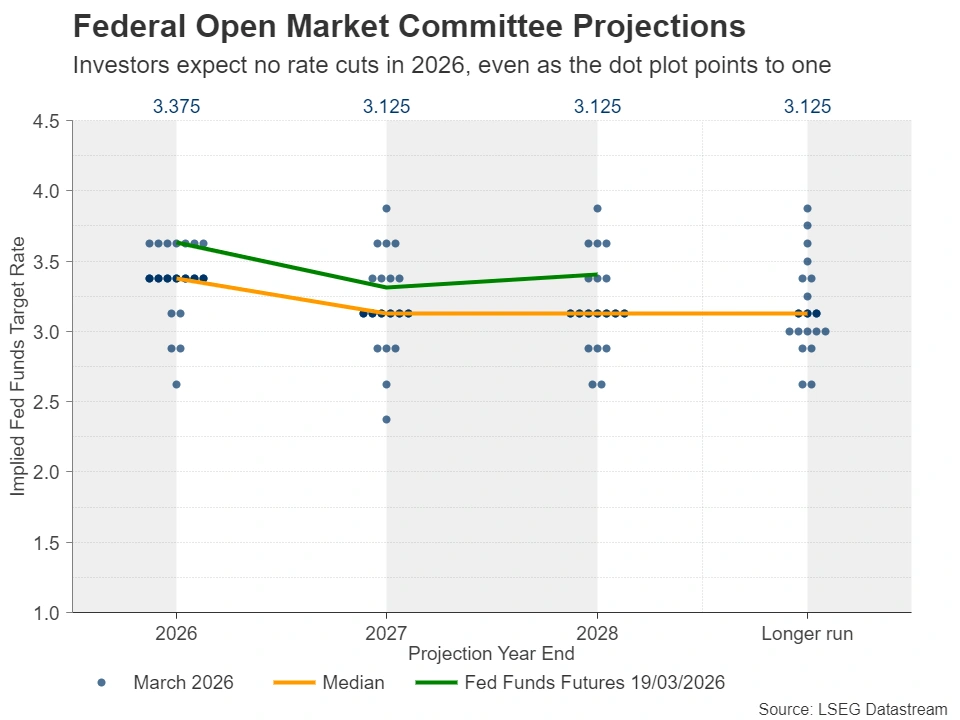
Getting the ball rolling with the US, the Fed decided to hold interest rates unchanged as expected and projected higher inflation and steady unemployment. Although the new dot plot continued to point to a single 25bps rate reduction by the end of 2026, Fed Chair Powell said that the uncertainty surrounding the rate path has increased markedly amid the war in the Middle East, and that a “meaningful” number of his colleagues are now favoring less easing than they did three months ago. Indeed, according to the plot, the number of officials favoring interest rates to remain untouched by the end of the year has increased to seven from four in December.
This prompted investors to further scale back their rate cut bets, assigning only a mere 15% chance of a quarter-point cut by the end of the year, and thereby allowing a fresh spree of dollar buying. Wall Street slipped again, while gold extended its tumble, falling below the key support zone of $4,840.
With all that in mind, should the flash PMIs, released on Tuesday, reveal that business activity was hurt severely by the energy crisis, investors will have to face a dilemma. Sell the dollar on signs of slowing economic growth or buy it due to concerns about accelerating prices charged by companies, which could lead to higher inflation and thereby an even more hawkish Fed.
Nonetheless, concerns about growth could outweigh inflation worries as productivity and profitability damage may prompt businesses to keep prices as competitive as possible. This may weigh on the US dollar as some traders become more convinced about a rate cut by the end of the year. On the other hand, a decent headline print accompanied by accelerating prices could suggest that the economy can withstand unchanged rates for a longer period of time, thereby allowing even more dollar buying.
The weekly ADP employment change could also provide a hint on how the private sector is faring as a further slowdown could translate as a first indication that businesses are indeed struggling.
Will the UK data corroborate bets of BoE rate hikes?
Pound traders will remain extra busy next week as, after this week’s Bank of England decision, the UK flash PMIs for March will be released on Tuesday, followed by Wednesday’s UK CPI data and Friday’s retail sales, both for February.
The BoE also stood pat this week, as the war in Iran dramatically shifted expectations away from rate cuts. What was surprising, though, was that the decision was unanimous, which means that even the most dovish members were convinced that they needed to buy some time.
With policymakers also indicating that they stand ready to act to ensure inflation’s return to their 2% objective, investors bolstered their rate hike bets, penciling in a 40% probability of a 25bps increase at the next gathering, and a total of 60bps by the end of the year. This translates into two quarter-point hikes and a decent 40% chance of a third.
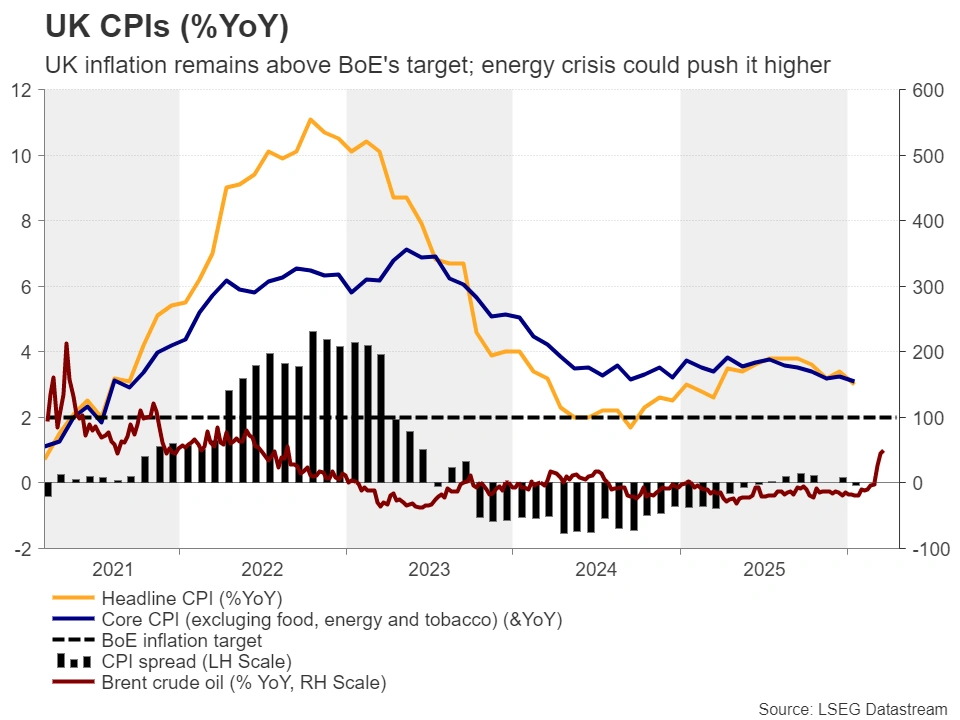
Thus, should the CPI data reveal still-sticky inflation in February, and should the PMIs suggest that the skyrocketing energy prices have sent consumer prices even higher in March, the BoE’s implied path could become steeper, and the pound could recover more ground. It could even outpace the US dollar as the shift in the BoE’s rate path has been more dramatic than the Fed’s.
The euro also enjoyed some gains after the ECB adopted a similar stance to the BoE’s, highlighting the upside risks to inflation and noting that they remain determined to ensure that inflation remains near 2%.Investors are now expecting 60bps worth of rate hikes by the ECB and the Tuesday’s Eurozone PMIs could prove key in supporting or disregarding that view.
Will Japan’s inflation figures cement an April rate increase?
In Japan, BoJ officials also decided to remain sidelined on Thursday, but they appeared concerned about the impact of surging oil prices on underlying inflation. Board member Takata repeated his proposal to raise rates up to 1.0%, while another hawk joined him to dissent the view that inflation will durably hit 2% sometime after October, arguing that this could happen as soon as April. On top of that, Governor Ueda said he believes the outcome of this year’s spring wage negotiations may be better than previous years.
The hawkish message pushed dollar/yen slightly lower as market participants took the probability of a rate hike in April above 50%, but the already strong dollar kept the pair within the 158-160 zone, prompting finance minister Katayama to warn for the umpteenth time that they remain ready to intervene in the FX market at any time.
The next test for the Japanese currency may be the National CPI numbers for February, due out during the Asian session on Tuesday. In January, both the headline and core CPI rates slipped to 1.5% y/y and 2.0% y/y from 2.1% and 2.4%, respectively, suggesting that the upside risks to inflation stemming from the tumbling yen had yet to materialize.
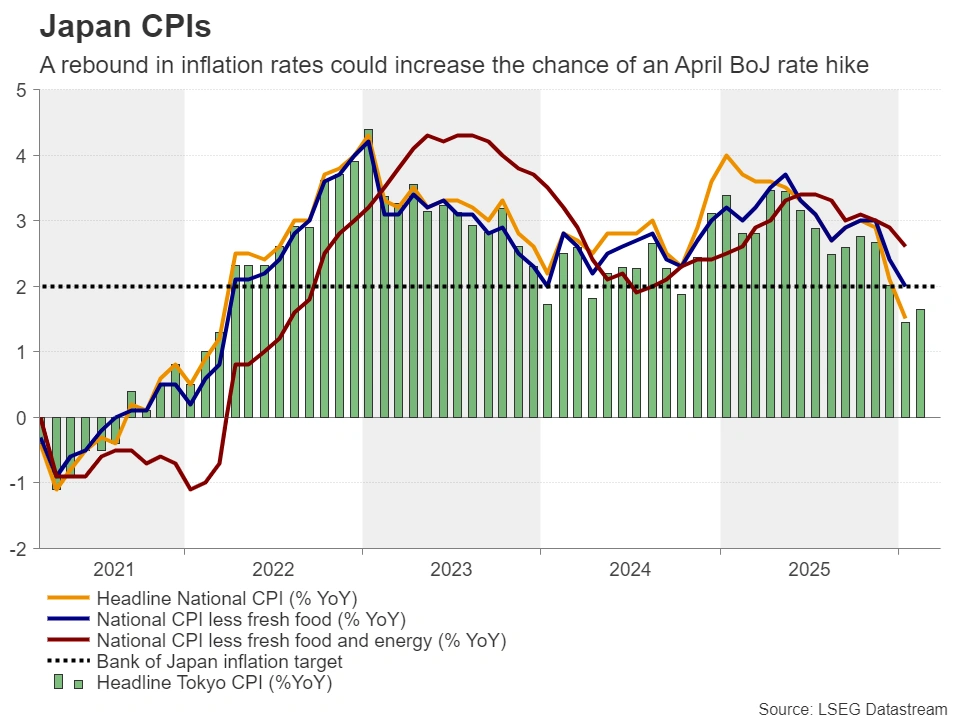
A further slowdown in February could somewhat weigh on the sense of urgency for a BoJ hike in April and thereby allow further yen selling. However, this could trigger actual intervention from the finance ministry as Katayama has been very vocal about it lately. On the other hand, accelerating price pressures could corroborate the BoJ’s view and perhaps push the yen instantly higher. In any case, it seems that the risks surrounding the yen may be tilted to the upside, especially with the dollar/yen pair hovering near the 160.00 zone.
Is the RBA headed for a third straight quarter-point hike?
The RBA is the only major central bank raising interest rates consistently. After enacting a tightening cycle on February 3, delivering its first quarter-point rate hike since November 2023, the Bank decided to proceed with a back-to-back rate increase in March. Officials of this Bank also warned of a “material” risk to inflation amid geopolitical tensions in the Middle East and kept the door open to further increases.
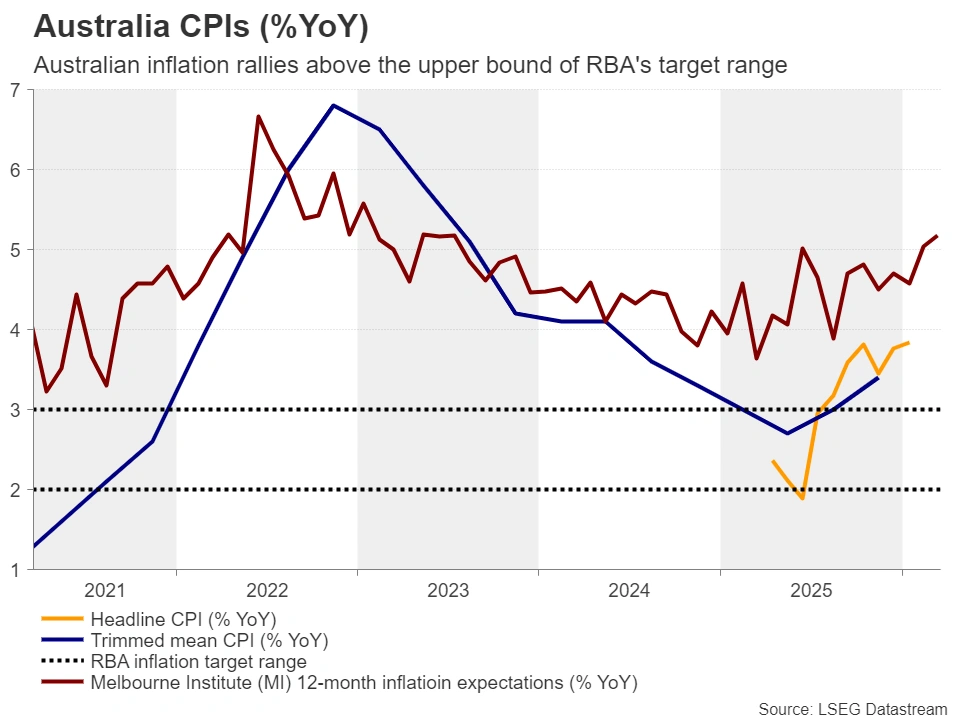
Following the decision, the Australian overnight index swaps (OIS) market pointed to a strong chance of a third consecutive rate hike at the May meeting. The probability for another 25bps increase in May is currently standing at around 60%.
Thus, Australia’s CPI data for February could attract special attention. If the numbers point to stickier inflation even before the rally in oil prices, the probability of a May rate hike could move closer to certainty and the aussie is very likely to resume its prevailing uptrend.
Weekly Focus – Sustained Supply Shock Spurs Hawkish Repricing
It has been another highly volatile week, with financial markets moving on headlines from the war in Iran and sharp swings in energy prices. Attacks on energy infrastructure in the Middle East have escalated the conflict and prolonged the negative supply shock facing the global economy. As a result, the two-year European swap rate has risen from 2.60% to 2.82%, as the TTF gas price surged to EUR 62/MWh from EUR 50/MWh last week and the oil price to USD 110 per barrel from USD 100. Equities have declined as the war drags on with increasingly negative effects on demand. We expect markets to continue reacting to headlines from the war in Iran and emphasise that the destruction of energy infrastructure lengthens the impact on the global economy even when the war ends.
Amid high volatility and the war in Iran, central banks around the world met this week. The US Federal Reserve kept the target range at 3.5-3.75%, as expected. Chair Powell offered little forward guidance and appeared more concerned about inflation than downside growth risks. The median 'dots' were unchanged, but the distribution shifted towards later cuts. Markets reacted slightly hawkishly and now price only 5bp of cuts this year, while we still expect two cuts in June and September. The ECB also left key policy rates unchanged, keeping the deposit facility rate at 2.00%, as expected. President Lagarde offered a calm, balanced assessment of higher energy prices, suggesting the ECB is in no hurry to raise rates. In a forecast scenario closely aligned with current commodity futures pricing, ECB staff project euro area HICP inflation at 3.5% y/y in 2026 and 2.1% y/y in 2027, with growth at 0.6% y/y in 2026 and 1.2% y/y in 2027. We believe this should serve as the current baseline for the euro area and allow the ECB to keep policy unchanged at 2.00% in both 2026 and 2027, though we acknowledge clear upside risks to this call. Markets are currently pricing in 75bp worth of hikes this year. In contrast to the ECB and the Fed, the Bank of England delivered a clear hawkish surprise as all members voted to keep rates at 3.75%, whereas two had been expected to maintain their call for cuts. The communication was also hawkish, highlighting risks of second-round inflation effects from higher energy prices, so markets now price three BoE hikes this year. In Japan, the Bank of Japan kept rates unchanged at 0.75%, as expected, and delivered no news that affected market pricing.
Beyond central bank meetings, this week also brought new macro releases. Germany's ZEW survey for March showed an improved assessment of the current situation, while expectations for future growth saw a historically sharp decline. In the United States, February PPI surprised to the upside for a second month, with broad-based increases suggesting tariff-related cost pressures are building, a hawkish signal. In China, the monthly data were slightly better than expected, with retail sales rising and smaller declines in house prices.
Next week, attention turns to the March flash PMIs for the euro area, UK and US on Tuesday. We expect the euro area manufacturing PMI to decline to 49.3 from 50.8, while the services PMI is likely unchanged as higher energy prices have yet to feed through. Spain's flash March inflation is due on Friday, while February inflation will be released for Japan on Tuesday and for the UK on Wednesday.
Eye on Stabilizing Job Vacancies and Industry Sales Rebound in Canada
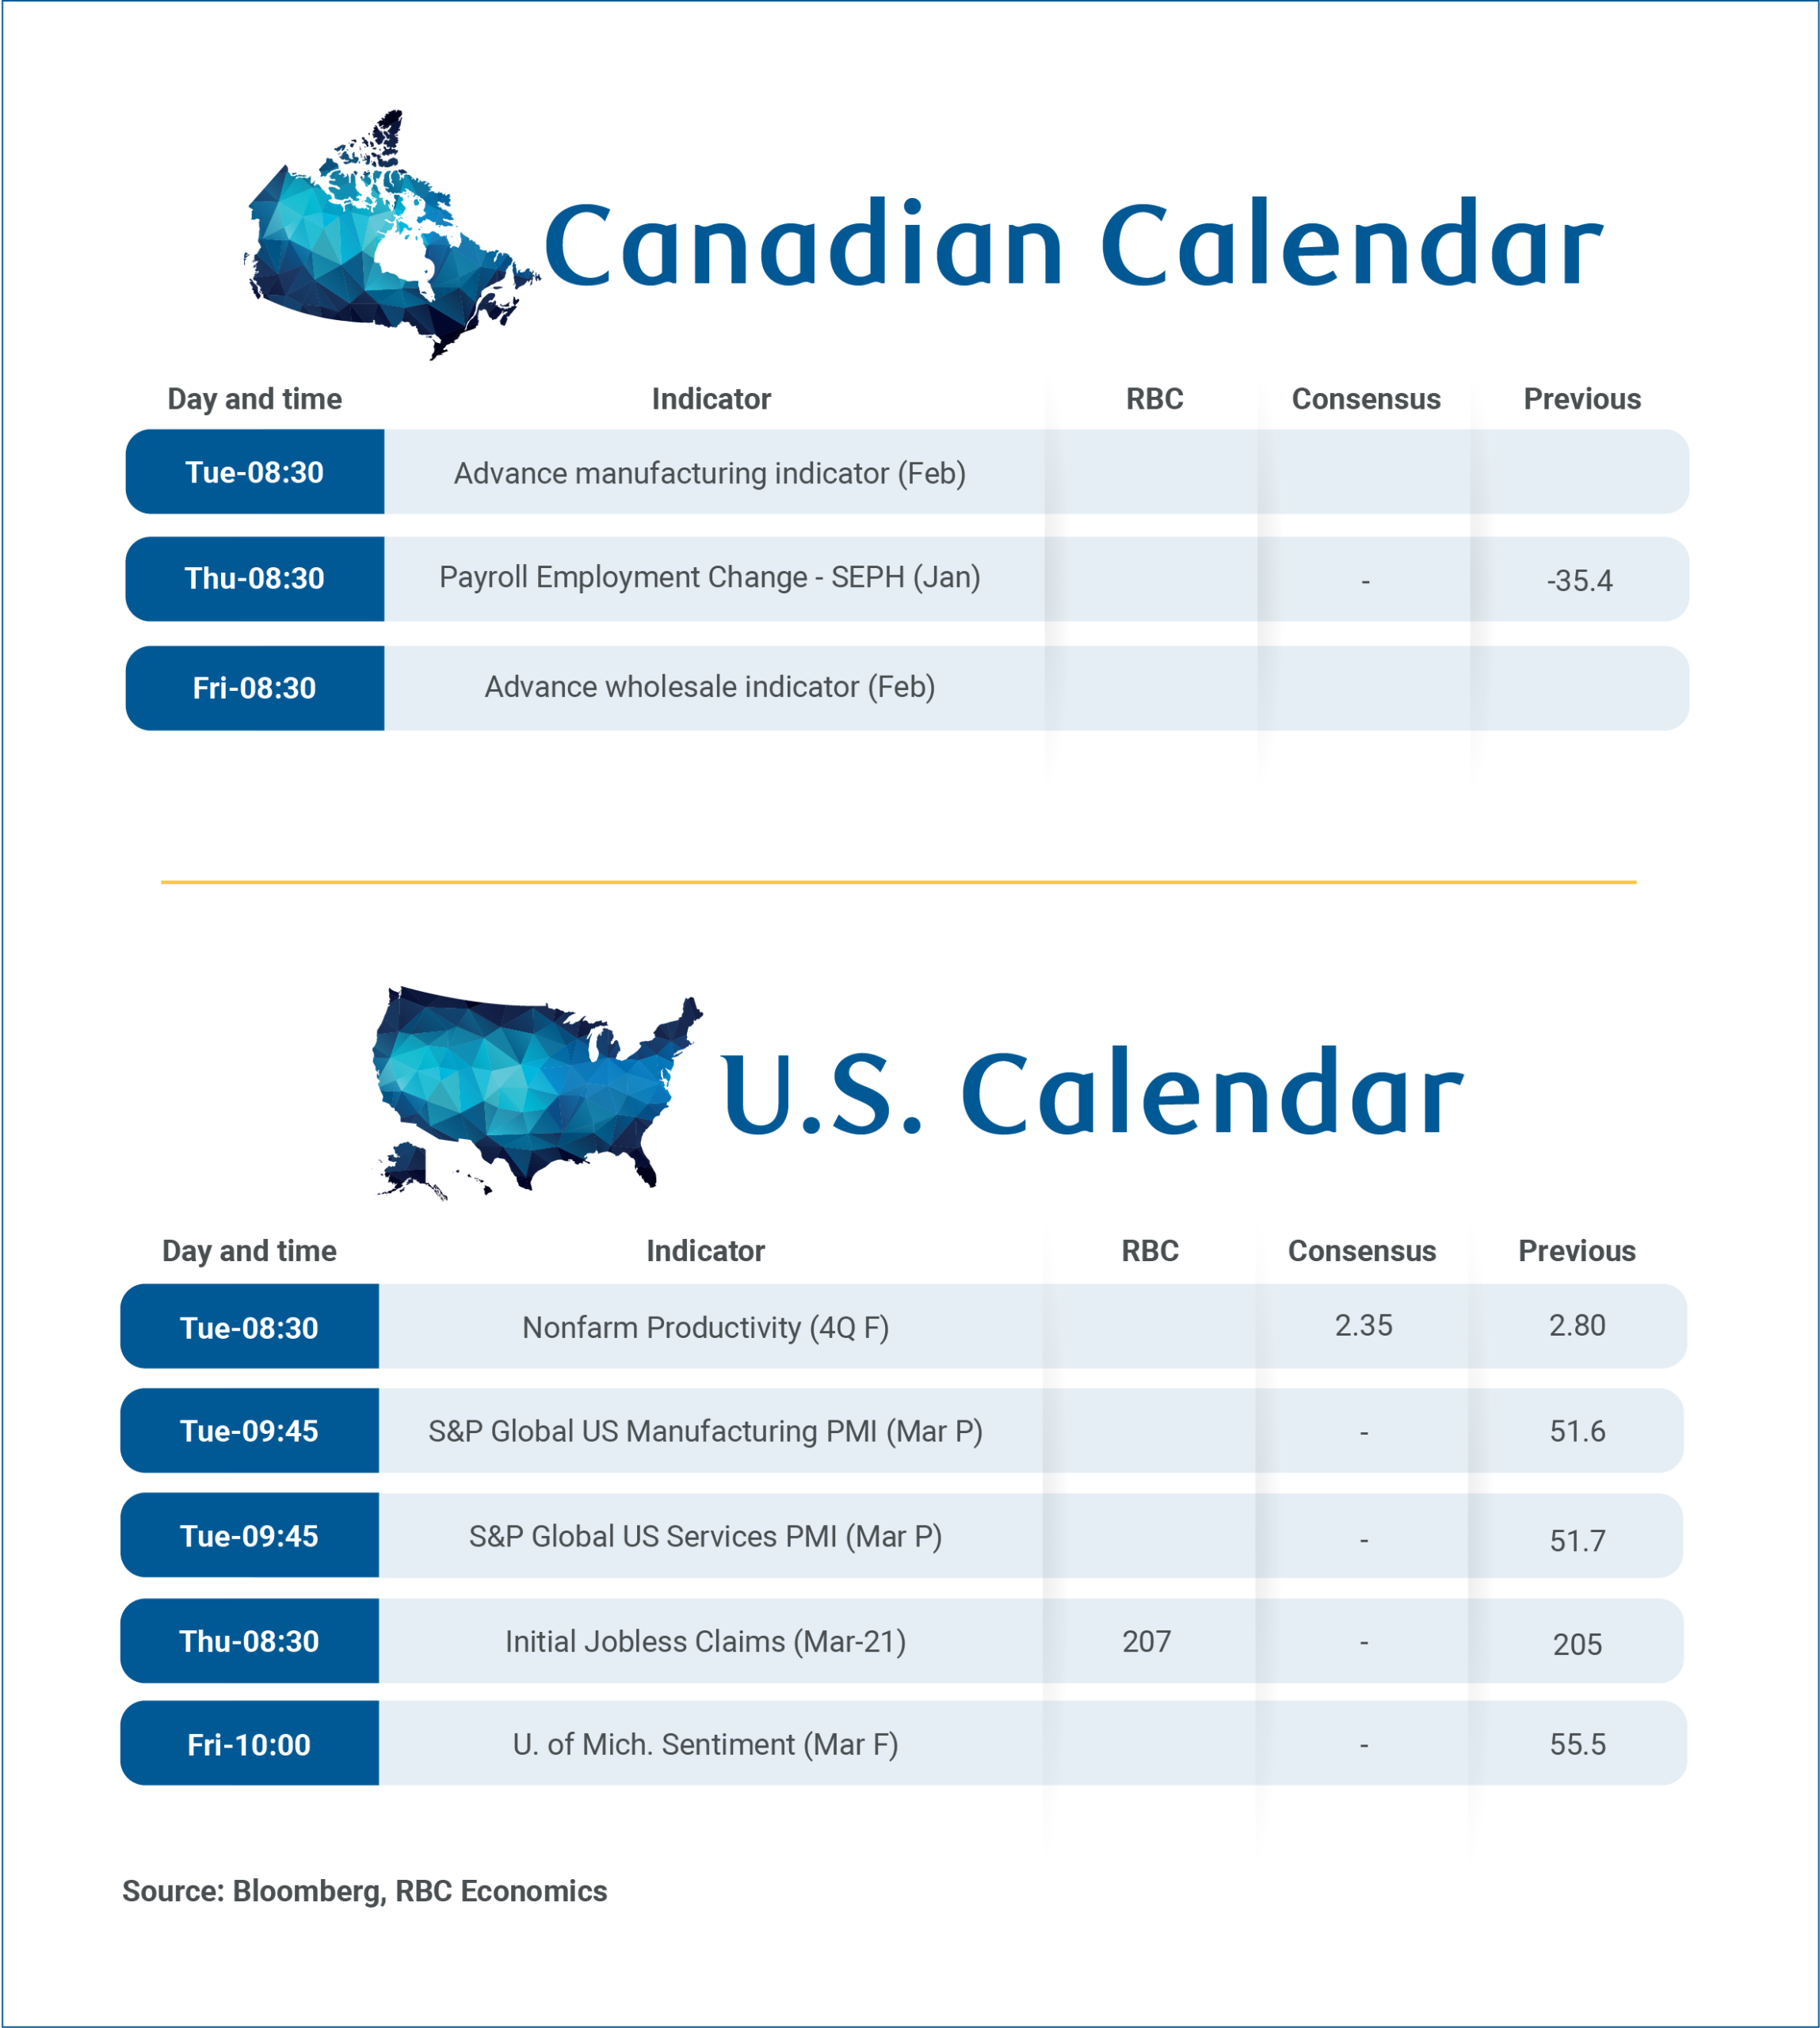
Economic data releases in Canada are quiet in the week ahead with the most notable being January’s Survey of Employment, Payrolls and Hours (SEPH) on Thursday, when we expect further stabilization in job vacancies following improvements in timelier job openings data from Indeed Hiring Lab.
February’s labour market report was weak with the unemployment rate rising to 6.7%. However, layoffs remained low and the unemployment rate was still below 7% in Q3, and 6.8% in Q4 2025.
Solid domestic demand beneath weak headline gross domestic product in Q4 2025 should continue to support a rebound in hiring early this year. We still look for the unemployment rate to gradually decline to 6.3% by the end of 2026.
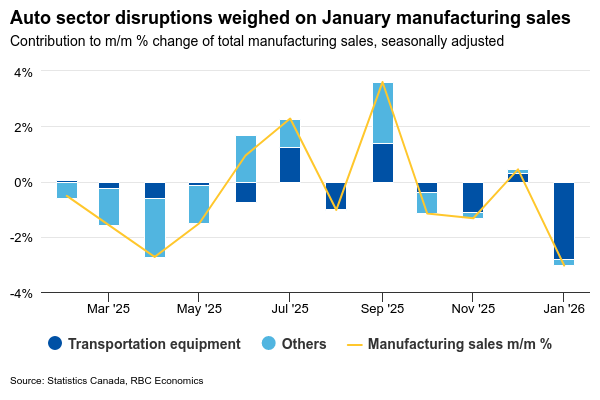
We will also receive advance February industry data that should show a partial rebound after disruptions in the auto industry drove large declines in January.
Manufacturing sales dropped 3.9% due to a significant decline in transport equipment sales from atypical production disruptions at several Ontario plants. Wholesale sales also fell 1.5% in January. Some moderation in production disruptions should support a partial rebound in February sales with manufacturing on Tuesday and wholesales on Friday.
BoC and Fed stand pat on rates
Overall, as the Bank of Canada noted in its meeting on Wednesday, the economy started Q1 on a softer footing than expected. However, with weakness in production mostly driven by disruptions in the auto sector, we expect some recovery later in the quarter.
We have left our outlook for modest growth and improved per-capita economic conditions this year broadly unchanged, and for now expects relatively neutral economic impact from recent oil price increases in both Canada and the U.S. –with the BoC and U.S. Federal Reserve remaining on hold through 2026.
At their meetings this week, both central banks held rates steady and refrained from commenting too much on the economic impact from the ongoing Middle East conflict.
In Canada, persistently weak inflation pressure prior to the oil price shock should leave the BoC with room to wait for additional clarity, compared to the U.S., where inflation pressures have been more stubborn, and tariff-related pressures are starting to show up.