Sample Category Title
Gold Softly Up After 10% Freefall
- Gold attracts moderate gains after slump to 4,500.
- Oversold conditions present, but rebound not yet convincing.
Gold faced a “double trouble” scenario this week as the Middle East crisis coincided with a hawkish Fed, causing a 10% slump - the worst since February 2020.
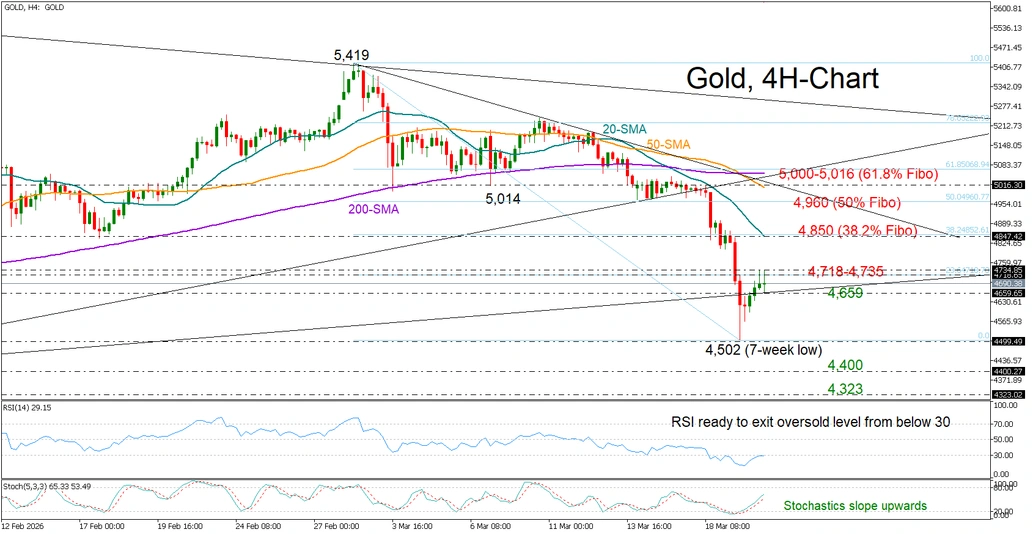
The price plummeted to an almost seven-week low of 4,502, approaching a key psychological level before staging a modest rebound. This development now raises the critical question of whether the March sharp sell-off that started from an all-time high of 5,597 has reached a bottom.
From a technical perspective, momentum indicators on the four-hour chart are turning higher from oversold levels, increasing speculation that the recent sell-off may have been overstretched. The rebound above the previously broken support trendline is another encouraging sign; however, some patience may be required, as the price has yet to surpass the 23.6% Fibonacci retracement level of the March downtrend at 4,718 and today's resistance of 4,735.
Should the price extend its recovery, the next resistance could be found near the 20-day simple moving average (SMA) and the 38.2% Fibonacci retracement level at 4,850. Beyond that, the rally may attempt to break above the 5,000 psychological level and the resistance trendline near 5,016, unless the 50% Fibonacci retracement at 4,960 caps further upside.
On the downside, a move below 4,659 could revive selling pressure, bringing the 4,500 level back into focus. Additional losses may find support around 4,400, while a deeper decline could pause near 4,325, a level last seen in December 2025.
In summary, gold’s sell-off appears to have stabilized near a key support zone; however, bulls need to push decisively above 4,718-4,735 to strengthen bullish momentum and restore buying confidence.
USD/CAD Tests Range Highs, But Breakout Momentum Remains Weak
- USD/CAD rises above downtrend line, key SMAs.
- But strong resistance and bearish SMA crossover limit upside.
- Momentum signals stay soft despite holding in bullish territory.
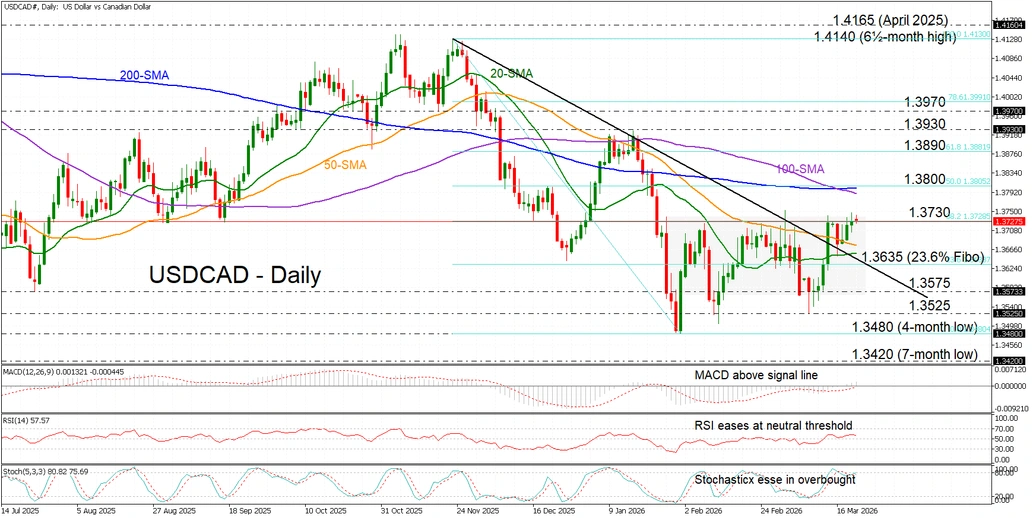
USD/CAD is retesting the ceiling of a multi‑week consolidation that has remained intact since late January, near 1.3730, as the commodity‑linked Canadian dollar finds support from elevated oil prices and geopolitical risk, against a softening US dollar as surging energy costs cloud the global rate outlook.
That said, the four‑day rally is showing a lack of strong momentum, as reflected in the technical indicators – the stochastics, RSI, and MACD are all flattening – near the overbought region, just above neutral, and marginally above the zero and signal lines respectively – signalling the mildly bullish but softer broader tone.
Nonetheless, a clean break above the range ceiling would open the door toward the 1.3800 round figure, where the bearishly converging 100‑ and 200‑day simple moving averages (SMAs) cluster, further capping upside. This region also aligns with the 50% Fibonacci retracement of the November-January pullback. Above that, the 61.8% Fibonacci at 1.3890 and the January highs near 1.3930 could follow.
Support below 1.3730, on the way to the 23.6% Fibonacci level at 1.3635, lies at the 50‑ and 20‑day SMAs sitting just underneath. Lower, a break back below the medium‑term downtrend would refocus attention on the range floor at 1.3575. Beneath that, the multi‑month lows near 1.3480 would likely come into view, shifting sentiment decisively bearish.
Summing up, USD/CAD’s mildly bullish rebound from last week’s lows has pushed price action into the upper half of its recent range, but the attempted breakout is being tested, and appears unlikely for now, as momentum lacks the technical conviction needed for follow‑through. Still, dips look well supported within the range, with key SMAs positioned to cushion downside attempts.
GBP/USD Appreciates BoE Pause: Now Focus Shifts to Geopolitics
GBP/USD rose during the previous session and is now correcting to 1.3403. The pound responded positively to the Bank of England’s decision to keep interest rates unchanged, with market attention focused on the regulator’s guidance on how the Iran conflict might influence future policy.
The Monetary Policy Committee voted unanimously for a pause (9-0), a notable shift from February’s more divided 5-4 alignment. Some members have acknowledged the possibility of future rate hikes. The BoE has adopted a wait-and-see approach amid significant uncertainty.
While the rate pause was widely anticipated, market expectations have shifted markedly. Until recently, rate cuts were priced in, but rising oil prices amid the Iran conflict have increased inflationary risks and tilted sentiment towards a more hawkish policy stance.
The BoE estimates that inflation could accelerate to 3.5% in the coming quarters and highlighted the risk that inflation expectations could become entrenched in the economy. At the same time, signs of an economic slowdown persist, which could restrain price increases, though the primary risk now centres on inflation.
Additional labour market data revealed a slowdown in wage growth to its lowest rate since late 2020. Unemployment remains at 5.2%, with employment showing signs of stabilisation. Under normal circumstances, such data might support softer rhetoric; however, the current geopolitical environment and elevated energy prices have pushed inflation risks to the forefront.
Overall, the BoE’s stance remains cautious. While the rate pause continues, the scope for policy easing is diminishing, limiting the pound’s upside potential.
Technical analysis
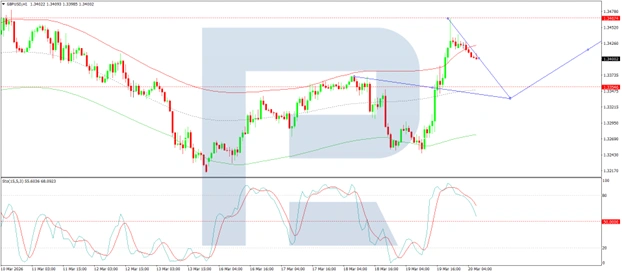
On the H4 GBP/USD chart, the market is forming a broad consolidation range around 1.3354, currently extending up to 1.3467. A decline to 1.3333 is expected in the near term, with a new consolidation range likely to form following this correction. An upside breakout would pave the way for a continuation wave towards 1.3494, while a downside breakout would suggest further movement towards 1.3133. Technically, this scenario is confirmed by the MACD indicator, whose signal line is above zero and pointing firmly upwards.
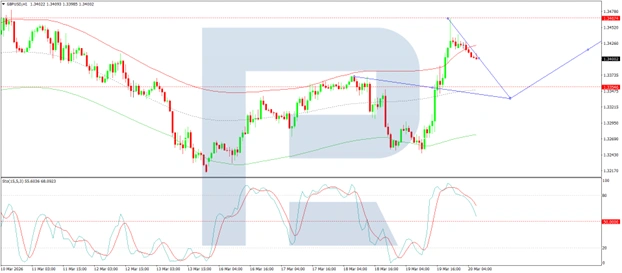
On the H1 chart, the market has formed a compact consolidation range around 1.3424. A downside breakout has initiated a wave structure extending to 1.3333. Should this level be breached, further downside towards 1.3125 is possible. Conversely, an upside breakout from the range could trigger a growth wave towards 1.3494. Technically, this scenario is confirmed by the Stochastic oscillator, with its signal line below 80 and pointing firmly downwards towards 20.
Conclusion
GBP/USD’s positive reaction to the BoE’s unanimous hold reflects market recognition that rising inflation risks – driven by geopolitical tensions and higher energy prices – are narrowing the path to policy easing. While the Bank’s cautious stance and the unanimous vote provide some support for sterling, the shift from rate-cut expectations to potential rate hikes has recalibrated market sentiment. With geopolitical developments now taking centre stage and technical indicators pointing to further consolidation, sterling’s near-term direction will likely hinge on whether inflation concerns continue to outweigh signs of domestic economic slowdown.
S&P 500 Analysis: Index Falls to Year-to-Date Low
As the S&P 500 chart (US SPX 500 mini on FXOpen) shows, the index dropped below the 6,570 level yesterday for the first time in 2026. As a result, the equity market may be on track to post a fourth consecutive weekly decline, closing below its 200-day moving average.
Why Are Equities Falling?
Bearish sentiment is likely being driven by the ongoing military conflict in the Middle East:
- → Elevated oil prices are fuelling expectations of a renewed inflationary surge. This suggests the Federal Reserve will keep interest rates higher for longer (as reinforced by Powell’s remarks this week), putting pressure on both the economy and corporate performance.
- → Investors are also concerned that the United States could become drawn into a prolonged conflict with Iran, which may pose significant challenges for the country, despite efforts by officials to calm market sentiment.
According to Trading Economics:
- → US President Donald Trump stated that the US is not considering deploying ground troops to the Middle East;
- → Treasury Secretary Scott Bessent noted that the Iranian regime could face internal collapse;
- → Israeli Prime Minister Benjamin Netanyahu said Israel may refrain from further strikes on Iran’s energy infrastructure, suggesting the conflict could end sooner than expected.
Technical Analysis of the S&P 500
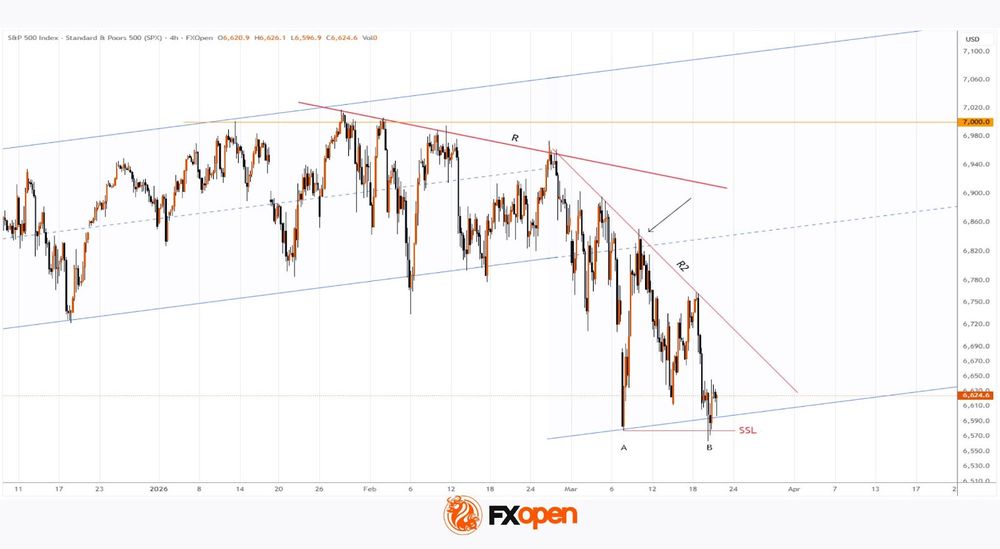
On 11 March, we analysed the index chart and noted that the lower boundary of the broader channel was acting as support (point A), while the median line served as resistance (as indicated by the arrow).
Since then, selling pressure has led to:
- → the formation of a steeper descending trendline (R2);
- → a move down to a new low at point B, below the previously mentioned channel boundary.
From a Smart Money Concepts perspective, it is reasonable to assume that price has entered a Sell-Side Liquidity zone. If so, traders should consider the possibility that the recent bearish breakout below the channel may prove to be false. In that case, the S&P 500 could stage a recovery in the coming sessions, potentially moving back towards the R2 trendline.
Trade global index CFDs with zero commission and tight spreads (additional fees may apply). Open your FXOpen account now or learn more about trading index CFDs with FXOpen.
This article represents the opinion of the Companies operating under the FXOpen brand only. It is not to be construed as an offer, solicitation, or recommendation with respect to products and services provided by the Companies operating under the FXOpen brand, nor is it to be considered financial advice.
Gold Extends Lower as Wave (5) Approaches
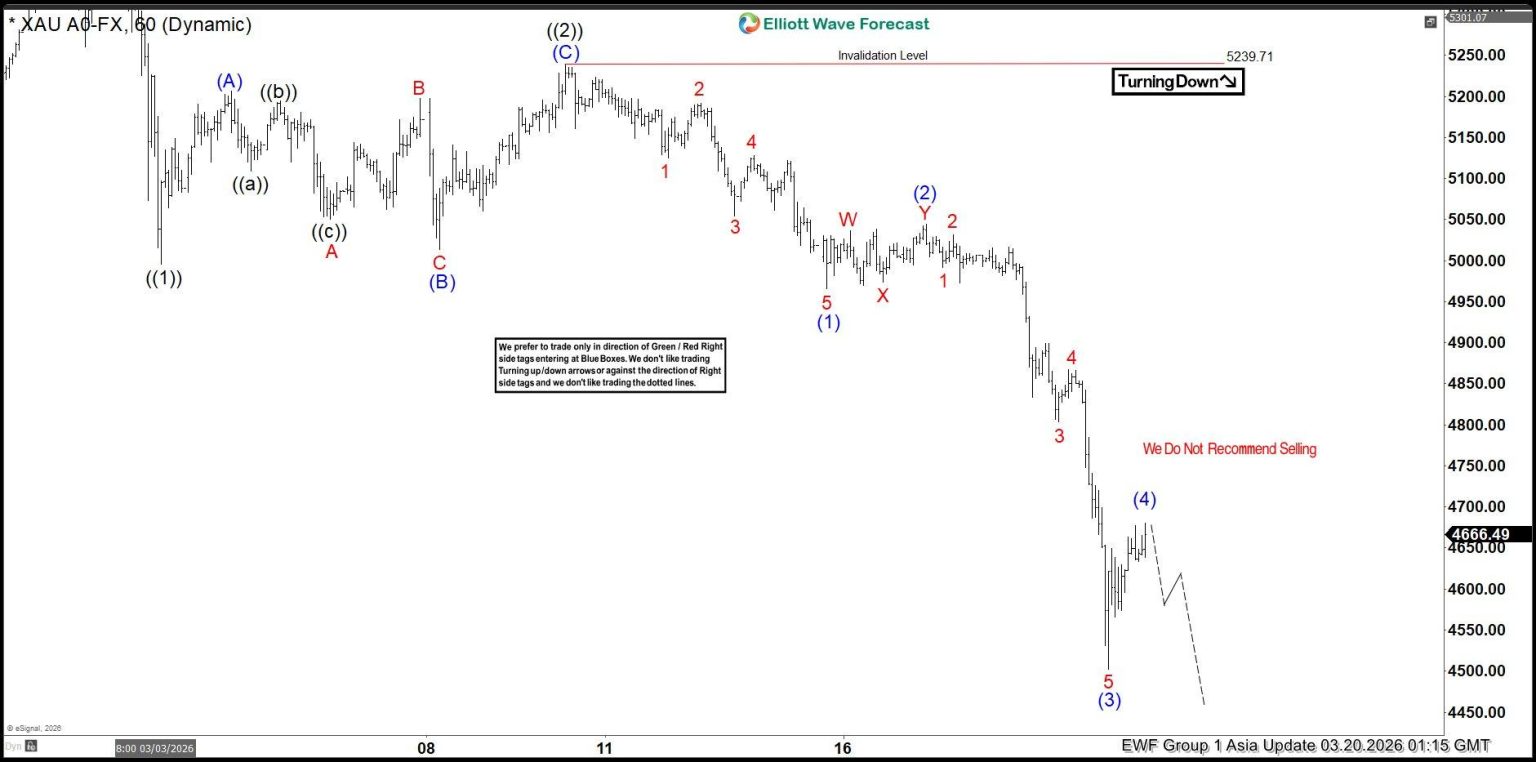
Gold (XAUUSD) continues to trade lower as the bearish sequence remains active. The decline from the recent peak is unfolding in a clear impulsive structure, which shows sellers still control the trend.
From the high, Gold completed a larger corrective structure and then turned sharply lower. The decline is progressing in a five-wave impulse. Within this move, waves (1), (2), and (3) appear complete, with wave (3) showing strong downside momentum.
Price is now correcting in wave (4). This bounce looks mature, but it could still extend slightly higher toward the 4715 area to complete a three-leg corrective structure. Any further upside should remain limited and corrective in nature.
Once wave (4) ends, the market is expected to turn lower again in wave (5). This final leg should complete the current impulsive sequence within black wave ((3)) and extend the broader bearish trend.
We do not recommend selling at current levels due to the ongoing bounce. Instead, traders should wait for wave (4) to finish and then look for selling opportunities in line with the trend.
Overall, the Elliott Wave structure supports further downside in Gold, with wave (5) expected to push prices lower after the current correction completes.
Latest 1 Hour Asia chart update from 03.20.22026
Gold Elliott Wave Video:
https://www.youtube.com/watch?v=KJfUkoPtAxM
April Meeting Key in ECB Decision
Markets
Markets yesterday again showed some hefty swings as mutual attacks on energy installations by both Iran and Israel caused the market to further move to a scenario where higher energy prices and supply disruptions might last longer than hoped for. Enter central bank assessments of the likes of the ECB and the Bank of England. The Bank of England left its policy rate unchanged at 3.75%. Four calls/votes for a 25 bps cut in February were removed. The BoE sent strong language to the market that it stands ready to react so that inflation remains on track to return to the 2% target as higher energy prices were seen a risk of reviving second round effects. The February scenario of inflation moving relatively quickly to 2% traded for an assessment that it might stick between 3%-3.5% instead. UK yields markets initially continued to reposition after the oil price spike earlier in the session, with some easing due to ‘lower’ oil prices later in the session. At the end of the day UK yields still rose between 30.5!! bps (2-y) and 2.7 bps (30-y). Money markets now discount 50% of a first 25 bps hike in April. By Q4 almost three hikes are priced in. Despite the BOE commitment and favorable interest rate support, sterling gained only modestly against the euro, closing still north of the 0.86 resistance (0.863). The ECB left its policy rate unchanged at 2% and provided the market with a framework on how they expect the economy to react to the oil price shock, providing a baseline, adverse and a severe scenario. In its baseline scenario inflation is seen rising to 2.6% this year (vs 1.9% in Dec) and 2% in 2027% (from 1.8%). In an adverse scenario the ECB assumes oil prices to peak at $119p/b in Q2 2026, before converging to the baseline assumptions by Q3 2027. This might cause inflation to jump to 3.5% this year, assuming unchanged monetary policy. In its assessment the ECB indicated that it is well positioned to address the new context and that it is determined to ensure that inflation stabilizes at the 2% target. With developments in the Middle East yesterday moving in the direction of at least the adverse scenario, German ST yields still rose 14.5 bps (2-y). The 30-y eased 2.2 bps. Money markets see 60% of an April rate hike and are moving in the direction of cumulative 75 bps hikes by eoy. EUR/USD closed the day higher (1.1589 from 1.145). The move already started before the ECB policy decision and continued afterward, but was at least partially driven by easing oil prices intraday as well.
Markets this morning are pondering comments from Israel (PM Netanyahu) that it would refrain from more attacks in Iranian energy facilities. Still, Brent oil holds near $108 p/b. Asian equities show a mixed picture. US equity futures are trading marginally lower. So no euphory at all. With respect to ECB policy several policy makers (Kazaks, Muller, Nagel) in comments this morning put the spotlights on the April meeting as key in the ECB decision making process. Nagel concludes that the ECB will need to hike rates in April if the price outlook sours.
News & Views
The Czech National Bank kept its policy rate unchanged at 3.5% yesterday in a unanimous decision. According to the Monetary Department’s updated forecast, which partly incorporates higher oil prices, headline inflation will be below 2% this year and very close to the inflation target next year. However, core inflation will remain elevated in the quarters ahead. The Bank Board assessed the risks and uncertainties of the outlook for the fulfilment of the inflation target as balanced overall with current impact of the Middle East conflict not jeopardizing the persistence of the low-inflation environment. The CNB adds that monetary policy is currently still relatively tight compared to the past and deems it necessary to stick to that course. CNB Michl at the press conference said that the central bank isn’t looking at market bets on rates and keeps all options open for future decisions. Ahead of the Iran war, officials saw some room to lower interest rates. The Czech 2y swap rate initially followed global market moves higher as bond markets repositioned for more hawkish central bank functions. It gave up part of the gains after the CNB meeting but still ended around 12 bps higher on the day to close at 4.09%.
White sugar prices hit their highest level since October yesterday as effects from the Middle East conflict broaden out. The de facto closure of the Strait of Hormuz is causing trouble as it is the major trading route for delivering raw sugar to refineries that convert it into white sugar. Other factors in play or lower output coming from India and Brazil’s production mix. Higher oil prices could incentivize sugar mills to divert more cane into ethanol, weighing further on global supply.
GBP/JPY Daily Outlook
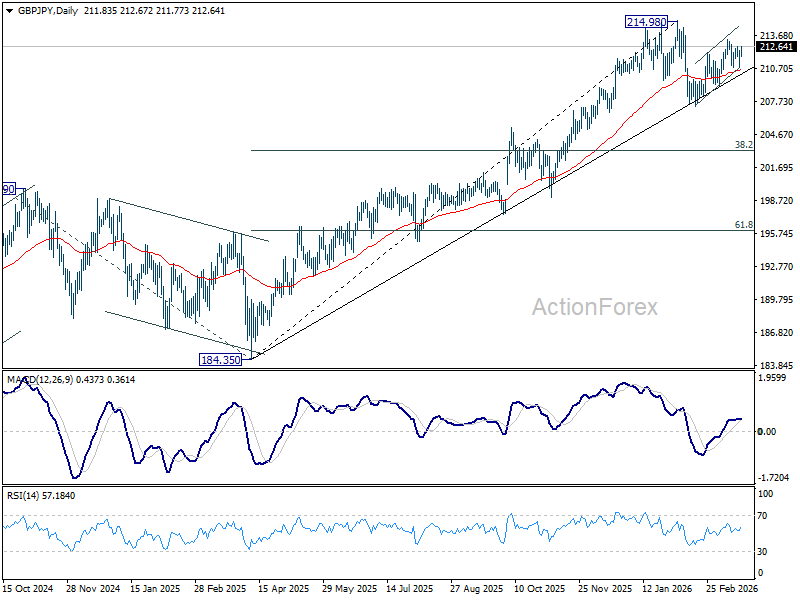
Daily Pivots: (S1) 210.95; (P) 211.66; (R1) 212.51; More...
Intraday bias in GBP/JPY remains neutral for the moment. On the upside, firm break of 213.28 will resume the rebound from 207.20 to retest 214.98 high. Nevertheless, on the downside, below 210.78 support will target 209.15 support first. Further break there will bring retest of 207.20 support next.
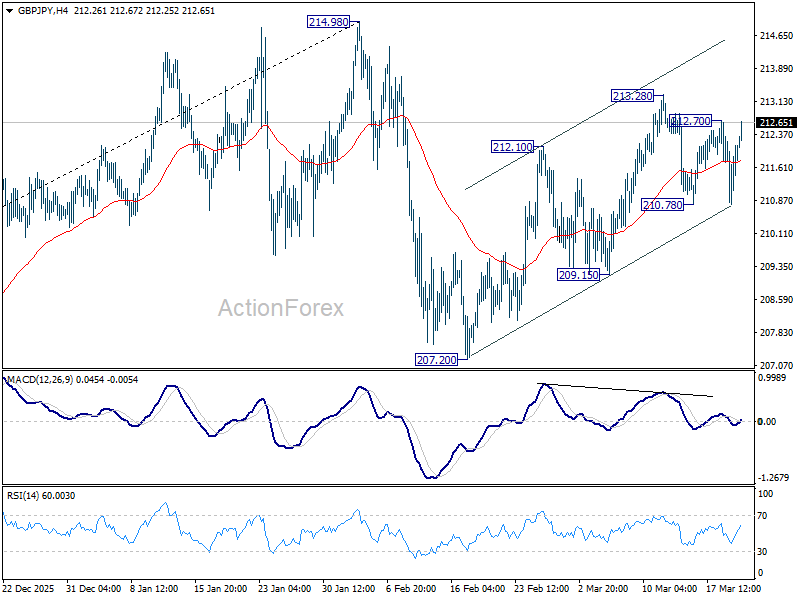
In the bigger picture, up trend from 123.94 (2020 low) is still in progress. Firm break of 214.98 will target 61.8% projection of 148.93 (2022 low) to 208.09 (2024 high) from 184.35 at 220.90. This will remain the favored case as long as 55 W EMA (now at 203.08) holds, even in case of another deep pullback.
EUR/JPY Daily Outlook
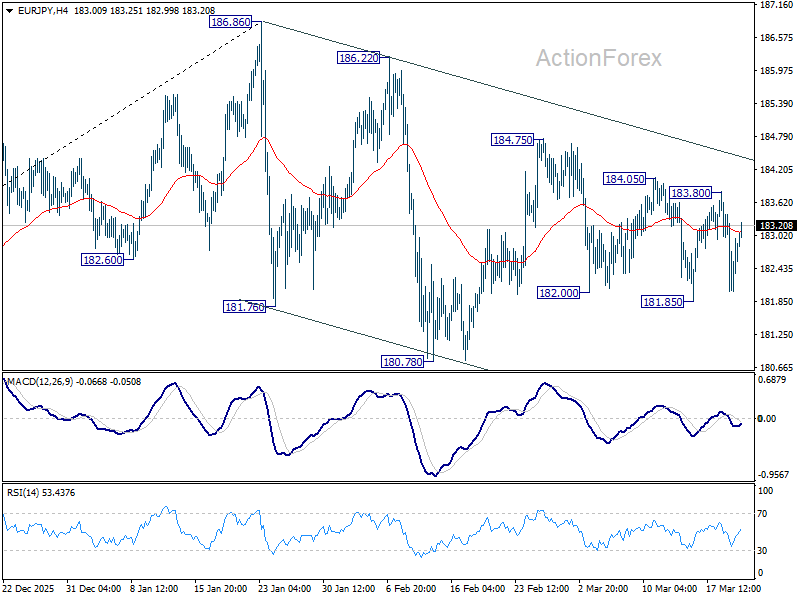
Daily Pivots: (S1) 182.07; (P) 182.75; (R1) 183.46; More...
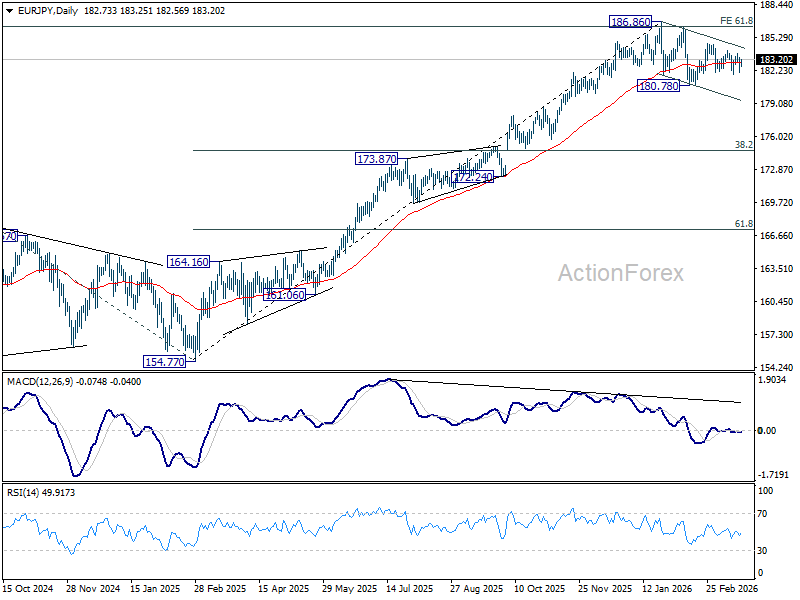
Range trading continues in EUR/JPY and intraday bias remains neutral. On the downside, below 181.85 will target 180.78 support. Decisive break there will indicate that fall from 186.86 is already correcting whole up rise from 154.77, and solidify the near term bearish outlook. On the upside, above 183.38 will resume the rebound from 180.78 through 185.74 resistance.
In the bigger picture, a medium term top could be in place at 186.86 and some more consolidations would be seen. Nevertheless, as long as 55 W EMA (now at 175.29) holds, the larger up trend from 114.42 (2020 low) remains intact. Firm break of 186.86 will pave the way to 78.6% projection of 124.37 (2022 low) to 175.41 (2025 high) from 154.77 at 194.88 next.
EUR/GBP Daily Outlook
Daily Pivots: (S1) 0.8627; (P) 0.8640; (R1) 0.8652; More…
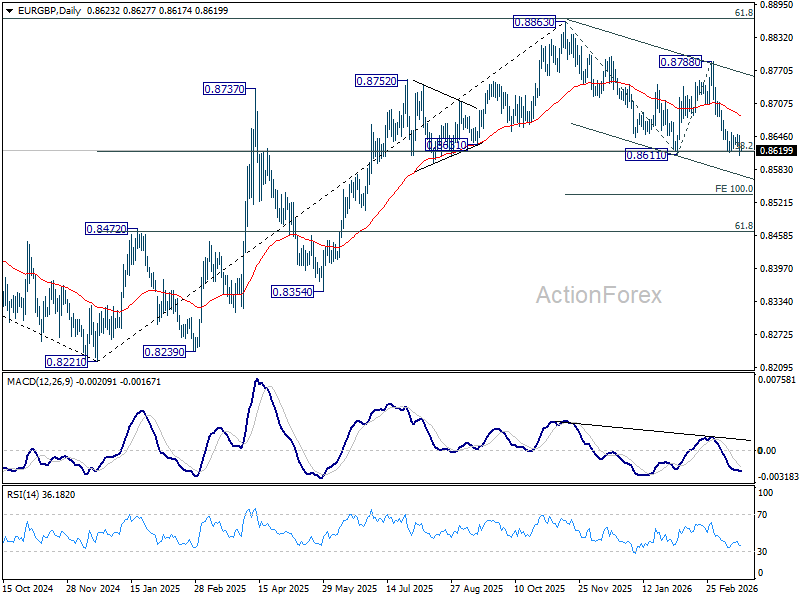
Intraday bias in EUR/GBP remains neutral for the moment. Further decline is expected as long as 55 D EMA (now at 0.8686) holds. Firm break of 0.8611 will resume the whole fall from 0.8863 to 100% projection of 0.8863 to 0.8611 from 0.8788 at 0.8536.
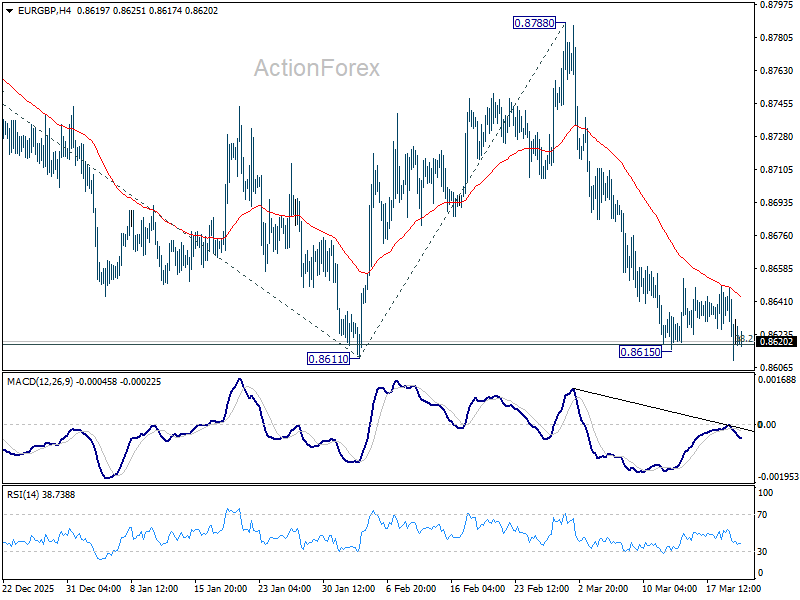
In the bigger picture, current development revived the case that whole rise from 0.8221 (2024 low) has completed at 0.8863, after rejection by 61.8% retracement of 0.9267 (2022 high) to 0.8221 at 0.8867. Sustained trading below 38.2% retracement of 0.8821 to 0.8863 at 0.8618 will confirm this case, and bring deeper fall to 61.8% retracement at 0.8466 at least. For now, medium term outlook is neutral at best as long as 0.8863 resistance holds.
EUR/AUD Daily Outlook
Daily Pivots: (S1) 1.6230; (P) 1.6275; (R1) 1.6351; More...
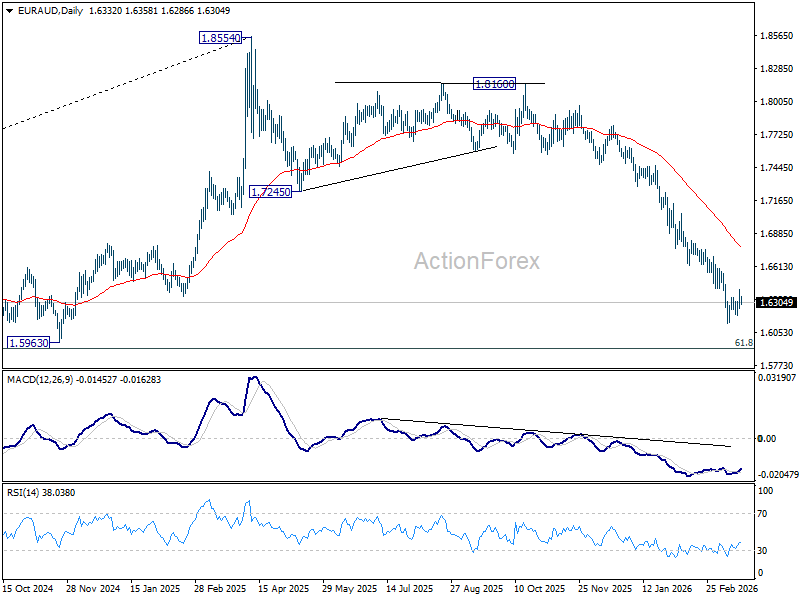
Intraday bias in EUR/AUD stays neutral as consolidations continues above 1.6125. Further decline is expected with 1.6594 resistance intact. Firm break of 1.6125 will resume the fall from 1.8554 to 1.5913 fibonacci level next. Nevertheless, break of 1.6594 will indicate short term bottoming, and bring stronger rebound.
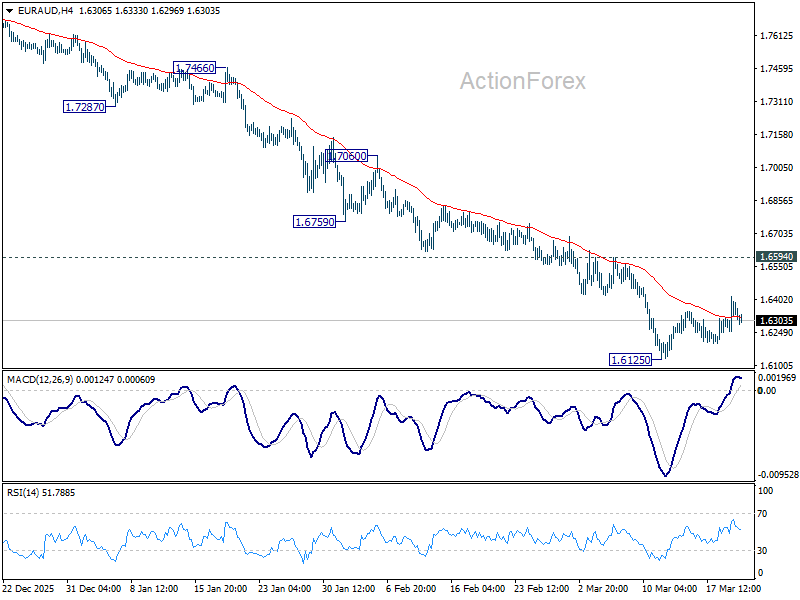
In the bigger picture, fall from 1.8554 medium term top is seen as reversing the whole up trend from 1.4281 (2022 low). Deeper decline should be seen to 61.8% retracement of 1.4281 to 1.8554 at 1.5913, which is slightly below 1.5963 structural support. Decisive break there will pave the way back to 1.4281. For now, risk will stay on the downside as long as 55 W EMA (now at 1.7238) holds, even in case of strong rebound.