
Sample Category Title
Gold stabilizes at 4,500 as liquidation exhausts, 4,000 remains target
Gold’s steep selloff is showing signs of stabilization near 4,500 level after a disorderly decline yesterday, driven largely by liquidity squeeze. While hawkish signals from major central banks this week, including Fed, ECB, BoE and even BoJ, provided the initial pressure, the magnitude of the drop points to a market dislocation rather than a purely fundamental repricing.
The downward acceleration below 5,000 psychological level acted as a key trigger, unleashing a wave of margin calls across leveraged positions. As forced selling intensified, prices fell rapidly, setting off additional liquidation rounds in a classic cascade effect. This type of price action is characteristic of a liquidity squeeze, where market structure—not macro alone—drives the move.
At the same time, heavy outflows from major ETFs added to the downward pressure. Large-scale redemptions from funds such as GLD and SLV indicate that institutional positioning was being unwound aggressively. Notably, the selloff occurred alongside a softer Dollar, reinforcing the view that liquidity stress, rather than FX strength, was the dominant force.
With these forced flows now likely reduced, Gold is beginning to find footing around 4,500. The stabilization suggests that the most intense phase of liquidation has passed, and price action may transition into consolidation as markets reassess the underlying macro backdrop.
Technically, the decline to 4502.43 has fulfilled a major downside target of 161.8% projection of 5149.02 to 4996.03 from 5238.55 at 4554.15. This supports the case for a temporary floor. However, rebounds are expected to be limited by resistance near the falling 55 4H EMA (now at 4970.12, and declining).
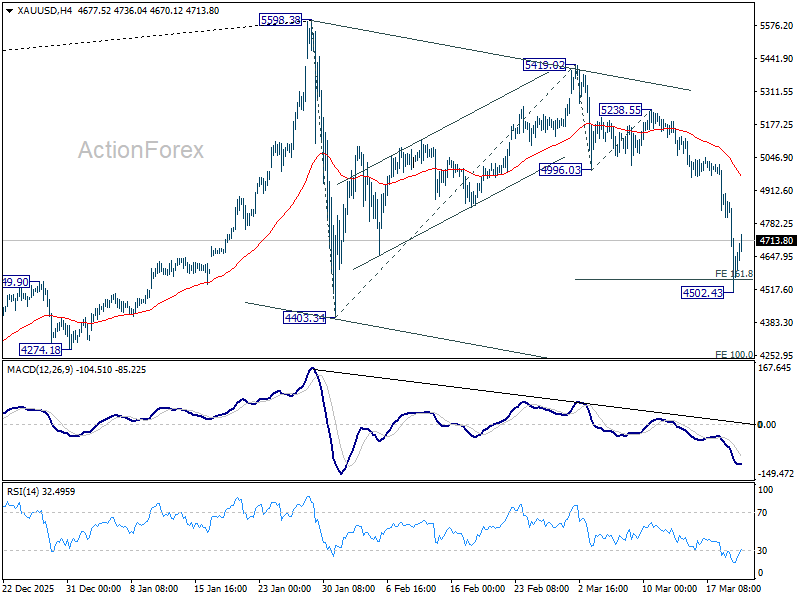
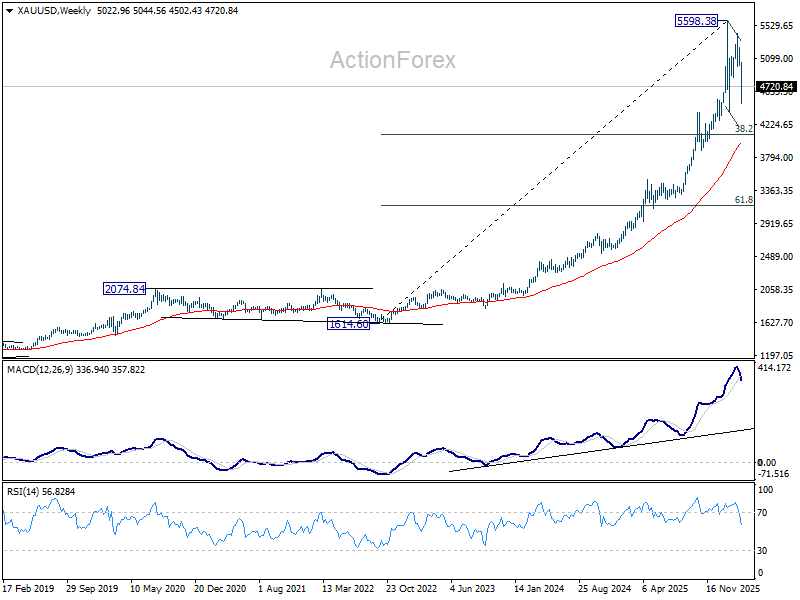
In the broader picture, Gold remains in the corrective pattern from 5,598.38 peak, with current decline from 5419.02 as the third leg. The structure points to further downside toward 4,000 psychological level. This aligns with 38.2% retracement of 1614.60 to 5998.38 at 4076.57, and 55 W EMA (now at 3995.30). This zone is likely to attract stronger buying interest and form a more durable base once the correction fully unfolds.
USD/JPY Buyers Stay Active as Pair Eyes Higher Levels
Key Highlights
- USD/JPY started a downside correction below 158.80.
- It traded below a bullish trend line with support at 158.85 on the 4-hour chart.
- EUR/USD started a recovery wave and traded above 1.1550.
- Gold prices declined heavily below $5,000 and $4,850.
USD/JPY Technical Analysis
The US Dollar failed to continue higher above 159.90 against the Japanese Yen. USD/JPY corrected gains and traded below 159.00.
Looking at the 4-hour chart, the pair traded below a bullish trend line with support at 158.85. The pair even dipped below 158.00 and tested the 100 simple moving average (red, 4-hour). A low was formed at 157.50, and the pair is now consolidating losses.
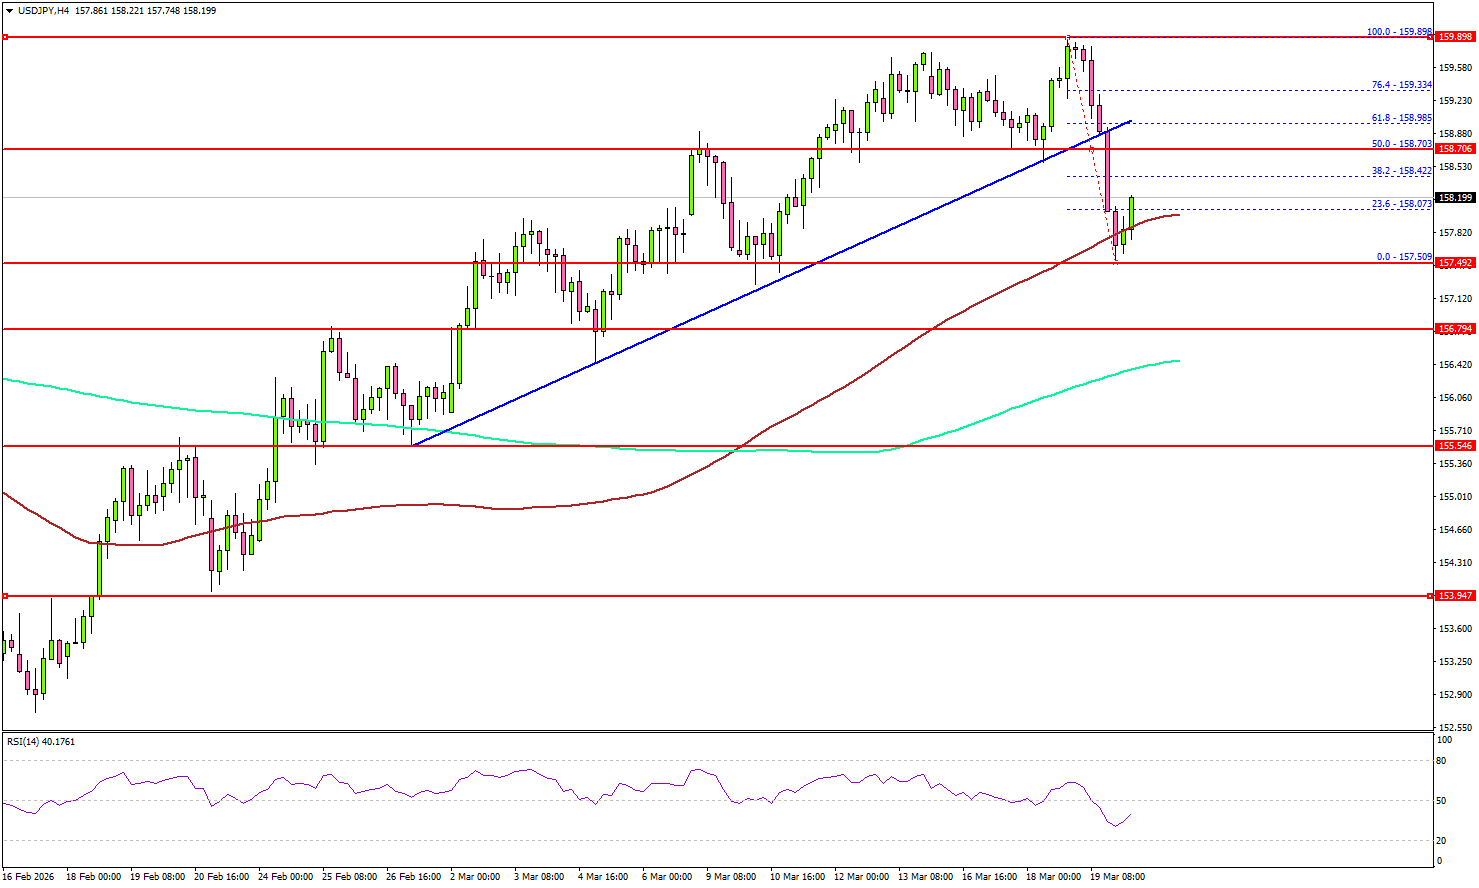
It could be forming a base above 157.50 and might start a fresh increase. On the upside, the pair is now facing sellers near 158.70 and the 50% Fib retracement level of the downward move from the 159.89 swing high to the 157.50 low.
The first major resistance sits at 159.00. A close above 159.00 could open the doors for gains above 159.50. In the stated case, the bulls could aim for a move to 160.00. Any more gain might open the doors for a test of 162.00.
If there is no upside break above 159.00, the pair might start a fresh decline. Immediate support is seen near 157.65. The first key support sits at 157.50.
A close below 157.50 might call for heavy losses. In the stated case, it could even revisit 156.50 and the 200 simple moving average (green, 4-hour) in the coming days.
Looking at Gold, the price failed to stay above $5,000 and started a sharp decline toward $4,600. The main support sits at $4,500.
Upcoming Key Economic Events:
- Baker Hughes US Oil Rig Count.
- ECB's Nagel speech.
NZ exports hit by soft China and Japan demand
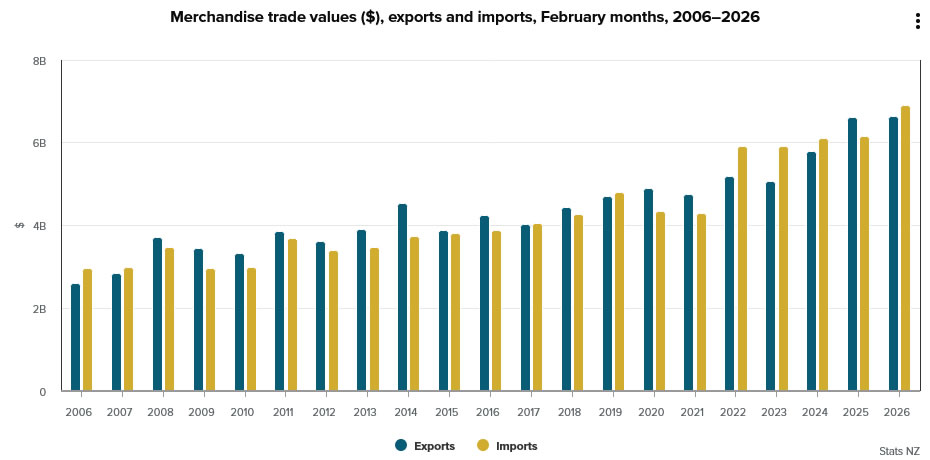
New Zealand’s trade balance reported a deficit of NZD -257m in February as imports surged far ahead of modest export gains. Goods exports edged up just 0.4% yoy to NZD 6.6B, while imports jumped 12% yoy to NZD 6.9B.
Export dynamics were mixed across major trading partners. Shipments to China fell -3.6% yoy, while exports to Japan dropped sharply by -14%, highlighting softness in key Asian demand channels. In contrast, exports to the US rose 8.2% and EU surged 15%, providing some offset and pointing to diversification in external demand. Exports to Australia also posted a modest 2.0% gain.
On the import side, strength was broad-based and pronounced. Imports from South Korea surged 79% yoy, while shipments from Australia and EU rose 30% and 16% respectively. Imports from China also climbed 15%. The sharp rise in imports relative to exports signals ongoing pressure on New Zealand’s external accounts and could weigh on NZD, particularly as growth momentum remains fragile.
Cliff Notes: Fear Overwhelms
Key insights from the week that was.
Among the plethora of major central bank decisions this week, the RBA stood out from the pack, delivering a 25bp rate hike which took the cash rate to 4.10%. The widely expected decision was finely balanced in the end, the 5-4 split vote coming down to a difference in opinion over timing – the minority believing they had the opportunity to assess more data before acting.
In the press conference, Governor Bullock made clear that the decision was driven by the Board’s assessment of the starting point for inflation, which is “already too high”, and capacity developments, “the labour market ha[ving] tightened a little recently and [with] capacity pressures… slightly greater than previously assessed”. The conflict in the Middle East is also adding to near-term price pressures and uncertainty. In this week’s video update, Chief Economist Luci Ellis discusses these points in more detail. We continue to expect another 25bp hike in May, and the market sees a risk of further tightening before year end.
The RBA decision provided an interesting backdrop for the latest labour force survey which surprised on two fronts. Firstly, employment growth was firmer than expected, the 48.9k gain in February lifting the three-month average growth pace above its likely nadir, from 1.0%yr to 1.3%yr. Increased participation also lifted the unemployment rate to 4.3% in February after two months at 4.1%. We previously flagged the risk of a turnaround in participation lifting the unemployment rate. Assuming this turn persists in coming months, December/ January will be seen as a display of weaker labour force participation temporarily compressing the unemployment rate rather than a meaningful ‘re-tightening’.
Before moving offshore, it is worth emphasising that, while higher fuel prices were “not the reason” for the RBA’s March rate hike, the Middle East conflict was assessed to have skewed the risk profile for inflation to the upside, both in the near-term via global energy prices and “further out” should supply capacity be impacted, or inflation expectations increase materially. While the RBA have not yet modelled the impact in detail, our scenario analysis and deep-dive into Australia’s exposure to energy price shocks provides the structure around our current thinking.
In the US, while the FOMC recognised the increase in global uncertainty since January, their focus remained on the domestic economy. GDP growth is now expected to be 2.4% in 2026 (prev. 2.3%) and, more significantly, 2.3% in 2027 (prev. 2.0%), then 2.1% in 2028 (prev. 1.9%), growth benefitting from productivity versus a stronger labour market. The consequences for inflation of tariffs and the Middle East conflict are, in contrast, seen as temporary, annual inflation revised up 0.3ppts to 2.7% for 2026 but only edged higher in 2027 to 2.2% and unchanged at 2.0% in 2028. Capacity constraints evident in the US economy (housing and energy are prime examples) continue to get little airplay in the FOMC’s communications, so too the potential for second-round effects from energy and other commodities impacted by the conflict in the Middle East (fertiliser being an example). Inflation expectations are clearly not a concern for the FOMC, in stark contrast to the RBA’s view for Australia.
The Committee's base case for the stance of policy therefore remains one cut in 2026 and another in 2027 to 3.1%, which is now members’ best estimate of the US’ longer run neutral rate. Westpac continues to believe that the FOMC are, at most, likely to cut once more in this cycle. The lack of private sector job creation spoken about in the press conference points to the timing of this cut being sooner than later. We have this decision pencilled in for June, albeit with low conviction. The more critical point here though is that, with economic and fiscal capacity constrained as well as potential upside risks from tariffs and commodities, term US yields are likely to rise from here.
The global energy price shock meanwhile brought greater unity among policymakers at the Bank of England. Having previously voted to cut Bank Rate by the narrowest of margins in February, in March the Monetary Policy Committee unanimously opted to maintain the policy rate at 3.75%. Both the policy summary and meeting minutes emphasised the ongoing conflict in the Middle East and its repercussions for UK inflation. The committee remains particularly vigilant for any indications of domestic inflationary pressures emerging through second-round effects, though they also acknowledged the implications for inflation from weakening economic activity. In the minutes, MPC members noted that the policy stance has shifted from considering rate cuts towards the possibility of hikes, with concerns about higher inflation outweighing downside risks to growth. Even the most dovish members now appear open to the prospect of a rate hike. Fearing the duration of the current conflict, the market has priced more than two hikes before year end.
Across in Europe, the ECB Governing Council unanimously voted to keep interest rates unchanged, with the deposit rate remaining at 2.0%. The policy statement highlighted that the outlook has become considerably more uncertain due to the Middle East conflict, yet maintained a balanced tone, noting that “monetary policy is well positioned to navigate this uncertainty”. President Lagarde argued during the press conference that the economy is in a stronger position compared to the 2022 energy shock, and the ECB is better equipped to assess the impact of shocks.
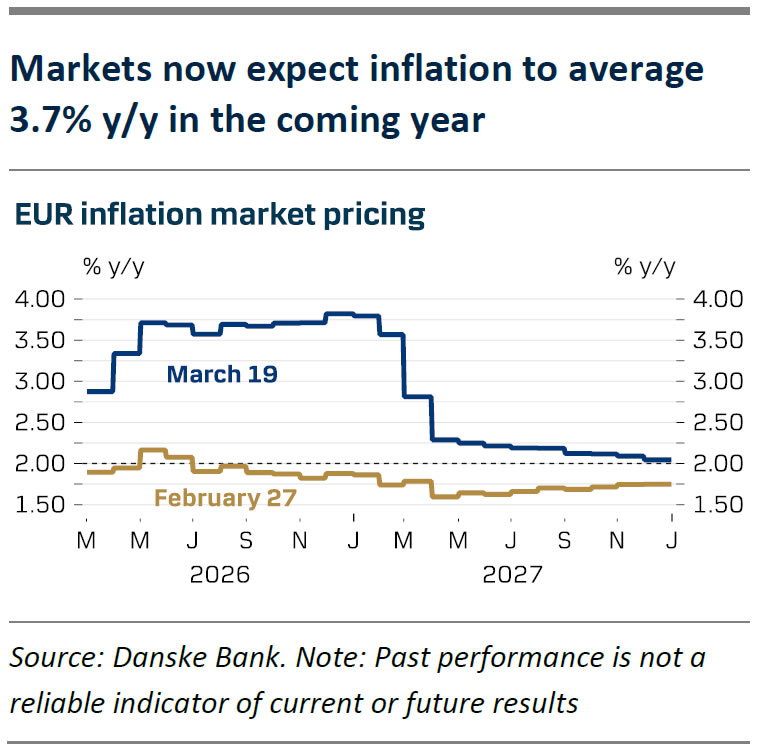
Previously, the ECB expected euro area inflation to be slightly below 2% in 2026 and 2027. Now, the ECB forecasts inflation to peak at 3.1%yr in Q2 and average 2.6%yr for this calendar year. However, these projections are based on financial market variables, including oil and gas prices, as of 11 March which current spot prices materially exceed. Helpfully, the ECB also released stress scenarios that assume more severe energy supply disruptions via the Strait of Hormuz and higher energy prices.
In their ‘adverse scenario’ – which appears closer to current experience – the ECB sees inflation at 3.5%yr for this year, while in the ‘severe scenario’ the ECB’s modelling suggest it could rise as high as 4.4%yr and remain well above target through 2027. The impact on GDP growth appears to be more manageable, but still significant. Under the baseline scenario, 2026 growth is expected to be 0.9%yr, down from 1.2%yr forecast three months ago. It would be 0.3ppt and 0.5ppt lower in the adverse and severe stress scenarios, respectively. As for inflation, under severe, the hit to GDP extends through 2027. The lesson to take from this scenario analysis is not the point estimates themselves, but rather that the impact on both inflation and growth of a loss of supply becomes increasingly non-linear as the duration of the crisis lengthens, as second round and confidence effects are felt. The risk to inflation expectations means that most central banks will initially be focused on price uncertainty near term, then the downside risks for activity as they appear – more so in 2027 than 2026.
The US Dollar Dives after FOMC, Long-Term Reversal Incoming? – Dollar Index (DXY) Outlook
- The US Dollar rallied consequently since the beginning of the US-Iran conflict, supported by the rise in Oil prices
- Now reaching the top of its long-term range, a major reversal could be coming
- Post-FOMC Dollar Index technical analysis
The World's reserve currency has proved once again why, when it all blows up, it all comes back to the Dollar.
The USD serves as the denominator for global commodity trade, so when commodities suddenly appreciate, particularly Crude Oil, it tends to force large currency conversions towards it. Many economic actors rushed to hedge against the conflict by buying more expensive energy commodities, creating a dollar demand cascade.
That's why it's common to see the term 'Petrodollar' in recent days.
But this move could already be over as traders prepare for the second phase of the conflict, after three weeks of consistent gains.
Note: A crazy selloff is currently ongoing in the Dollar as Israel's PM Netanyahu marks the advancement of the conflict, and Hawkish Central Banks lead to a large FX repricing.
The FOMC brought quite a lot of change to markets: Jerome Powell pushed against further rate cuts, citing inflation still too elevated and supply shocks that hurt dovish prospects.
But one thing that drove this move was the fact that he wasn't particularly supportive of rate hikes – which gave bears enough leeway to stop the rush into the Greenback.
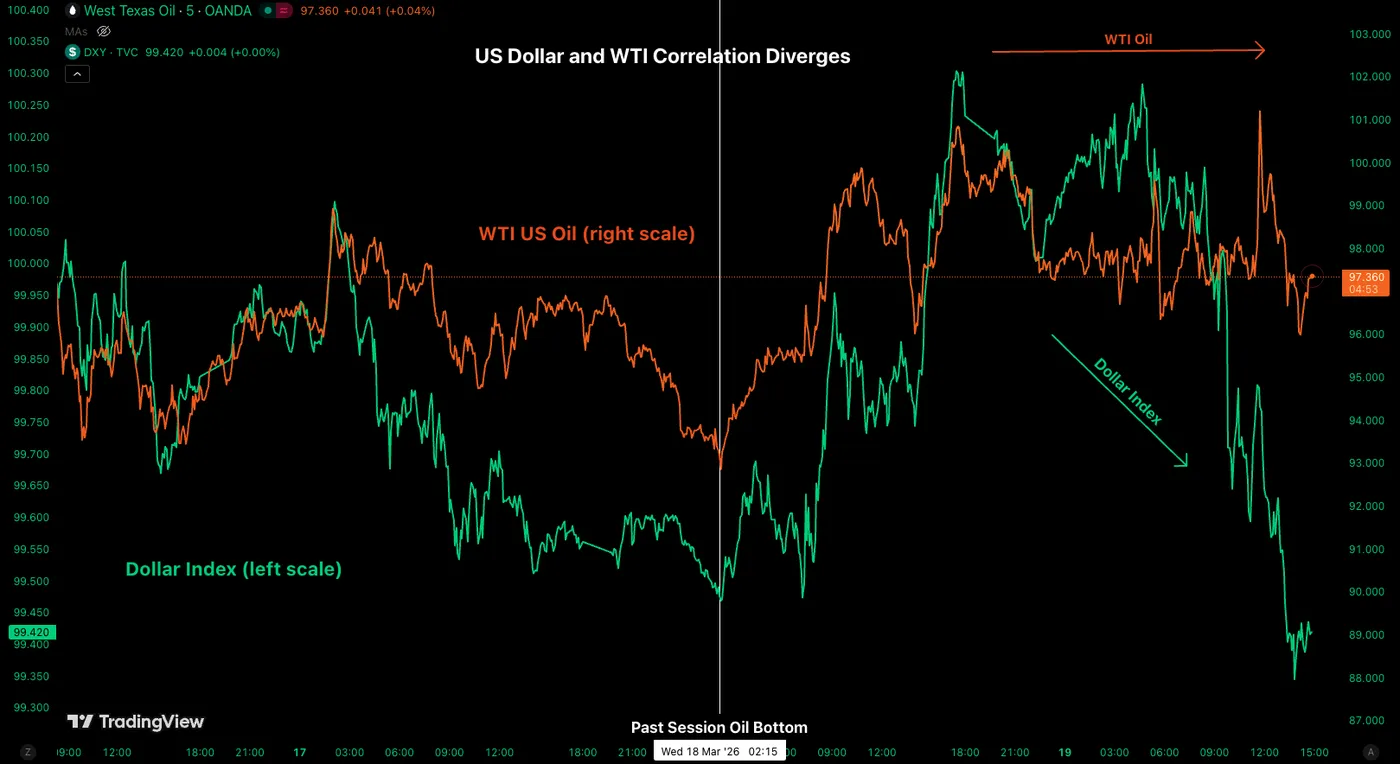
US Dollar and WTI Oil Correlation (breaking) – Source: TradingView
Having now reached the top of its July 2025 range, the US Dollar could now be heading for a large correction. But the range highs aren't the only element marking the change in the recent flows.
The US Dollar and Crude Oil correlation is not as solid as it used to be – so expect to see more of these changes as time goes on.
As you can see on the correlation Chart above, since yesterday, WTI has remained sideways while the US Dollar tumbled – this is a significant change compared to the first half of the month.
We’ll explore the current technical signs arising and more in an in-depth technical analysis of DXY.
Dollar Index (DXY) Multi-Timeframe Analysis
Daily Chart
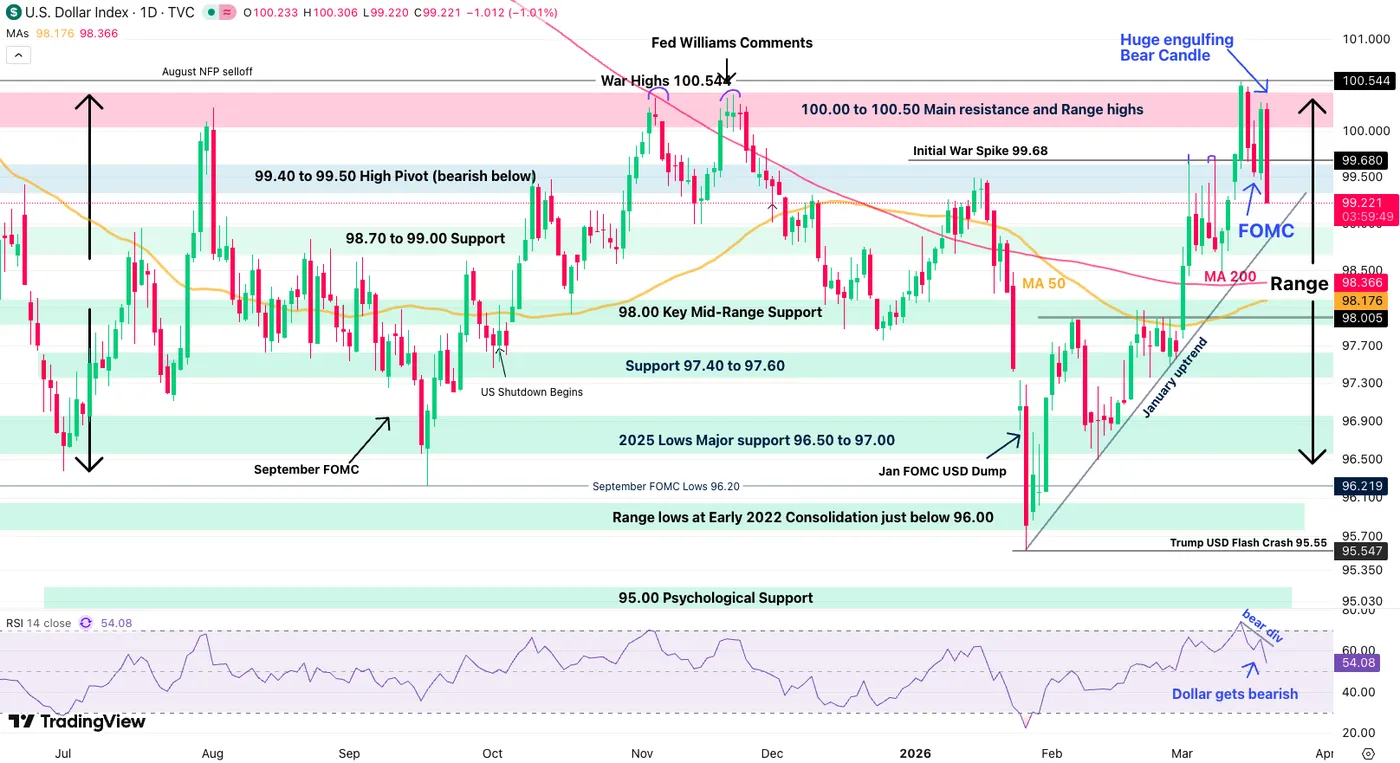
Dollar Index (DXY) Daily Chart. March 19, 2026 – Source: TradingView
Traders who followed my Dollar Analysis since have seen extensively how significant the ongoing range is – No matter how bearish traders and newspapers got on the US Dollar, it refused to break its support.
And now we are rejecting its highs. The ongoing move is spectacular, with an enormous reversal currently ongoing, forming a large bearish engulfing candle which should put back the Dollar into short-term bearish territory.
The long-term range spans from ~96.00 to ~100.00
As a reminder, the Dollar Index serves to get a better idea of what directions to look in other FX pairs like EUR/USD, GBP/USD and others – The rest is for you to find which pairs have the most interest for reversal.
4H Chart and Technical Levels
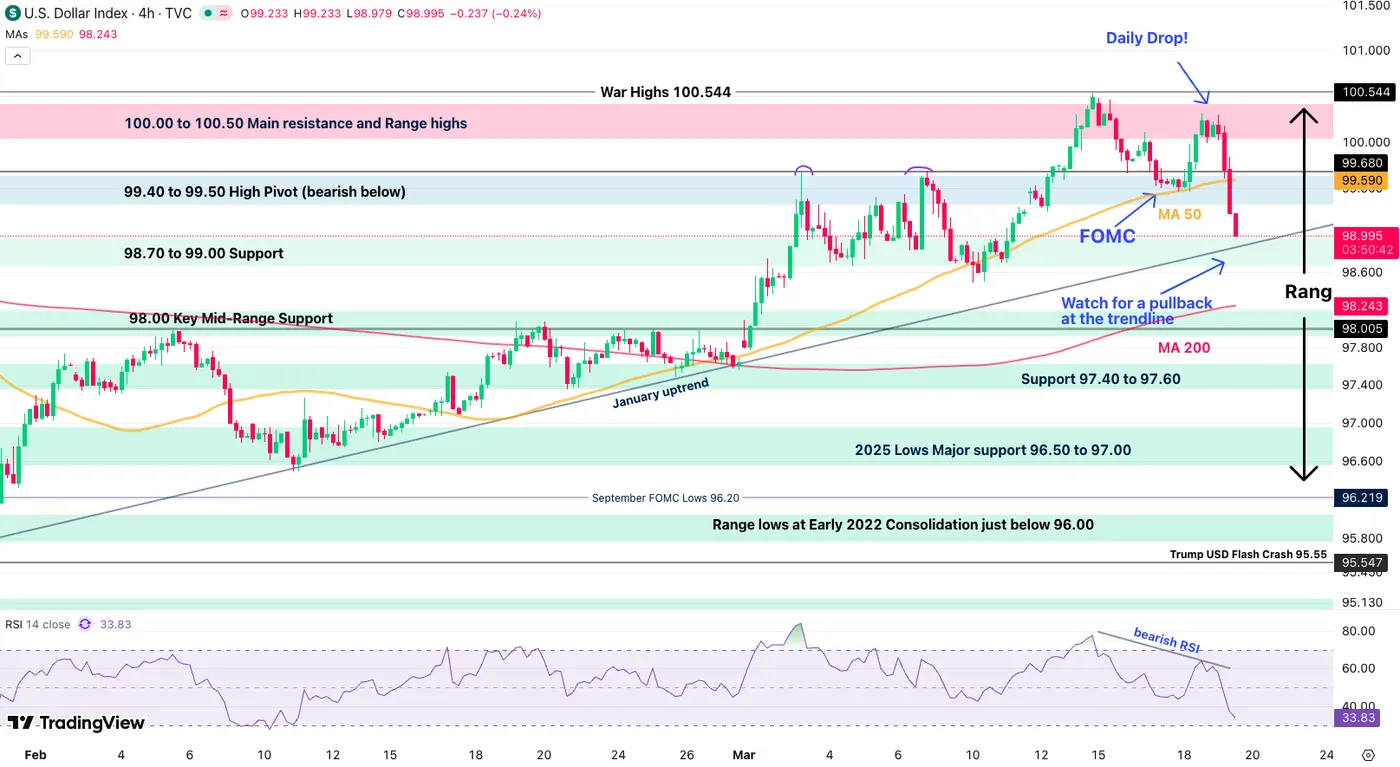
Dollar Index (DXY) 4H Chart. March 19, 2026 – Source: TradingView
The ongoing reversal in the US Dollar is significant! Watch out for reactions to the 99.00 level and January trendline.
A rebound could go retest the 99.40 to 99.50 Pivot Zone. – Going short the US Dollar could be interesting in that event.
Levels to place on your DXY charts:
Resistance Levels
- 100.00 to 100.50 Main resistance and Range highs
- 4H 50-period MA 99.59
- 99.40 to 99.50 High Pivot (bearish below, watch for a retest)
- War Highs 100.544
Support Levels
- 98.70 to 99.00 Support (immediate test – Jan trendline 98.88 + bearish if breaks)
- 98.00 Key Mid-Range Support, below hints at 97.00
- Support 97.40 to 97.60
- 2025 Lows Major support 96.50 to 97.00
- Trump USD Flash Crash 95.55
1H Chart
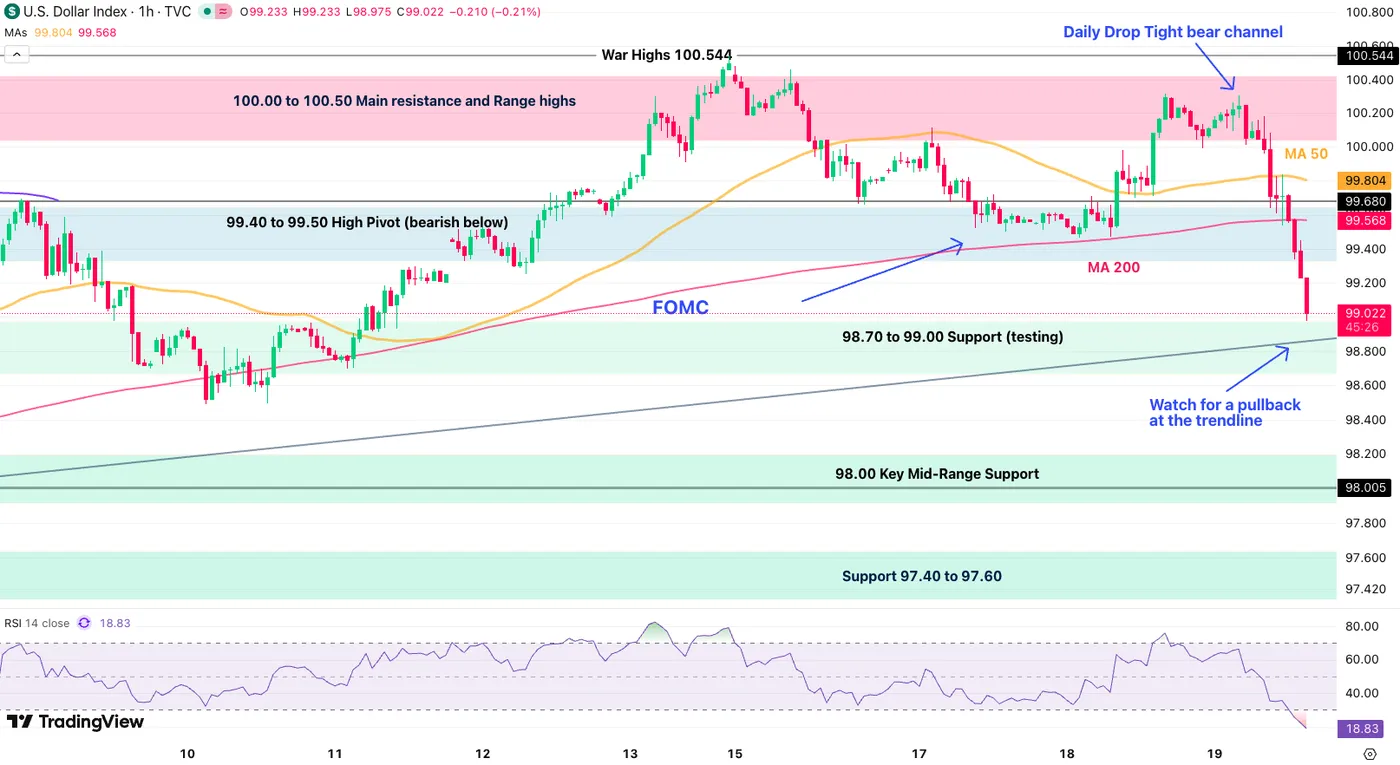
Dollar Index (DXY) 1H Chart. March 19, 2026 – Source: TradingView
The US Dollar is now forming a tight bear channel – Reaching the 99.00 support, a small reversal wouldn't be surprising.
Watch for entry points in other US Dollar FX pairs on pullbacks.
Safe Trades and keep track of the Middle East conflict and WTI!
Crude Oil Price Forecast: Analyzing the Bullish $150 case and Bearish $95 Threat
- Oil prices surged due to an escalation of Middle Eastern hostilities, including Iranian threats to target oil installations in Saudi Arabia, the UAE, and Qatar.
- The Strait of Hormuz is the center of market anxiety
- The outlook is highly dependent on conflict escalation, with technical analysis suggesting a bullish case toward $120–$150 versus a bearish retreat below $95 if diplomatic efforts succeed.
Oil prices surged in early trade today as Brent crude oil prices surged toward a high near the $114 per barrel mark.
The rally, which saw Brent hit a high of $114 and WTI cross the $105 mark, was triggered by a dangerous escalation in Middle Eastern hostilities that now directly threatens the world’s most vital energy infrastructure.
The Catalyst: Attacks on Energy Hearts
The primary driver behind the price spike was a series of kinetic strikes on Iranian oil facilities and the subsequent expansion of the conflict. Reports confirmed Israeli airstrikes targeting Iran's South Pars gas field, but the US and Qatar were not involved, Trump said late Wednesday.
In a retaliatory move that sent shockwaves through trading floors, Iran’s Islamic Revolutionary Guard Corps (IRGC) issued a formal warning that it would target oil installations in Saudi Arabia, the United Arab Emirates (UAE), and Qatar.
Because these three nations represent approximately 20–25% of global crude exports, the threat transformed a regional conflict into a systemic risk for the global economy.
Recent missile and drone attacks have caused major damage to energy facilities across several countries, some of the attacks are listed below:
Qatar: Missiles hit the world’s largest LNG (natural gas) plants and a major Shell facility, stopping production and causing European gas prices to spike.
Saudi Arabia: The military stopped several missiles and drones, but an aerial attack on a refinery in Yanbu briefly disrupted oil shipments.
Kuwait: A drone strike started a fire at a refinery, though it was contained.
For context, Iranian attacks have knocked out 17% of Qatar's liquefied natural gas (LNG) export capacity, causing an estimated $20 billion in lost annual revenue and threatening supplies to Europe and Asia, QatarEnergy's CEO told Reuters on Thursday.
QatarEnergy had declared force majeure on its entire output of LNG, after earlier attacks on its Ras Laffan production hub, which came under fire again on Wednesday.
In response to the rising tension, the Trump administration is reportedly considering sending thousands more US troops to the region to support ongoing operations.
The "Hormuz factor" and regional divergence
At the center of the market's anxiety is the Strait of Hormuz. Roughly 21 million barrels of oil and refined products pass through this narrow waterway daily. With Iran threatening a full blockade and shipping lanes becoming increasingly unsafe, a massive "risk premium" has been baked into every barrel.
Think of it as a "regional divergence" at least that is how the shock is being felt. Asian markets including China, India, and Japan are at the epicenter of the crisis because they rely most heavily on Gulf barrels.
While Western benchmarks like Brent and WTI rose sharply, the physical shortage is currently most acute in Asia due to shipping times. It takes roughly 10–15 days for Gulf oil to reach Asia, whereas rerouted cargoes heading to Europe or the US via the Cape of Good Hope can take up to 45 days.
This "lagged transmission" suggests that while prices are already high, the full impact of the supply disruption has yet to reach the Atlantic basin and thus prices could potentially surge even more if the conflict continues to drag on.
Economic Fallout: From Pumps to Portfolios
The surge to $109 is already manifesting in "creeping price increases" for consumer goods. Transport operators and airlines have already warned of imminent fare hikes, while manufacturers brace for a "margin squeeze."
If prices remain at these levels, the global economy faces a renewed inflationary wave that could force central banks to keep interest rates higher for longer, stifling growth just as many regions were eyeing a recovery.
Outlook: Where to Next?
The trajectory of oil prices now hinges on two critical variables: the duration of the disruption and the risk of further escalation.
The Bullish Case ($120–$150): Technical analysis suggest that if Brent closes decisively above the $113.75 resistance level, the market could rapidly retest the 2022 peaks of $130, with a move toward $150 possible if the Strait of Hormuz is fully closed or if Saudi facilities sustain major damage.
The Bearish Case (Below $95): Conversely, if diplomatic efforts which have so far failed suddenly gain traction, or if the US and its allies announce a massive coordinated release from Strategic Petroleum Reserves (SPR), prices could retreat. A fall below the $97.65 support level would be required to signal that the current "geopolitical fever" is breaking.
Another area to keep an eye on is the US where in order to help lower global energy costs and increase the available supply, US Treasury Secretary Scott Bessent announced on Thursday that the government might lift sanctions on Iranian oil currently stuck on tankers.
By releasing this "stranded" oil into the market, the administration hopes to provide much-needed relief to rising global prices.
For now, the market remains in a state of "physical tightness." With inventory buffers in the West beginning to draw down and no end in sight to the regional war, the path of least resistance for oil prices appears to be higher. Investors and consumers alike should prepare for a volatile second quarter as the world navigates one of the most significant energy disruptions in recent history.
Brent Crude Oil One-Hour Chart, March 2, 2026
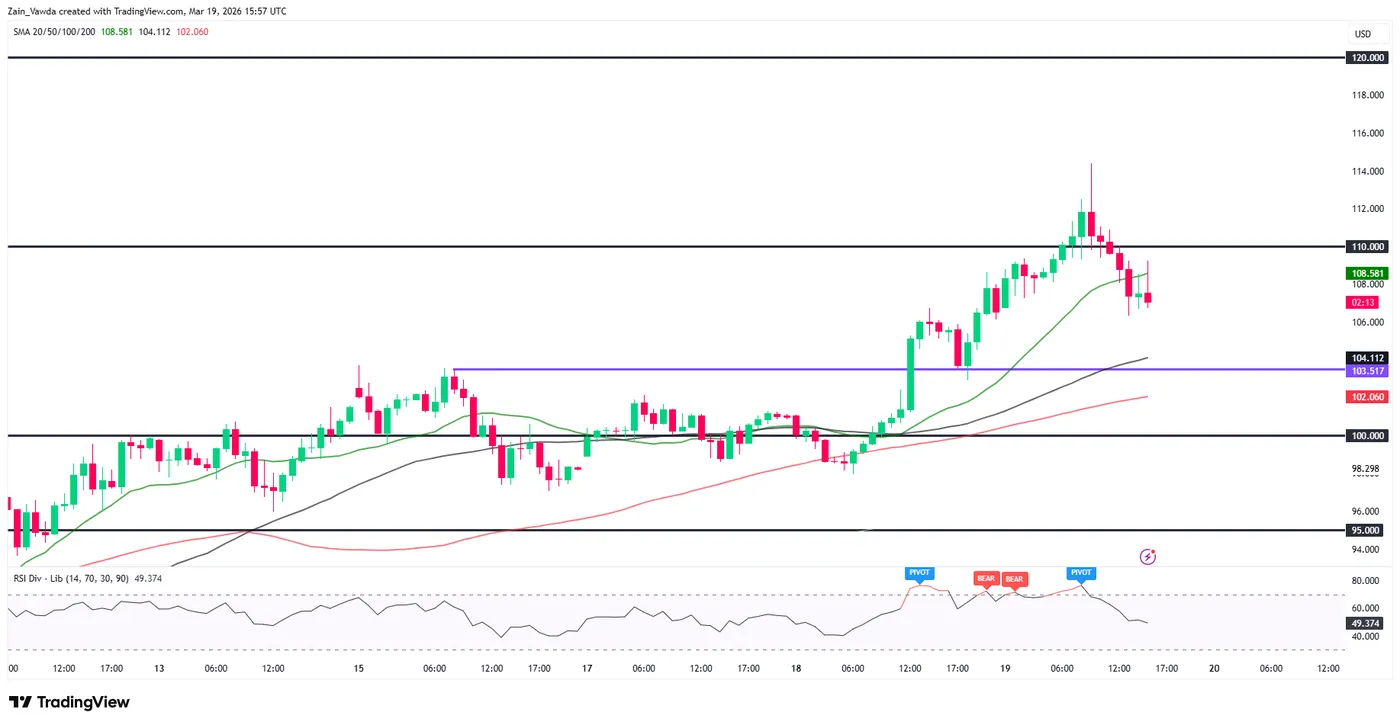
Source: TradingView (click to enlarge)
The Brent Crude H1 chart shows a sharp rejection from the $114.00 level, followingtodays spike. The price has broken below the 20-period SMA (green line), signaling a loss of immediate upward momentum.
Key Technical Observations:
Resistance: The $114.00–$115.00 zone remains a major ceiling. A daily close above this level could open up a run toward the $120 mark and beyond.
Support: Immediate support sits at $104.22 (50-day MA) which also just rests above the key swing high from Monday March 16 at 103.51, followed by the significant psychological level of $102.14 (100-day MA) before the psychological 100.00 mark comes back into play.
RSI: The Relative Strength Index has dropped sharply from overbought territory to 49.37, suggesting the market is cooling off and entering a neutral phase where momentum maybe shifting in favor of bears.
Outlook:
The short-term trend is turning cautiously bearish. If the price fails to hold above $106.00, we could see a deeper retracement toward the $104.22 support level. However, given the geopolitical risks, any further supply shocks could quickly invalidate this technical pullback and push prices back toward $120.00.
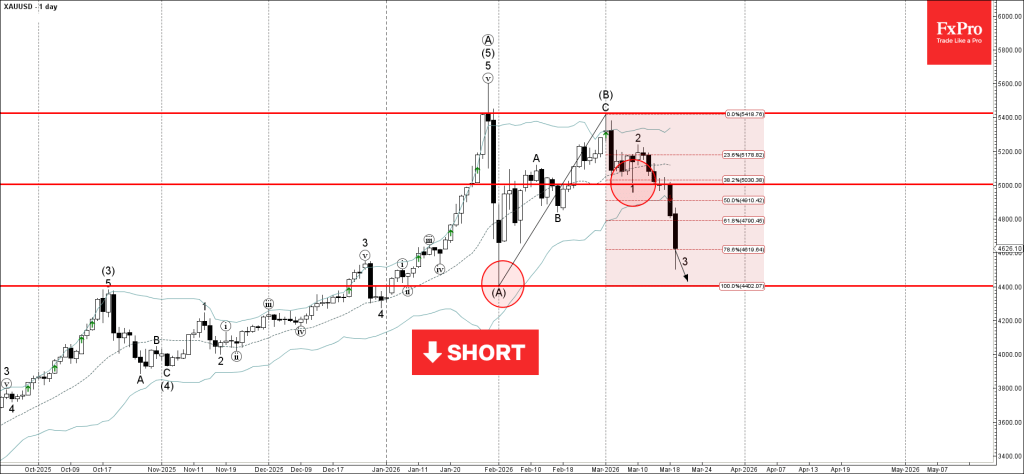
Gold Wave Analysis
Gold: ⬇️ Sell
- Gold broke support zone
- Likely to fall to support level 4400.00
Gold recently broke the support zone between the round support level 5000.00 and the 38.2% Fibonacci correction of the upward wave (B) from the start of February.
The breakout of this support zone accelerated the active minor impulse wave 3, which belongs to the sharp downward impulse wave (C) from last month.
Gold can be expected to fall to the next strong support level 4400.00, low of the previous wave (A) from the start of February.
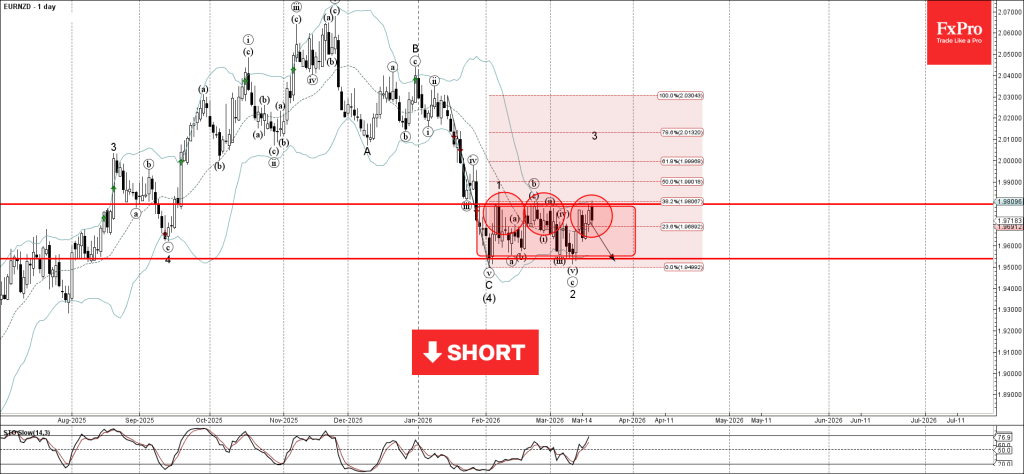
EURNZD Wave Analysis
EURNZD: ⬇️ Sell
- EURNZD reversed from resistance zone
- Likely to fall to support level 1.9535
EURNZD currency pair recently reversed from the resistance zone between the key resistance level 1.9795 (upper border of the sideways price range from February), upper daily Bollinger Band and the 38.2% Fibonacci correction of the downward impulse from January.
The downward reversal from this resistance zone stopped the previous minor impulse wave 3.
EURNZD can be expected to fall to the next support level 1.9535, lower border of the active sideways price range.
ECB Review: ECB Remains Calm; Receive April Meeting
- The ECB decided to leave its key policy rates unchanged with the deposit facility rate at 2.00%, as expected by markets and consensus.
- Lagarde struck a calm and balanced assessment of the implications of higher energy prices, which suggests that the ECB is not in a hurry to hike interest rates.
- We keep our call that the ECB remains unchanged at 2.00% in 2026 and 2027, with risks clearly skewed to the upside. Uncertainty is higher than usual.
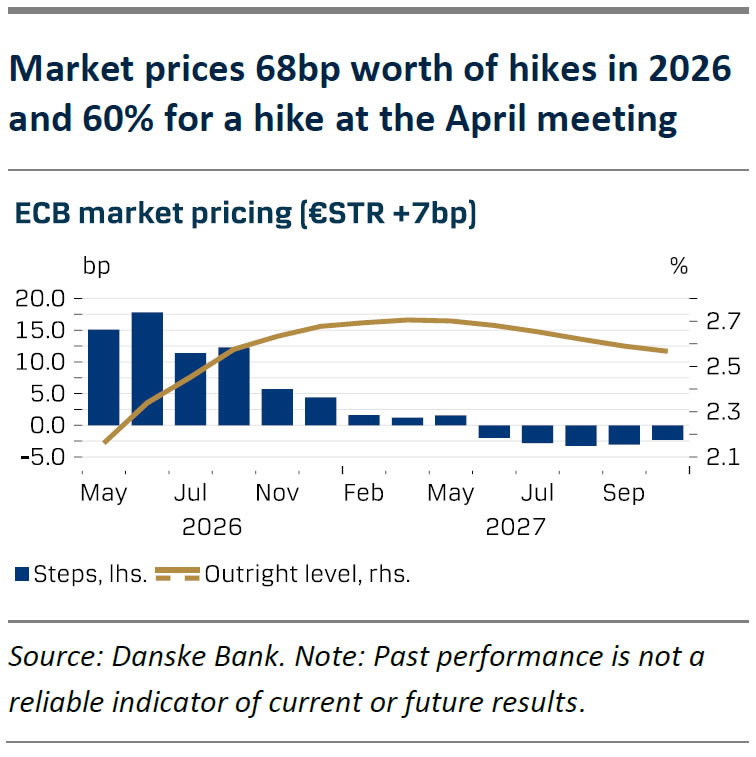
- New trade: We recommend receiving the April26 meeting at 15.5bp, as we see a high bar for the ECB delivering a hike already in April and therefore think riskreward favours a received position.
The ECB left the deposit rate unchanged at 2.00%, as expected by both markets and analysts. Lagarde struck a calm and balanced assessment of the implications of higher energy prices, which suggests that the ECB is not in a hurry to hike interest rates. She explicitly mentioned that the mood in the Governing Council was “calm”, and several times mentioned that longer-term inflation expectations remain anchored. Lagarde did not significantly emphasise the risk of second-round effects on inflation, stating only that they would remain attentive. A key argument for further ECB rate hikes - that the 2022 inflation shock has lowered the threshold for companies to pass on price increases to consumers faster - was raised in the Q&A, but she did not endorse it, saying the ECB now has a better grasp of pass-through and remains dependent on incoming data. She noted the labour market is not as hot as in 2022, while cautioning that consumers and businesses may have a fresher memory, which could increase the pass-through of higher input costs to consumer prices. Overall, we judge her tone as dovish relative to market expectations for ECB hikes heading into the meeting, as she clearly avoided a hawkish stance, which we heard from several members last week.
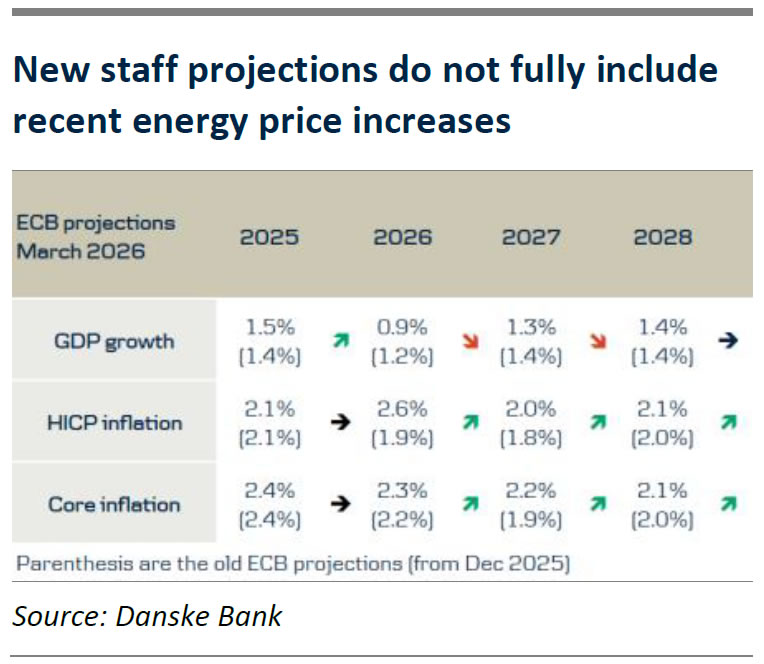
The new staff projections only partially reflect higher oil prices, as the commodity price cut-off was 11 March, implying USD83/barrel in 2026. The scenario analysis is therefore more relevant, especially the ‘adverse scenario’ that aligns most closely with current commodity futures. It assumes oil at USD119/barrel in Q2 26 and USD70 in Q3 27, and gas at EUR87/MWh in Q2 26 and EUR35 in Q3 27. In this case, HICP inflation rises to 3.5% y/y in 2026, then falls swiftly to 2.1% y/y in 2027 and 1.6% y/y in 2028, consistent with a temporary shock. If the ‘adverse scenario’ materialises, which is our base line, this should give the ECB confidence to hold rates steady, since inflation is only temporarily above target and does not affect the medium-term outlook. However, if the ‘severe scenario’ materialises, which includes a prolonged period of higher oil and gas prices with clear second-round effects on core inflation, we expect the ECB to hike policy rates several times. We stress that the uncertainty surrounding the ECB outlook is thus much higher than usual.
New trade: Receive April 2026 meeting at 15.5bp
Following today’s communication from the ECB, we recommend receiving the April26 meeting at 15.5bp (indicative mid, effective start of May) implying a roughly 60/40 probability between the ECB delivering a 25bp hike and keeping rates unchanged. While uncertainty remains high, we think the emphasis on negative growth risks, well-anchored long-term inflation expectations and little emphasis on second-round effects should keep the ECB on hold in the near term with little time until the April meeting. Historically, the ECB has been slow at reacting to shocks, with policy shifts requiring more thorough analysis and factual inflation evidence. With today's communication, we see a high probability that this will also be the case this time around. In sum, we see a high bar for the ECB delivering a hike already in April and therefore think risk-reward favours a received position.
Our baseline is unchanged ECB rates, with a clear upside risk and higher uncertainty
In our base case, we expect rising energy prices to have a temporary effect on the price level, but we expect only small changes to medium-term inflation due to limited pass-through to core. This is also the view of market-based inflation expectations, with the 1y1y inflation swap at 2.10% and 2y2y at 2.09%. We therefore expect the ECB to “look through” the Iran shock as growth is also negatively affected, and subsequently we do not expect the ECB to raise policy rates in 2026 nor 2027. A further rise in energy prices and risks, a significant fiscal response, and more significant second-round effects, constitute clear upside risk to our ECB call.
Eco Data 3/20/26
| GMT | Ccy | Events | Act | Cons | Prev | Rev |
|---|---|---|---|---|---|---|
| 21:45 | NZD | Trade Balance (NZD) Feb | -257M | -740M | -519M | -627M |
| 01:15 | CNY | 1-Y Loan Prime Rate | 3.00% | 3.00% | 3.00% | |
| 01:15 | CNY | 5-Y Loan Prime Rate | 3.50% | 3.50% | 3.50% | |
| 07:00 | GBP | Public Sector Net Borrowing (GBP) Feb | 14.3B | 8.6B | -30.4B | -31.9B |
| 07:00 | EUR | Germany PPI M/M Feb | -0.50% | 0.30% | -0.60% | |
| 07:00 | EUR | Germany PPI Y/Y Feb | -3.30% | -2.70% | -3.00% | |
| 09:00 | EUR | Eurozone Current Account (EUR) Jan | 37.9B | 17.2B | 14.6B | 13.3B |
| 10:00 | EUR | Eurozone Trade Balance (EUR) Jan | 12.1B | 12.8B | 11.6B | 10.3B |
| 12:30 | CAD | Industrial Product Price M/M Feb | 0.40% | 1.10% | 2.70% | |
| 12:30 | CAD | Raw Material Price Index Feb | 0.60% | 2.40% | 7.70% | |
| 12:30 | CAD | New Housing Price Index M/M Feb | 0.30% | -0.20% | -0.40% | |
| 12:30 | CAD | Retail Sales M/M Jan | 1.10% | 1.40% | -0.40% | |
| 12:30 | CAD | Retail Sales ex Autos M/M Jan | 0.80% | 1.20% | 0.10% |
| 21:45 | NZD |
| Trade Balance (NZD) Feb | |
| Actual | -257M |
| Consensus | -740M |
| Previous | -519M |
| Revised | -627M |
| 01:15 | CNY |
| 1-Y Loan Prime Rate | |
| Actual | 3.00% |
| Consensus | 3.00% |
| Previous | 3.00% |
| 01:15 | CNY |
| 5-Y Loan Prime Rate | |
| Actual | 3.50% |
| Consensus | 3.50% |
| Previous | 3.50% |
| 07:00 | GBP |
| Public Sector Net Borrowing (GBP) Feb | |
| Actual | 14.3B |
| Consensus | 8.6B |
| Previous | -30.4B |
| Revised | -31.9B |
| 07:00 | EUR |
| Germany PPI M/M Feb | |
| Actual | -0.50% |
| Consensus | 0.30% |
| Previous | -0.60% |
| 07:00 | EUR |
| Germany PPI Y/Y Feb | |
| Actual | -3.30% |
| Consensus | -2.70% |
| Previous | -3.00% |
| 09:00 | EUR |
| Eurozone Current Account (EUR) Jan | |
| Actual | 37.9B |
| Consensus | 17.2B |
| Previous | 14.6B |
| Revised | 13.3B |
| 10:00 | EUR |
| Eurozone Trade Balance (EUR) Jan | |
| Actual | 12.1B |
| Consensus | 12.8B |
| Previous | 11.6B |
| Revised | 10.3B |
| 12:30 | CAD |
| Industrial Product Price M/M Feb | |
| Actual | 0.40% |
| Consensus | 1.10% |
| Previous | 2.70% |
| 12:30 | CAD |
| Raw Material Price Index Feb | |
| Actual | 0.60% |
| Consensus | 2.40% |
| Previous | 7.70% |
| 12:30 | CAD |
| New Housing Price Index M/M Feb | |
| Actual | 0.30% |
| Consensus | -0.20% |
| Previous | -0.40% |
| 12:30 | CAD |
| Retail Sales M/M Jan | |
| Actual | 1.10% |
| Consensus | 1.40% |
| Previous | -0.40% |
| 12:30 | CAD |
| Retail Sales ex Autos M/M Jan | |
| Actual | 0.80% |
| Consensus | 1.20% |
| Previous | 0.10% |