

Sample Category Title
Canada: Retail Sales Rebound in January, Continue to Rise in February
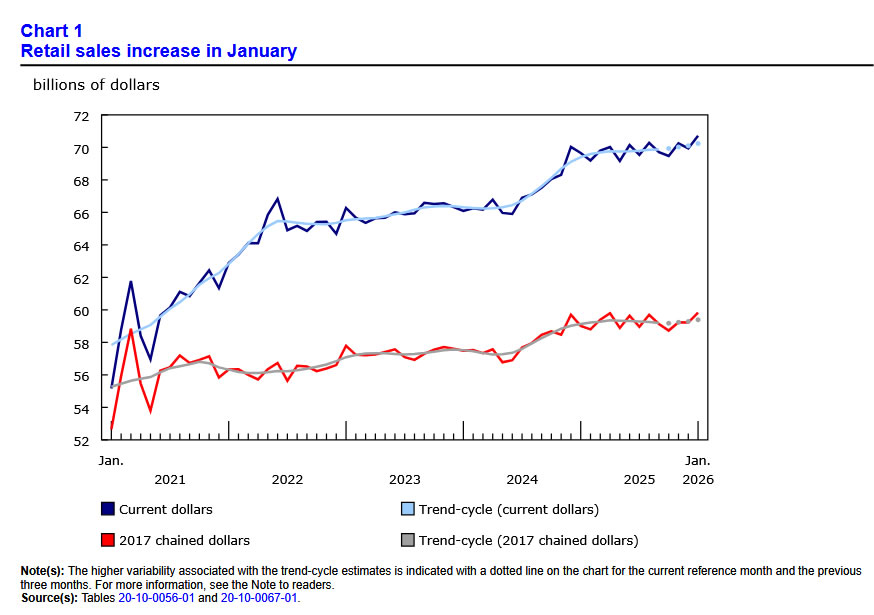
Retail sales rose 1.1% month-on-month (m/m) in January, coming in below Statistics Canada’s advance estimate of 1.5%.
In real terms, sales volumes increased 1.0% m/m, suggesting the gain was largely driven by higher activity rather than prices.
Auto sales rebounded, rising 2.0% m/m, driven by new car dealers (+2.5% m/m), marking the first increase in three months.
Receipts at gasoline stations and fuel vendors declined 0.4% m/m in both nominal and volume terms, pointing to weaker demand.
Core retail sales—excluding motor vehicles and gasoline—also strengthened, rising 0.9% m/m and starting the year on firmer footing.
- Gains were led by general merchandise retailers (+3.0% m/m), miscellaneous store retailers (+3.0% m/m), health and personal care stores (+1.2% m/m), and sporting goods and hobby stores (+1.0% m/m).
- The main laggard was food and beverage stores (-0.6% m/m), with declines also evident in real terms, suggesting softer demand.
Retail e-commerce sales rose 1.5% m/m in January.
Looking ahead, Statistics Canada’s advance estimate points to a further 0.9% m/m increase in February.
Key Implications
Consumers loosened their purse strings to start the year, with retail sales rising in January and early indications pointing to continued demand in February. Momentum in services spending appears intact, based on our internal credit and debit card data, likely supported by higher-income households with greater financial buffers. This keeps our outlook for Q1 real consumption growth at a relatively healthy 1.1% (quarter-on-quarter, annualized).
That said, the retail report is inherently backward-looking and, in this case, feels particularly in the rear-view day by day. New headwinds – from higher prices at the pump to financial market volatility – risk weighing on demand through both higher costs and a potential reversal of wealth effects.
USD/JPY Mid-Day Outlook
Daily Pivots: (S1) 156.84; (P) 158.38; (R1) 159.25; More...
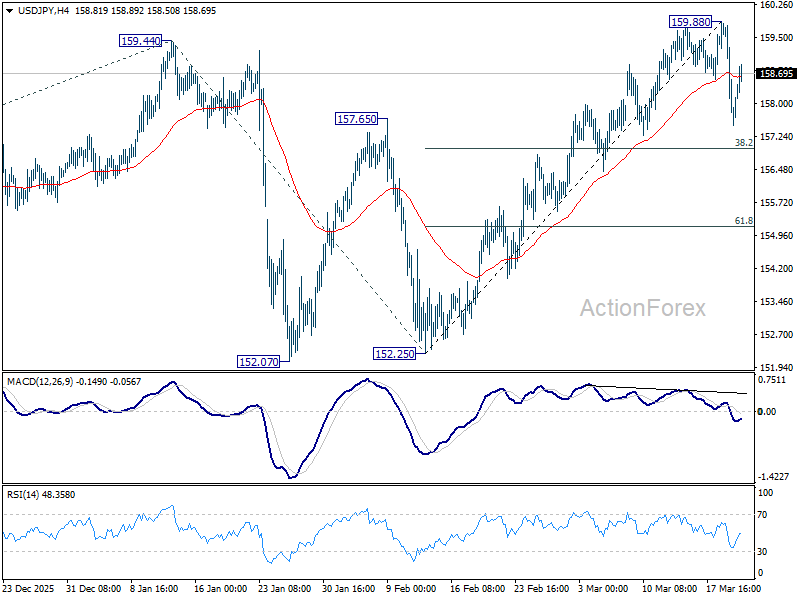
No change in USD/JPY's outlook. Correction from 159.88 is expected to extend lower to 38.2% retracement of 152.25 to 159.88 at 156.96. For now, near term outlook will be neutral with risk on the downside as long as 159.88 resistance holds, in case of recovery.
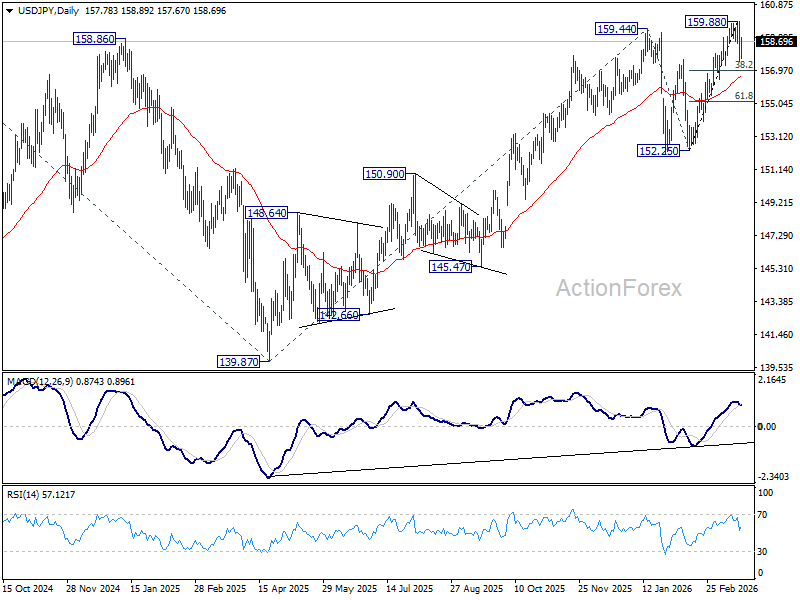
In the bigger picture, outlook is unchanged that corrective pattern from 161.94 (2024 high) should have completed with three waves at 139.87. Larger up trend from 102.58 (2021 low) could be ready to resume through 161.94. This will remain the favored case as long as 55 W EMA (now at 152.70) holds. Firm break of 161.94 will pave the way to 61.8% projection of 102.58 to 161.94 from 139.87 at 176.75.
USD/CHF Mid-Day Outlook
Daily Pivots: (S1) 0.7840; (P) 0.7899; (R1) 0.7942; More….
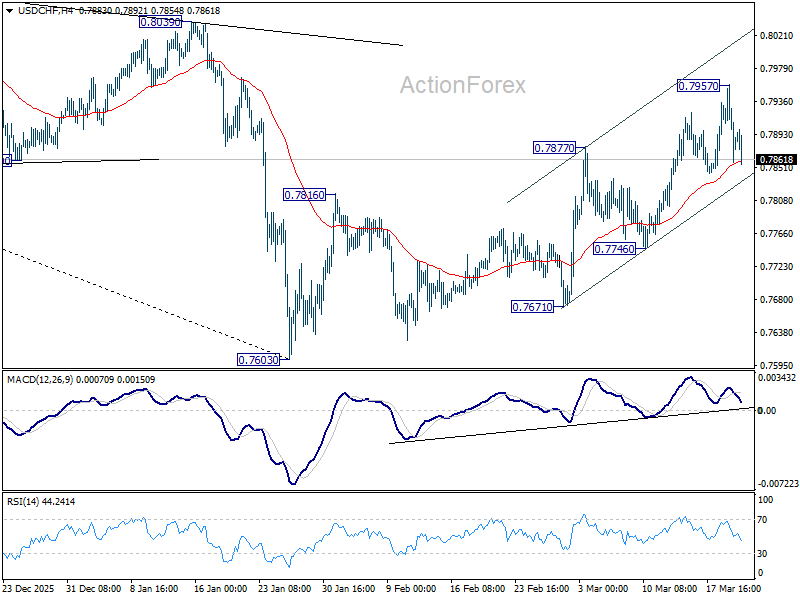
Intraday bias in USD/CHF remains neutral and some more consolidations would be seen below 0.7957. Further rally is in favor as long as 0.7746 support holds. Rise from 0.7603 is seen as correcting the whole down trend from 0.9200. Above 0.7957 will target 38.2% retracement of 0.9200 to 0.7603 at 0.8213.
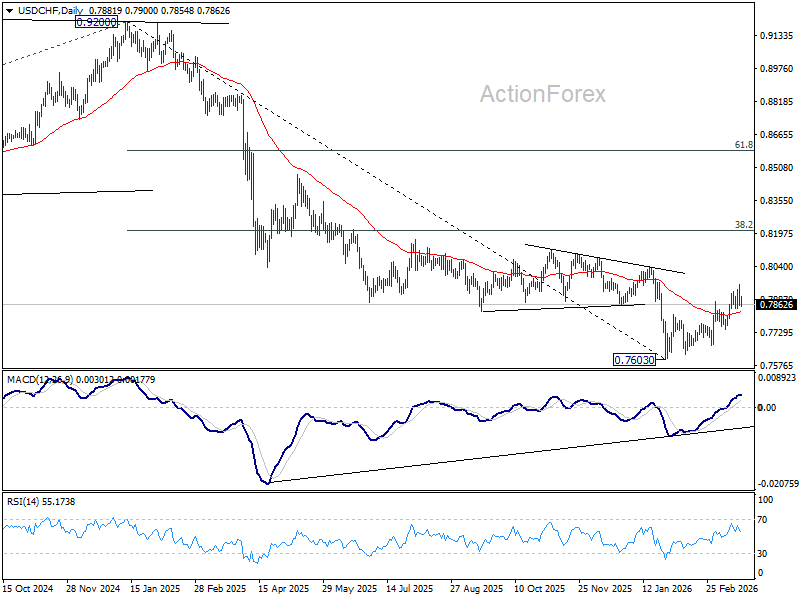
In the bigger picture, a medium term bottom should be in place at 0.7603 on bullish convergence condition in D MACD. Rebound from there is seen as correcting the fall from 0.9200 only. However, decisive break of 55 W EMA (now at 0.8091) will suggest that it's probably correcting the larger scale down trend from 1.0146 (2022 high). On the other hand, rejection by the 55 W EMA will setup down trend resumption to 100% projection of 1.0146 (2022 high) to 0.8332 from 0.9200 at 0.7382 at a later stage.
GBP/USD Mid-Day Outlook
Daily Pivots: (S1) 1.3295; (P) 1.3382; (R1) 1.3517; More...
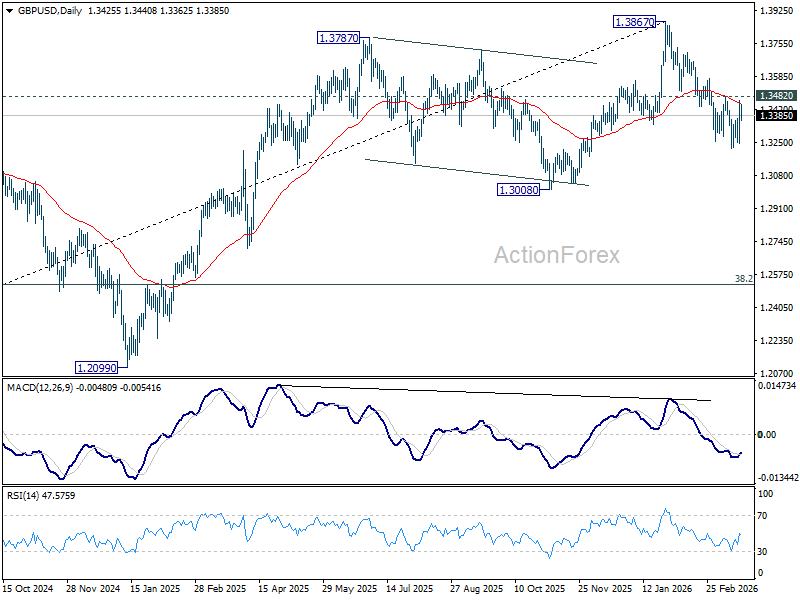
Intraday bias in GBPUSD remains neutral for the moment. With 1.3482 resistance intact, further decline remains in favor. On the downside, below 1.3216 will resume the fall from 1.3867 to 1.3008 structural support. However, decisive break of 1.3482 will argue that the fall from 1.3867 has completed, and turn bias back to the upside for 61.8% retracement of 1.3867 to 1.3216 at 1.3618.
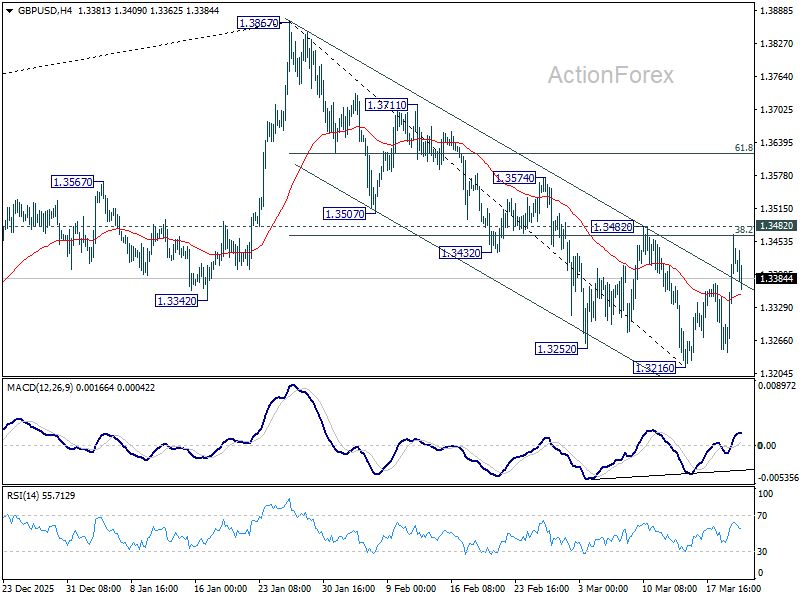
In the bigger picture, considering bearish divergence condition in both D and W MACD, a medium term top should be in place from 1.3867. Firm break of 1.3008 support will argue that fall from 1.3867 is at least correcting the rise from 1.0351 (2022 low) with risk of bearish reversal. That would open up further decline to 38.2% retracement of 1.0351 to 1.3867 at 1.2524. For now, medium term outlook will be neutral at best as long as 1.3867 resistance holds, or under further development.
EUR/USD Mid-Day Outlook
Daily Pivots: (S1) 1.1488; (P) 1.1518; (R1) 1.1570; More….
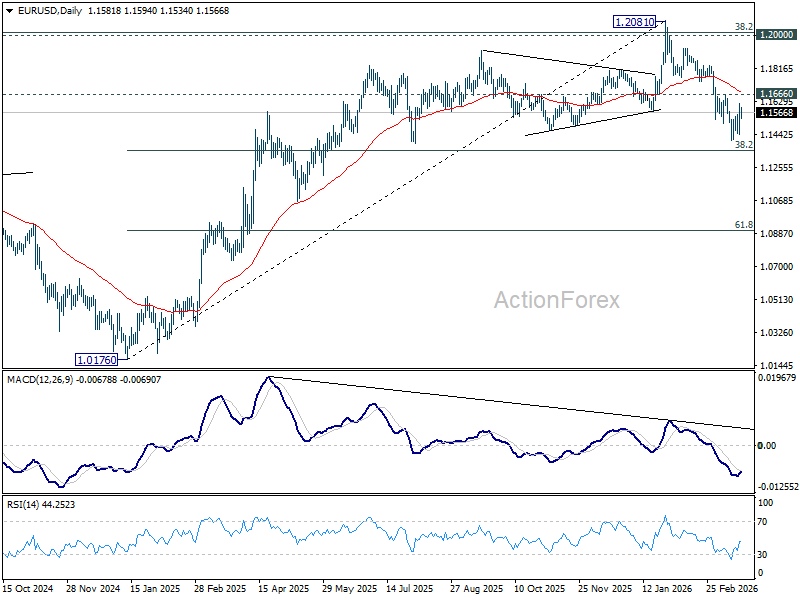
EUR/USD is still bounded in established range trading and intraday bias remains neutral. Further decline is in favor as long as 1.1666 resistance holds. On the downside, below 1.1408 will resume the fall from 1.2081 to 38.2% retracement of 1.0176 to 1.2081 at 1.1353. However, decisive break of 1.1666 will argue that the fall from 1.2081 has completed, and turn bias back to the upside for 61.8% retracement of 1.2081 to 1.1408 at 1.1824.
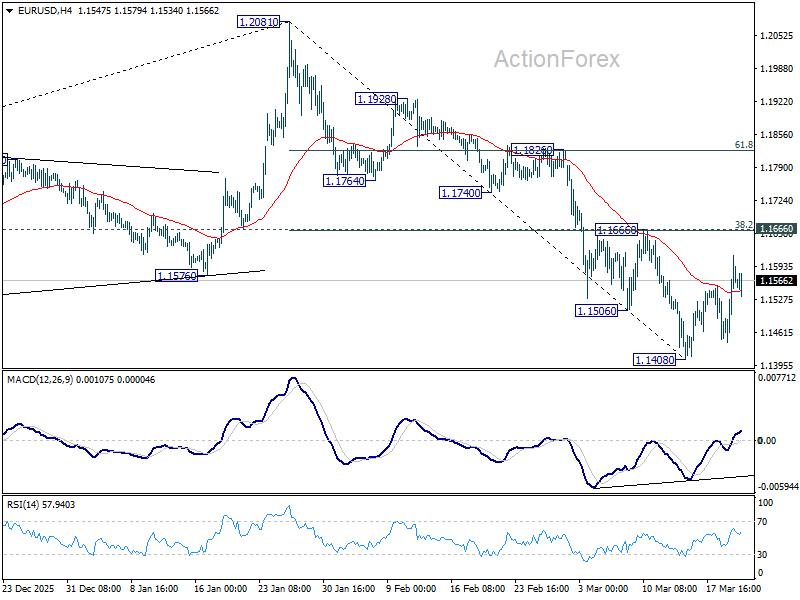
In the bigger picture, the break of 55 W EMA (now at 1.1495) confirms rejection by 1.2 key cluster resistance level. The whole up trend from 0.9534 (2022 low) might have completed as a three wave corrective rise too. In either case, deeper fall is now expected to long term channel support (now at 1.0528. Risk will stay on the downside as long as 1.2081 holds, in case of recovery.
Euro Gains on ECB Hike Bets but Lacks Breakout Without Policy Action
ECB rate hike expectations are gaining traction in markets, with growing speculation that tightening could begin as early as April. Major institutions including Barclays and J.P. Morgan are now forecasting an initial move next month, followed by additional hikes in June and July, reflecting a rapid shift in policy expectations amid rising inflation risks.
Other banks remain slightly more cautious on timing but not direction. Morgan Stanley and Deutsche Bank both expect hikes starting in mid-year, while Goldman Sachs’ adverse scenario outlines a cumulative 75bps tightening path, with the possibility that April could still mark the beginning if energy-driven inflation intensifies further.
This repricing comes even as the ECB kept its deposit rate unchanged at 2.00% in the latest meeting. However, the updated projections told a different story, with 2026 inflation revised up to 2.6% while growth was cut sharply to 0.9%. This marks a clear shift away from the previous “goldilocks” environment toward a more challenging stagflation backdrop.
The ECB’s communication also underscored this transition. By publishing adverse and severe scenarios, policymakers effectively signaled readiness to act if energy prices remain elevated. The message was clear: while the baseline does not yet justify an immediate hike, contingency plans are firmly in place.
Within the Governing Council, three distinct camps have emerged. The hawks, led by Bundesbank President Joachim Nagel, are increasingly concerned about inflation expectations becoming unanchored and have openly warned that a more restrictive stance may soon be required.
In contrast, centrists such as France's Francois Villeroy de Galhau and Finland's Olli Rehn are urging caution. They emphasize the need to avoid overreacting to supply-side shocks, arguing that short-term energy-driven inflation should not automatically trigger aggressive tightening.
Meanwhile, the data-dependent camp, represented by Spain’s Jose Luis Escriva, continues to advocate a meeting-by-meeting approach. This group highlights the high degree of uncertainty surrounding the persistence of the energy shock and its transmission into core inflation.
Despite these internal divisions, markets are clearly leaning toward the hawkish interpretation. The shift in rate expectations has provided support for the Euro, which is among the stronger performers this week, particularly against the Swiss Franc.
The Franc’s weakness is partly policy-driven, as the SNB has stepped up its intervention rhetoric to prevent excessive appreciation. This has created a favorable backdrop for EUR/CHF, amplifying Euro strength beyond what ECB expectations alone would justify.
However, against the Dollar, the Euro’s gains remain more tentative. Price action is still capped below key resistance levels, suggesting the move may be corrective rather than the start of a sustained uptrend. For a more decisive shift, The market might need to see the ECB actually step closer to execute one of those 25 bps hikes.
In Europe, at the time of writing, FTSE is up 0.10%. DAX is up 0.07%. CAC is up 0.19%. UK 10-year yield is up 0.085 at 4.869. Germany 10-year yield is up 0.01 at 2.973. Earlier in Asia, Japan was on holiday. Hong Kong HSI fell -0.88%. China Shanghai SSE fell -1.24%. Singapore Strait Times fell -0.38%.
Canada retail sales rise 1.1% mom but miss expectations
Retail sales rose 1.1% in January, missing forecasts, but core spending remained firm with solid gains in general merchandise. February data points to continued steady momentum. Read more.
EU trade contracts sharply, US exports drag
Eurozone trade weakens: Exports fell -7.6% yoy, imports -7.3% yoy, resulting in a EUR 1.9B deficit; intra-Eurozone trade also declined, signaling soft internal demand. Read more.
NZ exports hit by soft China and Japan demand
NZ’s trade balance slipped into deficit as exports to China and Japan declined while imports surged. Soft Asian demand and rising external imbalance could weigh further on NZD. Read more.
EUR/USD Mid-Day Outlook
Daily Pivots: (S1) 1.1488; (P) 1.1518; (R1) 1.1570; More….
EUR/USD is still bounded in established range trading and intraday bias remains neutral. Further decline is in favor as long as 1.1666 resistance holds. On the downside, below 1.1408 will resume the fall from 1.2081 to 38.2% retracement of 1.0176 to 1.2081 at 1.1353. However, decisive break of 1.1666 will argue that the fall from 1.2081 has completed, and turn bias back to the upside for 61.8% retracement of 1.2081 to 1.1408 at 1.1824.
In the bigger picture, the break of 55 W EMA (now at 1.1495) confirms rejection by 1.2 key cluster resistance level. The whole up trend from 0.9534 (2022 low) might have completed as a three wave corrective rise too. In either case, deeper fall is now expected to long term channel support (now at 1.0528. Risk will stay on the downside as long as 1.2081 holds, in case of recovery.
Canada retail sales rise 1.1% mom but miss expectations
Canada’s retail sales rose 1.1% mom to CAD 70.7B in January, falling short of expectations for a stronger 1.4% increase. The gain was nevertheless broad-based, with six of nine subsectors posting growth, led by motor vehicle and parts dealers.
Core retail sales, which strip out volatile components such as gasoline and autos, rose a solid 0.9% on the month. The increase was driven primarily by general merchandise retailers, where sales jumped 3.0%, marking a fourth consecutive monthly gain. This points to underlying strength in discretionary spending.
Looking ahead, Statistics Canada’s advance estimate indicates that retail sales rose another 0.9% mom in February, suggesting steady momentum into Q1.
EU trade contracts sharply, US exports drag
Eurozone trade data for January painted a weak start to the year, with both exports and imports contracting sharply. Exports fell -7.6% yoy to EUR 215.2B, while imports dropped -7.3% yoy to EUR 217.2B, leaving a EUR -1.9B deficit. Intra-Eurozone trade also softened, declining -3.3% yoy to EUR 213.1B, pointing to subdued demand both within the bloc and externally.
At the broader EU level, the deterioration was even more pronounced. Exports plunged -10.0% yoy to EUR 189.2B, while imports fell -9.0% yoy to EUR 195.1B, resulting in a EUR -5.9B deficit. The decline in trade flows suggests that the slowdown in global demand is weighing heavily on European exporters, even as weaker imports reflect cooling domestic activity.
A closer look at trading partners highlights the uneven nature of the downturn. Exports to the US dropped sharply by -27.8% yoy, driving a significant narrowing in the surplus with the US to EUR 9.2B from EUR 18.1B a year earlier. Trade with China remained deeply negative, with the deficit widening slightly to EUR -32.5B. By contrast, trade with the United Kingdom and Switzerland proved relatively resilient, though still showing modest declines.
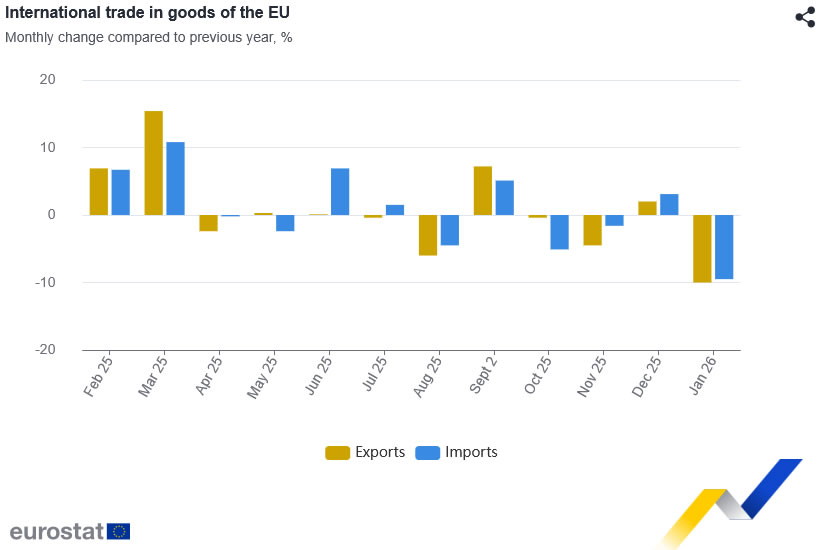
Chart Alert: Watch 157.40 on USD/JPY, Hawkish BoJ, ECB and BoE Ignite Yen Strength
Key takeaways
- Relative policy dynamics driving FX moves: USD/JPY weakness highlights that USD strength is not absolute, hawkish signals from the European Central Bank and Bank of England offset Fed expectations, pushing the US dollar lower.
- Hawkish tilt from BoJ supports yen strength: Despite holding rates, Bank of Japan Governor Ueda’s comments on wages and inflation signal a potential hike path, reinforcing upside pressure on the yen.
- Technical downside risk building: USD/JPY is at risk of further decline below 157.40–157.50 support (20-day MA), exposing 156.55, while failure to reclaim 159.37 resistance keeps the near-term bearish bias intact.
In the world of foreign exchange, we measured performance on a relative basis in terms of price action structures and macro factors.
A hawkish stance or guidance from the US Federal Reserve does not necessarily result in sustained US dollar strength, as the currency’s trajectory is ultimately shaped by relative monetary policy dynamics across other major developed market central banks.
The ex-post 18 March’s FOMC US dollar strength pop due to Fed funds futures market now pricing in no interest rate cuts by the Fed in 2026 was evaporated yesterday, reinforced by hawkish guidance from the European Central Bank (ECB) and the Bank of England (BoE) despite keeping their respective policy rates unchanged at 2% and 3.75%.
Ex-post FOMC US dollar strength evaporated
Interest swap markets in the Eurozone and the UK have started to price in two 25 basis points (bps) hikes this year, each by the ECB and the BoE, due to their concerns on inflation risks arising from the slowdown driven by stagflation fear driven by the oil supply shock coming out from the Middle East (US-Iran War).
The US Dollar Index shed -1.1% on Thursday, 19 March 2026, erased the prior day's gain of 0.7% (ex-post FOMC), and the USD/JPY fared slightly worse off with a daily loss of 1.3%.
The Bank of Japan (BoJ) left its policy interest rate unchanged 0.75%, and we have warned in our BoJ monetary preview report published earlier on Wednesday, 18 March, that BoJ Governor Ueda’s press conference that tends to tilt towards dovish vibes more often based on past conferences, is likely not to trigger a bout of strength in the USD/JPY this time round.
BoJ Ueda’s hawkish press conference
BoJ Governor Ueda highlighted in the post-monetary policy decision press conference that the current spring wage talks have been delivering high chances of another year of wage increases.
He also noted that authorities need to keep monitoring the impact of currency movements on consumer prices, as FX moves now may have more impact on prices than before.
These statements are considered hawkish that suggests BoJ is still on the path of one interest rate hike before 2026 ends.
Let’s focus now on the short-term trajectory (1 to 3 days) of the USD/JPY from a technical analysis perspective.
USD/JPY – At risk of breaking below 20-day moving average
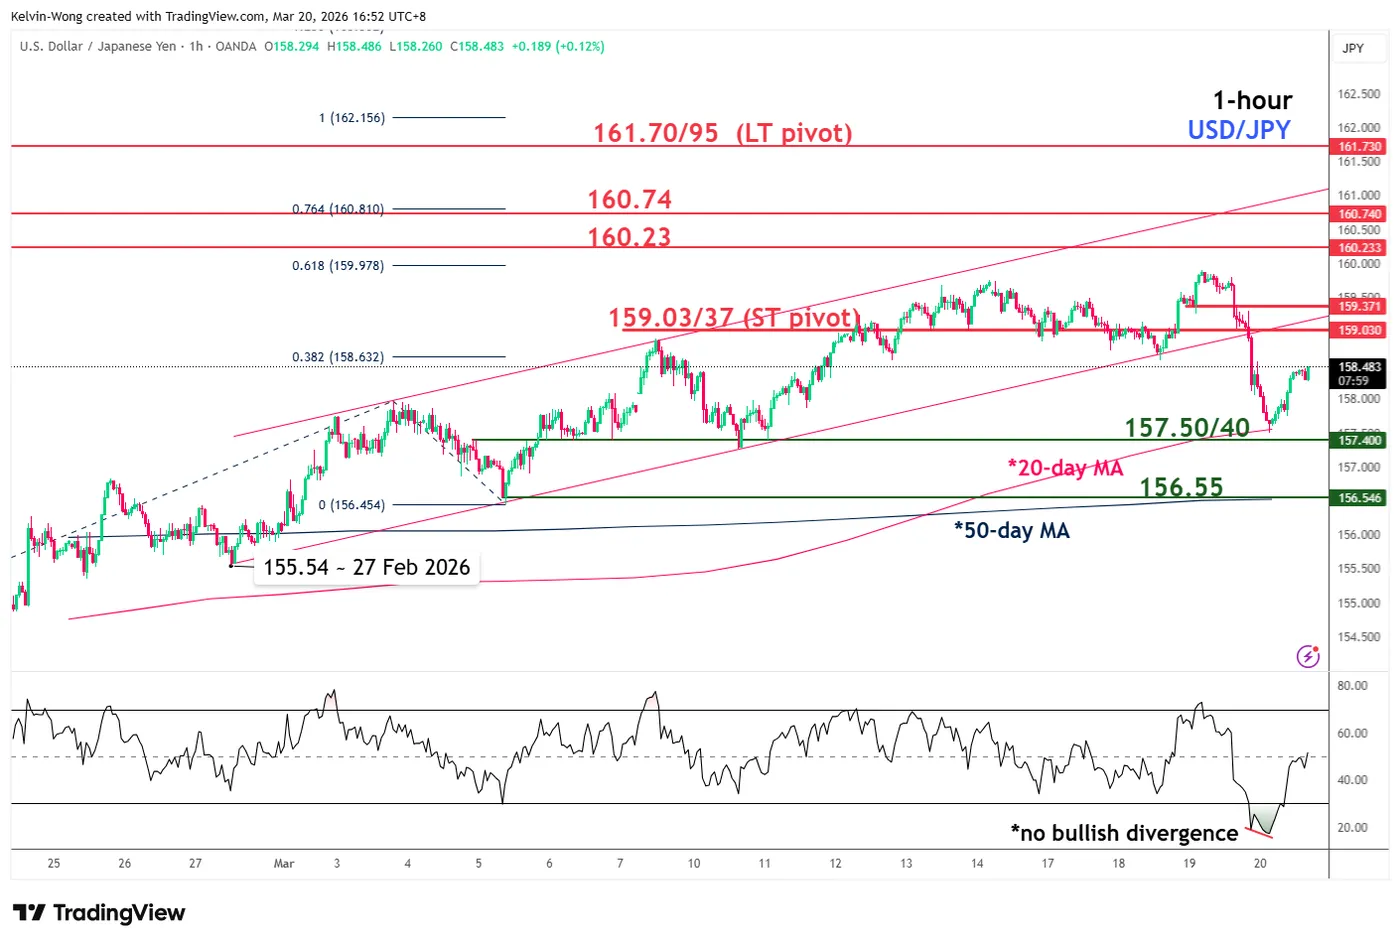
Fig. 1: USD/JPY minor trend as of 20 Mar 2026 (Source: TradingView)
Watch the 159.03/159.37 key short-term pivotal resistance, and a break below 157.50/157.40 (also the 20-day moving average) exposes the next intermediate support at 156.55 (also the 50-day moving average) in the first step.
On the flip side, a clearance above 159.37 invalidates the bearish bias for a squeeze up towards the next intermediate resistances at 160.23 and 160.74 (also the intervention risk zone where BoJ sold USD against JPY in the past).
Key elements to support the bearish bias on USD/JPY
- The price actions of the USD/JPY have broken down below the minor ascending channel support from the 27 February 2026 low of 155.54.
- The hourly RSI momentum indicator has exited from the oversold region without any bullish divergence condition, which suggests that the current bounce from Thursday, 19 March 2026, low of 157.51 is a minor corrective rebound within a minor downtrend phase.
GBP/USD Rises Following Bank of England Decision
Yesterday, the Bank of England’s decision had a significant impact on the pound, which strengthened against other currencies. Although the Official Bank Rate remained unchanged at 3.75%, the market was surprised by the “hawkish” signals, which sharply contrasted with the dovish statements made at the February meeting.
According to media reports:
- → None of the nine committee members voted to cut the rate;
- → The phrase stating that the rate “could be lowered in the future” was removed from the final statement.
Thus, the Bank of England indicated that it is ready to raise rates if the energy shock caused by the Middle East conflict accelerates inflation.
The hawkish stance contributed to the pound rising above the upper boundary of the channel in which it had been trading since late January.
Technical Analysis – GBP/USD
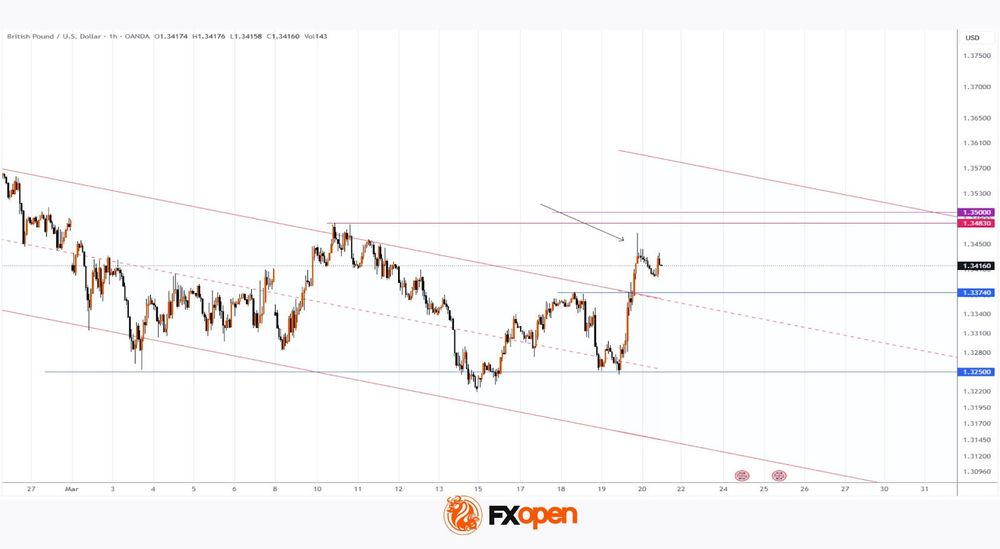
Movements in GBP/USD during March suggest that 1.3250 serves as an important support level. Additionally, following yesterday’s news, bulls may find support around 1.3374, where:
- → On 18 March, the market encountered resistance;
- → The upper boundary of the channel was broken yesterday.
On the other hand, the long upper wick on yesterday’s candle (as indicated by the arrow) points to bear activity. Even if the bullish momentum has not yet exhausted itself, further gains in GBP/USD may face resistance at higher levels, including:
- → Psychological level at 1.3500;
- → The high of 10 March;
- → The upper boundary of the expanded double red descending channel.
Trade over 50 forex markets 24 hours a day with FXOpen. Take advantage of low commissions, deep liquidity, and spreads from 0.0 pips (additional fees may apply). Open your FXOpen account now or learn more about trading forex with FXOpen.
This article represents the opinion of the Companies operating under the FXOpen brand only. It is not to be construed as an offer, solicitation, or recommendation with respect to products and services provided by the Companies operating under the FXOpen brand, nor is it to be considered financial advice.