
Sample Category Title
EUR/CHF Daily Outlook
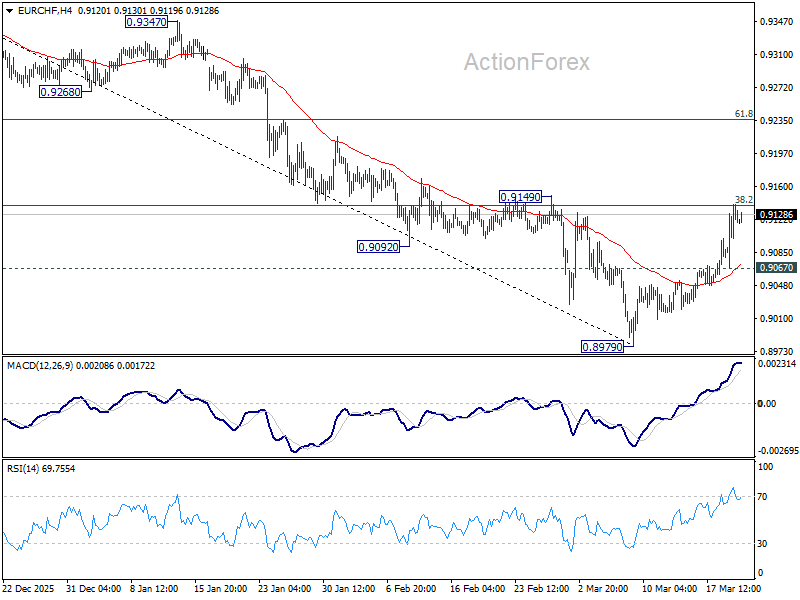
Daily Pivots: (S1) 0.9088; (P) 0.9115; (R1) 0.9162; More....
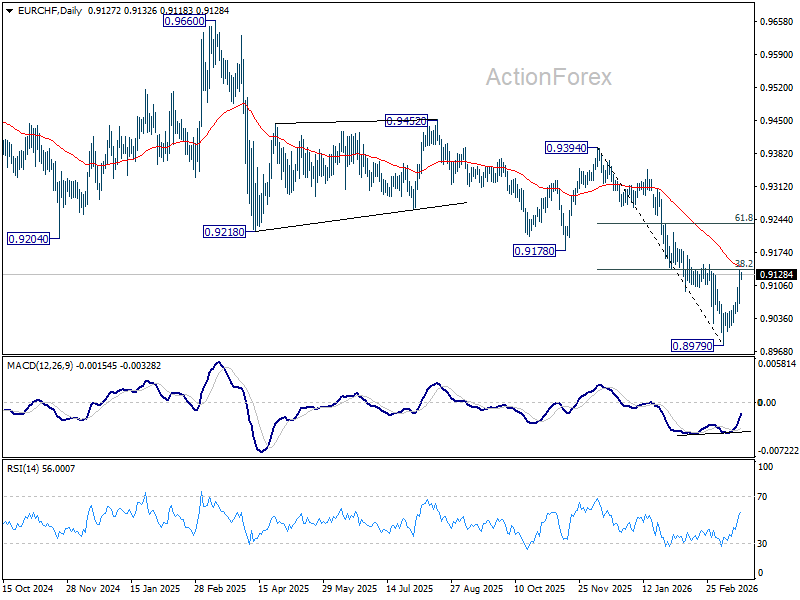
EUR/CHF extended rebound and firm break of 0.9092 support turned resistance suggests short term bottoming at 0.8979. Sustained trading above 38.2% retracement of 0.9394 to 0.8979 at 0.9138 will pave the way to 61.8% retracement at 0.9235. On the downside, below 0.9067 minor support will turn intraday bias back to the downside for retesting 0.8979 low instead.
In the bigger picture, down trend from 0.9928 (2024 high) is still in progress. Next target is 61.8% projection of 1.1149 to 0.9407 from 0.9928 at 0.8851. Outlook will stay bearish as long as 0.9394 resistance holds, in case of rebound.
AUD/USD Daily Report
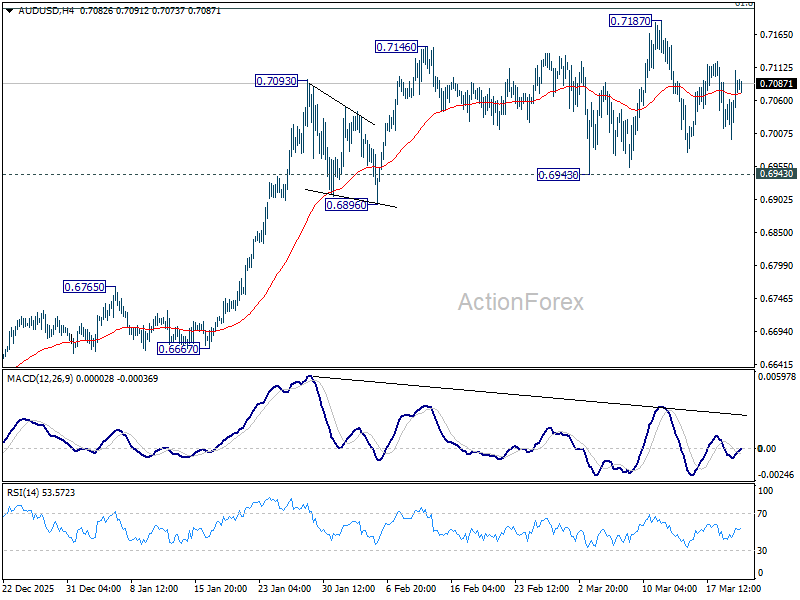
Daily Pivots: (S1) 0.7022; (P) 0.7065; (R1) 0.7131; More...
Intraday bias in AUD/USD stays neutral as range trading continues. With 0.6943 support intact, further rally is still expected. On the upside, firm break of 100% projection of 0.5913 to 0.6706 from 0.6420 at 0.7213 could prompt upside acceleration to 161.8% projection at 0.7703. However, firm break of 0.6943 will indicate that a larger scale correction is already underway.
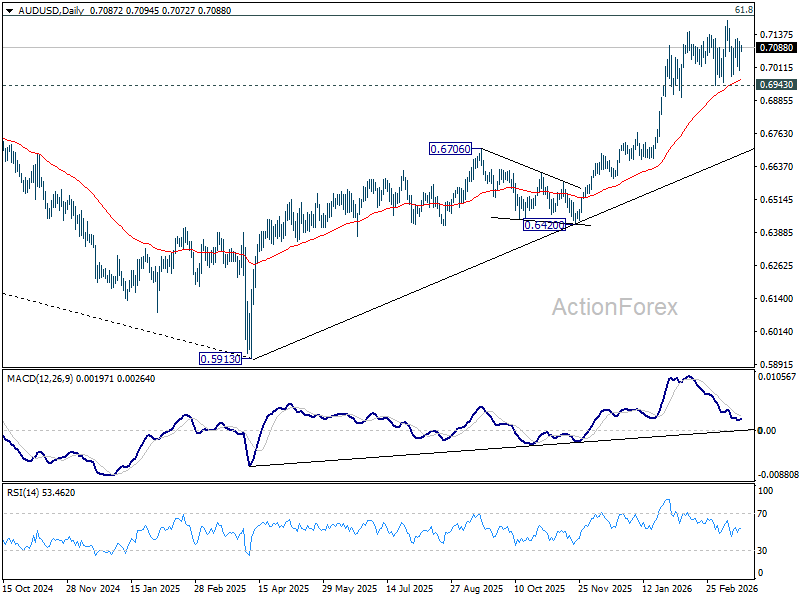
In the bigger picture, current development argues that rise from 0.5913 (2024 low) is reversing whole down trend from 0.8006 (2021 high). Decisive break of 61.8% retracement of 0.8006 to 0.5913 at 0.7206 will pave the way back to 0.8006. This will remain the favored case as long as 0.6706 resistance turned support holds, even in case of deep pullback.
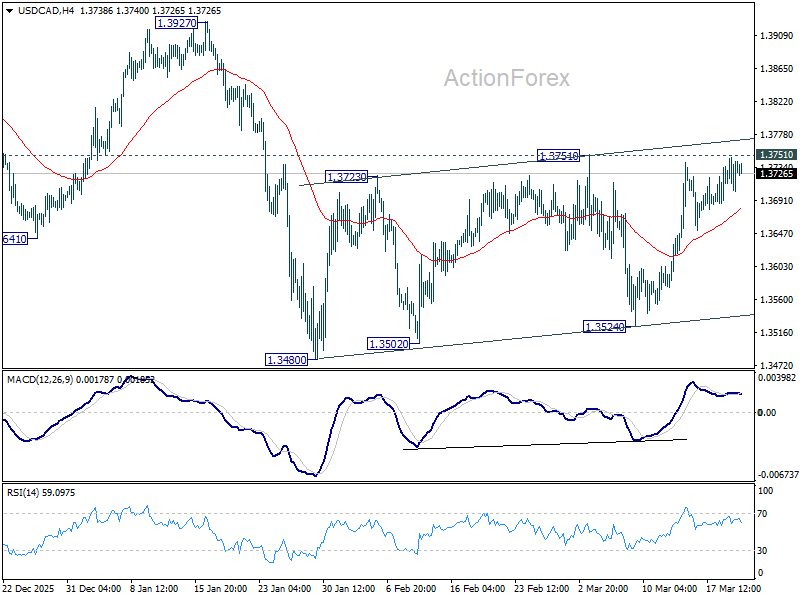
USD/CAD Daily Outlook
Daily Pivots: (S1) 1.3712; (P) 1.3730; (R1) 1.3758; More...
Intraday bias in USD/CAD stays neutral at this point. On the upside, firm break of 1.3751 resistance will suggest that stronger rebound is underway, and target 1.3927 resistance first. Meanwhile, break of 1.3524 support will bring resumption of whole down trend from 1.4791.
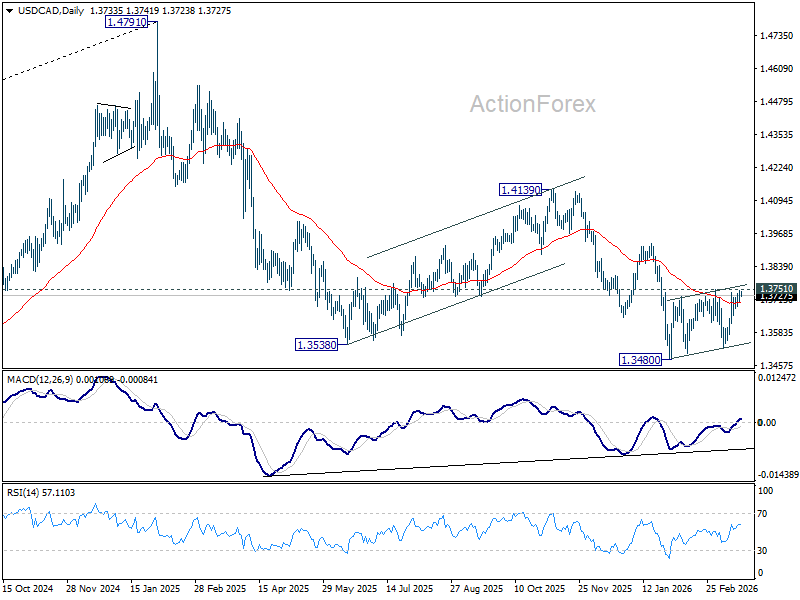
In the bigger picture, price actions from 1.4791 are seen as a corrective pattern to the whole up trend from 1.2005 (2021 low). Deeper fall could be seen, as the pattern extends, to 61.8% retracement of 1.2005 to 1.4791 at 1.3069. However, break of 1.3927 resistance will argue that the correction has completed with three waves down to 1.3480 already.
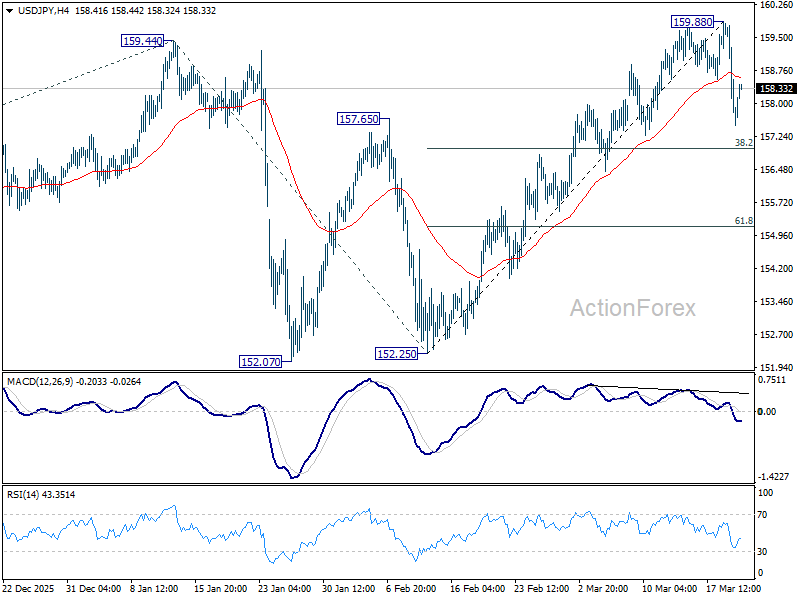
USD/JPY Daily Outlook
Daily Pivots: (S1) 156.84; (P) 158.38; (R1) 159.25; More...
USD/JPY is currently in correction to the rally from 152.52. Deeper decline should be seen to 38.2% retracement of 152.25 to 159.88 at 156.96. For now, near term outlook will be neutral with risk on the downside as long as 159.88 resistance holds, in case of recovery.
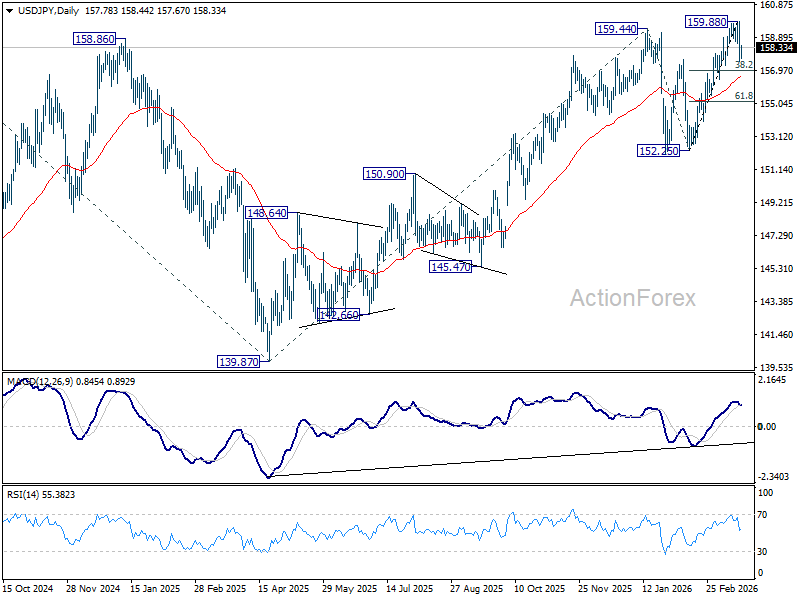
In the bigger picture, outlook is unchanged that corrective pattern from 161.94 (2024 high) should have completed with three waves at 139.87. Larger up trend from 102.58 (2021 low) could be ready to resume through 161.94. This will remain the favored case as long as 55 W EMA (now at 152.70) holds. Firm break of 161.94 will pave the way to 61.8% projection of 102.58 to 161.94 from 139.87 at 176.75.
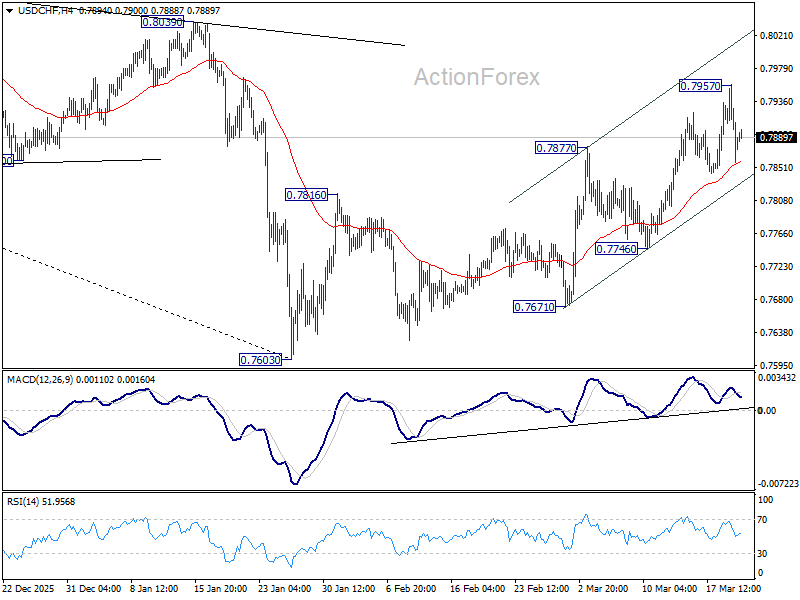
USD/CHF Daily Outlook
Daily Pivots: (S1) 0.7840; (P) 0.7899; (R1) 0.7942; More….
Intraday bias in USD/CHF is turned neutral first with current retreat. Some consolidations could be seen first but further rally is in favor as long as 0.7746 support holds. Rise from 0.7603 is seen as correcting the whole down trend from 0.9200. Above 0.7957 will target 38.2% retracement of 0.9200 to 0.7603 at 0.8213.
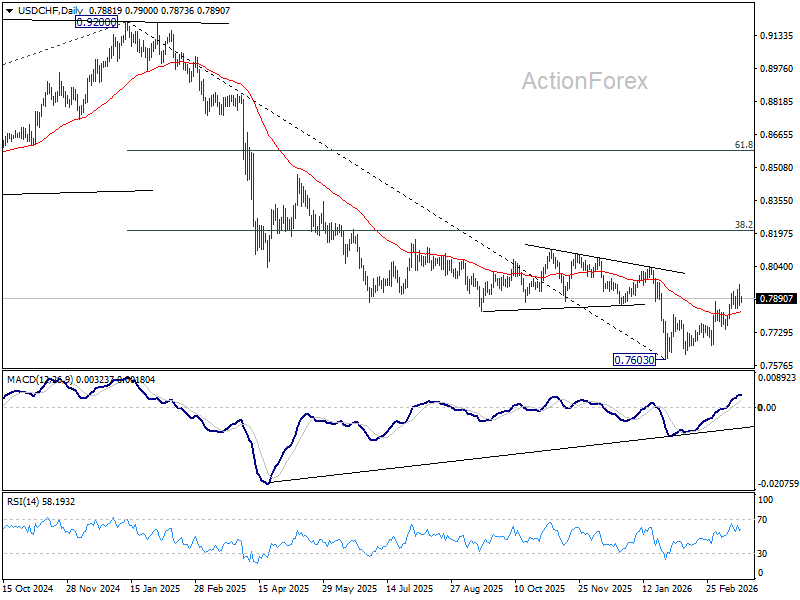
In the bigger picture, a medium term bottom should be in place at 0.7603 on bullish convergence condition in D MACD. Rebound from there is seen as correcting the fall from 0.9200 only. However, decisive break of 55 W EMA (now at 0.8091) will suggest that it's probably correcting the larger scale down trend from 1.0146 (2022 high). On the other hand, rejection by the 55 W EMA will setup down trend resumption to 100% projection of 1.0146 (2022 high) to 0.8332 from 0.9200 at 0.7382 at a later stage.
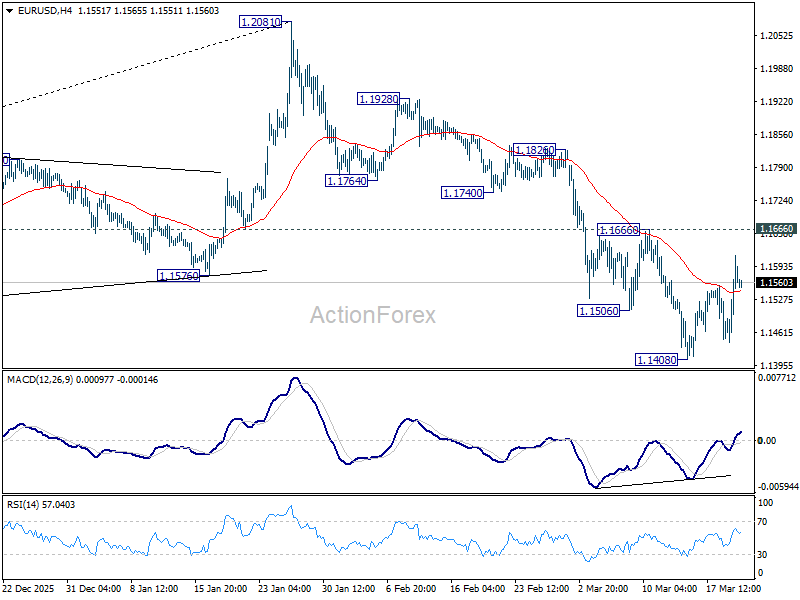
EUR/USD Mid-Day Outlook
Daily Pivots: (S1) 1.1488; (P) 1.1518; (R1) 1.1570; More….
EUR/USD is still staying below 1.1666 resistance despite extended rebound. Intraday bias remains neutral and further decline is in favor. On the downside, below .1408 will resume the fall from 1.2081 to 38.2% retracement of 1.0176 to 1.2081 at 1.1353. However, decisive break of 1.1666 will argue that the fall from 1.2081 has completed, and turn bias back to the upside for retesting this high.
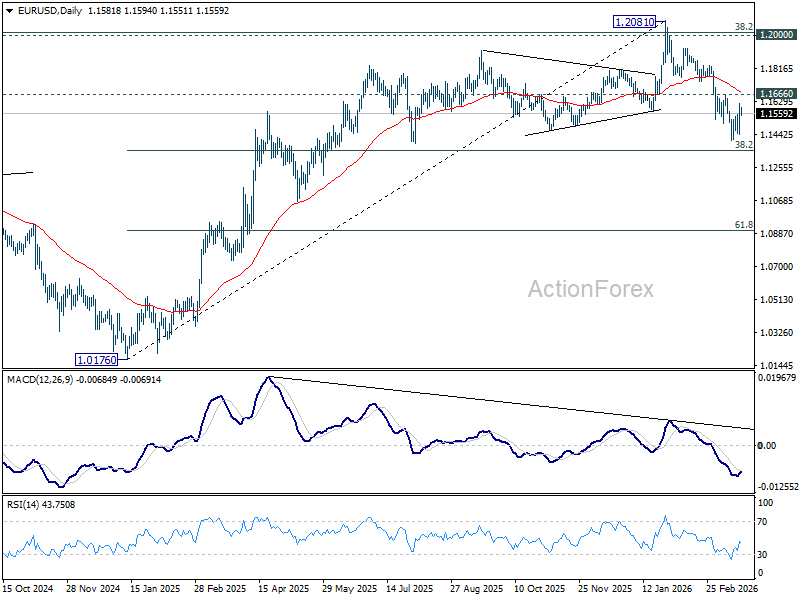
In the bigger picture, the break of 55 W EMA (now at 1.1495) confirms rejection by 1.2 key cluster resistance level. The whole up trend from 0.9534 (2022 low) might have completed as a three wave corrective rise too. In either case, deeper fall is now expected to long term channel support (now at 1.0528. Risk will stay on the downside as long as 1.2081 holds, in case of recovery.
Oil Pulls Back, But Risks Remain Elevated
A week packed with war headlines and central bank decisions comes to an end with one clear conclusion: the Middle East conflict is intensifying, and no one knows what the right monetary policy response should be.
What everyone agrees on is that rising oil and energy prices will push inflation higher in the short to medium term—depending on the duration of the conflict—while weighing on growth. This is a message echoed by the major central banks around the world.
The Reserve Bank of Australia (RBA) raised rates for a second consecutive meeting earlier this week. The Federal Reserve (Fed) chose to remain cautious, with the dot plot still pointing to a rate cut this year if inflation trends toward the 2% target—which, frankly, is a wishful thinking. The Swiss National Bank (SNB) has more room to breathe, with inflation in Switzerland nearing 0%. Meanwhile, the European Central Bank (ECB) and the Bank of England (BoE) sounded more concerned than their American counterpart about inflation—unsurprisingly, as Europe is a net energy importer and the euro and pound have weakened against the US dollar since the start of the conflict, meaning inflation could hit Europe harder.
How hard? In a severe scenario presented by the ECB, inflation could peak at 6.3% in Q1 next year. Let’s hope it doesn’t.
Encouragingly, the ECB’s baseline forecasts are less extreme, although yesterday’s update pointed to higher inflation and slower growth over the next three years. If it offers any reassurance, Christine Lagarde noted that since the Ukraine war, “we have learned, improved our models, changed our strategy and are now more attentive to risks around the outlook.”
That said, the reality remains challenging: the ECB is facing another energy shock, and there is essentially one conventional tool to respond to the resulting inflation—raising rates. Markets now fully price in two 25bp hikes this year, with around a 50% probability of a third. That’s the takeaway from the meeting.
The rise in German and French yields reflects these inflation expectations and rate hike bets—both have climbed to their highest levels since 2011. The STOXX Europe 600 is feeling the pressure: the index lost around 2.4% yesterday. The trigger, however, was not the ECB decision but the spike in energy prices, with Brent Crude briefly approaching $120 per barrel as the conflict between Iran and Israel continued to damage energy infrastructure in the region.
Oil prices are calmer this morning after US calls to avoid targeting energy infrastructure—reportedly met with a more constructive tone from Israel—and on news that Washington is considering easing sanctions on Iranian oil. Unbelievable!
Meanwhile, France, Germany, Italy and the UK said in a joint statement that they would support efforts to keep the Strait of Hormuz open. But to be willing to help is one thing, being able to help is another. So despite a relatively calmer morning session, the uncertainty and the volatility will remain on the menu.
This same backdrop also led the BoE to keep rates unchanged yesterday. The Monetary Policy Committee voted unanimously to hold—contrary to earlier expectations for a rate cut prior to the escalation in tensions. And the MPC is rarely unanimous! More worryingly – but as widely expected and priced in, the BoE opened the door for rate hikes down the road to ‘respond to the risk of a more persistent effect on UK inflation’. Bailey still said he cautions ‘against reaching any strong conclusions about raisin rates’, but in fine, we all know that if oil prices remain high at the pump, rates will have to rise.
The challenge is that raising rates in response to an external supply shock is only partially effective. Higher rates won’t end the war, repair damaged infrastructure, or directly lower energy prices. What they can do is slow growth and dampen demand, helping to contain—though not necessarily reverse—inflationary pressures.
Against this backdrop, rate expectations are not particularly supportive for European currencies. Both the EURUSD and the GBPUSD rebounded yesterday, likely on a softer US dollar amid tentative geopolitical de-escalation signals. But both pairs are back under pressure this morning.
So what’s next? No one knows. Meanwhile, US authorities are reportedly considering proposals to ease bank regulations, including lower capital requirements. This could help banks navigate rising private credit stress more smoothly, but it would also leave them more exposed to future shocks.
We are heading into what will likely be another eventful weekend in the Middle East. Investors are unlikely to add significant risk ahead of that, so the week may end on a cautious note, with only a slim hope that coordinated efforts could ease tensions around the Strait of Hormuz.
More realistically, oil and gas prices are likely to remain biased to the upside, with high volatility leading to sharp swings in both directions. Uncertainty will keep market participants on edge.
Some point to China as being relatively insulated from the Middle East conflict, given its energy reserves and investments in alternative energy—and, in a worst-case scenario, its ability to fall back on coal. But China faces its own challenges: an ageing population and a deep property crisis.
While AI and tech have recently supported sentiment, Alibaba Group disappointed investors with a 67% drop in quarterly profits and modest revenue growth, sending its shares 7% lower in New York. The company is aiming to offset slowing e-commerce growth with AI-driven revenues, but investor patience appears to be wearing thin.
ECB Holds Rates as Inflation Risks Heightens
In focus today
- Focus remains on developments in the Middle East, with strikes increasingly targeting critical energy infrastructure, keeping oil markets and risk sentiment on edge.
- Following yesterday's numerous monetary policy meetings, attention now shifts to communication from central banks, as markets seek clarity on their future policy directions and responses to evolving economic conditions.
Economic and market news
What happened overnight
Overnight, China maintained their Loan Prime Rates as expected. We do expect more monetary easing over the coming months, though, as signalled at the National People's Congress two weeks ago.
What happened yesterday
In the eurozone, the ECB decided to leave its key policy rates unchanged with the deposit facility rate at 2.00% as expected by markets and consensus. Lagarde struck a calm and balanced assessment of the implications of higher energy prices, which suggests that the ECB is not in a hurry to hike interest rates. We keep our call that the ECB remains unchanged at 2.00% in 2026 and 2027, with risks clearly skewed to the upside. We see a high bar for the ECB delivering a hike already in April. See more in: ECB Review: ECB remains calm; receive April meeting, 19 March.
The conflict in the Middle East escalated further, with Iran striking Qatar's North Field LNG complex, raising concerns over prolonged disruptions to global gas supply. Iran also targeted Israel's ORL and Bazan oil refineries in Haifa, though with limited damage. The developments mark a clear broadening of the conflict to critical energy infrastructure, underpinning the recent surge in oil and gas prices. On the diplomatic front, President Trump called on Israel to halt retaliatory strikes on Iranian gas assets to avoid further escalation. Meanwhile, in a joint statement and in response to rising energy prices, the UK, France, Germany, Italy, the Netherlands and Japan signalled readiness to safeguard shipping through the Strait of Hormuz.
For the energy market, yesterday was another tense day. European natural gas price rose sharply, and the oil price touched the high from last Monday of USD 118/bbl. The pressure on the oil price has eased overnight as US has sought to deescalate the situation. That said, the market will likely stay anxious heading into the weekend.
In the UK, the Bank of England kept the Bank Rate unchanged at 3.75%, as expected. In a hawkish surprise, the decision was taken unanimously. We continue to forecast two more rate cuts but kick them further down the road to July 2026 and February 2027. For more information: Bank of England Review - On hold in rare consensus decision, 19 March.
In Sweden, the Riksbank kept the policy rate unchanged at 1.75% as widely expected. The general impression was that the Riksbank tried to maintain stability. The Riksbank's alternative scenarios were probably the most interesting in the report, especially given the sharp rise in energy prices. In the high inflation scenario, the Riksbank starts hiking during Q3 2026, peaking at 2.66%. Note that this peak remains within the Riksbank's neutral range of 1.5-3.0%, raising questions about whether it is sufficiently hawkish for such a scenario.
Also in Sweden, the Origo inflation survey showed rising inflation expectations compared to December, especially in the 1-year term. CPI expectations for the 1-year term increased to 1.9% (prev. 1.4%), while CPIF expectations increased to 2.3% (prev.: 1.7%). Note that the responses were collected approximately 10 days ago.
In Switzerland, the Swiss National Bank (SNB) kept its policy rate at 0%, as expected. The bar for a change in policy rate remains high for the SNB, but they will "adjust its monetary policy if necessary". The recent strengthening of the Swiss franc and the conflict in the Middle East led to the SNB noting that the potential for a foreign exchange intervention has increased.
In Norway, yesterday's Regional Network Survey painted a picture of the mainland economy very similar to the last survey in December. Namely, an economy with modest activity- and employment growth and with capacity utilisation running close to a normal level. From a market point of view, the report was no smoking gun in terms of lifting the pressure on Norges Bank to hike rates. Instead, we now think Norges Bank next week will signal an extended period with unchanged policy rates with the new rate path embedding the next rate cut not before 2027.
Equities: Equities sold off sharply yesterday, albeit with significant regional dispersion, largely driven by developments and rhetoric surrounding the situation in Iran. Unsurprisingly, energy outperformed, despite pronounced intraday volatility in oil prices, which ultimately closed broadly unchanged on the day. Notably, the geopolitical risk premium is increasingly being priced further out along the oil curve, rather than in the front end.
Market internals pointed to a more defensive rotation, with downside moves broadening and risk-off characteristics becoming more visible at the index level. That said, underlying dynamics remain more nuanced. US banks outperformed, suggesting investors are not yet pricing a scenario consistent with a global, or even US, recession.
Similarly, several cross-asset moves deviate from a textbook risk-off regime and instead reflect reversals of prior positioning: gold declined ~5% and silver ~8%, weighing on materials. In contrast, software outperformed, reflecting limited energy intensity. Likewise, banks outperforming in the US together with small caps, with the Russell 2000 closing in positive territory. This morning, Asian equities are mostly higher, with Japan closed. European futures are higher, while US futures are marginally firmer, though still highly sensitive to ongoing fluctuations in oil prices.
FI and FX: The pressure on oil prices eased overnight as the US sought to de-escalate the situation. That said, the market will likely remain anxious heading into the weekend. The data calendar is thin today, and the focus will be on developments in the Middle East. In a Reuters article following the ECB conference yesterday, it was noted that the ECB might start debating policy tightening at the 29-30 April meeting and would not rule out a hike in April if energy prices continue to surge. Despite elevated uncertainty, we continue to expect the ECB to hold the deposit rate steady at 2.00% through 2026 and 2027, with risks clearly skewed to the upside. Thus, we recommend receiving the April meeting. Given the relative pricing of the upcoming ECB meetings compared to the Riksbank, we recommend flattening the SEK Sep26 vs. Sep27 FRA curve relative to Euribors.
GBP/USD Daily Outlook
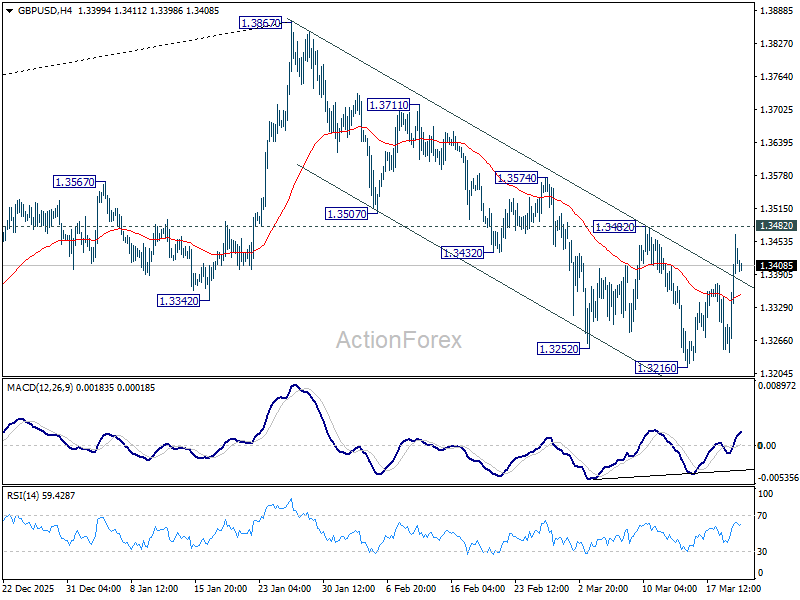
Daily Pivots: (S1) 1.3295; (P) 1.3382; (R1) 1.3517; More...
GBP/USD rebounded strongly but stays below 1.3482 resistance. Intraday bias remains neutral first. Further decline is still in favor. Below 1.3216 will resume the fall from 1.3867 to 1.3008 structural support. However, decisive break of 1.3482 will argue that the fall from 1.3867 has completed, and turn bias back to the upside for retesting this high.
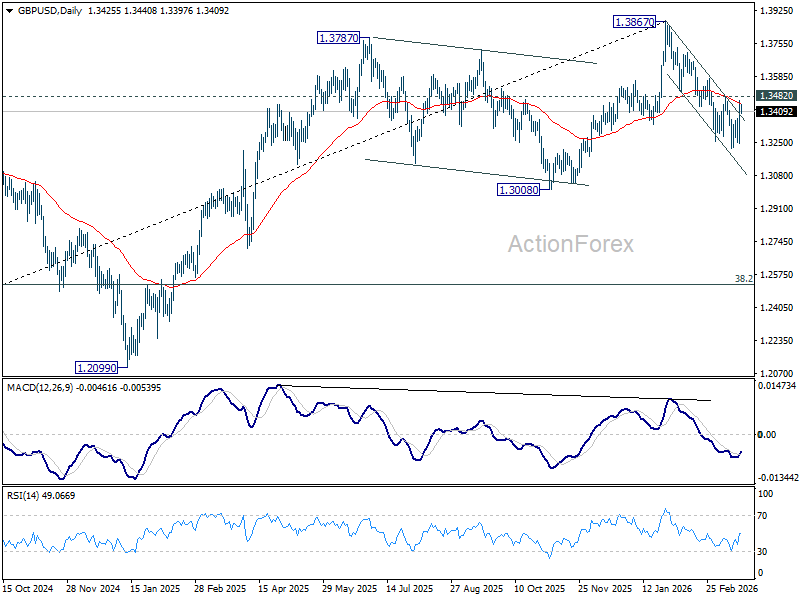
In the bigger picture, considering bearish divergence condition in both D and W MACD, a medium term top should be in place from 1.3867. Firm break of 1.3008 support will argue that fall from 1.3867 is at least correcting the rise from 1.0351 (2022 low) with risk of bearish reversal. That would open up further decline to 38.2% retracement of 1.0351 to 1.3867 at 1.2524. For now, medium term outlook will be neutral at best as long as 1.3867 resistance holds, or under further development.
Markets Stay Risk-Off But Dollar Loses Safe-Haven Edge
Markets remain firmly in risk-off mode, with US equities extending their selloff overnight and Asian markets staying under pressure. The backdrop continues to be dominated by conflicts in the Middle East, with energy markets at the center of the shock. Yet, despite the deterioration in sentiment, a notable divergence has emerged in currency markets.
There was a brief moment of relief after US President Donald Trump urged Israel not to strike Iran’s energy infrastructure, raising hopes for de-escalation. However, that optimism quickly faded as Israel launched a new wave of attacks, reinforcing the view that the conflict is now in a more entrenched and dangerous phase.
A joint statement from major countries including the UK, France, Germany, Italy, the Netherlands, Japan, and Canada signaled readiness to ensure safe passage through the Strait of Hormuz. While this move aims to stabilize markets, it is largely seen as defensive rather than transformative.
In practice, the logistical challenges of securing shipping routes through an active conflict zone remain significant. Insurance premiums for tankers are already surging, effectively acting as a “shadow tax” on global trade and growth. This embedded cost pressure is likely to persist even without further escalation.
Oil prices reflect this reality. Although Brent crude has pulled back from its spike to 119 yesterday, it remains firmly elevated above 105, sustaining a powerful inflationary impulse. This keeps markets focused not just on geopolitical risks, but also on the second-round effects on global inflation and policy.
Against this backdrop, Dollar’s inability to strengthen stands out. Traditionally, risk aversion would support the greenback, but that relationship appears to be breaking down. Instead, Dollar is being weighed down by shifting expectations around monetary policy.
The Federal Reserve’s latest projections still point to one rate cut this year, even if conviction has softened. In contrast, markets are increasingly pricing in tightening from other major central banks, particularly in Europe, where the inflation impact of higher energy prices is more pronounced.
For the Bank of England, markets are now pricing roughly a 70% chance of a rate hike by year-end, with some expectations of two increases. Meanwhile, ECB rate expectations have shifted significantly, with one to two hikes now priced for 2026. This divergence is reshaping currency dynamics.
The rationale is clear: European economies are more directly exposed to the energy shock, increasing the likelihood of persistent inflation pressures. As a result, central banks in the region may be forced into a more hawkish stance compared to the Fed, despite weaker growth conditions.
In currency markets, for the week so far, Loonie is the weakest performer, followed by Dollar and Swiss Franc. Kiwi leads gains, followed by Aussie and Sterling, while Euro and Yen sit in the middle.
In Asia, Japan is on holiday. Hong Kong HSI is down -0.61%. China Shanghai SSE is down -0.48%. Singapore Strait Times is down -0.39%. Overnight, DOW fell -0.44%. S&P 500 fell -0.27%. NASDAQ fell -0.28%. 10-year yield rose 0.022 to 4.281.
Gold stabilizes at 4,500 as liquidation exhausts, 4,000 remains target
Gold steadies near 4500 after a liquidity-driven selloff triggered margin calls and ETF outflows. With forced selling fading, consolidation may follow, but broader downside still points toward 4000. Read more.
NZ exports hit by soft China and Japan demand
NZ’s trade balance slipped into deficit as exports to China and Japan declined while imports surged. Soft Asian demand and rising external imbalance could weigh further on NZD. Read more.
GBP/USD Daily Outlook
Daily Pivots: (S1) 1.3295; (P) 1.3382; (R1) 1.3517; More...
GBP/USD rebounded strongly but stays below 1.3482 resistance. Intraday bias remains neutral first. Further decline is still in favor. Below 1.3216 will resume the fall from 1.3867 to 1.3008 structural support. However, decisive break of 1.3482 will argue that the fall from 1.3867 has completed, and turn bias back to the upside for retesting this high.
In the bigger picture, considering bearish divergence condition in both D and W MACD, a medium term top should be in place from 1.3867. Firm break of 1.3008 support will argue that fall from 1.3867 is at least correcting the rise from 1.0351 (2022 low) with risk of bearish reversal. That would open up further decline to 38.2% retracement of 1.0351 to 1.3867 at 1.2524. For now, medium term outlook will be neutral at best as long as 1.3867 resistance holds, or under further development.