
Sample Category Title
Sunset Market Commentary
Central bank special
The ECB stuck to a 2% deposit rate and said it is well positioned to navigate through a significantly more uncertain outlook. “Well positioned” isn’t the same as “the good place” the ECB was in prior to the Iran war (and which suggested a long pause), Lagarde said. The energy shock resulted in a higher inflation forecast for 2026 to 2.6% from 1.9%. Expectations for both 2027 and 2028 were also higher than in December. The projection cut-off was March 11, later than usual. Growth meanwhile saw downward adjustments, particularly this year, to 0.9%-1.3%-1.4%. Risks are tilted to the upside for inflation, to which the ECB is more attentive to since the 2022 energy crisis, and to the downside for growth. President Lagarde couldn’t offer a timeline for any action but instead listed a whole range of indicators the central bank is watching and said the ECB is using two scenario’s next to the baseline. In the adverse one, energy prices surge but fall back. It may be the one where we are at already since oil prices surged another 20% since the projection cutoff date. The severe one is dependent on the intensity, duration and propagation of the war and see energy prices settling at higher levels for longer. The adverse one assumes no rate hikes and oil prices of $119/b, which is not far from where we are today. Inflation in such case would shot up to 3.5%. Euro area rates are up 9 bps at the front end. They were higher on the day but lost some ground in line with oil prices easing intraday as well (rather than on the ECB). EUR/USD is up at 1.1515.
Each of the four Bank of England policymakers which called for a rate cut in February backed down today. The vote to hold rates steady at 3.75% was unanimous and came with strong language that the BoE stands ready to act to ensure that inflation remains on track to the 2% target. As governor Bailey later put it unambiguously: “Whatever happens, our job is to make sure inflation gets back to its 2% target.” The energy price shock will push up inflation in the near term, creating risks for inflationary pressures through second-round effects in wage and price-setting by economic agents still-scarred by the post-pandemic inflation surge. Preliminary staff estimates put CPI between 3 and 3.5% over the next couple of quarters. Back in February, inflation was expected to fall back to around the 2% target from April. The MPC also considered the implications for inflation from the weakening in activity that was to result from higher energy costs. It offered a range of scenario’s: one where a larger or more protracted shock risked greater second-round effects and would require a more restrictive stance and one where the shock was short-lived or where more economic slack would reduce inflation pressures. A 36 bps rise in the 2-yr yield, of which some 20 bps followed the overnight escalation in the war with parties striking the massive energy facilities, reveals the market’s view. The UK money market at some point almost priced three 25 bps hikes this year. EUR/GBP holds around 0.863.
The Swedish Riksbank kept its policy rate unchanged at 1.75%. It reiterated that the rate is expected to remain at this level for some time to come, but admits that the war in the Middle East makes the forecast very uncertain. In its policy statement, it puts forward two alternative scenarios. The sequence matters. The first possible scenario is that the war has significantly greater effects on the global economy and leads to a broader and more persistent upturn in inflation. The Riksbank would then have to raise the policy rate, even though economic activity in this case would be significantly lower. Elsewhere in the statement, the central bank also warns that higher inflation is not only result from higher energy but also from the pass-on to other prices. In another scenario, negative effects on demand are so significant that they pull inflation down and push the Riksbank towards rate cuts. Swedish money market clearly move towards the rate hike scenario, given a 40% probability to a 25 bps increase in June. They take a final clue from the closing paragraph which calls for vigilance, central bank lingo for near term (tightening) action.
The Swiss National Bank held its policy rate at 0%, but showed an increased willingness to increase in the FX market given the conflict in the Middle East. The SNB thereby counters a rapid and excessive appreciation of the Swiss franc, which would jeopardise price stability in Switzerland. Simultaneously, SNB president Schlegel at the press conference said that the bar for negative rates is elevated. The SNB gives the impression to be more attentive to (unwarranted) CHF strength and its deflationary impact than to upside inflation risks from higher energy prices. New conditional forecasts suggest inflation to comfortably remain in (the lower half of) the 0-2% target. Schlegel said that the SNB can meet anytime for rate adjustments, raising flexibility in case of further deteriorating market circumstances. The Swiss franc ceded ground after the strong rhetoric at the presser. EUR/CHF returned above 0.91.
Bank of England Review – On Hold in Rare Consensus Decision
- The Bank of England kept the Bank Rate unchanged at 3.75%.
- In a hawkish surprise, the decision was taken unanimously.
- We continue to pencil in two more rate cuts but kick them further down the road to July 2026 and February 2027.
- Gilt yields traded higher following the decision and also drove a move higher in Bund yields.
The Bank of England (BoE) kept the Bank Rate unchanged at 3.75% as expected. The decision was unanimous, something we have not seen since 2022. This was a hawkish surprise, as two members, probably Taylor and Dhingra, were expected to keep their votes for cut. The statement also leaned to the hawkish side, as "The MPC is alert to the increased risk of domestic inflationary pressures through second-round effects in wage and price-setting, the risk of which will be greater the longer higher energy prices persist.".
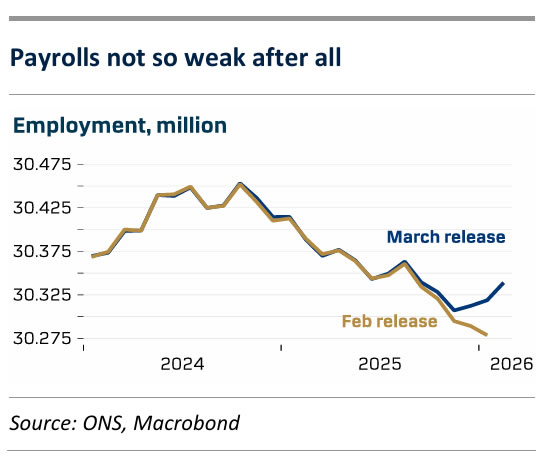
For now, the war in the Middle East blurs the disinflationary path in the UK, which makes the next move from the BoE more uncertain. This morning did bring some comforting news to MPC members from the labour market, suggesting the UK economy can handle a potential delay of the final part of the cutting cycle. The labour market report shows a significantly more upbeat jobs situation with payrolls increasing 20K in February and recent months also lifted markedly. At the same time, January unemployment declined markedly, which erases the worst fears from the weak November/December prints. Also encouraging to the BoE, wage pressures are abating suggesting a still smaller underlying price pressure. That said, the MPC notes that CPI inflation is now expected around 3% in Q2 rather than 2.1% in the February Report.
BoE call. We judge it most likely that energy markets will continue to blur the inflation picture over the coming months. Even if energy prices normalise through April and May, the BoE will likely not know enough about second round effects by mid-June. We deem it more likely they wait for the July meeting to cut rates again. By then, they can also support such a call with a fresh take on the economy in a new outlook report. We call for two more rate cuts, in July 2026 and February 2027.
Market reaction. 2-year Gilt yields traded some 20bps higher on the back of the decision and at the time of writing, investors price in two hikes through the remainder of 2027. It remains to be seen what a more hawkish BoE means for the UK economy, which is probably also why EUR/GBP did not move much.
Bank of England Leaves Interest Rates Unchanged as War and Rising Energy Prices Complicate Inflation Fight
- The Bank of England kept rates unchanged at 3.75%, choosing a wait-and-see approach as uncertainty around inflation and growth increases.
- War in the Middle East and higher energy prices have worsened the inflation outlook, raising the risk that inflation could stay elevated for longer than previously expected.
- The UK economy remains weak, which leaves the Bank facing a difficult trade-off between containing inflation and avoiding further damage to growth.
The Bank of England unanimously decided to keep interest rates on hold at 3.75%, judging that the best course of action for now is to wait and gather more evidence. The decision highlights just how difficult the current environment has become for the UK central bank. On the one hand, inflation risks are starting to build again. On the other, the economy remains fragile, and weak growth prospects do not justify further monetary tightening.
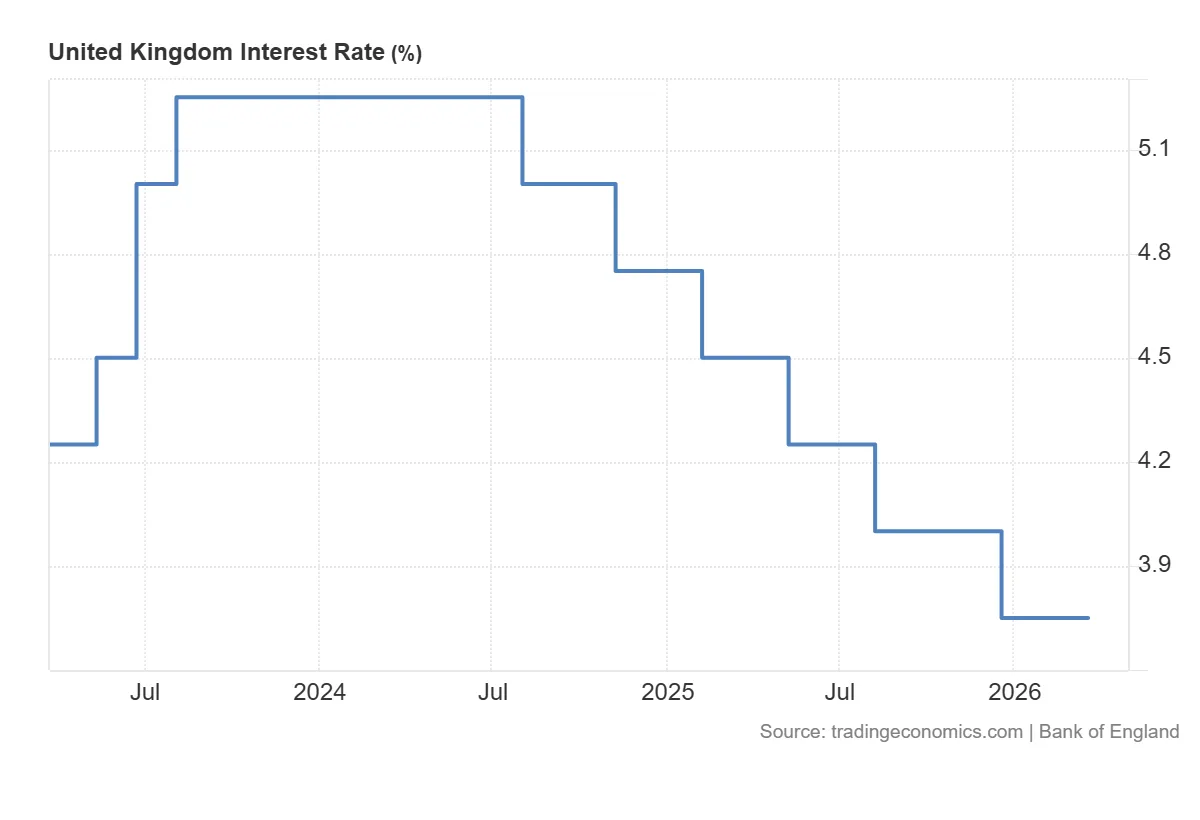
United Kingdom interest rate, source: Trading Economics
War in the Middle East reshapes the inflation outlook
The key factor behind the Bank’s decision is a fresh energy shock triggered by the war in the Middle East. Higher oil and gas prices are feeding into inflation both directly, through fuel costs and household energy bills, and indirectly, through rising operating costs for businesses. The Bank has made clear that it cannot influence global commodity prices, but it can try to prevent this shock from becoming embedded in domestic inflation.
Inflation is becoming a bigger concern again
Even before the conflict escalated, the UK inflation picture had been gradually improving. That trend has now clearly deteriorated. The Bank of England estimates that inflation could reach around 3.5% in March, remain close to 3% in the second quarter, and then climb back to as high as 3.5% in the third quarter if energy prices stay elevated. That marks a notable shift from earlier projections, which had pointed to inflation closer to 2.1%. In other words, the disinflation process has been disrupted by external factors that monetary policy can only partially offset.
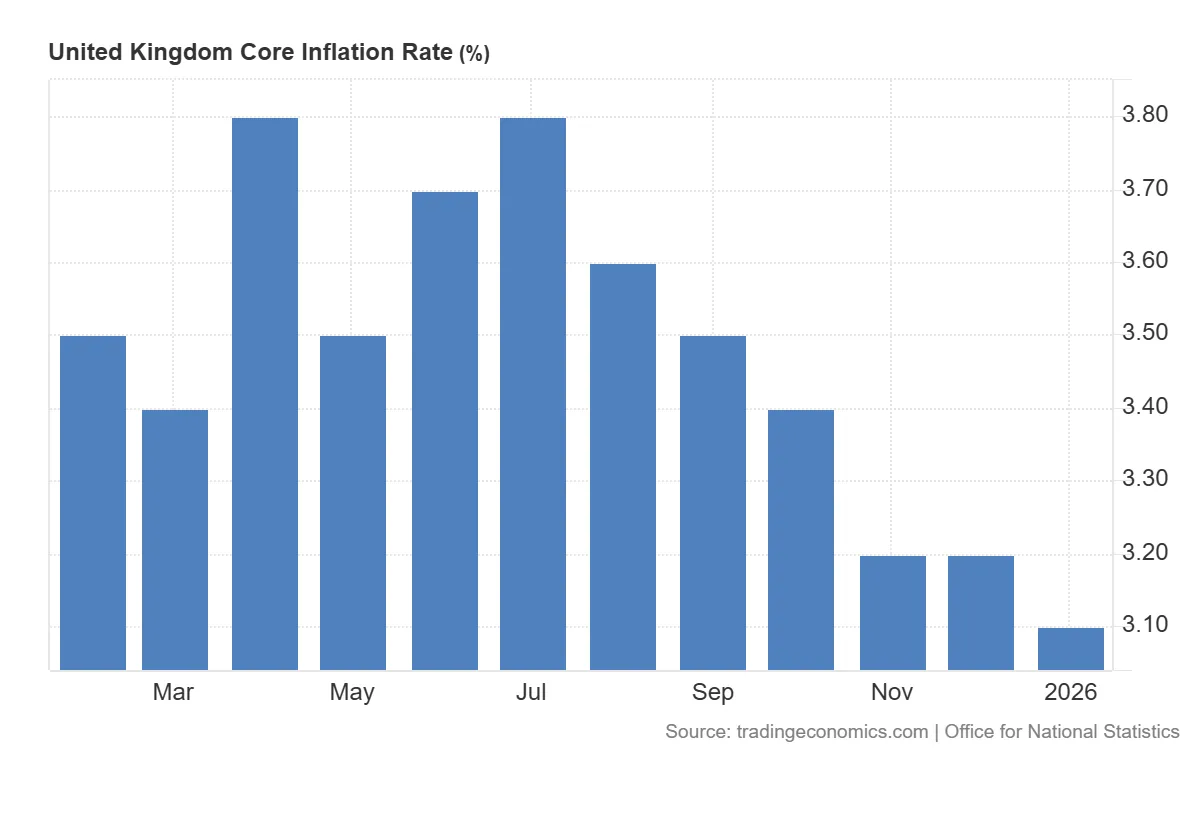
United Kingdom core inflation rate, source: Trading Economics
A weak economy makes the policy choice harder
The problem is that higher inflation is not being accompanied by stronger economic momentum. Quite the opposite: UK activity remains subdued, GDP growth is sluggish, and labour demand has softened. Higher energy costs could make matters worse by squeezing household real incomes and weighing further on consumption. In effect, the Bank of England is facing a familiar but difficult trade-off: how to contain inflation without worsening the slowdown in growth.
The biggest risk: inflation becoming entrenched
The Monetary Policy Committee sees risks on both sides, but for now it appears more concerned about upside inflation risks. Of particular concern are so-called second-round effects — the possibility that higher energy prices begin to feed into wage demands and broader domestic price pressures. That would be especially problematic, as it could keep inflation elevated for longer than markets currently expect. The longer energy prices remain high, the greater that risk becomes.
What happens next with interest rates
The Bank of England is not offering any strong guidance on its next move. Its message suggests that if the energy shock proves temporary and the economy stays weak, monetary policy could gradually become less restrictive over time. But if higher energy prices turn out to be more persistent and start to drive inflation expectations higher, the Bank could be forced to take a more hawkish stance. That means a rate hike is not the base case, but it has not been ruled out entirely.
Unanimity today does not mean certainty tomorrow
The unanimous vote to leave rates unchanged should not be mistaken for full agreement on the future path of policy. Comments from Committee members suggest that even before the outbreak of the conflict, some had been close to backing a rate cut. For now, however, caution is dominating the discussion. Policymakers first need to assess the scale and persistence of the energy shock before deciding whether the next step should be a cut, a prolonged hold, or even renewed tightening.
The Bank of England opts for a wait-and-see approach
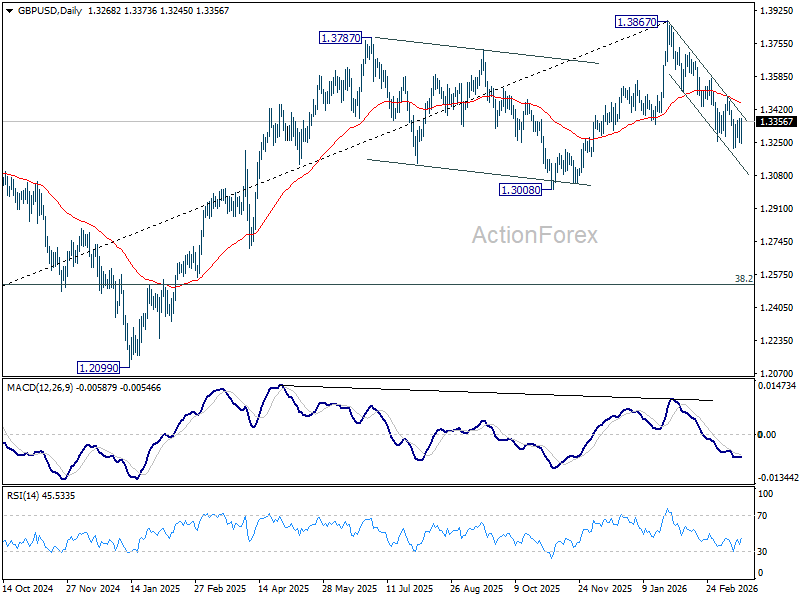
The latest decision shows that the Bank of England has moved firmly into wait-and-see mode. Faced with war, higher energy prices and rising uncertainty, it is unwilling to move too quickly in either direction. For now, the priority is to determine whether this shock will prove temporary or evolve into a more persistent inflation problem. That assessment will shape the next phase of UK monetary policy. GBPUSD is currently trading near key support around 1.3225. Holding this level could be the first sign that the downward correction is coming to an end.
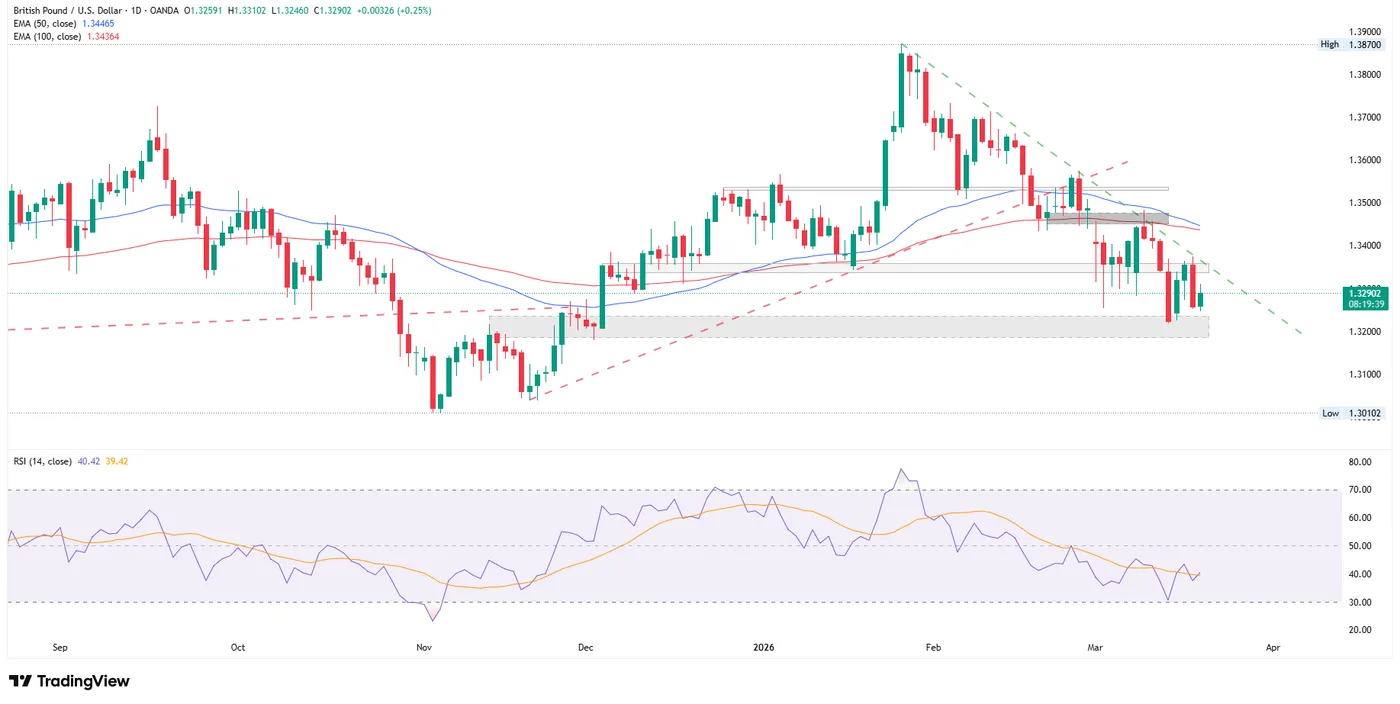
Daily GBPUSD chart, source: TradingView
EUR/USD Mid-Day Outlook
Daily Pivots: (S1) 1.1488; (P) 1.1518; (R1) 1.1570; More….
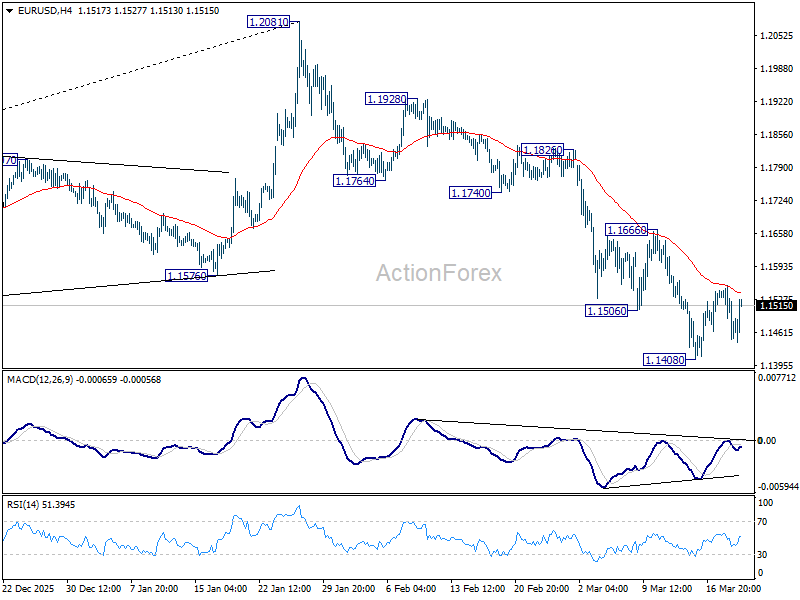
EUR/USD is still staying in consolidations above 1.1408 and intraday bias remains neutral. Further decline is expected as long as 1.1666 resistance holds. Below 1.1408 will resume the fall from 1.2081 to 38.2% retracement of 1.0176 to 1.2081 at 1.1353. Firm break there will target 61.8% projection at 1.0904 next.
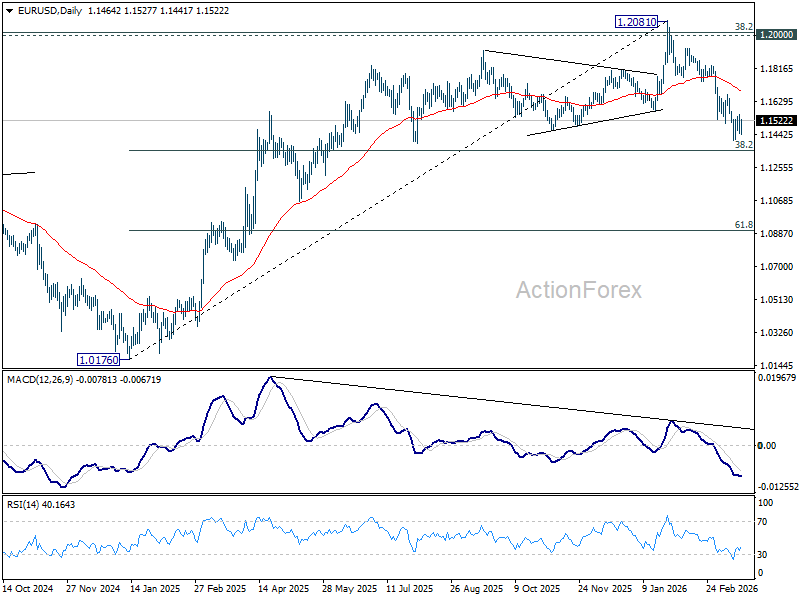
In the bigger picture, the break of 55 W EMA (now at 1.1495) confirms rejection by 1.2 key cluster resistance level. The whole up trend from 0.9534 (2022 low) might have completed as a three wave corrective rise too. In either case, deeper fall is now expected to long term channel support (now at 1.0528. Risk will stay on the downside as long as 1.2081 holds, in case of recovery.
GBP/USD Mid-Day Outlook
Daily Pivots: (S1) 1.3215; (P) 1.3295; (R1) 1.3339; More...
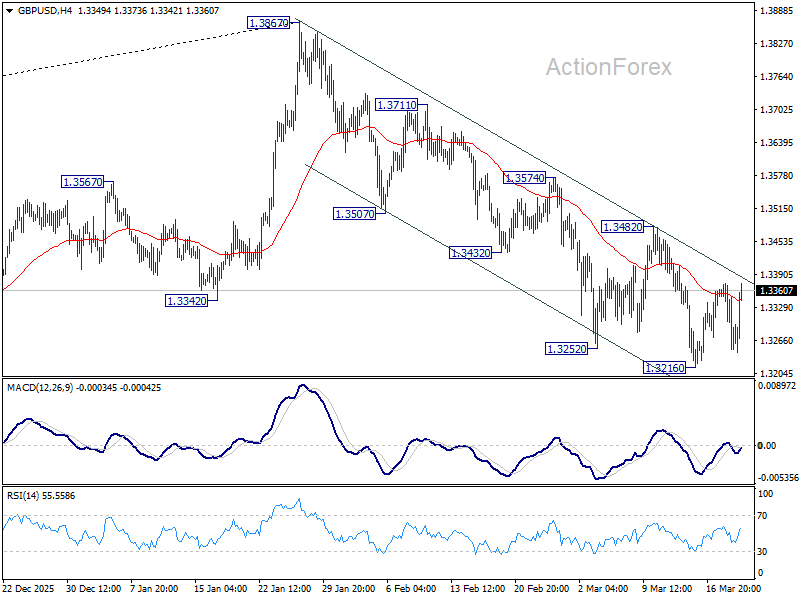
Intraday bias in GBP/USD remains neutral for the moment and more consolidations could be seen above 1.3216. But risk will stay on the downside as long as 1.3482 resistance holds. Below 1.3216 will resume the fall from 1.3867 to 1.3008 structural support. Firm break there will carry larger bearish implication and target 1.2524 fibonacci level.
In the bigger picture, considering bearish divergence condition in both D and W MACD, a medium term top should be in place from 1.3867. Firm break of 1.3008 support will argue that fall from 1.3867 is at least correcting the rise from 1.0351 (2022 low) with risk of bearish reversal. That would open up further decline to 38.2% retracement of 1.0351 to 1.3867 at 1.2524. For now, medium term outlook will be neutral at best as long as 1.3867 resistance holds, or under further development.
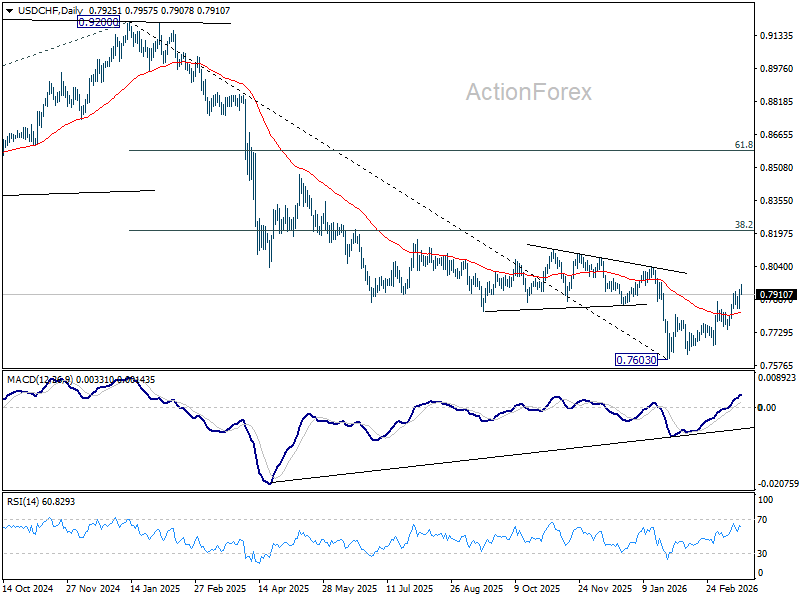
USD/CHF Mid-Day Outlook
Daily Pivots: (S1) 0.7867; (P) 0.7903; (R1) 0.7967; More….
Intraday bias in USD/CHF remains on the upside for the moment. The current rally is seen as correcting whole down trend from 0.9200. Next target is 38.2% retracement of 0.9200 to 0.7603 at 0.8213. On the downside, below 0.7842 support will turn intraday bias neutral first.
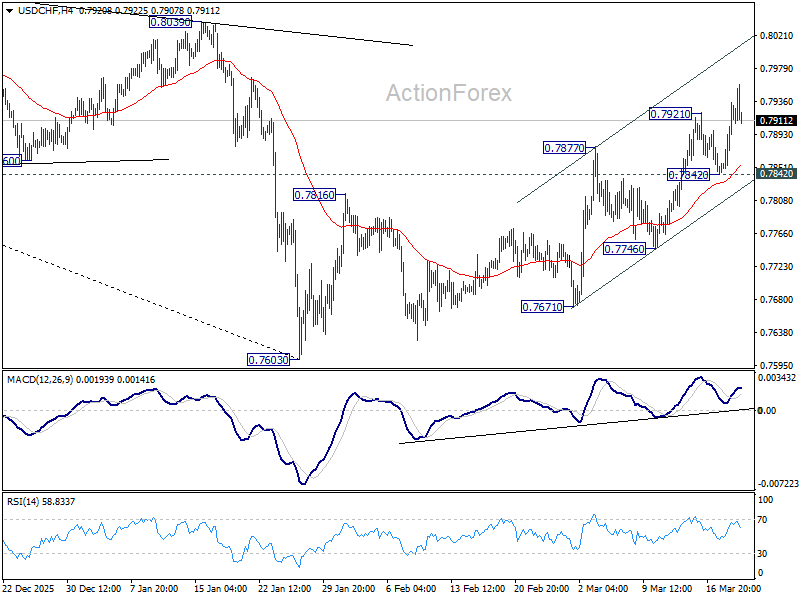
In the bigger picture, a medium term bottom should be in place at 0.7603 on bullish convergence condition in D MACD. Rebound from there is seen as correcting the fall from 0.9200 only. However, decisive break of 55 W EMA (now at 0.8091) will suggest that it's probably correcting the larger scale down trend from 1.0146 (2022 high). On the other hand, rejection by the 55 W EMA will setup down trend resumption to 100% projection of 1.0146 (2022 high) to 0.8332 from 0.9200 at 0.7382 at a later stage.
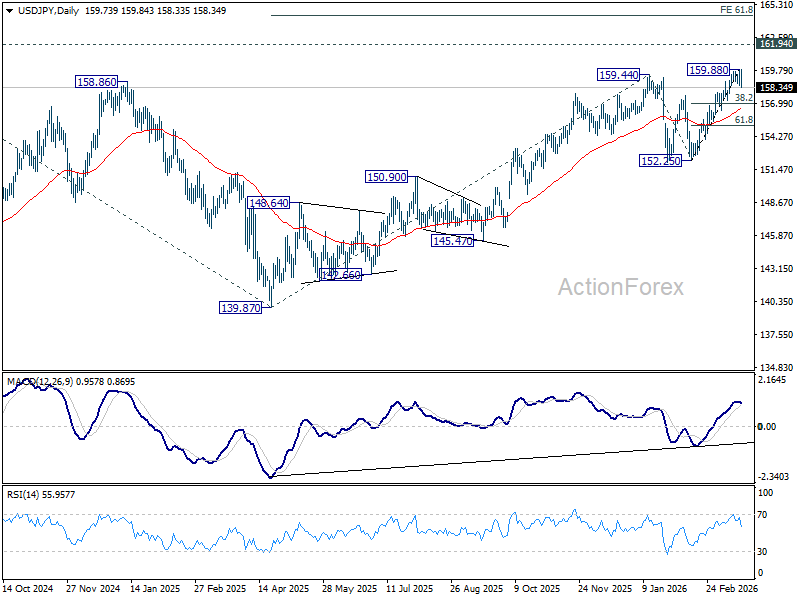
USD/JPY Mid-Day Outlook
Daily Pivots: (S1) 159.00; (P) 159.46; (R1) 160.36; More...
USD/JPY's break of 158.55 support suggests short term topping at 159.88 on bearish divergence condition in 4H MACD. intraday bias is back on the downside. Deeper pullback would be seen to 38.2% retracement of 152.25 to 159.88 at 156.96. For now, near term outlook will be neutral with risk on the downside as long as 159.88 resistance holds, in case of recovery.
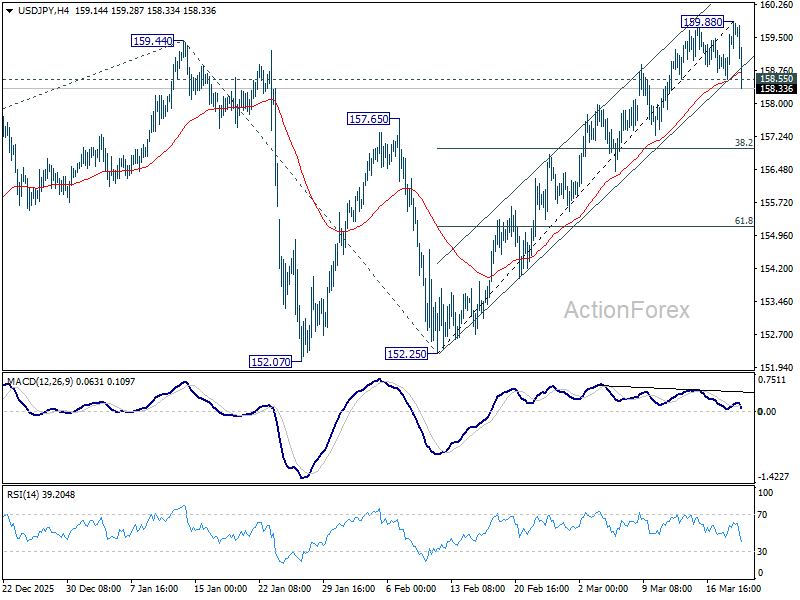
In the bigger picture, outlook is unchanged that corrective pattern from 161.94 (2024 high) should have completed with three waves at 139.87. Larger up trend from 102.58 (2021 low) could be ready to resume through 161.94. This will remain the favored case as long as 55 W EMA (now at 152.70) holds. Firm break of 161.94 will pave the way to 61.8% projection of 102.58 to 161.94 from 139.87 at 176.75.
Yen Rallies on BoJ Hawkish Signal as USD/JPY Rejected at 160 Intervention Red Line
Central bank marathon ends with rate decisions from SNB, BoE, and ECB now behind market. Yen emerged as the strongest performer, supported by a hawkish interpretation of BoJ Governor Ueda’s post-meeting remarks. While the BoJ held rates at 0.75%, Ueda signaled that rate hikes remain on the table even if growth weakens, as long as underlying inflation stays intact. This marks a notable shift, suggesting policy will not be constrained by temporary economic softness.
Markets have quickly adjusted, with expectations for an April rate hike moving from a tail risk to a credible scenario. This repricing has provided strong support for Yen, particularly as positioning had previously leaned heavily against it.
At the same time, technical dynamics in USD/JPY have reinforced the move. Traders remain reluctant to push the pair beyond the 160 level, widely viewed as the "red line" for intervention. The inability to break higher has encouraged profit-taking and position unwinding, further supporting Yen.
Sterling also gained ground, following the Bank of England’s surprise unanimous decision to hold rates. While the policy stance itself did not turn explicitly hawkish, the absence of dissenting votes from dovish members has been interpreted as a shift away from easing bias.
Markets have moved quickly to price in tightening, with money markets now fully anticipating a rate hike to 4.00% by June and further increases toward 4.35% by September. While these expectations may be running ahead of official guidance, they have nonetheless provided near-term support for the currency.
Euro is also firmer, underpinned by ECB’s upward revision to inflation forecasts. However, gains remain limited as the simultaneous downgrade to growth projections highlights the emergence of stagflation risks.
In contrast, Swiss Franc has weakened after SNB signaled a stronger willingness to intervene in foreign exchange markets. By explicitly pushing back against excessive currency strength, the central bank has effectively capped safe haven demand, even in a risk-averse environment.
Aussie is among the weaker performers, pressured by a mix of risk aversion and the sharp rise in oil prices, with Brent briefly touching $119. Dollar, meanwhile, is paring back some of its post-FOMC gains. With the Fed’s message now largely priced in, focus has shifted toward global policy divergence.
In Europe, at the time of writing, FTSE is down -2.86%. DAX is down -3.02%. CAC is down -2.45%. UK 10-year yield is up 0.111 at 4.792. Germany 10-year yield is up 0.026 at 2.975. Earlier in Asia, Nikkei fell -3.38%. Hong Kong HSI fell -2.02%. China Shanghai SSE fell -1.39%. Singapore Strait Times fell -0.69%. Japan 10-year JGB yield rose 0.05 to 2.268.
ECB raises inflation forecast, cuts growth as energy shock bites
ECB holds rates unchanged as expected, and revised inflation higher and growth lower, highlighting stagflation risks as energy prices rise and policy uncertainty increases. Read more.
BoE unanimous rate hold surprises as doves abandon cut calls amid energy shock
BoE surprised with a unanimous hold as even dovish members backed a pause, signaling energy-driven inflation risks have delayed rate cuts. Read more.
UK wage growth cools as labor market softens despite stable unemployment
UK wage growth eased and employment showed signs of softening, pointing to moderating inflation pressures as BoE assesses policy path. Read more.
SNB holds rates, signals stronger FX intervention to cap Franc strength
SNB kept rates at 0% but stepped up its intervention signal to limit CHF gains as energy-driven inflation is seen as temporary. Read more.
BoJ holds rates, signals further hikes despite temporary inflation dip
BoJ kept rates at 0.75% and reaffirmed tightening bias, looking through a near-term inflation dip as wage growth and rising oil prices support outlook. Read more.
Mixed Australia employment data: Hiring strong, but job quality slips
Employment jumped 48.9k in February, but unemployment rose to 4.3% as full-time jobs fell and labour supply increased. Underlying softness tempers the strong headline. Read more.
NZ GDP disappoints at 0.2% as momentum fades into year-end
New Zealand GDP rose just 0.2% qoq in Q4, missing expectations and slowing sharply from Q3. Weak construction and flat per capita growth highlight a fragile recovery. Read more.
USD/JPY Mid-Day Outlook
Daily Pivots: (S1) 159.00; (P) 159.46; (R1) 160.36; More...
USD/JPY's break of 158.55 support suggests short term topping at 159.88 on bearish divergence condition in 4H MACD. intraday bias is back on the downside. Deeper pullback would be seen to 38.2% retracement of 152.25 to 159.88 at 156.96. For now, near term outlook will be neutral with risk on the downside as long as 159.88 resistance holds, in case of recovery.
In the bigger picture, outlook is unchanged that corrective pattern from 161.94 (2024 high) should have completed with three waves at 139.87. Larger up trend from 102.58 (2021 low) could be ready to resume through 161.94. This will remain the favored case as long as 55 W EMA (now at 152.70) holds. Firm break of 161.94 will pave the way to 61.8% projection of 102.58 to 161.94 from 139.87 at 176.75.
ECB raises inflation forecast, cuts growth as energy shock bites
ECB holds rates, revises inflation higher and growth lower, highlighting stagflation risks while resisting commitment to a tightening path. The Governing Council kept the deposit rate unchanged at 2.00%, as widely expected, but updated projections revealed a more challenging macro backdrop driven by rising energy prices.
- Headline inflation is now projected to average 2.6% in 2026, before easing to 2.0% in 2027 and 2.1% in 2028.
- Core inflation, which excludes energy and food, is also expected to remain elevated, at 2.3% in 2026, 2.2% in 2027, and 2.1% in 2028.
These upward revisions reflect the pass-through of higher energy costs into broader price pressures, suggesting inflation risks are no longer confined to volatile components.
- At the same time, the growth outlook has been downgraded. GDP is now expected to expand by just 0.9% in 2026, before recovering modestly to 1.3% in 2027 and 1.4% in 2028.
The ECB pointed to weaker real incomes, softer confidence, and global spillovers from the energy shock as key drags, even as low unemployment and fiscal spending provide some support.
Despite higher inflation projections, the ECB refrained from signaling any imminent tightening. The Governing Council reiterated its data-dependent, meeting-by-meeting approach and stressed that it is not pre-committing to a particular rate path. This suggests policymakers are wary of tightening prematurely amid weakening growth dynamics.
Scenario analysis highlights the risks ahead. A prolonged disruption to energy supply would push inflation above baseline projections while further weakening growth, intensifying the policy trade-off.
(ECB) Monetary policy decisions
The Governing Council today decided to keep the three key ECB interest rates unchanged. It is determined to ensure that inflation stabilises at the 2% target in the medium term. The war in the Middle East has made the outlook significantly more uncertain, creating upside risks for inflation and downside risks for economic growth. It will have a material impact on near-term inflation through higher energy prices. Its medium-term implications will depend both on the intensity and duration of the conflict and on how energy prices affect consumer prices and the economy.
The Governing Council is well positioned to navigate this uncertainty. Inflation has been at around the 2% target, longer-term inflation expectations are well anchored, and the economy has shown resilience over recent quarters. The incoming information in the period ahead will help the Governing Council assess how the war will affect the inflation outlook and the risks surrounding it. The Governing Council is closely monitoring the situation, and its data-dependent approach will help it set monetary policy as appropriate.
The new ECB staff projections exceptionally incorporate information up to 11 March, a later cut-off date than usual. In the baseline, headline inflation is seen to average 2.6% in 2026, 2.0% in 2027 and 2.1% in 2028. Inflation has been revised up compared with the December projections, especially for 2026. This is because energy prices will be higher owing to the war in the Middle East. For inflation excluding energy and food, staff project an average of 2.3% in 2026, 2.2% in 2027 and 2.1% in 2028. This is also higher than the path in the December projections, mainly owing to higher energy prices feeding into inflation excluding energy and food. Staff expect economic growth to average 0.9% in 2026, 1.3% in 2027 and 1.4% in 2028. This implies a downward revision, especially for 2026, reflecting the global effects of the war on commodity markets, real incomes and confidence. At the same time, low unemployment, solid private sector balance sheets, and public spending on defence and infrastructure should continue to underpin growth.
In line with the Governing Council’s monetary policy strategy commitment to incorporate risks and uncertainty into its decision-making, staff also assessed how the war in the Middle East could affect economic growth and inflation under some alternative illustrative scenarios. These scenarios will be published with the staff projections on the ECB’s website. The scenario analysis suggests that a prolonged disruption in the supply of oil and gas would result in inflation being above, and growth being below, the baseline projections. The implications for medium-term inflation depend crucially on the magnitude of indirect and second-round effects of a stronger and more persistent energy shock.
The Governing Council will follow a data-dependent and meeting-by-meeting approach to determining the appropriate monetary policy stance. In particular, its interest rate decisions will be based on its assessment of the inflation outlook and the risks surrounding it, in light of the incoming economic and financial data, as well as the dynamics of underlying inflation and the strength of monetary policy transmission. The Governing Council is not pre-committing to a particular rate path.
Key ECB interest rates
The interest rates on the deposit facility, the main refinancing operations and the marginal lending facility will remain unchanged at 2.00%, 2.15% and 2.40% respectively.
Asset purchase programme (APP) and pandemic emergency purchase programme (PEPP)
The APP and PEPP portfolios are declining at a measured and predictable pace, as the Eurosystem no longer reinvests the principal payments from maturing securities.
***
The Governing Council stands ready to adjust all of its instruments within its mandate to ensure that inflation stabilises at its 2% target in the medium term and to preserve the smooth functioning of monetary policy transmission. Moreover, the Transmission Protection Instrument is available to counter unwarranted, disorderly market dynamics that pose a serious threat to the transmission of monetary policy across all euro area countries, thus allowing the Governing Council to more effectively deliver on its price stability mandate.
The President of the ECB will comment on the considerations underlying these decisions at a press conference starting at 14:45 CET today.