
Sample Category Title
WTI Crude Oil Holds Firm at Support, Is a Fresh Surge Coming?
Key Highlights
- WTI Crude Oil prices corrected gains and tested the $85.00 support.
- Earlier, there was a break below a bullish trend line at $96.00 on the 4-hour chart of XTI/USD.
- Gold is now struggling and might extend losses below $4,200.
- EUR/USD started a consolidation phase above the 1.1500 support.
WTI Crude Oil Price Technical Analysis
WTI Crude Oil prices rallied above $100 before correcting gains against the US Dollar. The price dipped below $98 and $95 to enter a short-term bearish zone.
Looking at the 4-hour chart of XTI/USD, the price traded below a bullish trend line at $96.00. However, the bulls were active above $85.00 and the 100 simple moving average (red, 4-hour). As a result, the price started a consolidation phase above $85.00.
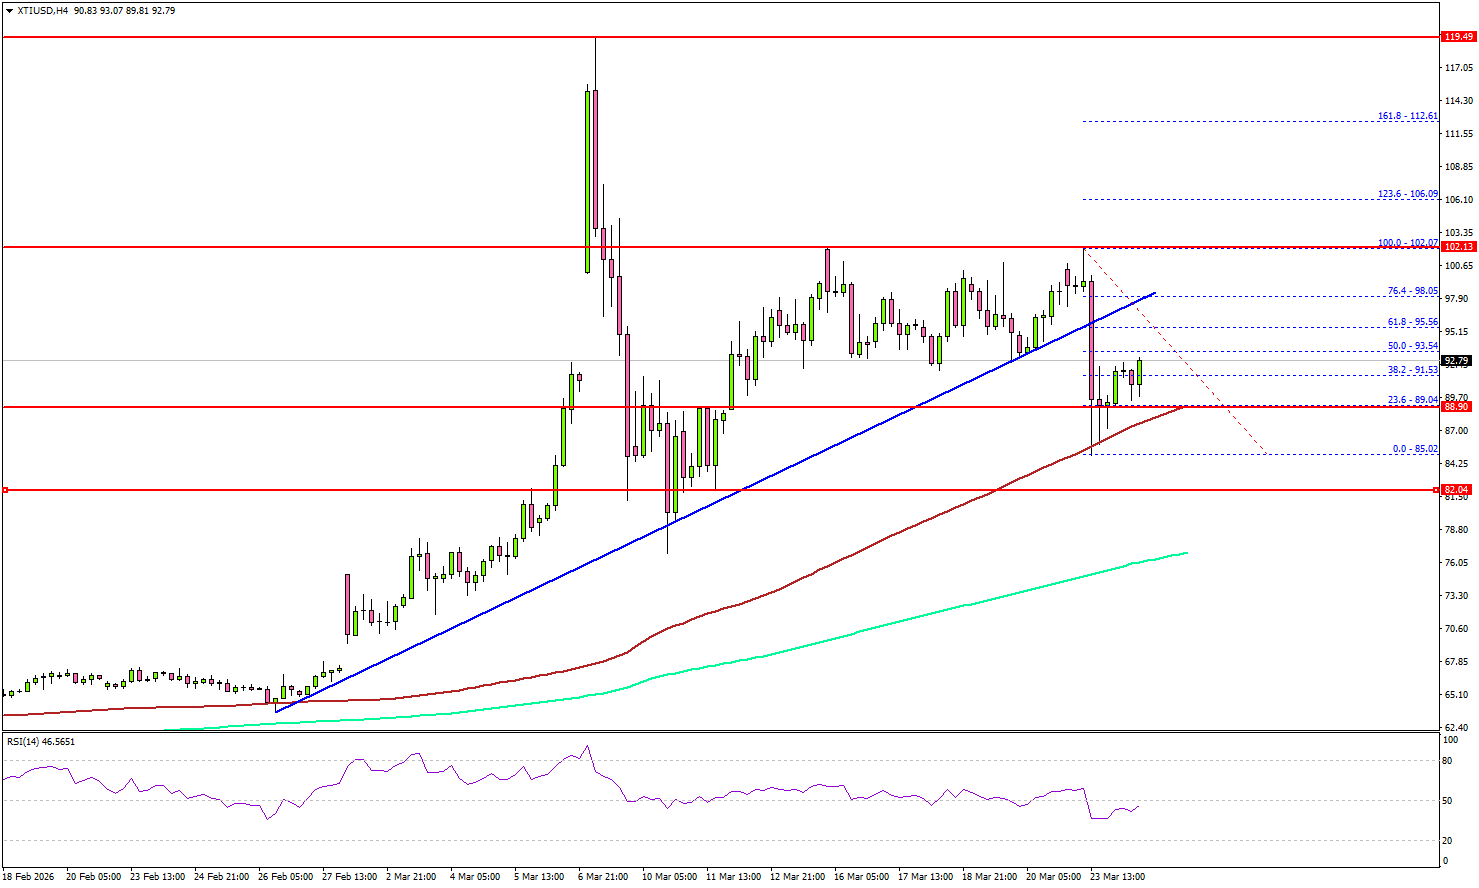
On the upside, immediate resistance is near the $95.50 level since it coincides with the 61.8% Fib retracement level of the downward move from the $102.07 swing high to the $85.02 low.
The first key hurdle for the bulls could be $98.00. A close above $98.00 might send Oil prices toward $102.00. Any more gains might call for a test of $105.00 in the near term.
On the downside, the first major support sits near the $89.00 zone and the 100 simple moving average (red, 4-hour). The next support could be $85.00, below which the price could dive and test $82.00.
A daily close below $82.00 could open the doors for a larger decline. In the stated case, the bears might aim for a drop toward $76.00 and the 200 simple moving average (green, 4-hour).
Looking at Gold, the bears remained in action, and they might soon aim for a fresh decline below the $4,200 level.
Economic Releases to Watch Today
- US Import Price Index for Feb 2026 (MoM) – Forecast +0.5%, versus +0.2% previous.
- US Export Price Index for Feb 2026 (MoM) – Forecast +0.5%, versus +0.6% previous.
Australia Inflation Eases Pre-War, RBA Still Faces Sticky Core Pressures
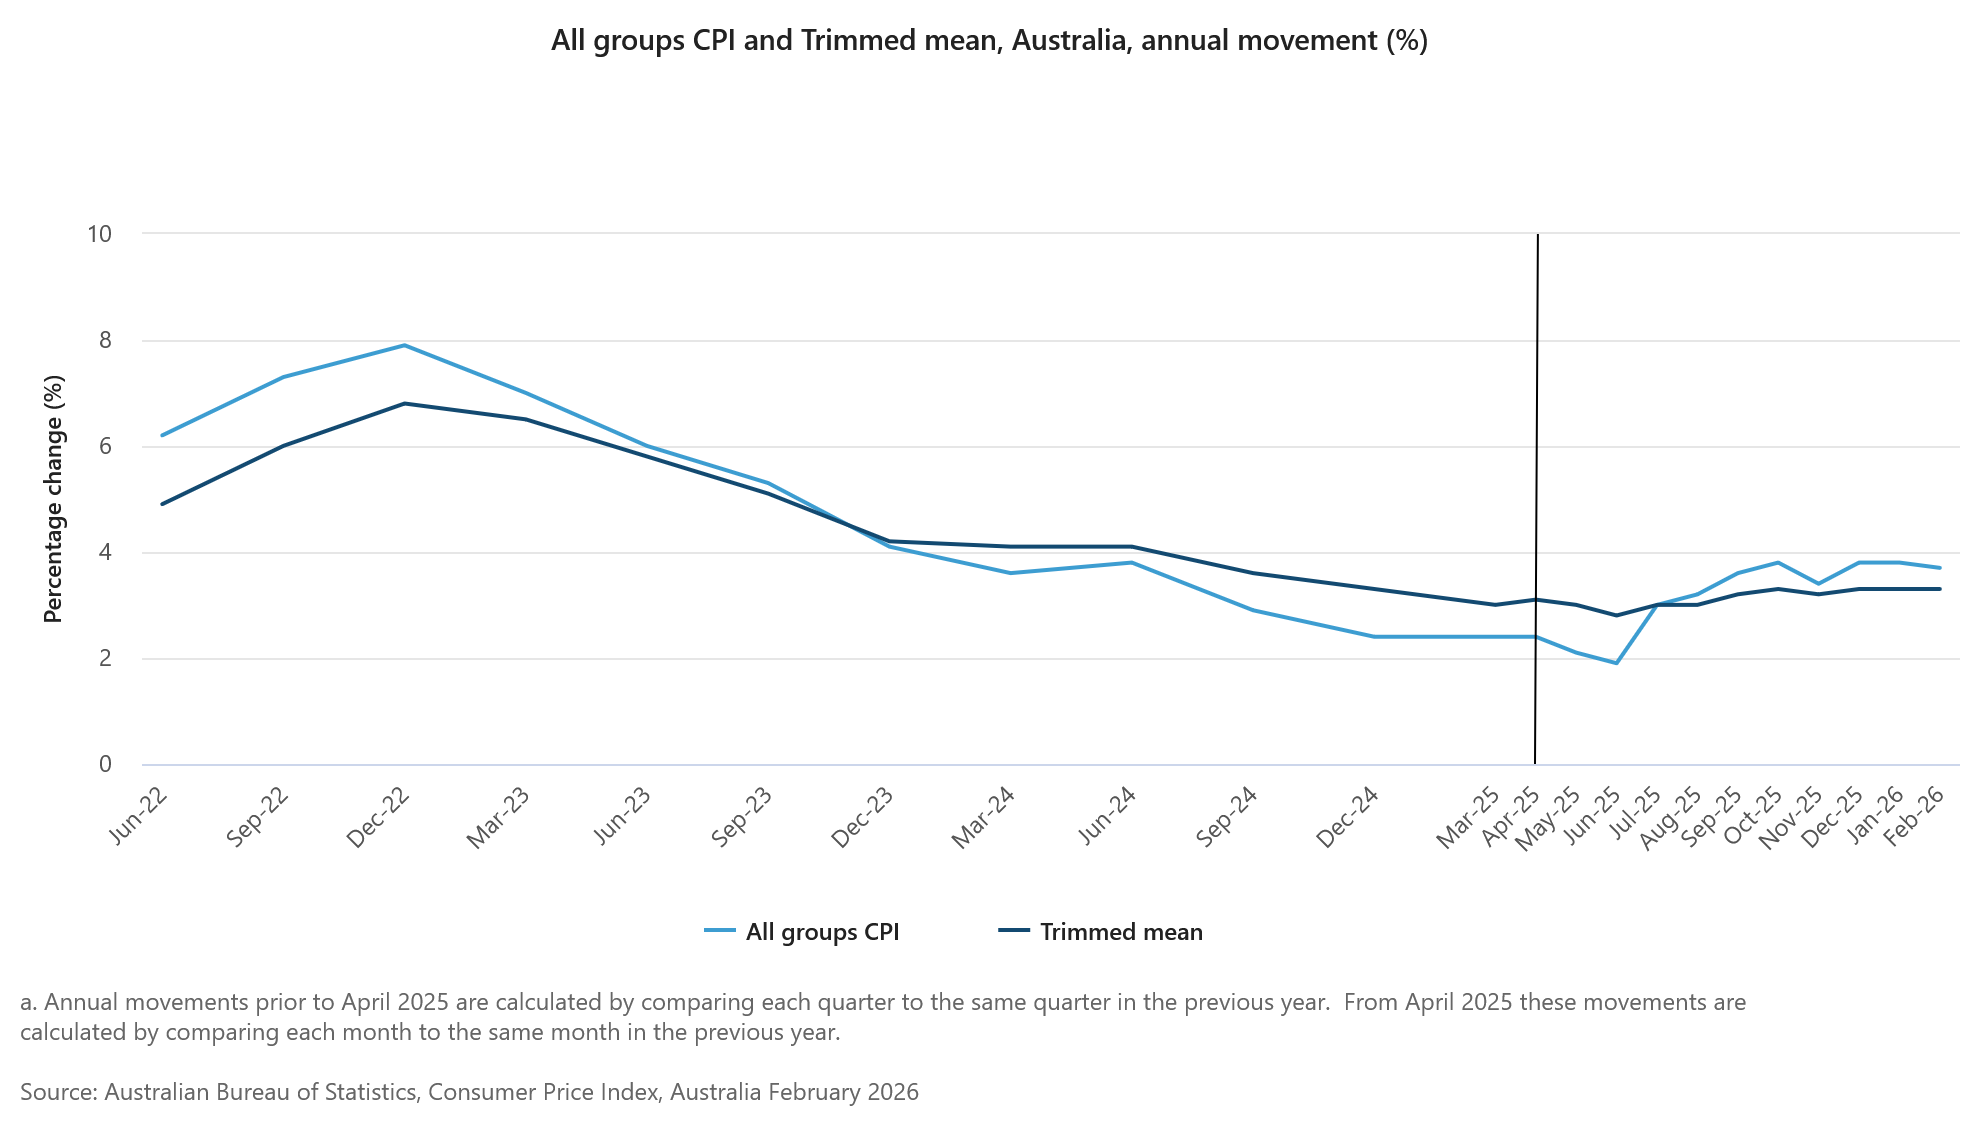
Australia’s inflation data for February showed modest cooling, though underlying pressures remain firm. Headline CPI was flat at 0.0% mom, below expectations of 0.1% mom, while annual inflation ticked down from 3.8% yoy to 3.7% yoy. The figures suggest that inflation is, at least, no longer accelerating, offering some relief for RBA policymakers.
However, core measures paint a more persistent picture. Trimmed mean CPI rose 0.2% mom, with the annual rate holding at 3.3% yoy for a third consecutive month. This stability in core inflation indicates that underlying price pressures are not easing meaningfully, despite the slight dip in headline numbers.
The composition of inflation also highlights ongoing concerns. Services inflation remained elevated at 3.9% yoy, outpacing goods inflation, which slowed from 3.8% yoy to 3.5% yoy. Key contributors included housing, food, and recreation, underscoring that domestic price pressures, particularly in services, remain entrenched.
Crucially, these readings predate the latest surge in energy prices driven by geopolitical tensions. As higher fuel costs begin to feed through to transport and broader goods and services, inflation risks are likely to tilt higher again. This leaves the RBA facing a more uncertain outlook, with policy decisions increasingly complicated by the evolving external environment.
Interest Rate Path May Shift as Fed’s Goolsbee Warns of New Inflation Shock
Chicago Fed President Austan Goolsbee warned that the latest surge in energy prices risks complicating the inflation outlook at a delicate stage in the policy cycle. Speaking to PBS News Hour, he said the economy is now facing a new inflation shock before fully absorbing the previous one.
"We're likely to see an impact driving up inflation at a time when we still haven't quite cleared the previous shock that was driving up inflation," Goolsbee said.
Goolsbee emphasized that any path toward rate cuts this year depends on clear progress in inflation. "For it to be realistic that rates would come down further this year we've got to see progress on inflation," he added.
"With inflation going up more, we're going to have to really think through what the options are and how we're going to get through it," he said.
Fed Rate Cuts on Hold as Barr Seeks Clear Inflation Progress
Fed Governor Michael Barr indicated that the labor market is showing signs of stabilization, but stressed that inflation remains the dominant concern for monetary policy. He noted that while employment conditions have steadied, price pressures continue to run "notably" above the Fed’s 2% objective.
Barr acknowledged that inflation could ease over time but warned that rising oil prices pose a fresh risk. Higher energy costs are already feeding through to gasoline and broader consumer prices. He made clear that any move toward rate cuts would require stronger evidence that inflation is on a sustained downward path.
"I would like to see evidence that goods and services price inflation is sustainably retreating before considering reducing the policy rate further, provided labor market conditions remain stable," he said.
Metals Space as Confused as Traders – Silver (XAG/USD) & Gold (XAU/USD) Intraday Outlook
- Silver, Gold, and Platinum are consolidating after consequential corrections in the past few sessions
- As Traders still attempt to price the next phase of the conflict, metals have formed a short-term bottom. Will it translate to a long-term one?
- Intraday timeframe analysis for XAG/USD and XAU/USD
Today is an unusual session for the markets following a chaotic day yesterday.
Participants cannot be blamed for the current uncertainty; we are now in the aftermath of a series of decisions made by major Central Banks. Fundamentals are inconsistent, leading to a widespread sense of confusion across all asset classes, resulting in a slow consolidation.
Given that many of the world's most educated economists, like the Federal Reserve Chairman Jerome Powell and other Central Bankers, seemingly struggle to understand the ongoing situation, it will be challenging to predict the market's direction once the uncertainty lifts.
Metals are not immune to this confusion, especially after experiencing volatile 10% swings up and down yesterday – They are today, however, experiencing a relatively calmer session: Silver is up a shy 1%, Gold retreats from $4,400 and other Metals like Platinum are hanging close to unchaged.
In general, after periods of significant volatility and a lull in news, the markets tend to trade within a range. This is precisely what we are witnessing today.
The best approach now is to take a step back and prepare for what lies ahead. These types of sessions offer key breakout levels, as algos and traders await news to catalyze the next movement in the markets.
Let's explore the recent shifts in an intraday timeframe analysis of Gold (XAU/USD) and Silver (XAG/USD) to identify where are the key levels to watch for breakouts.
Gold (XAU/USD) 4H Chart and levels
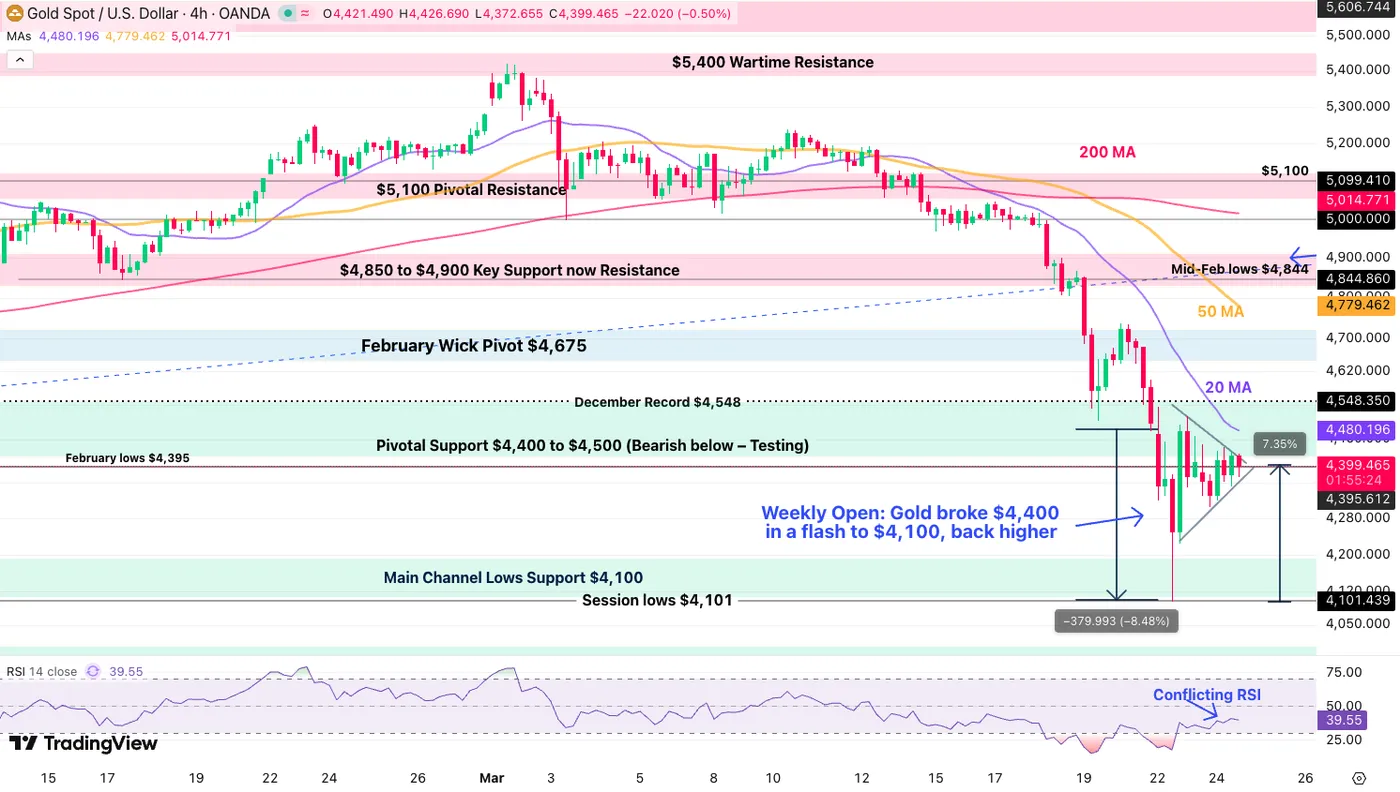
Gold (XAU/USD) 4H Chart, March 24, 2026 – Source: TradingView
Gold is now stuck in a triangle formation right at its quintessential $4,400 level – decisive for upcoming action.
Remaining with +/- $75 of the psychological zone gives a further sense of uncertainty, hence this provides key breakout levels to play as the week continues:
- Above $4,475, Bulls will hold the advantage until $4,700
- Below $4,325 however, expect $4,100 to retest swiftly
Intraday Timeframe Levels to watch for Gold (XAU/USD):
Resistance Levels:
- Short-term breakout level $4,475
- February Wick Pivot $4,675 - $4,725
- $4,850 to $4,900 Key Resistance
- $5,100 Pivotal Resistance
- $5,400 mini-resistance
Support Levels:
- Pivotal Support $4,325 – $4,400
- Main Channel Lows Support $4,100
- Higher Timeframe Support $3,880 to $4,000
- $3,200 to $3,500 Major Support
Silver (XAG/USD) 4H Chart and levels
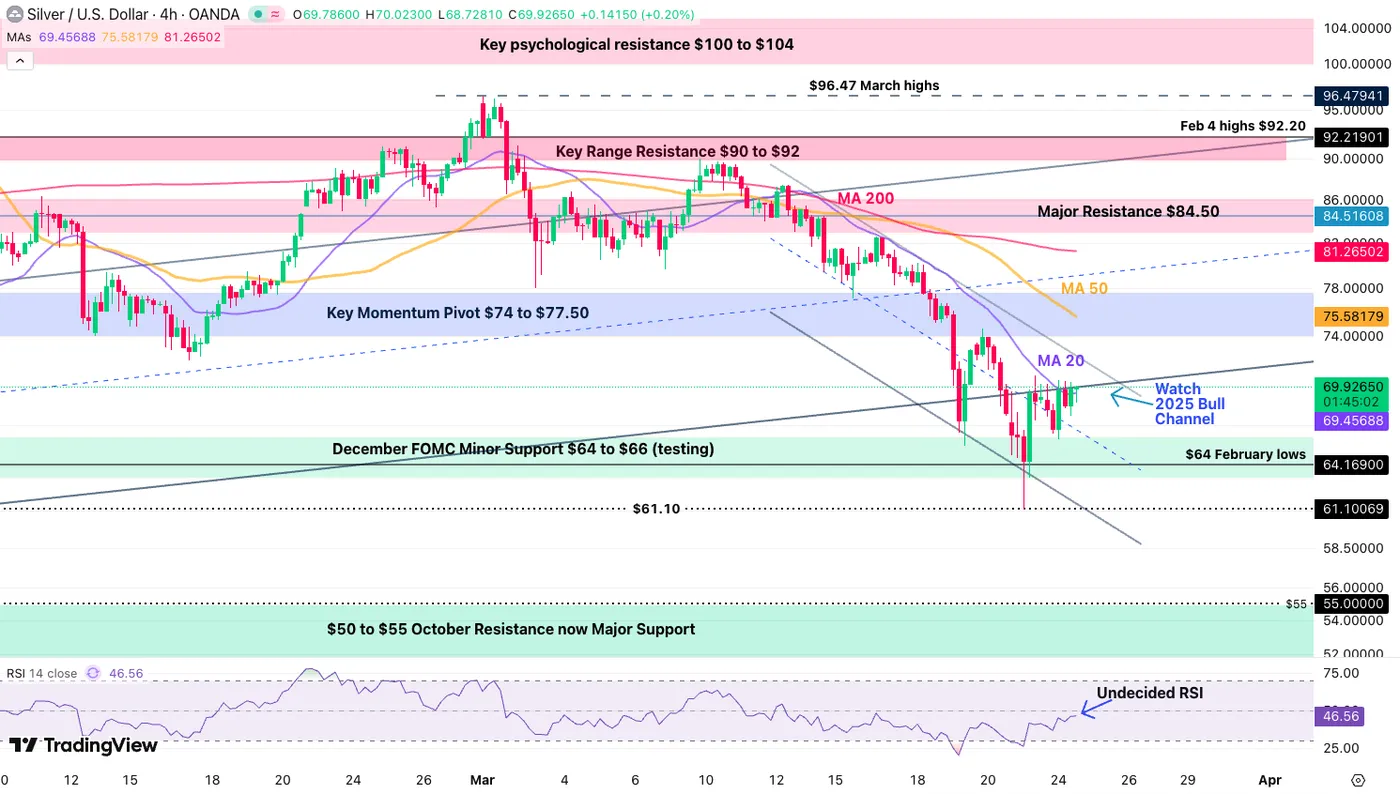
Silver (XAG/USD) 4H Chart, March 24, 2026 – Source: TradingView
Silver has seen similar volatility and is now fighting to hold its $70 key level (+/- $1)
- Rebounding and closing on a 4H candle above $71 would point to a swift retest of $75 to $77.50 Momentum Pivot level, re-entering its 2025 bull channel
- Extending above $80 puts back the trend in the bull's hand
- Rejecting $69 however would point to a retest of the $62 previous session support.
- Breaking below $61 hints at the $50 to $55 October 2025 Support
Higher Timeframe Levels to watch for Silver (XAG/USD):
Resistance Levels:
- $71 intraday resistance
- Key Momentum Pivot $74 to $77.50
- Major Resistance $84.50 (50-Day MA)
- Higher Timeframe and War Resistance $90 to $95
- Current Record $121.67
Support Levels:
- December FOMC Minor Support $64 to $66
- $61.10 Past Session lows
- $50 to $55 October Resistance now Major Support
- Silver's 2011 All-time highs $49.81
Safe Trades!
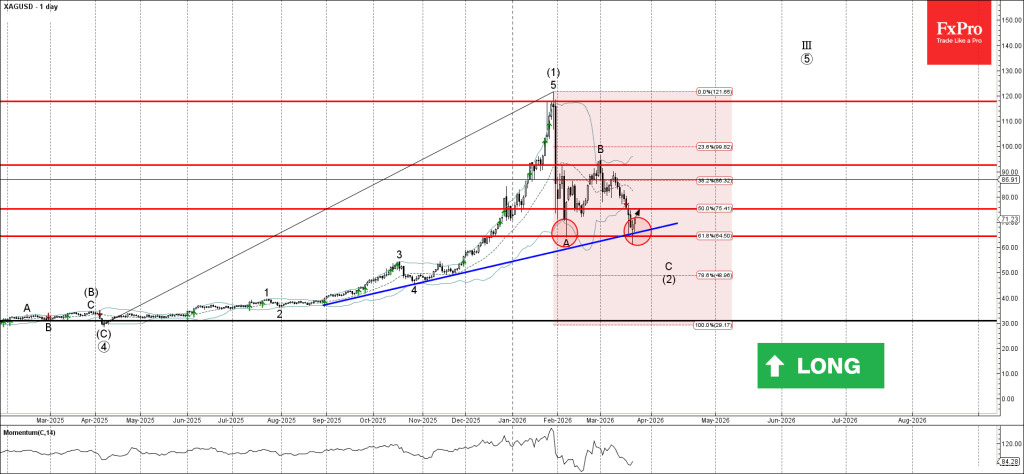
Silver Wave Analysis
Silver: ⬆️ Buy
- Silver reversed from support zone
- Likely to rise to resistance level 75.30
Silver recently reversed from the support area between the support level 64.30 (former low of wave (A) from February), lower daily Bollinger Band and 61.8% Fibonacci correction of the uptrend from April of 2025.
The upward reversal from this support zone created the daily Japanese candlesticks reversal pattern Hammer.
Given the strong daily uptrend, Silver can be expected to rise toward the next resistance level 75.30 (former support from February).
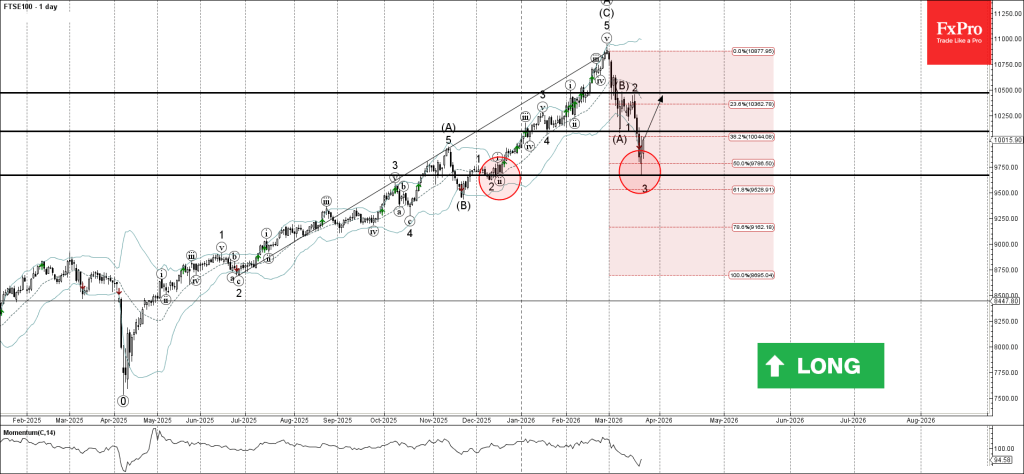
FTSE 100 Wave Analysis
FTSE 100: ⬆️ Buy
- FTSE 100 reversed from support zone
- Likely to rise to resistance level 10100.00
FTSE 100 index recently reversed from the support area between the support level 9670.00 (which reversed the price twice in December), lower daily Bollinger Band and 50% Fibonacci correction of the upward impulse from last May.
The upward reversal from this support zone stopped the previous impulse wave 3 of the intermediate impulse wave (C) from the start of March.
Given the strong daily uptrend, FTSE 100 index can be expected to rise toward the next resistance level 10100.00 (former low of wave (A)).
Eco Data 3/25/26
| GMT | Ccy | Events | Act | Cons | Prev | Rev |
|---|---|---|---|---|---|---|
| 23:50 | JPY | BoJ Minutes | ||||
| 00:30 | AUD | CPI M/M Feb | 0.00% | 0.10% | 0.40% | |
| 00:30 | AUD | CPI Y/Y Feb | 3.70% | 3.80% | 3.80% | |
| 00:30 | AUD | Trimmed Mean CPI M/M Feb | 0.20% | 0.30% | 0.30% | |
| 00:30 | AUD | Trimmed Mean CPI Y/Y Feb | 3.30% | 3.30% | 3.30% | |
| 07:00 | GBP | CPI Y/Y Feb | 3.00% | 3.00% | 3.00% | |
| 07:00 | GBP | Core CPI Y/Y Feb | 3.20% | 3.10% | 3.10% | |
| 07:00 | GBP | RPI Y/Y Feb | 3.60% | 3.70% | 3.80% | |
| 07:00 | GBP | PPI - Input M/M Feb | 0.80% | 0.50% | 0.40% | 0.30% |
| 07:00 | GBP | PPI - Input Y/Y Feb | 0.50% | 0.40% | -0.20% | -0.40% |
| 07:00 | GBP | PPI - Output M/M Feb | -0.50% | 0.20% | 0.00% | |
| 07:00 | GBP | PPI - Output Y/Y Feb | 1.70% | 2.60% | 2.50% | |
| 07:00 | GBP | PPI Core Output M/M Feb | -0.80% | 0.20% | ||
| 07:00 | GBP | PPI Core Output Y/Y Feb | 1.90% | 2.90% | ||
| 09:00 | CHF | UBS Economic Expectations Mar | -35 | 9.8 | ||
| 09:00 | EUR | Germany IFO Business Climate Mar | 84.6 | 86.3 | 88.6 | |
| 09:00 | EUR | Germany IFO Current Assessment Mar | 86.7 | 86 | 86.7 | |
| 09:00 | EUR | Germany IFO Expectations Mar | 86 | 86 | 90.5 | |
| 12:30 | USD | Current Account (USD) Q4 | -191B | -211B | -226B | -239B |
| 12:30 | USD | Import Price Index M/M Feb | 1.30% | 0.20% | 0.20% | 0.60% |
| 14:30 | USD | Crude Oil Inventories (Mar 20) | -1.3M | 6.2M |
| 23:50 | JPY |
| BoJ Minutes | |
| Actual | |
| Consensus | |
| Previous | |
| 00:30 | AUD |
| CPI M/M Feb | |
| Actual | 0.00% |
| Consensus | 0.10% |
| Previous | 0.40% |
| 00:30 | AUD |
| CPI Y/Y Feb | |
| Actual | 3.70% |
| Consensus | 3.80% |
| Previous | 3.80% |
| 00:30 | AUD |
| Trimmed Mean CPI M/M Feb | |
| Actual | 0.20% |
| Consensus | 0.30% |
| Previous | 0.30% |
| 00:30 | AUD |
| Trimmed Mean CPI Y/Y Feb | |
| Actual | 3.30% |
| Consensus | 3.30% |
| Previous | 3.30% |
| 07:00 | GBP |
| CPI Y/Y Feb | |
| Actual | 3.00% |
| Consensus | 3.00% |
| Previous | 3.00% |
| 07:00 | GBP |
| Core CPI Y/Y Feb | |
| Actual | 3.20% |
| Consensus | 3.10% |
| Previous | 3.10% |
| 07:00 | GBP |
| RPI Y/Y Feb | |
| Actual | 3.60% |
| Consensus | 3.70% |
| Previous | 3.80% |
| 07:00 | GBP |
| PPI - Input M/M Feb | |
| Actual | 0.80% |
| Consensus | 0.50% |
| Previous | 0.40% |
| Revised | 0.30% |
| 07:00 | GBP |
| PPI - Input Y/Y Feb | |
| Actual | 0.50% |
| Consensus | 0.40% |
| Previous | -0.20% |
| Revised | -0.40% |
| 07:00 | GBP |
| PPI - Output M/M Feb | |
| Actual | -0.50% |
| Consensus | 0.20% |
| Previous | 0.00% |
| 07:00 | GBP |
| PPI - Output Y/Y Feb | |
| Actual | 1.70% |
| Consensus | 2.60% |
| Previous | 2.50% |
| 07:00 | GBP |
| PPI Core Output M/M Feb | |
| Actual | -0.80% |
| Consensus | |
| Previous | 0.20% |
| 07:00 | GBP |
| PPI Core Output Y/Y Feb | |
| Actual | 1.90% |
| Consensus | |
| Previous | 2.90% |
| 09:00 | CHF |
| UBS Economic Expectations Mar | |
| Actual | -35 |
| Consensus | |
| Previous | 9.8 |
| 09:00 | EUR |
| Germany IFO Business Climate Mar | |
| Actual | 84.6 |
| Consensus | 86.3 |
| Previous | 88.6 |
| 09:00 | EUR |
| Germany IFO Current Assessment Mar | |
| Actual | 86.7 |
| Consensus | 86 |
| Previous | 86.7 |
| 09:00 | EUR |
| Germany IFO Expectations Mar | |
| Actual | 86 |
| Consensus | 86 |
| Previous | 90.5 |
| 12:30 | USD |
| Current Account (USD) Q4 | |
| Actual | -191B |
| Consensus | -211B |
| Previous | -226B |
| Revised | -239B |
| 12:30 | USD |
| Import Price Index M/M Feb | |
| Actual | 1.30% |
| Consensus | 0.20% |
| Previous | 0.20% |
| Revised | 0.60% |
| 14:30 | USD |
| Crude Oil Inventories (Mar 20) | |
| Actual | |
| Consensus | -1.3M |
| Previous | 6.2M |
Is the War Taking a New Turn? – WTI Technical Analysis
- Oil tumbled in the previous session as negotiations could be back on the table.
- Nevertheless, realities of war indicate that the conflict isn't looking to ease like this, which could prevent positive sentiment.
- Exploring an in-depth Technical Analysis of the commodity
In War, there are words and realities, propaganda and clearly defined facts – and the frontier between both is rarely so transparent.
President Trump changed the Market trajectory after saying US-Iran negotiations could resume, a report initially denied by Iran but later confirmed as Iranian Parliament Speaker Qalibaf travelled to Pakistan, where talks would reportedly occur.
The fact that his diplomatic flight took place with US and Israeli approval proves that the US President wasn't just blowing steam – particularly given Al Arabiya reports that Mojtaba Khamenei, the newly appointed Ayatollah, would also be open to talks.
Nevertheless, the cloud remains over how deep and effective these talks would be regarding an official dropping of Iranian Ballistic Missiles and nuclear program, and, more importantly for immediate markets, the reopening of the Strait of Hormuz.
A ceasefire deal is currently priced at around 44% for the end of April – to me, people are a bit pessimistic about the potential for the War to end sooner rather than later.
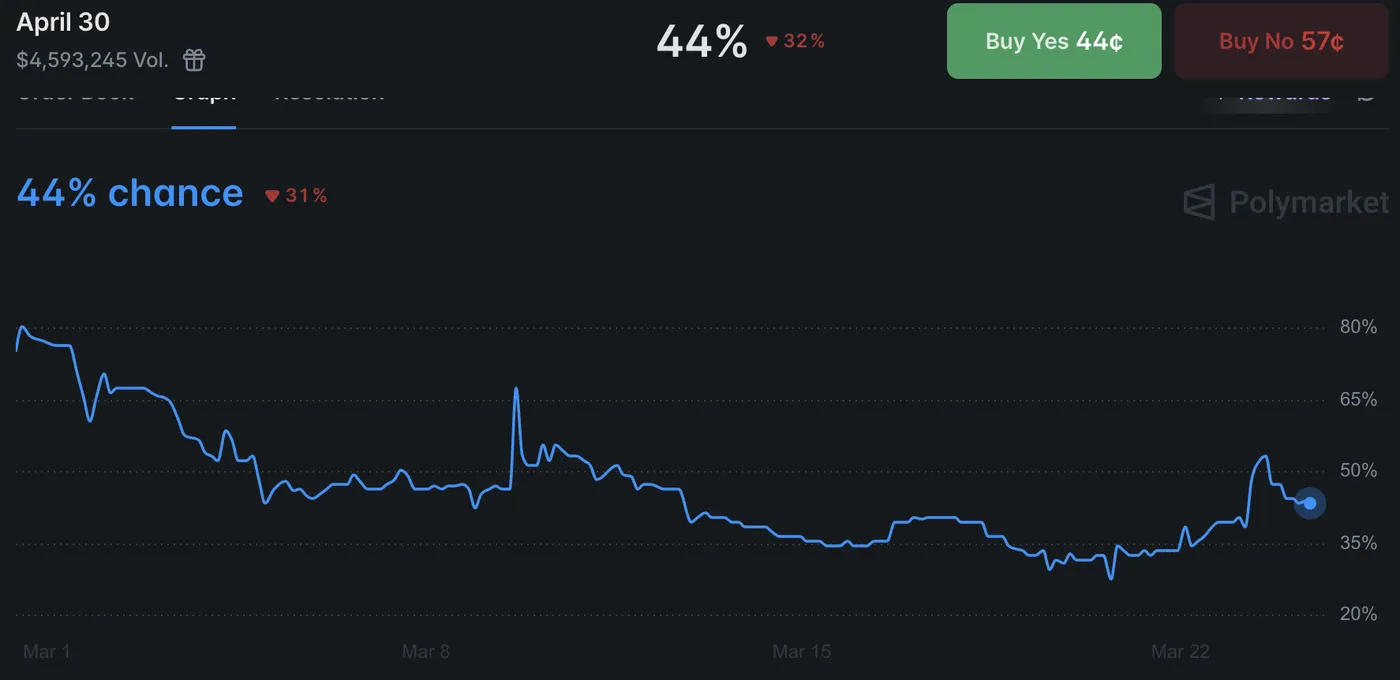
US-Iran Ceasefire – Source: Polymarket. March 24, 2026
The reality, however, gets a bit different, with Gas infrastructure attacks, Saudi Arabia leaning to join the war and changing its stance, and the fleet of 4,500 Marines arriving in the Middle East towards the end of the week.
The latter is the most concerning fact for Markets, leading to swift comparisons to Afghanistan and Iraq, which also hints at a much longer war.
It will depend, of course, on how negotiations result:
Will it result in free passage in the Strait of Hormuz? Will the Iranian population gain more power and freedom after the 5-week initial Wartime Period? Will attacks on both sides actually cease and lead to longer-term peace?
All of these questions will have to find clear answers in order for Markets to get rid of the uncertainty cloud looming over investors since the beginning of March.
As the situation should become clearer as this week continues, let's dive into a multi-timeframe analysis of WTI (US) Oil to spot where potential action could take place and where to look if they fail.
US Oil Multi-Timeframe Analysis
WTI Daily Chart
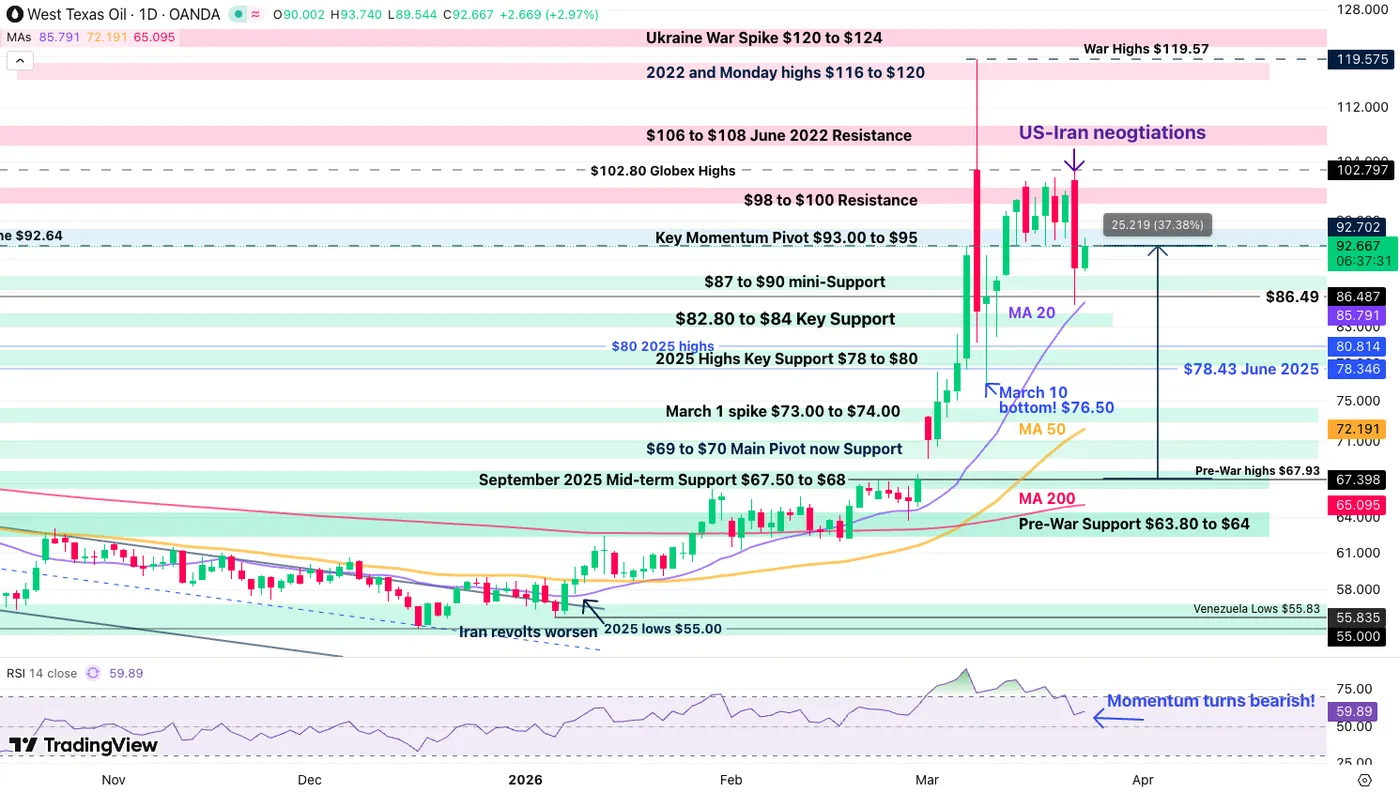
WTI Oil Daily Chart – March 24, 2026. Source: TradingView
With the intense volatility seen in the commodity since the beginning of the conflict, the daily chart can seen quite unclear.
But traders need to look at what is standing out:
Yesterday's drop tested the 20-Day Moving Average ($86.00) which remains the indicator dictating momentum – breaching it to the downside would imply further easing in conditions. Above, the action remains relatively bullish.
Also, yesterday's move lower actually brought the action back right around the War Spike, implying that the action is at least much more balanced than it was in the past week.
As the morning session continues, Bulls are attempting a rebound, hence, the levels to watch for momentum clearly remains the $93.00 to $95 zone (bullish above, neutral/bearish below).
WTI 4H Chart and Technical Levels
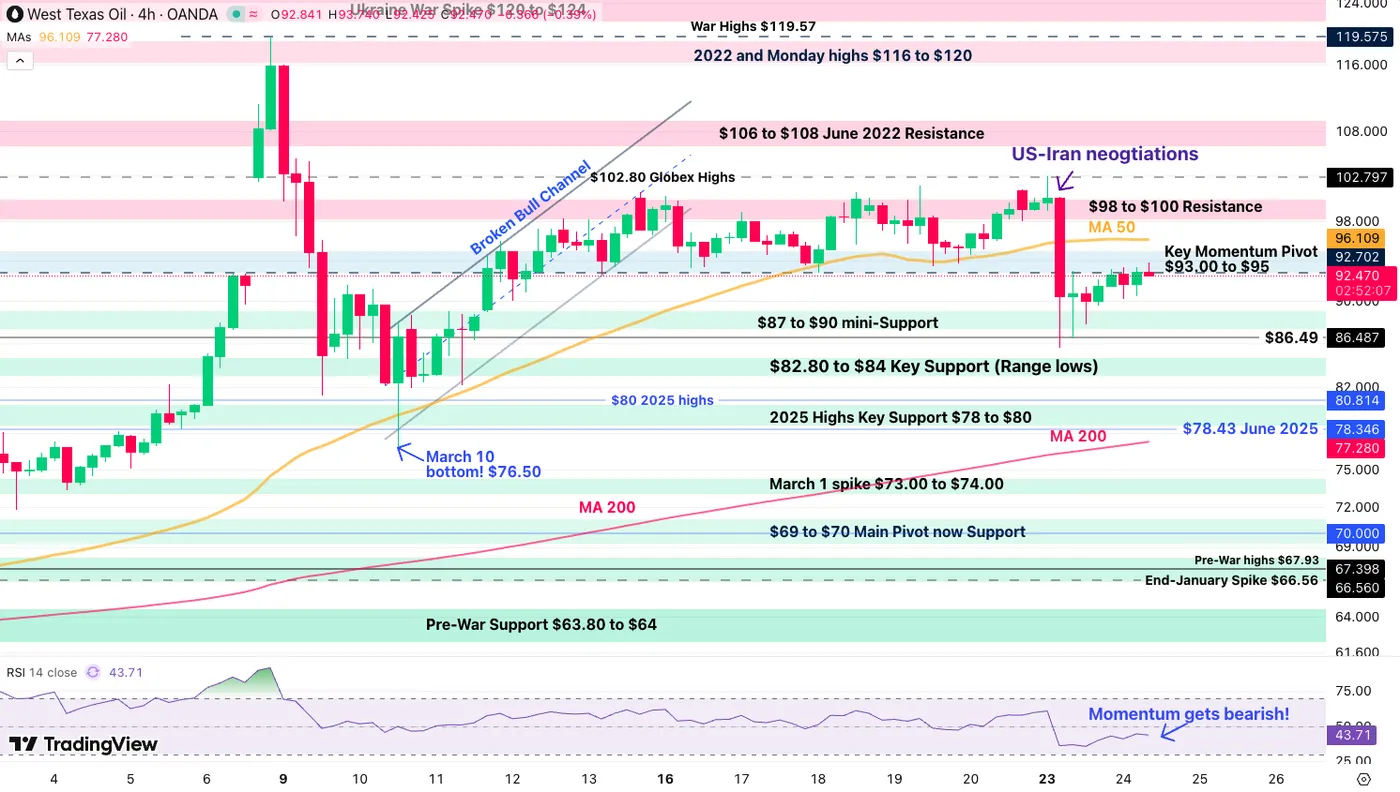
WTI Oil 4H Chart – March 24, 2026. Source: TradingView
The 4H RSI is at least not pointing to a further rally from where things stand:
Forming a top-looking shape, bull exhaustion at the Key Pivot area could forge at least a new range below $93.
WTI Technical Levels:
Resistance Levels
- $92.70 Intraday Resistance
- Key Momentum Pivot $93.00 to $95 (immediate resistance, bear below)
- $96.11 4H 50-period MA
- $98 to $100 Resistance
- $106 to $108 June 2022 Resistance
- 2022 and Monday highs $116 to $120
Support Levels
- $87 to $90 mini-Support
- Past session lows $86.49
- $82.80 to $84 Key Support
- 2025 Highs Key Support $78 to $80
- Past week spike $73.00 to $74.00
- $69 to $70 Main Support (If Ceasefire, should quickly head towards there)
- 2025 lows $55.00
1H Chart and Action levels
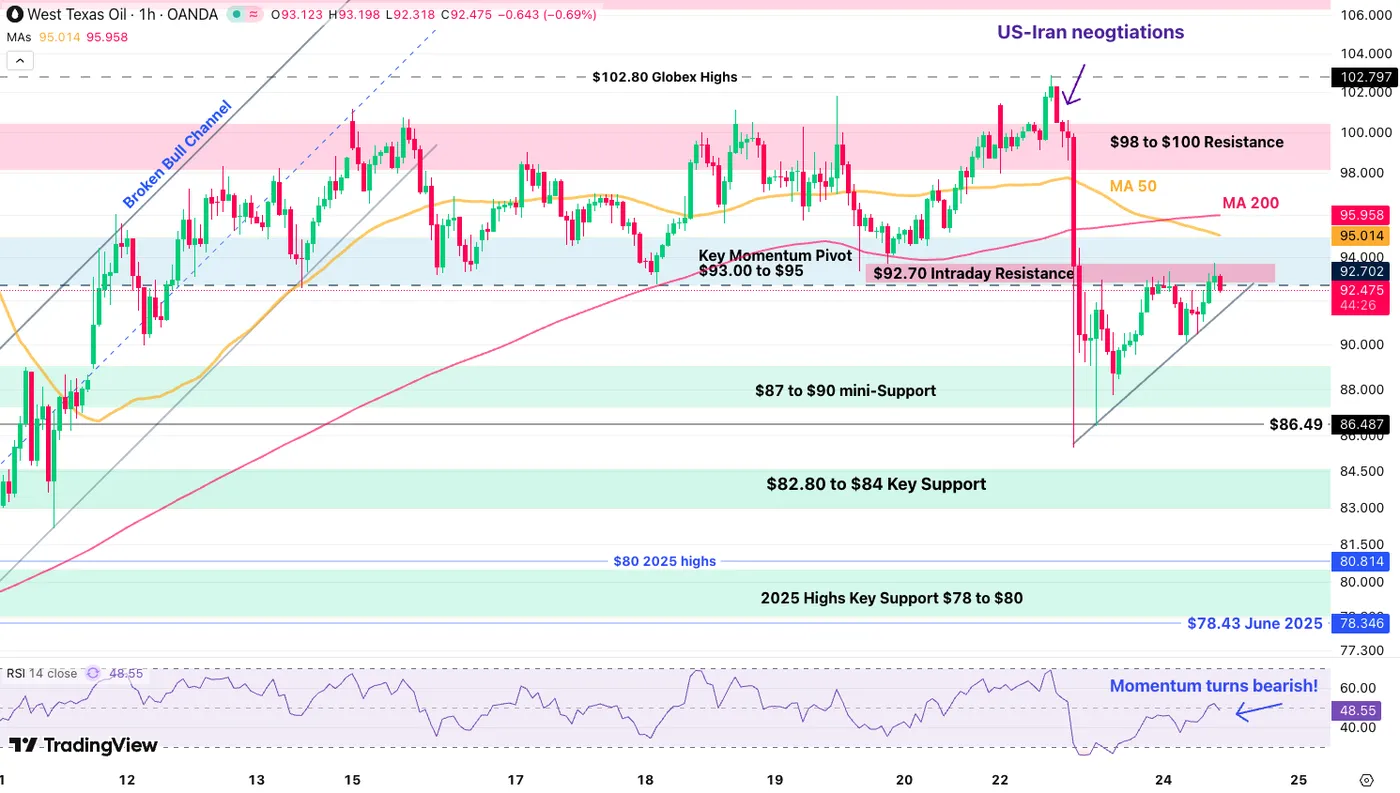
WTI Oil 1H Chart – March 24, 2026. Source: TradingView
The 1H timeframe really shows how yesterday tilted the scales towards towards a more balanced price action – even slightly bearish.
Yesterday's announcement brought a wave of optimism which quickly found its lows; WTI has been rallying slowly since and forming a rising wedge formation (bearish).
The 1H RSI is also turning lower from neutral, a sign of potential reversal.
But all things considered, as long as bears can't reject the $92.70 intraday resistance, the action is more mixed than anything – breaking the intraday highs would give the upper hand to the bulls towards $95.
Keep track of the headlines and the Wedge support.
Safe Trades!
Sunset Market Commentary
Markets
Eurozone output growth slowed in March as input cost inflation hits the highest level for over three years. EMU March PMI’s give a sobering, though expected, indication on how the war in the Middle-East could impact the economy. The composite PMI decreased from 51.9 to 50.5, a 10-month low. The slowdown in growth was in large part due to a near stagnation of business activity in the service sector (50.1 from 51.9). The manufacturing PMI increased from 50.8 to 51.4. An overall decline of new orders centred on services. For a third month in a row, there was a marginal reduction in staffing levels. Companies continued to predict a rise in output over the coming year, but the degree of optimism was below the series average. The most market-relevant details came from price components. The sharp increase in input costs already spills to selling prices though at a less pronounced pace (still steepest pace since February 2024 though). The war also caused disruption to supply chains, with manufacturers reporting the most marked lengthening of suppliers' delivery times in over three-and-a-half years. S&P Global, responsible for the release, commented that the survey’s price gauge is indicative of CPI inflation accelerating close to 3%, with cost pressure likely to add still further to selling price inflation in the coming months. Data underscore that the ECB is no longer in a good place. ECB policy makers in the meantime keep calling for (extra) vigilance on possible second-round effects coming from energy prices. PMI’s suggest that the pass-through occurs immediately. New vice-president Vujcic this morning said that policy makers will soon know whether they must act with “a lot of new data and news” available by April. He suggested to start with a small move (+25 bps) if hikes are needed and believes that we’re already departing from the baseline forecast towards the alternative scenario. Under the “adverse” one, EMU CPI is expected to average 3.5% this year assuming that the ECB keeps policy rates unchanged. For the record, US PMI’s painted a similar picture with the survey’s price gauges pointing to CPI accelerating back to 4%!
PMI’s, hawkish ECB-rhetoric and conflicting signals from the Middle-East (TACO vs Israeli attacks & Iranian denial & potential Saudi/UAE involvement & Russian export curb on fertilizers) already call an end to yesterday’s intraday market turnaround. The EMU swap rate curve bear flattens with yields rising by more than 10 bps at the front end of the curve. US yields rise by up to 5 bps. The only true market compass, the oil price, sticks above $100/b. The equity rebound is short-lived with key US and European indices losing 0.5% and more. The dollar profits with EUR/USD back below 1.16. Gold prices are down for a record tenth day on a row.
News & Views
The Middle East conflict sent chilling stagflationary vibes across the UK in March. The composite PMI fell to 51 from 53.7, dragged lower by the services sector (51.2 from 53.9). Lower business and consumer confidence led to the first decline in total new work in four months and delivery times lengthened amid ships re-routing and production stoppages at Middle East petrochemical suppliers. Input cost inflation, meanwhile, was the steepest since February 2023. Manufacturing even showed the largest acceleration (from February) in price pressures since the GBP depreciation following Black Wednesday in 1992. Squeezed margins and softer business activity growth contributed to another reduction in private sector employment. Job shedding picked up from last month. The one year ahead forward looking indicator eased to the lowest for nine months reflecting marked declines in optimism across both sectors. Geopolitical concerns were the top mentioned factor, alongside worries about the cost of living and weak domestic economic prospects. EUR/GBP shrugged at the release. The pair barely budget in the mid 0.86-0.87 area.
As a heavy net energy importer, Turkey is feeling the heat from Iran-related volatility. The country braces for inflation and balance-of-payment shocks at a time when domestic prices are already surging more than 30% (February data). That’s pressuring the country’s currency hard, particularly against the USD. Turkey officials are constantly intervening to keep lira depreciation limited to the monthly inflation rate, leading to heavy FX reserve drawdowns and the sale of foreign-currency bonds, including Treasuries. Bloomberg reported that officials are now considering to tap into their $135bn gold reserve. Gold prices fell marginally on the news with bullion now changing hands around $4360. USD/TRY currently trades around 44.35 with YtD gains (TRY losses) having mounted to 3.3%.