

Sample Category Title
USD/CHF Daily Outlook
Daily Pivots: (S1) 0.8934; (P) 0.8969; (R1) 0.8997; More...
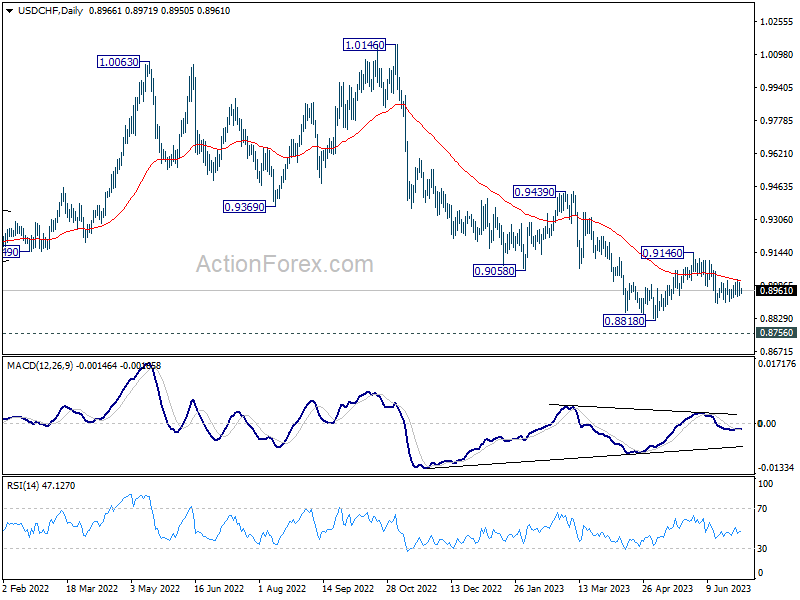
Intraday bias in USD/CHF remains neutral as range trading continues. Near term outlook stays bearish for now. On the downside, break of 0.8900 will resume the fall from 0.9146 to 0.8818 low or below. On the upside, above 0.9015 will bring stronger rise towards 0.9146 resistance instead.
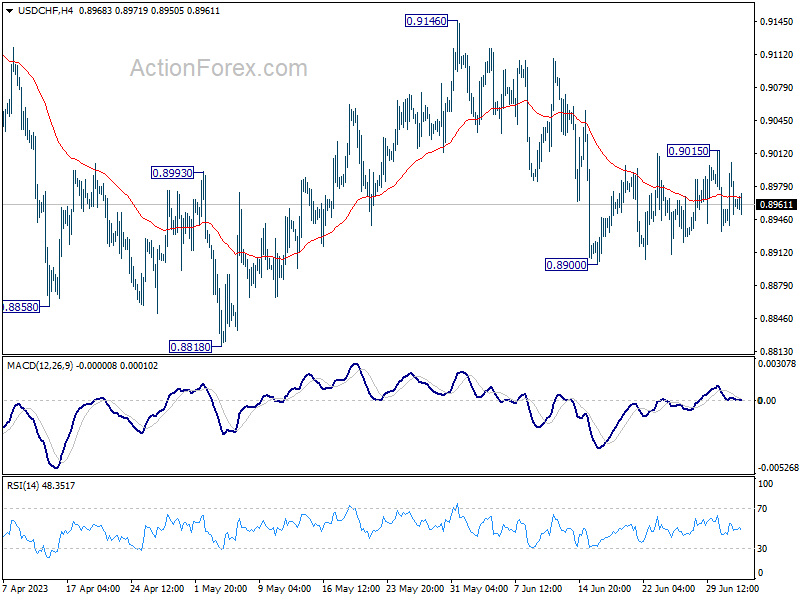
In the bigger picture, fall from 1.1046 (2022 high) is seen as a leg in the long term range pattern from 1.0342 (2016 high). While further decline cannot be ruled out, strong support is expected from 0.8756 long term support to bring reversal. Firm break of 0.9146 resistance should confirm medium term bottoming.
USD/JPY Daily Outlook
Daily Pivots: (S1) 144.14; (P) 144.53; (R1) 145.06; More...
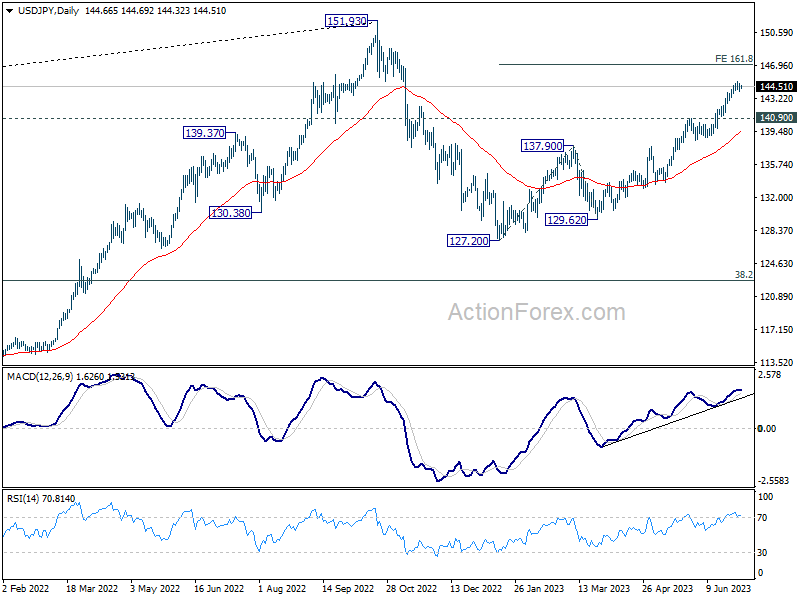
USD/JPY is extending the consolidation from 145.05 and intraday bias remains neutral. On the downside, break of 55 4H EMA (now at 143.67) could trigger deeper correction. But further rally will remain in favor as long as 140.90 resistance turned support holds. On the upside, break of 145.06 will resume larger rise to 161.8% projection of 127.20 to 137.90 from 129.62 at 146.93.
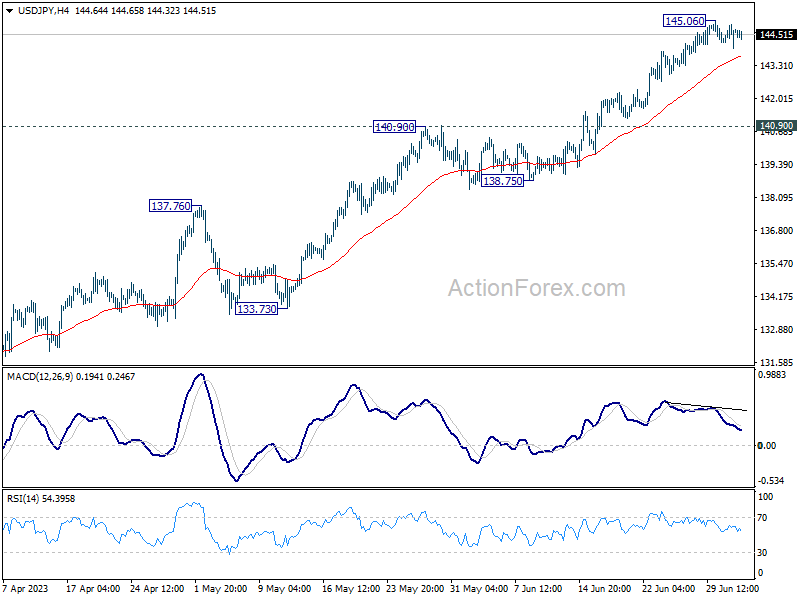
In the bigger picture, rise from 127.20 is currently seen as the second leg of the corrective pattern from 151.93 high. Further rally is expected as long as 138.75 support holds, to retest 151.93. But strong resistance could be seen there to limit upside. Break of 138.75 will indicate the the third leg has started back towards 127.20.
USD/CAD Daily Outlook
Daily Pivots: (S1) 1.3229; (P) 1.3252; (R1) 1.3273; More....
Range trading continues in USD/CAD and intraday bias stays neutral for the moment. Outlook is unchanged that a short term bottom was formed at 1.3115, and further rise is mildly in favor. Break of 1.3284 will resume the rebound from 1.3115 to 55 D EMA (now at 1.3374).
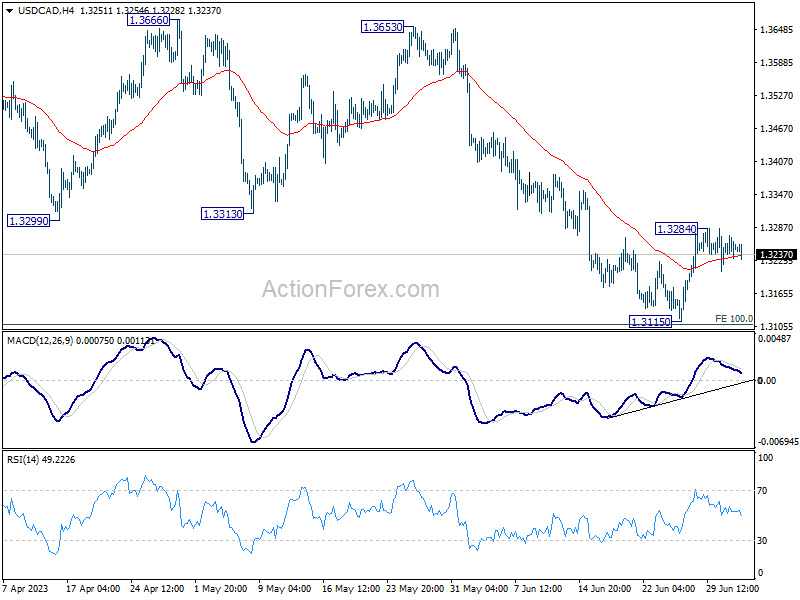
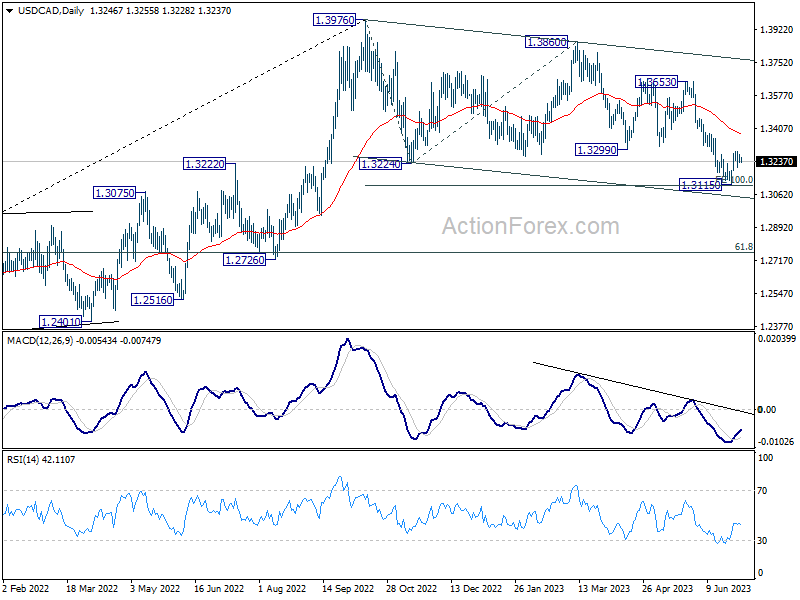
In the bigger picture, price actions from 1.3976 are still viewed as a correction to up trend from 1.2005 (2021 low). Risk will stay on the downside as long as 1.3299 support turned resistance holds. Next target is 61.8% retracement of 1.2005 to 1.3976 at 1.2758. However, sustained trading above 1.3229 will raise the chance that the correction has completed and turn focus back to 1.3653 resistance.
China’s Proxy Stock Market Rallied, Hawkish Pause for RBA
- US-China geopolitical tension remains on heat after the latest China exports curb on key metals for semiconductor chip production.
- China’s proxy stock market; Hang Seng benchmark stock indices rallied to a 5-day high.
- RBA left its policy cash rate unchanged at 4.10%, a pause after two consecutive interest rate hikes but hinted in its monetary policy statement is tilted towards a hawkish pause.
Actions speak louder than words in geopolitics
In the past two weeks, we have witnessed key officials from the US and China engaging in diplomatic meetups to thaw the current frosty relationship; US Secretary of State Blinken has managed to score a brief impromptu meeting with Chinese President Xi during his recent trip to China. US Treasury Secretary Yellen will head to China this week for meetings with top Chinese officials. All these meetings are aligned by an expectation that there will be likely an official Biden-Xi meeting later this year.
The two largest economies are still locked in an economic and trade cold war since 2018, and right now, the scope has expanded towards production and obtaining the technological know-how of higher-end semiconductor chips that powered the Internet of Things, and artificial intelligence networks.
In a tic for tact retaliation on the recent stepped-up rhetoric by the US and its allies that advocated blocking sales of several high-end semiconductor chips to China, China has just announced an export curb on two key metals, gallium, and germanium that are required in the production of some semiconductor chips. Looks like, the frosty relationship between US and China may persist despite the recent warmer diplomatic receptions between respective officials.
China’s proxy stock market recovered and surpassed the key 200-day moving average
Despite recent dismal China manufacturing and services PMIs data for June, as well as this latest episode of the US-China geopolitical flareup, Hong Kong’s benchmark stock indices have managed to stage a remarkable rebound from their respective last Monday, 27 June lows; Hang Seng Index (+3.44%), Hang Seng TECH Index (+6.27%), Hang Seng China Enterprises Index (+4.11%) at this time of the writing. All these indices managed to have daily closes yesterday, 5 July above their respective 200-day moving averages which suggests that the recent minor downtrend from 16 June 2023 to 26 June 2023 inflicted on these indices may have ended.
Intermarket factor may be the driving force for this recent bout of optimism seen in these key Hang Seng Indices. The offshore yuan (CNH) seems to have started to snap its recent pronounced weakness against the US dollar reinforced by verbal interventions from China’s central bank, PBoC to step up efforts to stabilize the yuan.
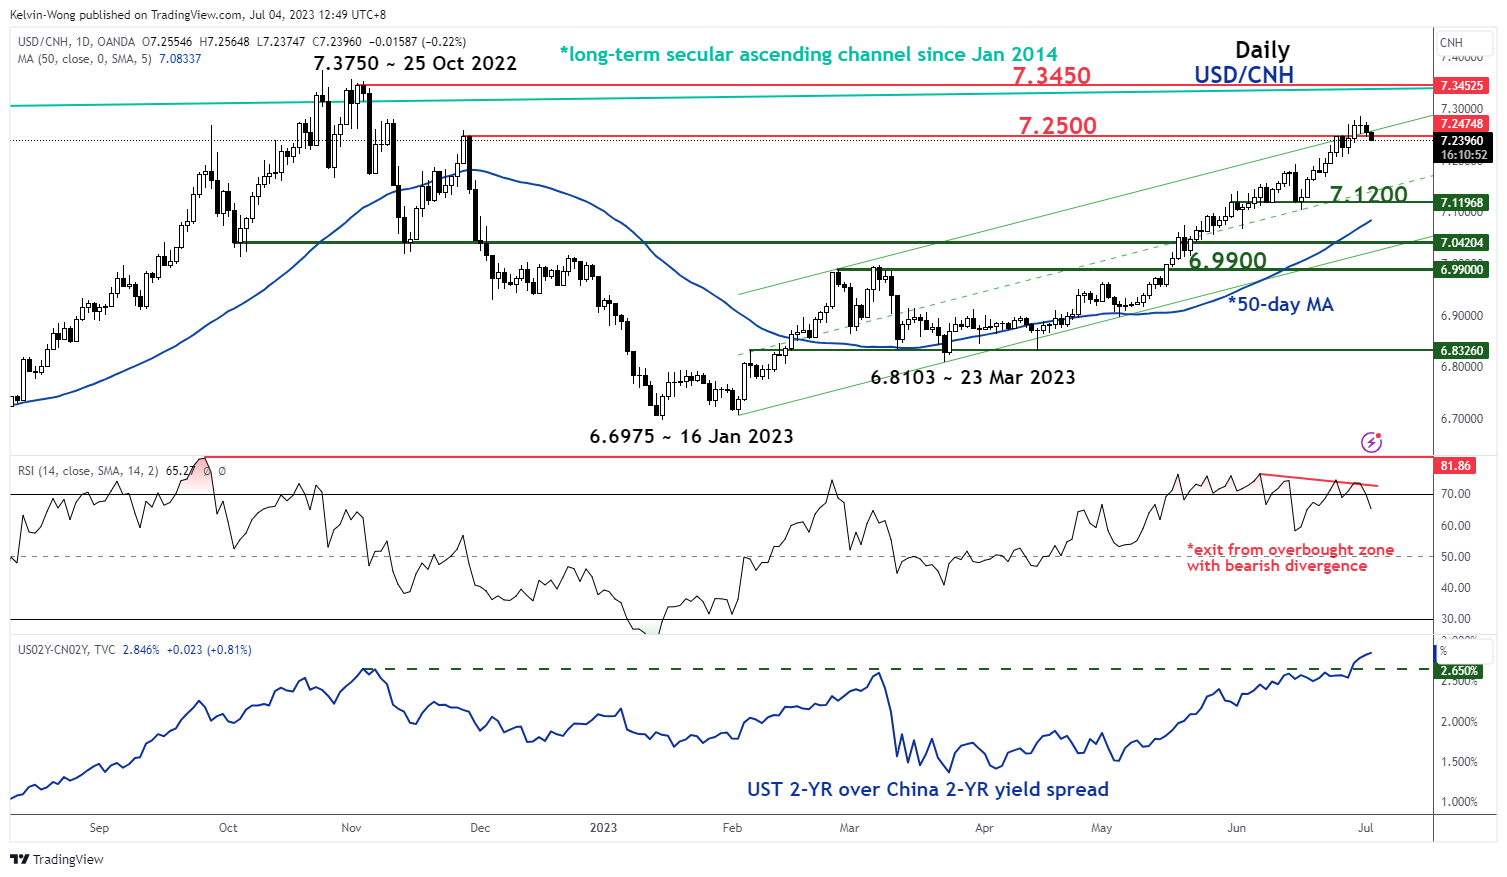
Fig 1: USD/CNH medium-term trend as of 4 Jul 2023 (Source: TradingView, click to enlarge chart)
The USD/CNH has started to reintegrate back below a key 7.2500 intermediate resistance intraday at this time of the writing with the daily RSI exiting from its overbought region after a bearish divergence. These observations suggest that the medium-term bullish momentum of USD/CNH has started to wane (i.e. yuan weakness abated) which in turn triggers a positive feedback loop into China’s proxy stock market (Hang Seng indices).
RBA stands pat on further interest rate hike, AUD/USD shed 45 pips
Australia’s central bank, RBA has decided to leave its policy cash rate unchanged at 4.10% after prior two consecutive hikes of 25 basis points each. This latest monetary policy decision has more or less been priced in by the interest rates futures market where odds of a 25 bps rate hike implied by the ASX 30-day interbank cash rate futures has been reduced to 16% as of 3 July 2023 from a chance of 53% seen two weeks ago.
The accompanied monetary policy statement still has some “hawkish flavored” sprinkled on; it highlights that inflation is still too high and will remain so far for some time despite the recent monthly CPI for May showing a further decline. Ended with “the Board remains resolute in its determination to return inflation to target and will do what is necessary to achieve that”. Hence, today’s decision seems like a hawkish pause rather than the start of an interest rate cut cycle.
So far, the reaction on the AUD/USD has been negative where it has given up its gains from yesterday’s session but its minor uptrend from 29 June 2023 low has not been damaged. It dropped by -45 pips from its current intraday high of 0.6687 before the RBA’s monetary policy announcement and printed its current intraday low of 0.6641 at this time of the writing. The key short-term support to watch will be at 0.6630 where its price actions have managed to stage a bullish breakout from a minor congestion resistance zone earlier last Friday, 28 June 2023 with key intermediate resistance at 0.6720 (the 20-day moving average & the minor swing high area of 27 June 2023).
US 100 Cash Index Prepares for a New 2023 High
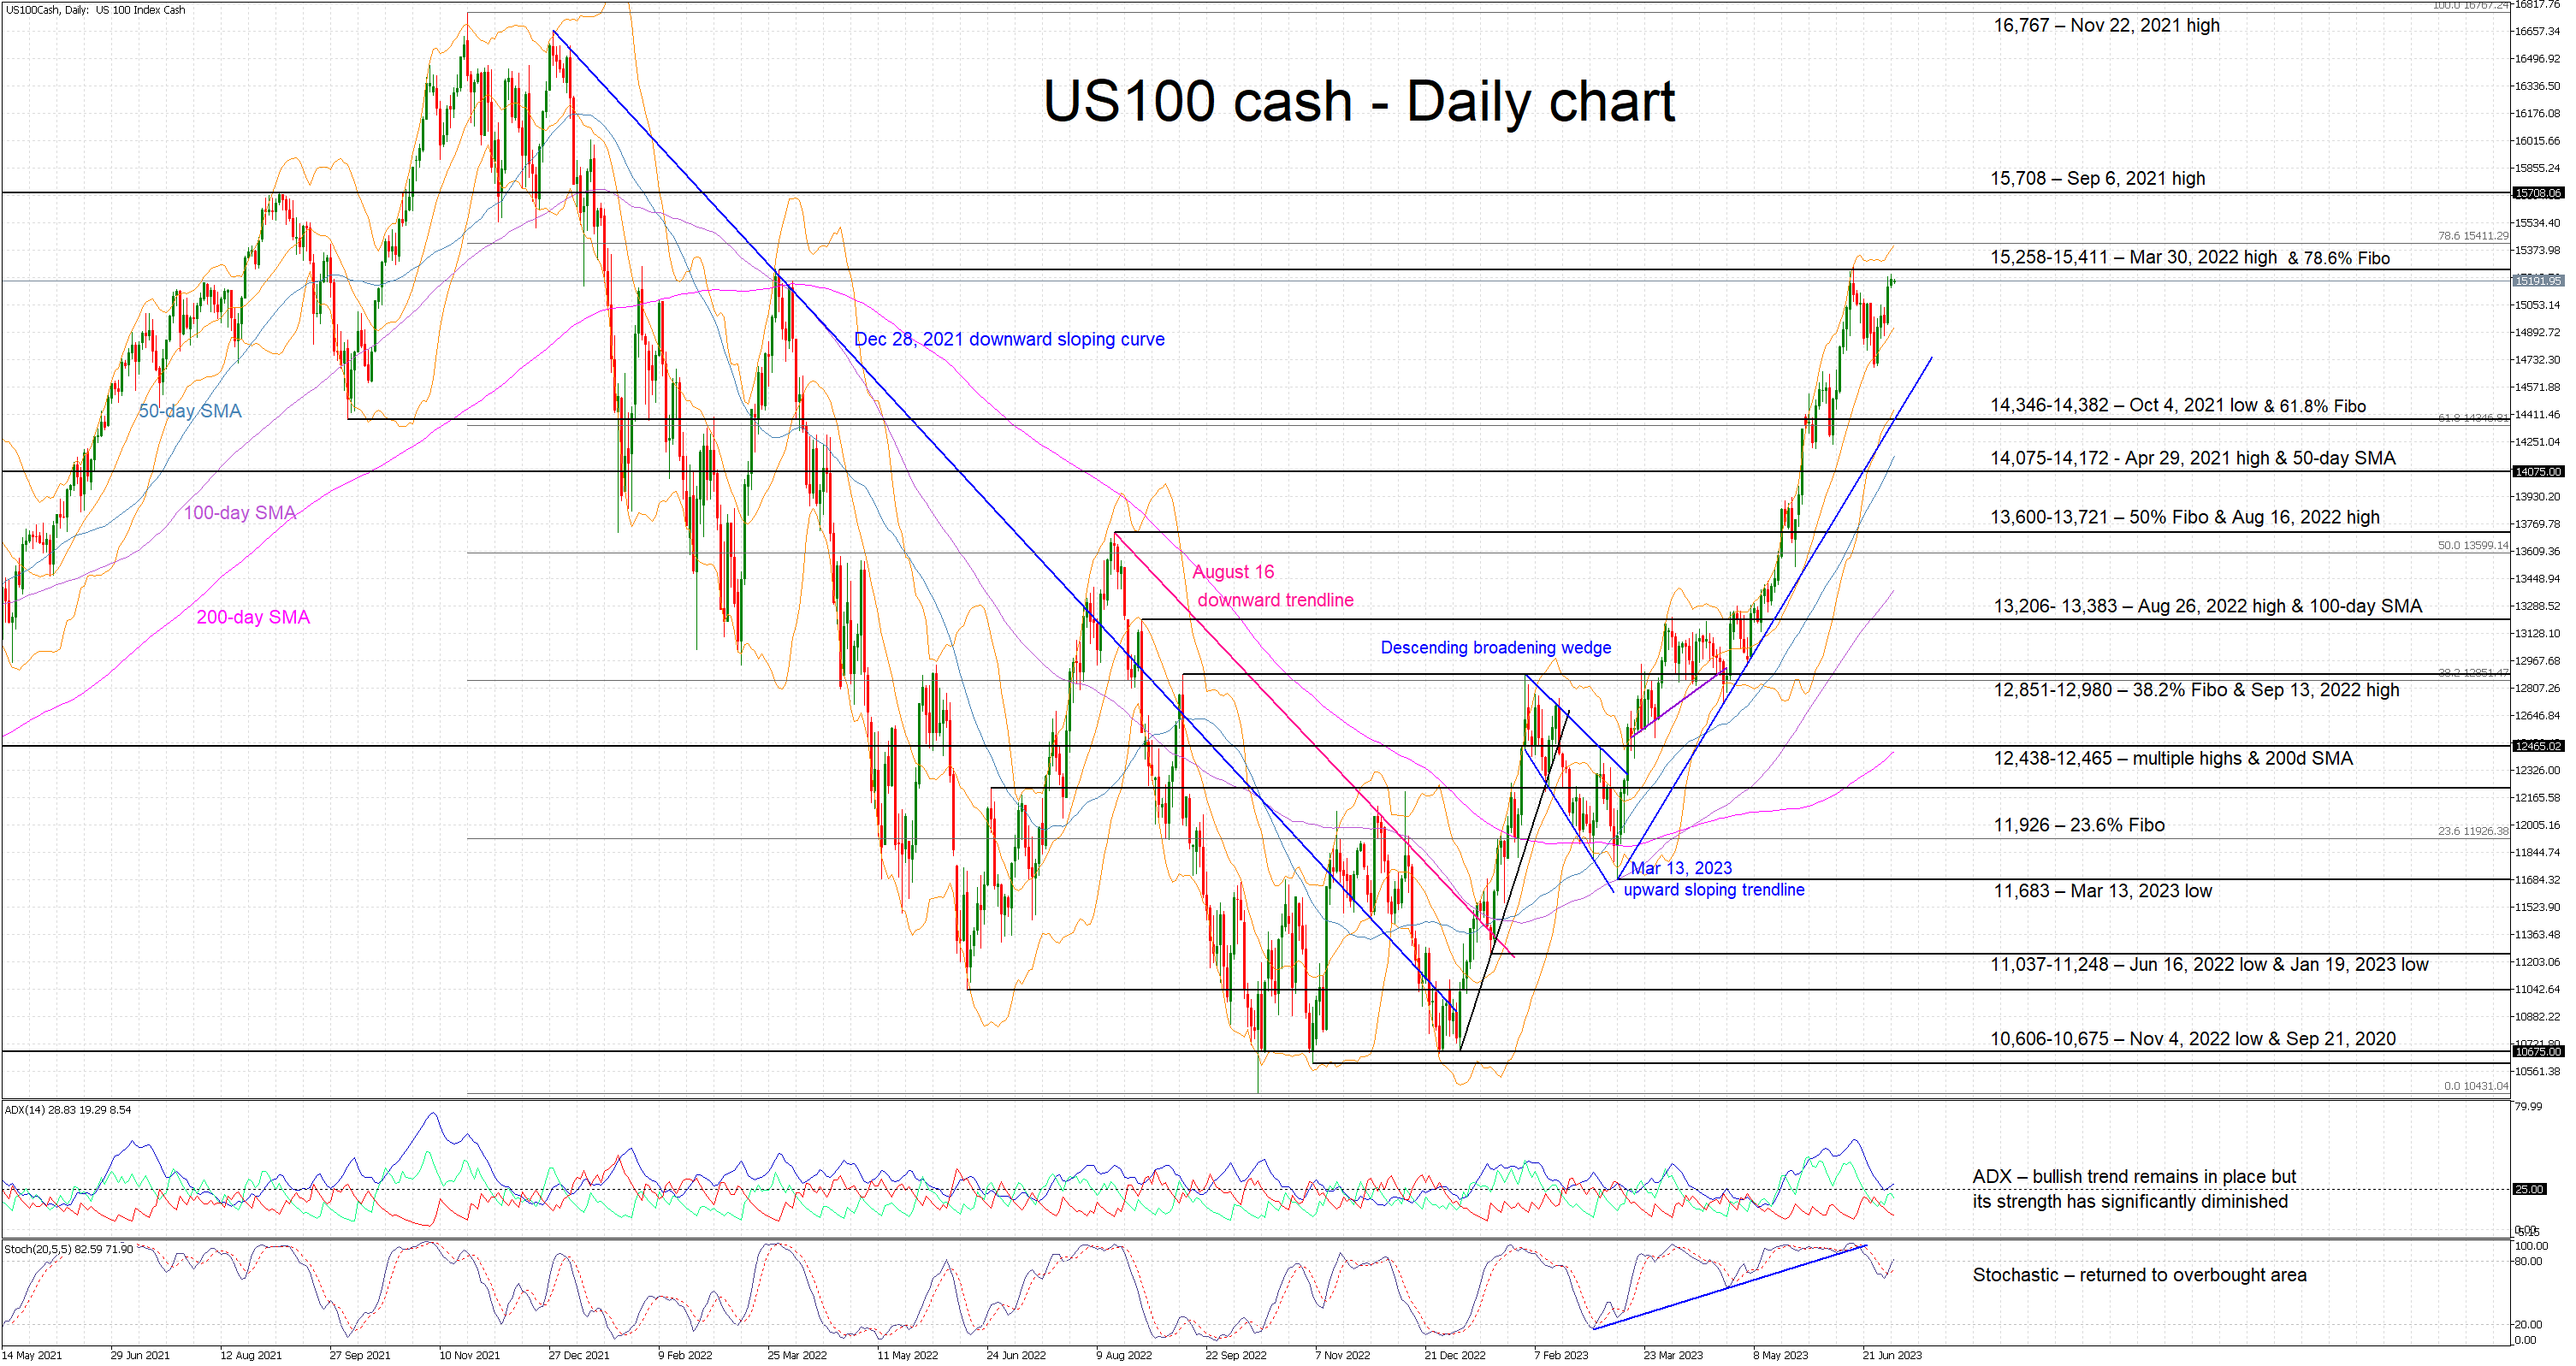
The US 100 index is moving sideways today, trading a tad below 15,258 that has morphed into a significant resistance level. The bulls failed to clear this level on their first attempt on June 16, 2023, and are now preparing the stage for another retest. The bears continue to exhibit an inability to record a decent pullback despite the fact that the aggressive upleg, since the March 13, 2023 low, lacks a significant correction.
The momentum indicators appear mixed at this stage. The Average Directional Movement Index (ADX) has quickly dropped lower, just above its 25-threshold and signalling a mild bullish trend. In the meantime, the stochastic oscillator has returned inside its overbought territory, allowing the bulls to consider recording a new 2023 high.
If the bulls remain committed to making higher highs, they could try to finally push the US 100 index above the 15,258-15,411 range set by the March 30, 2022 high and the 78.6% Fibonacci retracement level of the November 22, 2021 – October 13, 2022 downtrend. Even higher, the September 6, 2021 high of 15,708 might not trouble the bulls much, but it will open the door for the all-time high of 16,767.
On the other hand, the bears are desperately trying to engineer some type of consolidation. Should they manage to successfully defend the 15,258-15,411 range, they could try to push the index toward the 14,346-14,382 area. Such a correction would be the first significant short-term win for the bears since March 2023, and could help them build momentum into tackling the busier 14,075-14,172 range.
To sum up, the US 100 index bulls have taken a breather and are now preparing for another upleg. A potential second failure in clearing the key 15,258-15,411 area would gradually turn momentum in favour of the bears.
US National Holiday Kept Volumes Low
Markets
UK gilts sold off yesterday and dragged its core peers along. A YouGov and Citi poll showing UK public inflation expectations for the year ahead rose to 5% in June (from 4.7%) helped explain the underperformance. The front end of the curve rose more than 11 bps in the UK, 8 bps in Germany and 6 bps in the US before momentum ebbed away as we moved into the publication of the June US ISM manufacturing gauge. The index unexpectedly slipped further to 46 from 46.9 (47.1 expected). Production fell (46.7), as did new orders (though not as quick as in the month before, 45.6) and employment (48.1). Prices paid tumbled to 41.8. Core bonds extended gains in a kneejerk move higher but almost as equally fast gave them up again. Changes eventually ranged between +2.2 to 6.9 bps in the UK, 0.6-6.7 bps in Germany and 0.3-4.7 bps in the US with all of the curves deepening the inversion. Large intraday swings in yields had little to no effect on currency markets. EUR/USD flipflopped around the 1.09 big figure just to close almost unchanged north of that big figure. DXY did about the same around 103 and EUR/GBP around 0.86. The Japanese yen lost some ground again with USD/JPY still near the September 2022 FX intervention levels (145). Stocks struggled for direction. European equities finished flat and Wall Street ended a holiday-shortened trading day marginally higher. Oil only temporarily rebounded on a Saudi announcement that it will extend its voluntary 1 mln b/d production cut into August.
The RBA policy decision was the focal point in Asian trading this morning (see below), delivering a minor hit to the Aussie dollar. CNY strengthens marginally after the PBOC continued its streak of stronger-than-expected fixings. Japan’s yen stabilizes. Core bonds trade sideways. US cash markets are closed for Independence Day though. This looming US national holiday kept volumes low already yesterday as many enjoy an extended, four-day weekend. Absence of US investors and a near-empty economic calendar will result in uninspired, technical trading. We remain focused on the latter part of this week, especially after yesterday’s interesting market reaction on a slightly disappointing US manufacturing ISM. Its meaning may be that markets look through weak(er) activity data and keep a closer eye on inflation and the Fed’s response. But it just as well might suggest that cracks are starting to show in the recent yield rally, with a potential correction lower in the making with a proper trigger. The dominating narrative for this week, and perhaps several next, will depend on the data still scheduled for release (US ISM services on Thursday, payrolls Friday etc.).
News and views
The Reserve Bank of Australia kept its policy rate as expected unchanged at 4.1% this morning. It’s the RBA’s second pause this year after keeping rates stable in April (at 3.6%) only to implement back-to-back rate hikes in May and June afterwards. Some further tightening of monetary policy may be required to ensure that inflation returns to target in a reasonable timeframe, but that will depend upon how the economy and inflation evolve. The decision to hold interest rates steady this month buys time to assess data and associated risks. Growth in the Australian economy has slowed and conditions in the labour market have eased, although they remain very tight (wage inflation up). Australian inflation has passed its peak, but inflation is still too high and will remain so for some time yet. The Board remains alert to the risk that expectations of ongoing high inflation will contribute to larger increases in both prices and wages, especially given the limited spare capacity in the economy and the still very low rate of unemployment. The Aussie dollar lost some ground (AUD/USD 0.6645 from 0.6685) with AUD swap yields up to 4 bps lower at the front end. Money market still discount a final rate hike before year-end.
Megan Greene, who joins the Bank of England’s Monetary Policy Committee in August, argued in an FT column, argues against estimates by NY Fed Williams and some of his colleagues that the long-run neutral rate (r-star) has barely budged after the combined hit of the pandemic, Russian war, energy crisis and end to the low inflation era. The IMF for now is also on that line. Greene says that even if R-star hasn’t already risen (given it’s a concept, not something that can be observed), that doesn’t mean it won’t. Her comments suggest she’ll be a hawkish vote within the MPC.
Saudi, Russia Cut Oil Production, China Bans Metal Exports
Saudi Arabia and Russia couldn’t wait the next OPEC meeting to announce further production cuts. Saudi announced that it will extend the 1mbpd cut into August – and maybe further – while Russia said it will reduce its production by half a million. Further cuts came within the knowledge that the oil market will tighten in the H2 as world oil inventories are on track to drain at a quick pace of around 2mbpd. Pricewise? Not much. US crude shortly tested the 50-DMA to the upside, but gains remained limited, there is a crowd of sellers above the $70pb level, any OPEC-led price rallies are seen as opportunities to sell the top.
Elsewhere, China imposed restrictions on exports of two chipmaking metals, gallium and germanium, that are used in EVs, defense and displays. The Chinese exporters must apply for licenses at the commerce ministry and report details regarding to whom they are selling their metals. The direct implication of the export ban is higher gallium and germanium prices. These metals are not particularly rare, but China accounts for a good part of the world’s production. China stands for 94% (!) of the world’s gallium production, for example, as they can make them cheaper than the others. Therefore, restricting supply will undoubtedly put a positive pressure on global prices - and maybe on global inflation. Stock prices of companies that make compound semiconductors like Wolfspeed and NXP Semiconductors saw their prices boosted by the news yesterday.
Other than that, it was yet another day of gains – though moderate gains - in the US stock markets. Although the US ISM manufacturing index contracted for the 8th month in June to the weakest levels in more than three years, unemployment showed and ISM prices shrank faster, two things that the Federal Reserve (Fed) is certainly glad to see!
The RBA stays pat
The Reserve Bank of Australia (RBA) kept rates unchanged at today’s monetary policy meeting, as encouraging inflation numbers of late made policymakers think twice before putting more pressure on the already suffering housing market. The AUDUSD sold off from an important technical range of 0.6670/0.68 which includes all 50, 100 and 200-DMAs. No action from the RBA could give a certain relief to the Fed hawks as well, which pushed the US 2-year yield to very close to 5% yesterday before American markets closed for July 4th holiday. The probability of a 25bp hike in July is now at 90%. We shall see some buying at the short end of the curve, simply because the Fed expectations could hardly get more hawkish than this.
In the FX
The US dollar remains sold despite the robustly hawkish Fed expectations and rising yields. This could be because traders look past the Fed’s hawkish words and sell the dollar as they remain focused on the risk of hawkish policies elsewhere that make the US dollar look less attractive against other currencies – like the euro for example. But the EURUSD remains in a wait and see mode at about the 1.09 level, while Cable remains downbeat on multiple political problems that hint at more trouble in the UK’s grey skies.
In precious metals, gold traders feel the pain of gradually mounting US yields, but buyers are still willing to enter the market below the $1900 in hope that we are nearing a top in the US yields’ upside trajectory.
Today, the US will be off due to Independence Day holiday, but the rest of the world will continue digesting the latest news and get positioned for the FOMC minutes due Wednesday and a series of US jobs data between Thursday and Friday. While the potential for further hawkish pricing for the Fed seems limited, there is a good chance of a dovish readjustment in the case of soft jobs data.
Technical Outlook and Review
DXY:
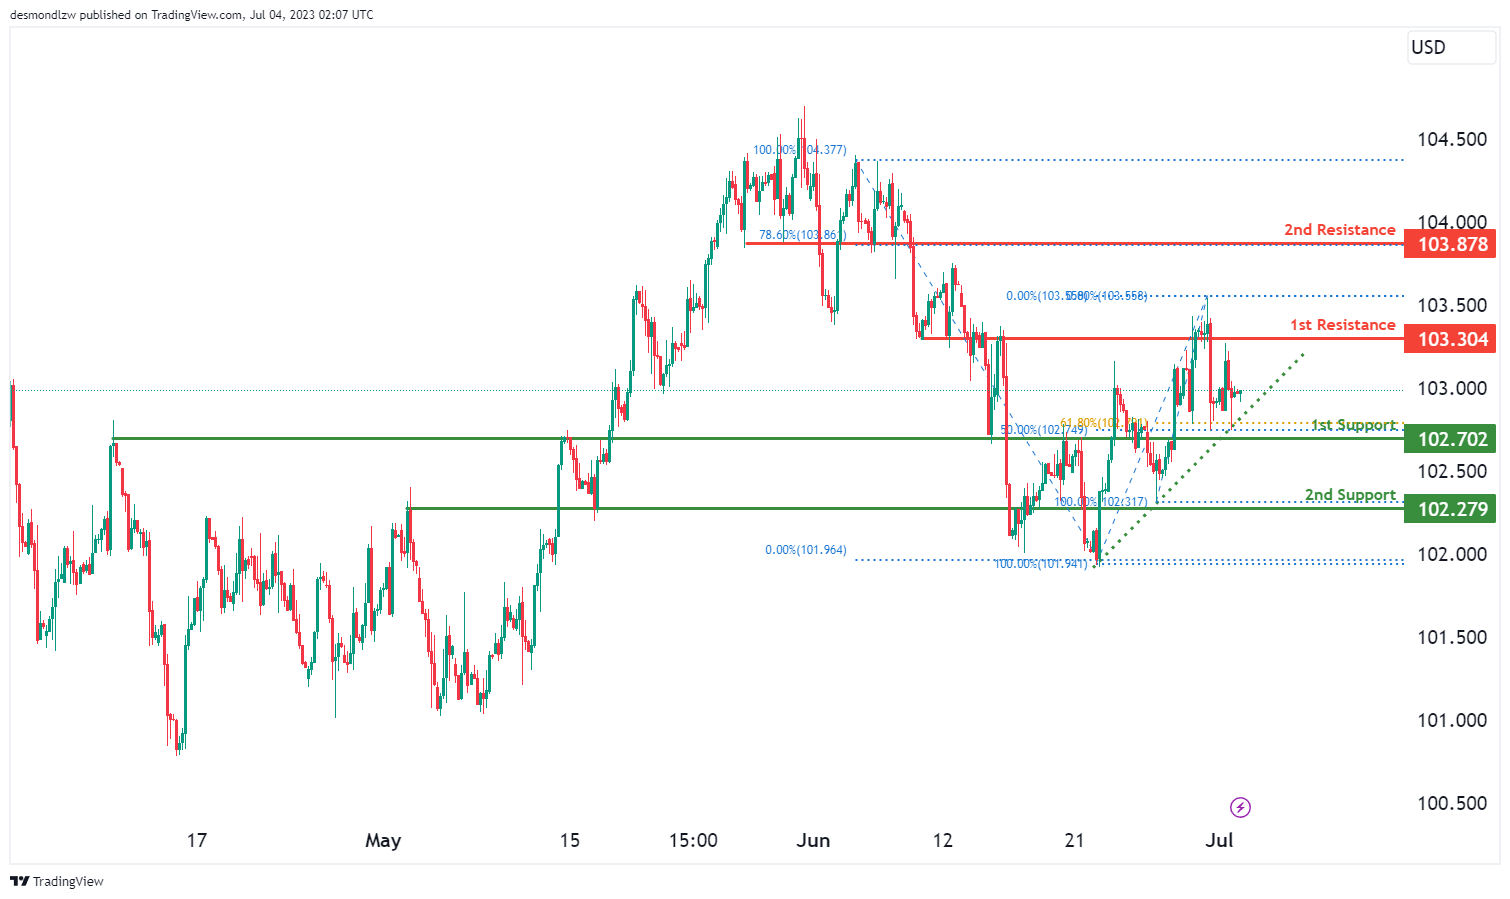
The DXY (U.S. Dollar Index) chart demonstrates a bullish momentum, with price above a major ascending trend line acting as strong support. There is a potential for a bullish continuation towards the 1st resistance level at 103.30, which is an overlap resistance. The 2nd resistance at 103.87, identified as a pullback resistance and aligned with the 78.60% Fibonacci Retracement, further reinforces the bullish outlook. On the downside, the 1st support at 102.70, an overlap support with Fibonacci confluence, and the 2nd support at 102.27 provide additional levels of support.
EUR/USD:
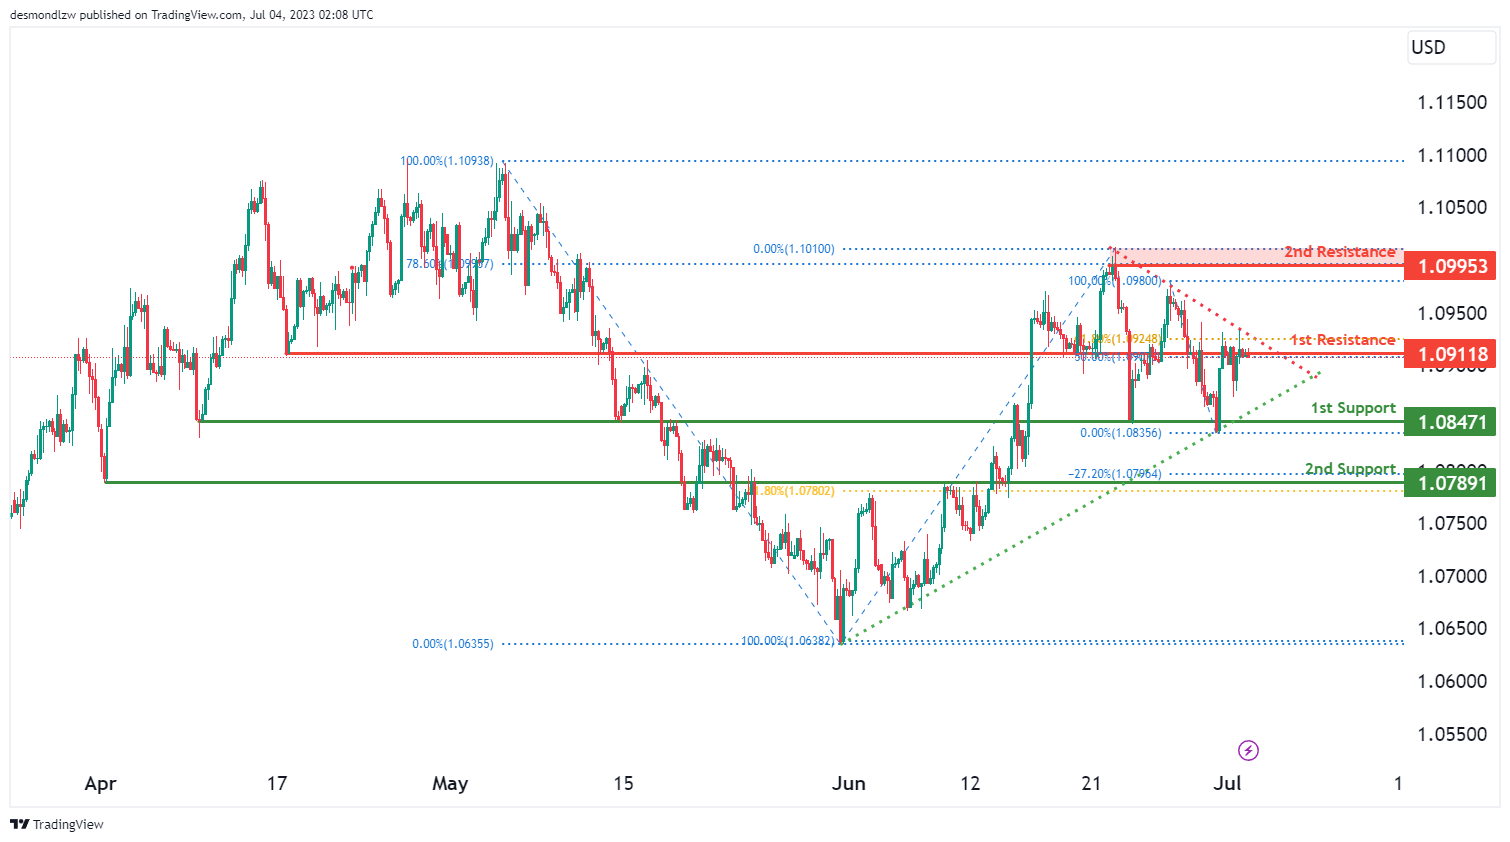
The EUR/USD chart currently demonstrates a bearish momentum, indicating a downward trend in the market. There is a potential for a bearish continuation towards the 1st support level at 1.0847, which is identified as an overlap support. Additionally, the 2nd support level at 1.0789 acts as an overlap support, coinciding with the 61.80% Fibonacci Retracement and the -27% Fibonacci Expansion, indicating Fibonacci confluence.
On the upside, the 1st resistance level at 1.0911 is an overlap resistance, with Fibonacci confluence from the 50% and 61.80% Fibonacci Retracement levels. Furthermore, the 2nd resistance level at 1.0995 represents a swing high resistance, reinforced by the presence of the 78.60% Fibonacci Retracement.
It is worth noting that a symmetrical triangle chart pattern is also present, indicating a period of consolidation. A breakout above the upper trendline of the pattern may suggest a bullish breakout, while a breakdown below the lower trendline could indicate a bearish breakdown.
GBP/USD:
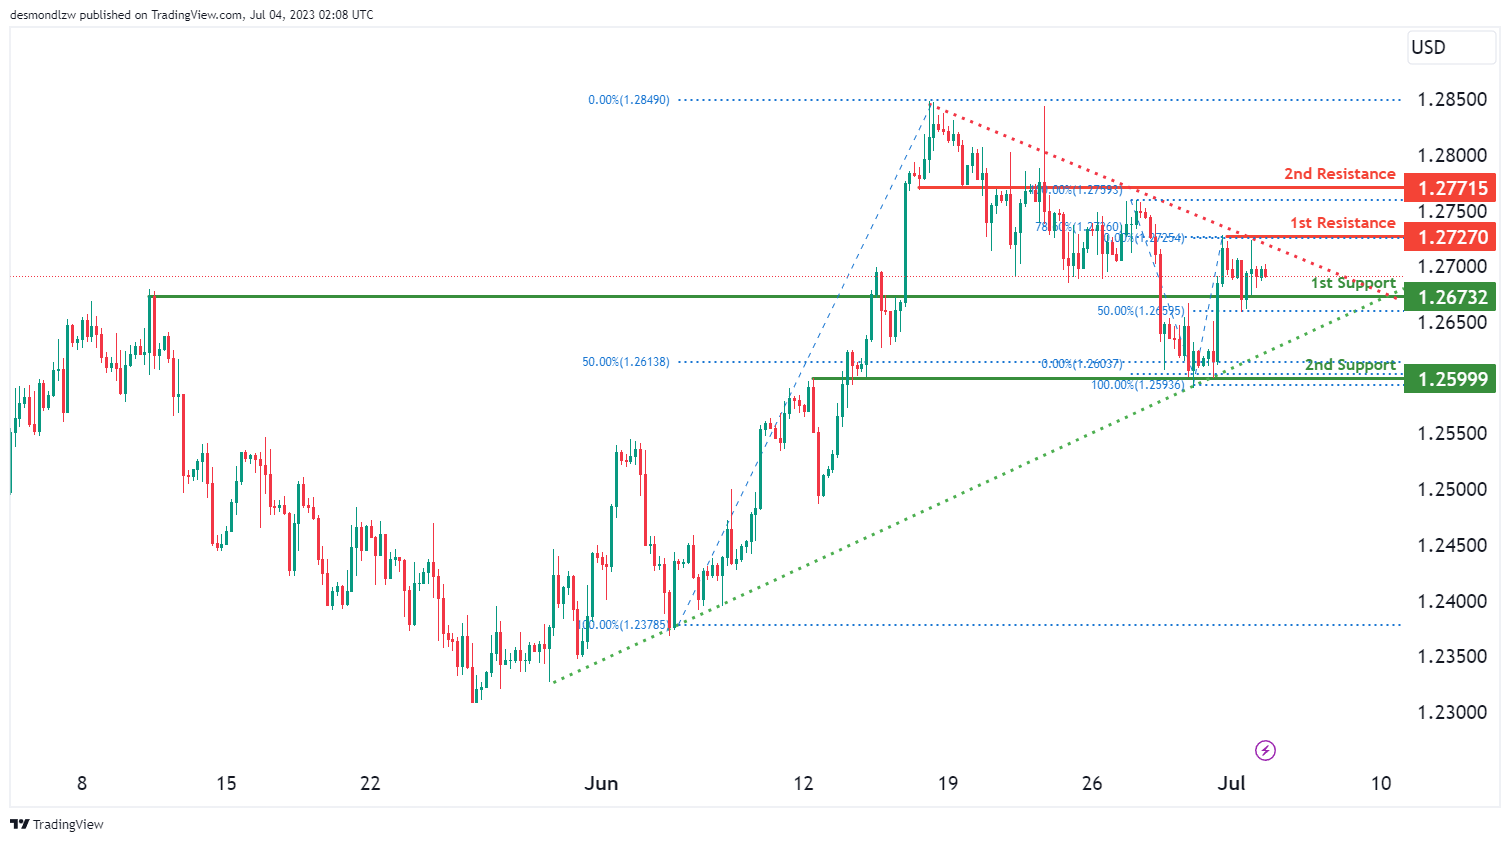
The GBP/USD chart currently demonstrates a neutral momentum, indicating a lack of clear direction in the market. There is a possibility for the price to fluctuate between the 1st resistance level at 1.2727 and the 1st support level at 1.2673.
The 1st support level at 1.2673 is identified as an overlap support, reinforced by the presence of the 50% Fibonacci Retracement. Additionally, the 2nd support level at 1.2599 also acts as an overlap support, coinciding with the 50% Fibonacci Retracement.
On the upside, the 1st resistance level at 1.2727 represents a multi-swing high resistance, with Fibonacci confluence from the 78.60% Fibonacci Retracement. Furthermore, the 2nd resistance level at 1.2771 is identified as an overlap resistance.
It is worth noting that a symmetrical triangle chart pattern is present, indicating a period of consolidation. A breakout above the upper trendline of the pattern may suggest a bullish breakout, while a breakdown below the lower trendline could indicate a bearish breakdown.
USD/CHF:
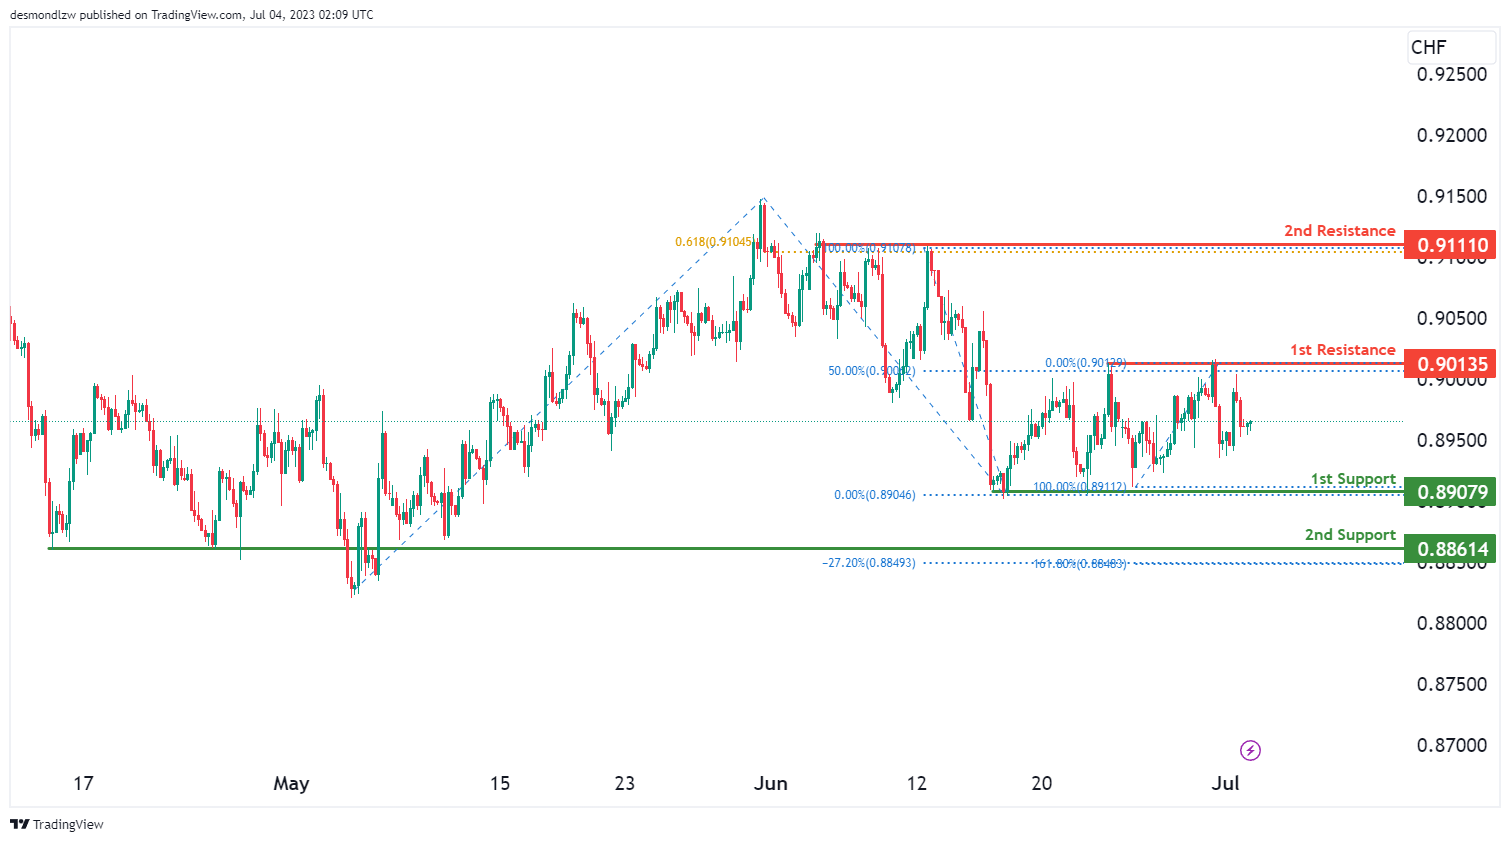
The USD/CHF chart currently demonstrates a neutral momentum, suggesting a lack of clear direction in the market. There is a possibility for the price to fluctuate between the 1st resistance level at 0.9013 and the 1st support level at 0.8907.
The 1st support level at 0.8907 is identified as a multi-swing low support, providing potential strength to the support zone. Additionally, the 2nd support level at 0.8861 acts as an overlap support.
On the upside, the 1st resistance level at 0.9013 represents a multi-swing high resistance, with the presence of the 50% Fibonacci Retracement. Furthermore, the 2nd resistance level at 0.9119 is identified as another multi-swing high resistance, supported by the 61.80% Fibonacci Projection.
USD/JPY:
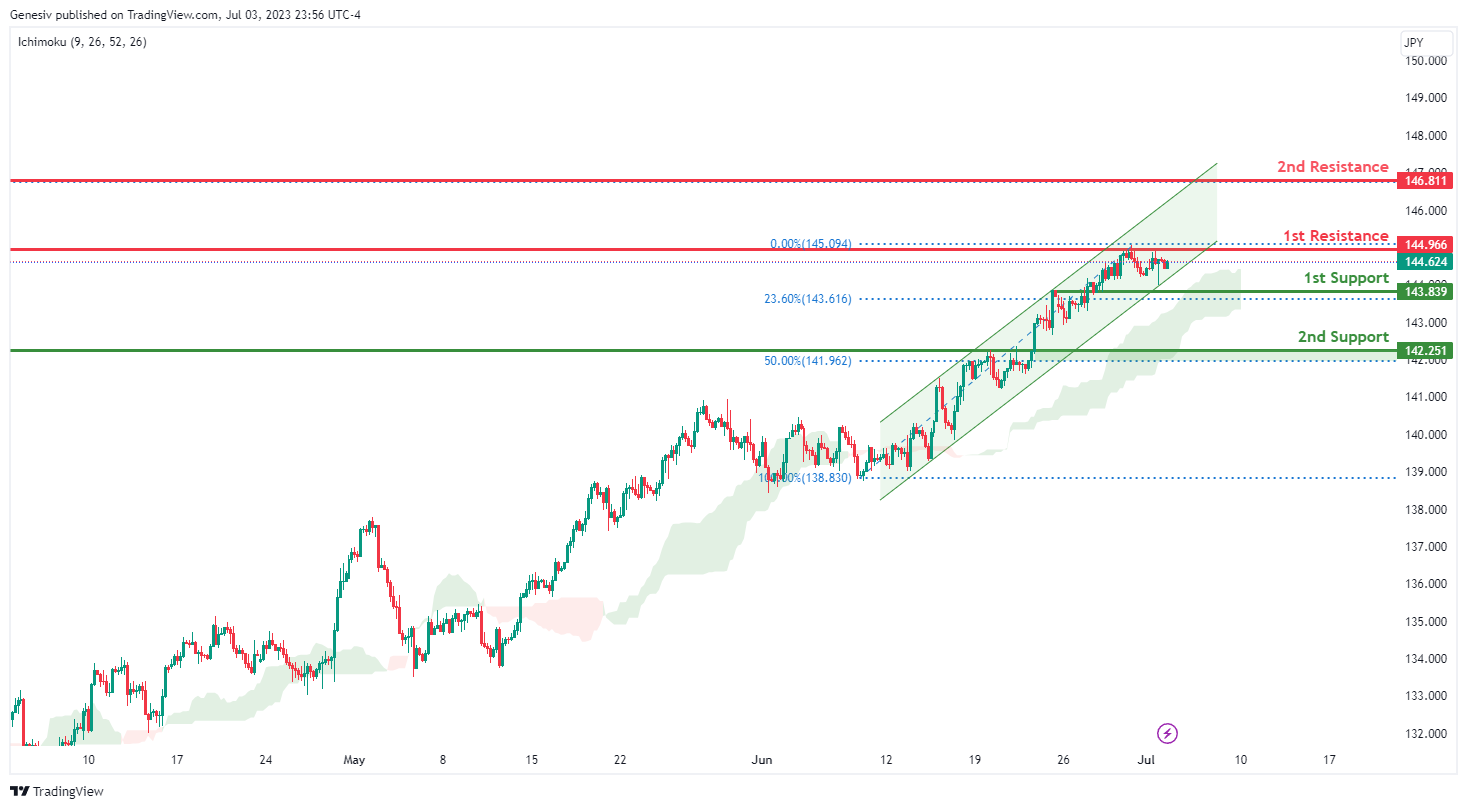
The USD/JPY instrument currently shows a bullish momentum. This suggests the price could potentially continue its bullish trajectory towards the 1st resistance.
The 1st support level is at 143.83, providing a solid base due to its overlap support nature and a 23.60% Fibonacci Retracement. The 2nd support stands at 142.25, offering a robust foundation due to its overlap support characteristic and a 50% Fibonacci Retracement.
In terms of resistance levels, the 1st resistance is at 144.96, posing a significant challenge due to its swing high resistance nature. The 2nd resistance is at 146.81, presenting a substantial obstacle due to its swing high resistance characteristic. These conditions collectively contribute to the bullish momentum of USD/JPY.
USD/CAD:
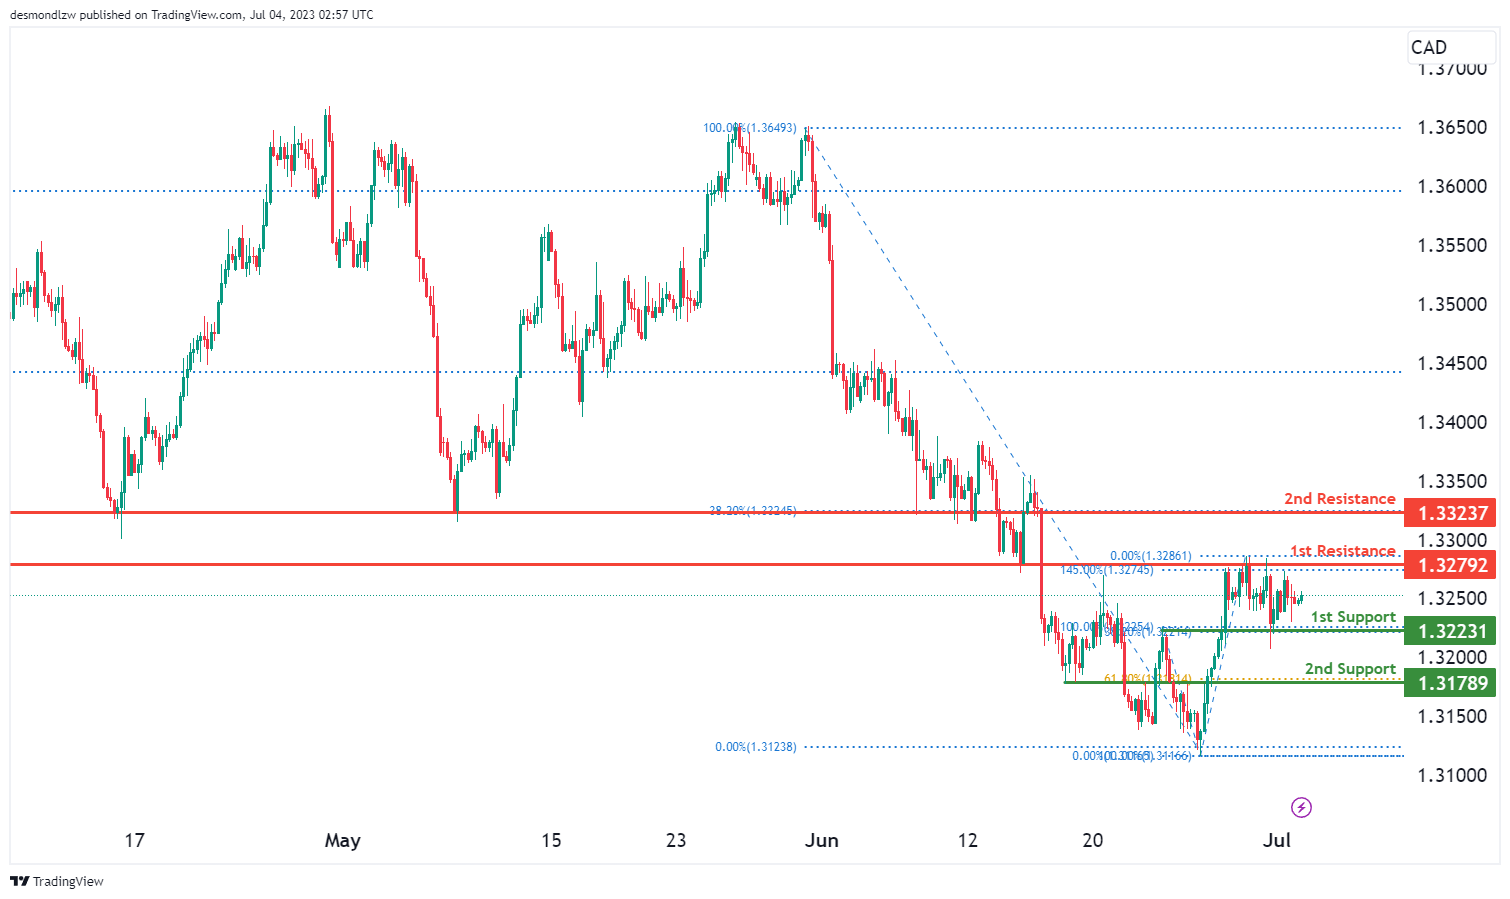
The USD/CAD chart currently demonstrates a neutral momentum, indicating a lack of clear direction in the market. There is a potential for the price to fluctuate between the 1st resistance level at 1.3279 and the 1st support level at 1.3223.
The 1st support level at 1.3223 is identified as an overlap support, potentially providing strength to the support zone. Additionally, the 2nd support level at 1.3178 serves as a pullback support, further reinforcing its significance with the presence of the 61.80% Fibonacci Retracement.
On the upside, the 1st resistance level at 1.3279 represents an overlap resistance. Furthermore, the 2nd resistance level at 1.3323 acts as a pullback resistance, supported by the presence of the 38.20% Fibonacci Retracement.
AUD/USD:
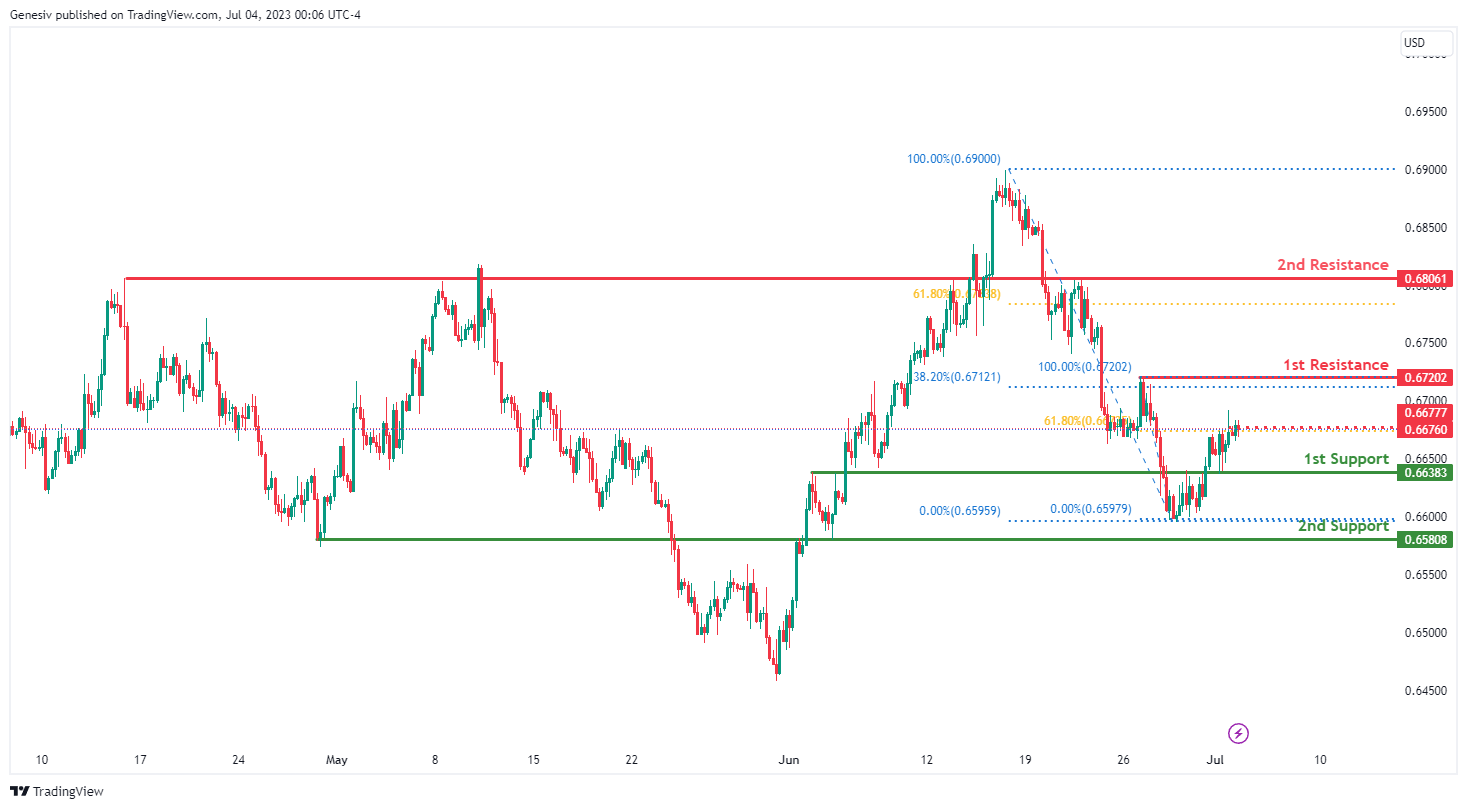
The AUD/USD instrument currently shows a weak bullish momentum with low confidence. It’s suggested that the price could potentially continue its bullish trend towards the 1st resistance.
The 1st support level is at 0.6638, providing a solid foundation due to its overlap support nature. The 2nd support stands at 0.6580, offering a robust base thanks to its overlap support characteristic and a 78.60% Fibonacci Retracement.
In terms of resistance levels, the 1st resistance is at 0.6720, posing a significant challenge due to its swing high resistance nature and a 38.20% Fibonacci Retracement. The 2nd resistance is at 0.6806, presenting a substantial obstacle due to its swing high resistance characteristic and a 61.80% Fibonacci Retracement.
The intermediate resistance is at 0.6676, providing a considerable hurdle as an overlap resistance and a 61.80% Fibonacci Retracement. These conditions collectively contribute to the weak bullish momentum of AUD/USD with low confidence.
NZD/USD
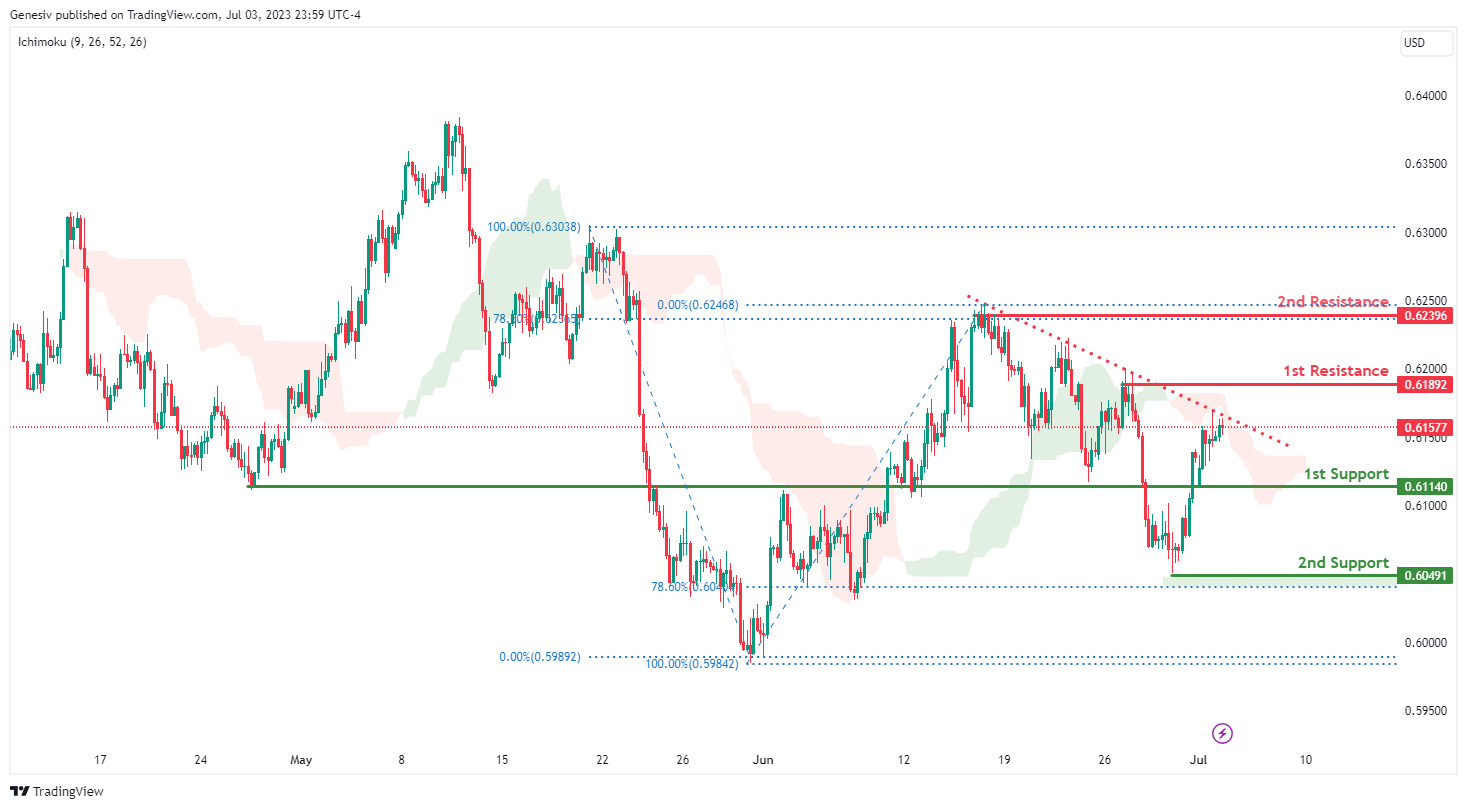
The NZD/USD instrument currently exhibits a bearish momentum. The price is below a major descending trend line, suggesting that bearish momentum is on the cards. This suggests the price could potentially continue its bearish trajectory towards the 1st support.
The 1st support level stands at 0.6114, providing a solid base due to its overlap support nature. The 2nd support is at 0.6049, offering a robust foundation due to its swing low support characteristic and a 78.60% Fibonacci Retracement.
In terms of resistance levels, the 1st resistance is at 0.6189, posing a significant challenge due to its swing high resistance nature. The 2nd resistance is at 0.6239, presenting a substantial obstacle due to its swing high resistance characteristic and is reinforced by a 78.60% Fibonacci Retracement. These conditions collectively contribute to the bearish momentum of NZD/USD.
DJ30:
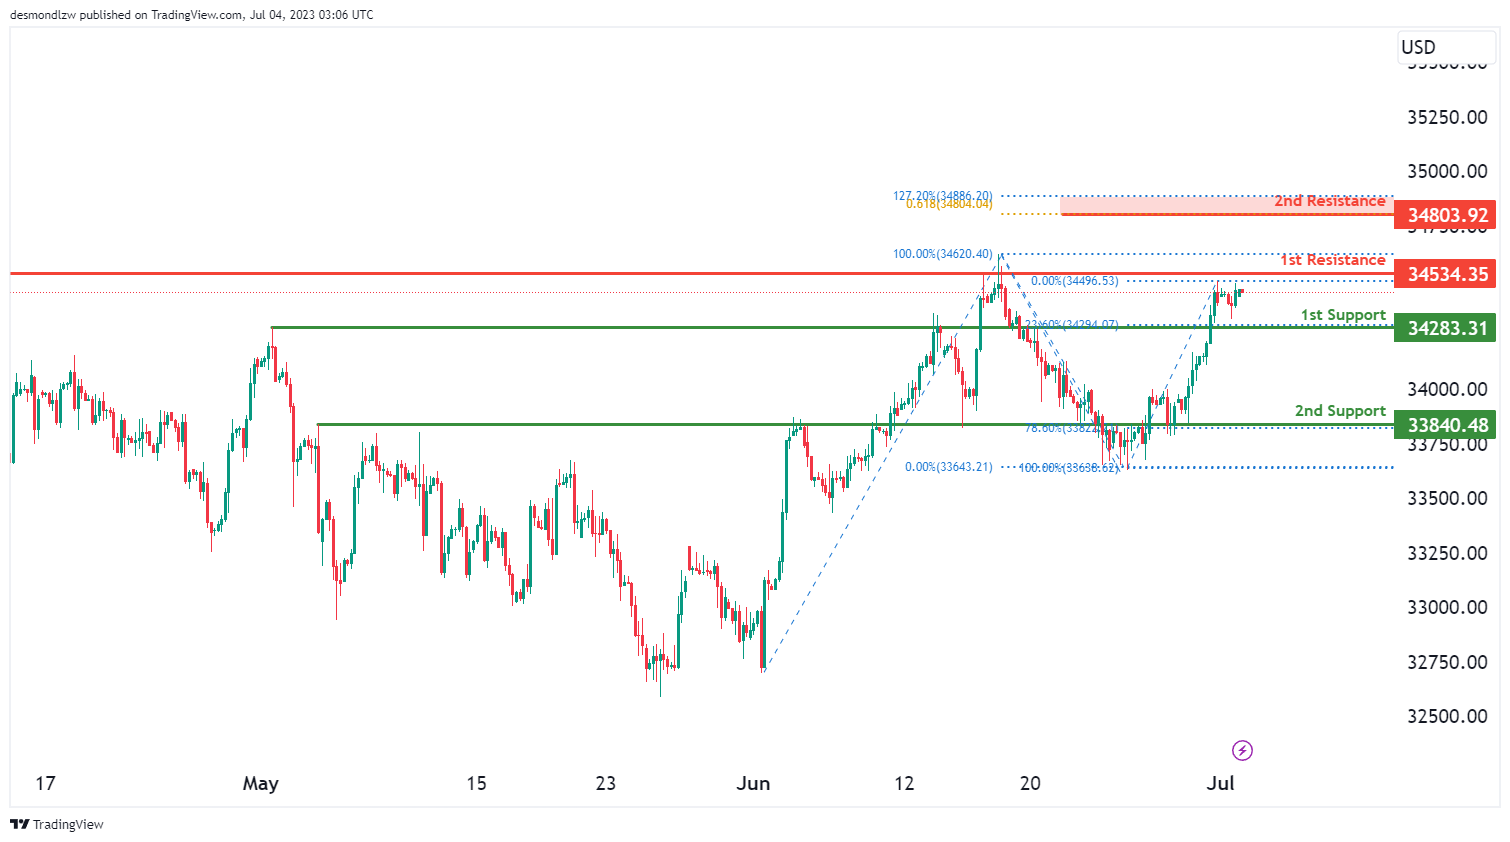
The DJ30 (Dow Jones Industrial Average) chart currently exhibits a neutral momentum, suggesting a lack of clear direction in the market. There is a possibility for the price to fluctuate between the 1st resistance level at 34534.35 and the 1st support level at 34283.31.
The 1st support level at 34283.31 is considered a pullback support, supported by the presence of the 23.60% Fibonacci Retracement. Additionally, the 2nd support level at 33840.48 acts as an overlap support, showing Fibonacci confluence with the presence of the 78.60% Fibonacci Retracement.
On the upside, the 1st resistance level at 34534.35 represents a multi-swing high resistance. Furthermore, the 2nd resistance level at 34803.92 indicates Fibonacci confluence, with the presence of the 127.20% Fibonacci Extension and the 61.80% Fibonacci Projection.
GER30:
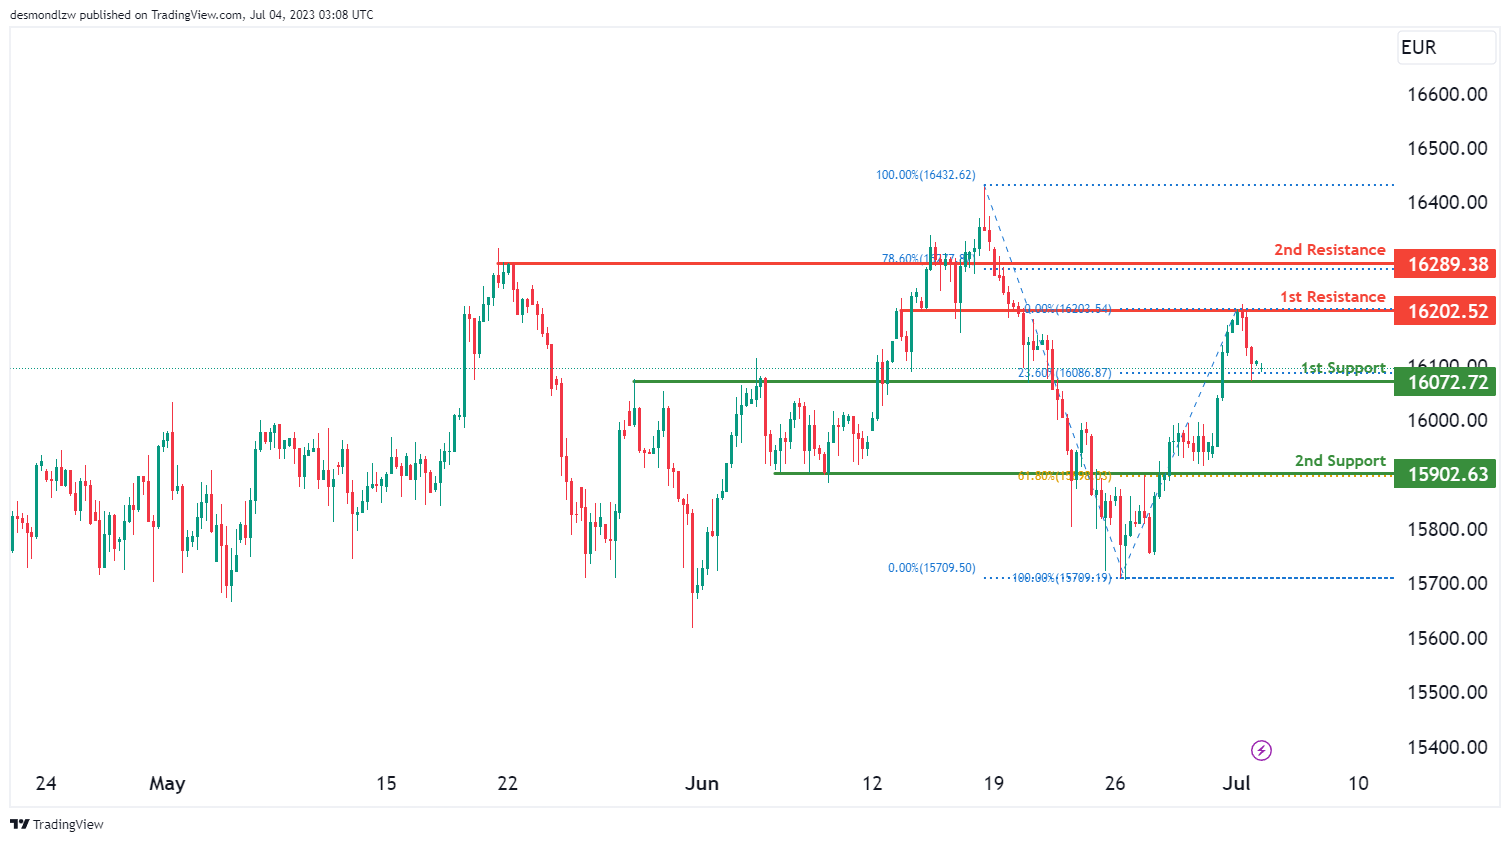
The GER30 (DAX) chart currently demonstrates a bullish momentum, indicating an upward trend in the market. There is a possibility for the price to experience a bullish bounce off the 1st support level at 16072.72 and move towards the 1st resistance level at 16202.52.
The 1st support level at 16072.72 is identified as an overlap support, further reinforced by the presence of the 23.60% Fibonacci Retracement. Additionally, the 2nd support level at 15902.63 acts as another overlap support, indicating Fibonacci confluence with the 61.80% Fibonacci Retracement.
On the upside, the 1st resistance level at 16202.52 is an overlap resistance, potentially hindering further upward price movement. Furthermore, the 2nd resistance level at 16289.38 is identified as a pullback resistance, coinciding with the 78.60% Fibonacci Retracement.
US500
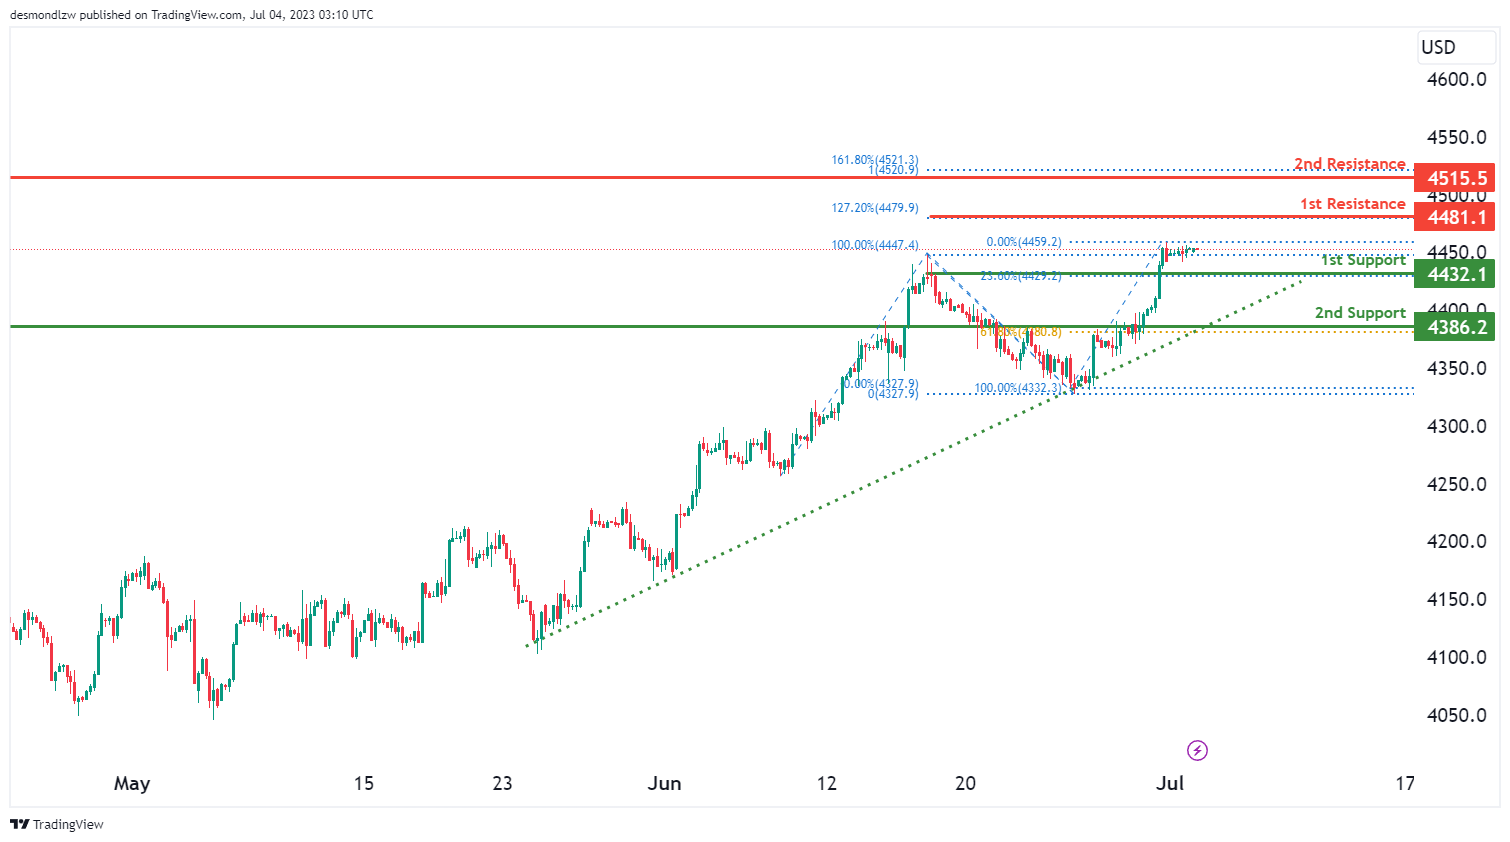
The GER30 (DAX) chart currently exhibits a neutral momentum, suggesting a balanced market. The price is positioned above a major ascending trend line, indicating the potential for further bullish momentum.
There is a possibility for the price to fluctuate between the 1st resistance level at 4481.1 and the 1st support level at 4432.1.
The 1st support level at 4432.1 is identified as an overlap support, further reinforced by the presence of the 23.60% Fibonacci Retracement. Additionally, the 2nd support level at 4386.2 acts as a pullback support, coinciding with the 61.80% Fibonacci Retracement.
On the upside, the 1st resistance level at 4481.1 represents a potential resistance point. Furthermore, the 2nd resistance level at 4515.5 indicates Fibonacci confluence, as it aligns with the 100% Fibonacci Projection and the 161.80% Fibonacci Extension.
BTC/USD:
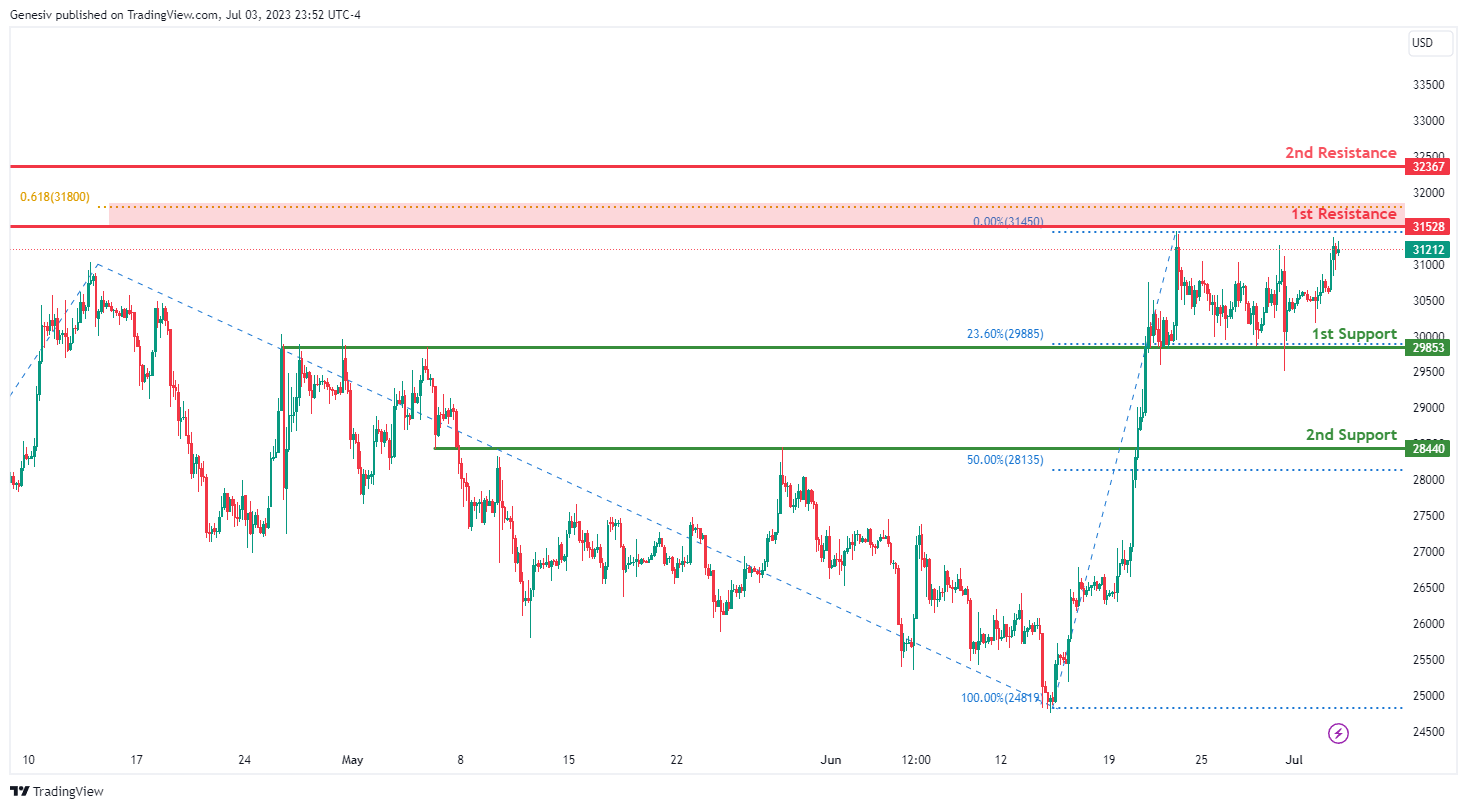
The BTC/USD instrument currently demonstrates a bullish momentum. The contributing factors suggest that the price could potentially continue its bullish trend towards the 1st resistance.
The 1st support level is at 29853, with its strength derived from being an overlap support along with a 23.60% Fibonacci Retracement. The 2nd support stands at 28440, providing a robust base due to its overlap support nature and a 50% Fibonacci Retracement.
In terms of resistance levels, the 1st resistance is at 31528, posing a significant obstacle as an overlap resistance, reinforced by a 61.80% Fibonacci Projection. The 2nd resistance is at 32367, presenting a strong challenge due to its swing high resistance characteristic. These factors collectively contribute to the bullish momentum of BTC/USD.
ETH/USD:
The ETH/USD instrument currently shows a weak bearish momentum with low confidence. The existing factors indicate that the price could potentially react bearishly off the 1st resistance and drop to the 1st support.
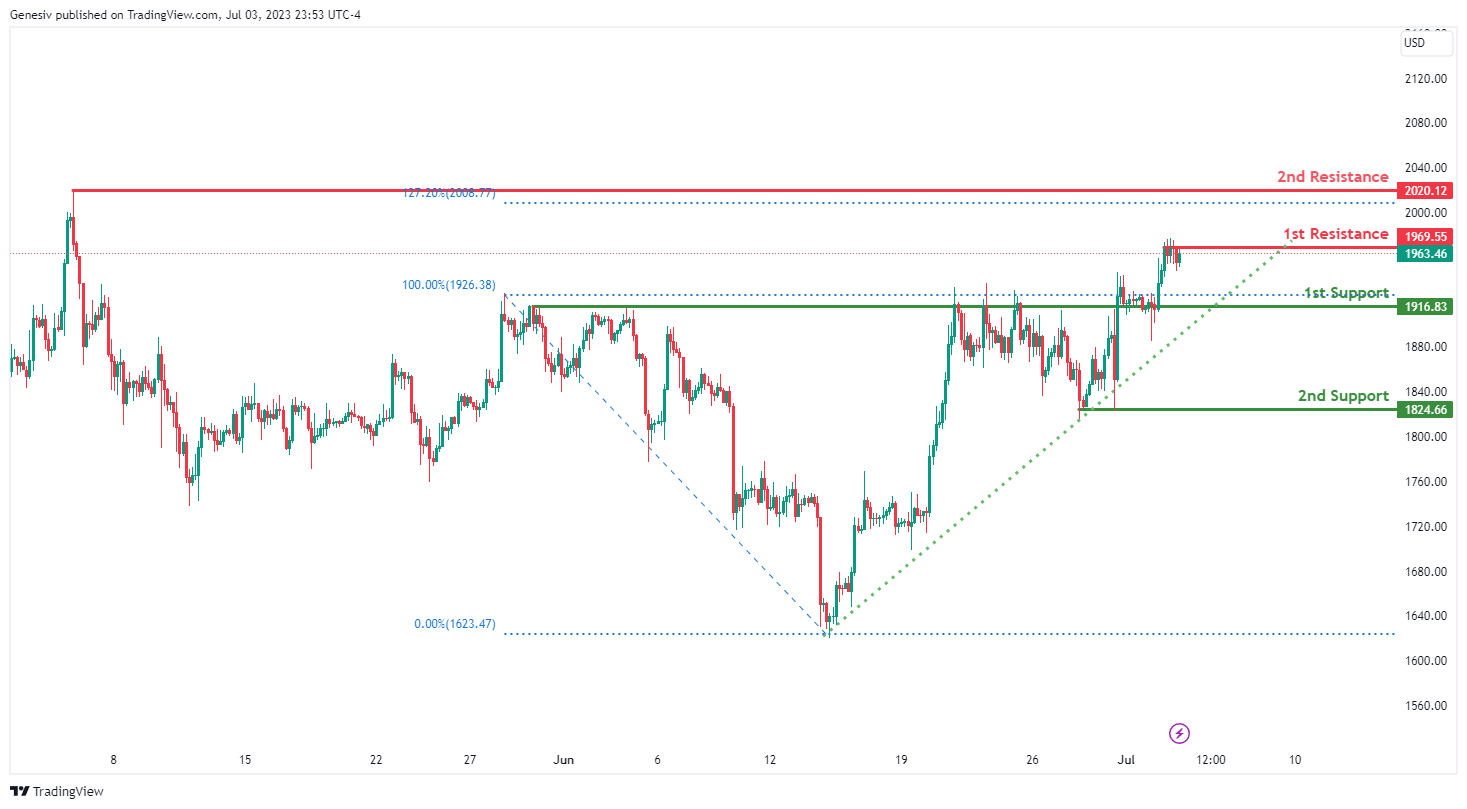
The 1st support level is at 1916.83, providing a solid foundation due to its overlap support nature. The 2nd support stands at 1824.66, offering a strong base with its swing low support characteristic and a 50% Fibonacci Retracement.
As for resistance levels, the 1st resistance is at 1969.55, posing a significant hurdle as a swing high resistance. The 2nd resistance is at 2020.12, presenting a substantial challenge due to its swing high resistance nature and is reinforced by a 127.20% Fibonacci Expansion. These conditions collectively shape the weak bearish momentum of ETH/USD with low confidence.
WTI/USD:
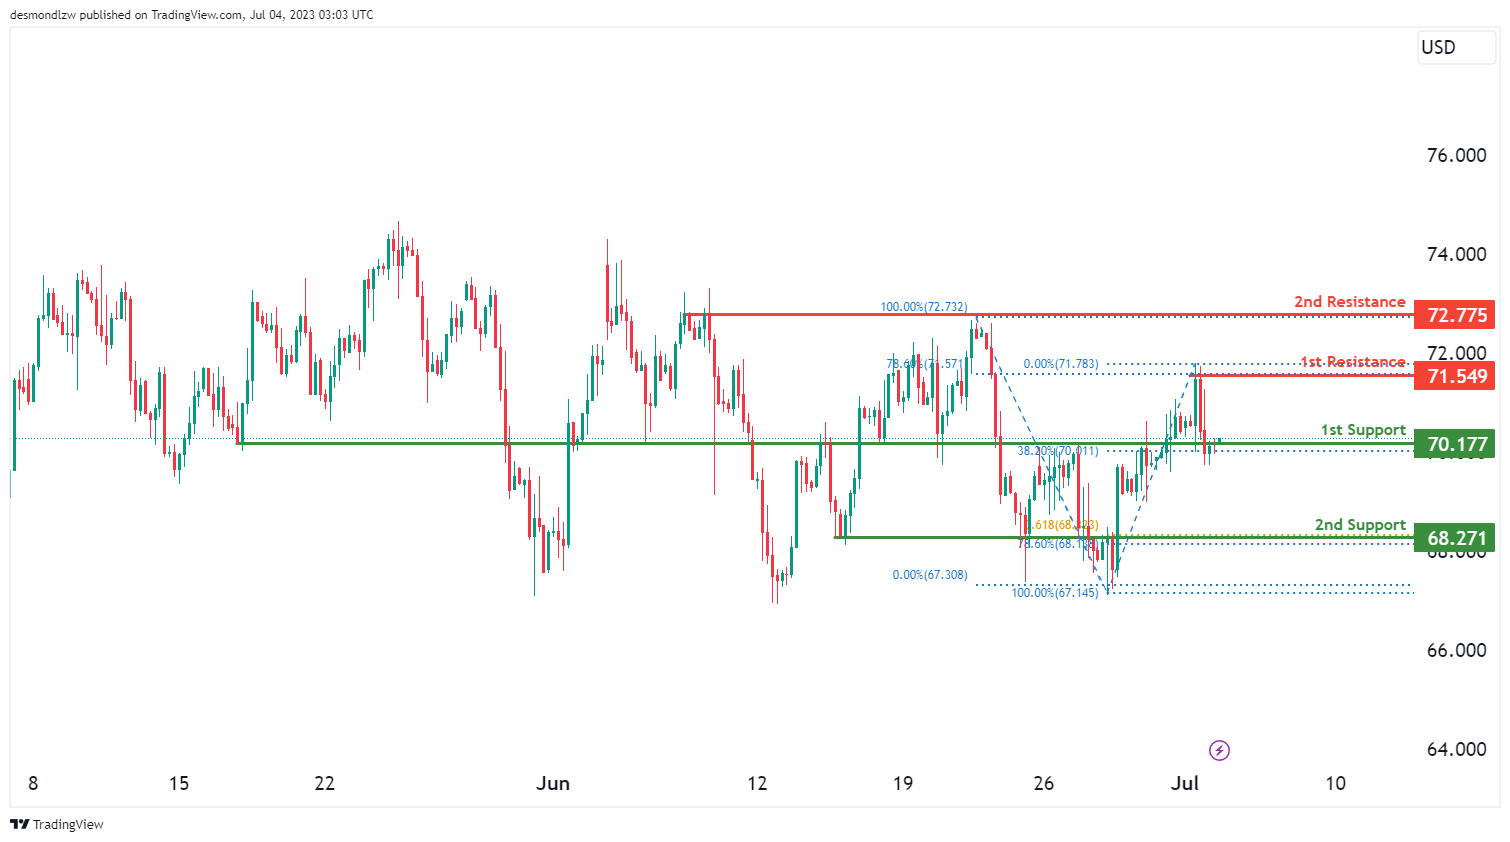
The WTI (West Texas Intermediate) chart currently demonstrates a bullish momentum, indicating a potential for further upward movement in the market. There is a possibility for a bullish bounce off the 1st support level at 70.17, which is identified as an overlap support. Additionally, the 2nd support level at 68.27 serves as a pullback support, showing Fibonacci confluence with the presence of the 61.80% Fibonacci Projection and the 78.60% Fibonacci Retracement.
On the upside, the 1st resistance level at 71.54 represents a swing high resistance, supported by the presence of the 78.60% Fibonacci Retracement. Furthermore, the 2nd resistance level at 72.77 is characterized as a multi-swing high resistance.
XAU/USD (GOLD):
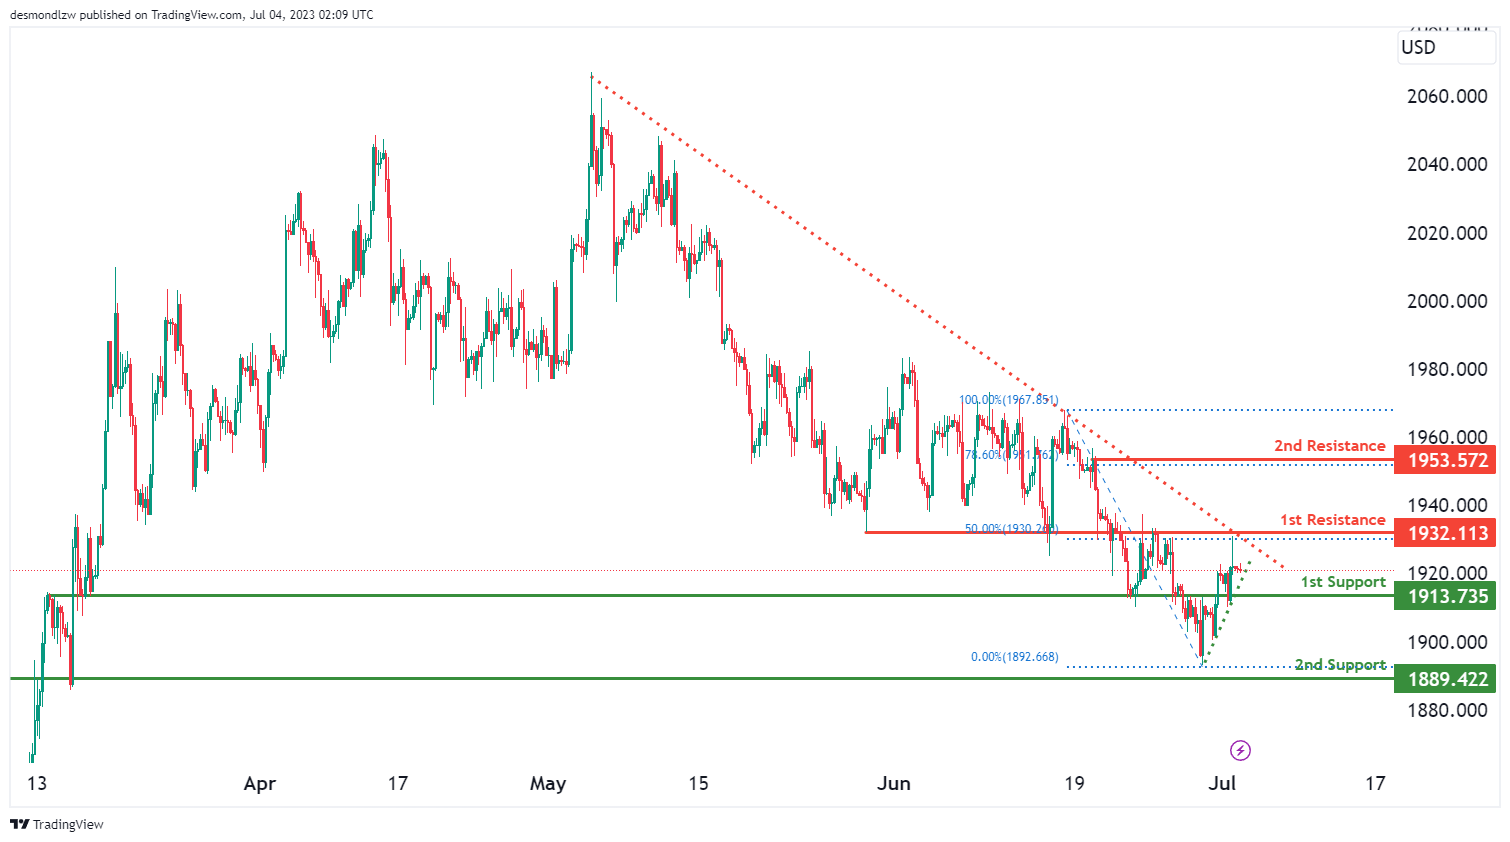
The XAU/USD (Gold/US Dollar) chart currently exhibits a neutral momentum, indicating a lack of clear direction in the market. There is a possibility for the price to fluctuate between the 1st resistance level at 1932.11 and the 1st support level at 1913.73.
The 1st support level at 1913.73 is identified as an overlap support, providing potential strength to the support zone. Additionally, the 2nd support level at 1889.42 acts as another overlap support.
On the upside, the 1st resistance level at 1932.11 represents an overlap resistance, potentially impeding upward price movement. Furthermore, the 2nd resistance level at 1953.57 is categorized as a swing high resistance, supported by the presence of the 78.60% Fibonacci Retracement.
AUD/USD Daily Report
Daily Pivots: (S1) 0.6643; (P) 0.6667; (R1) 0.6698; More...
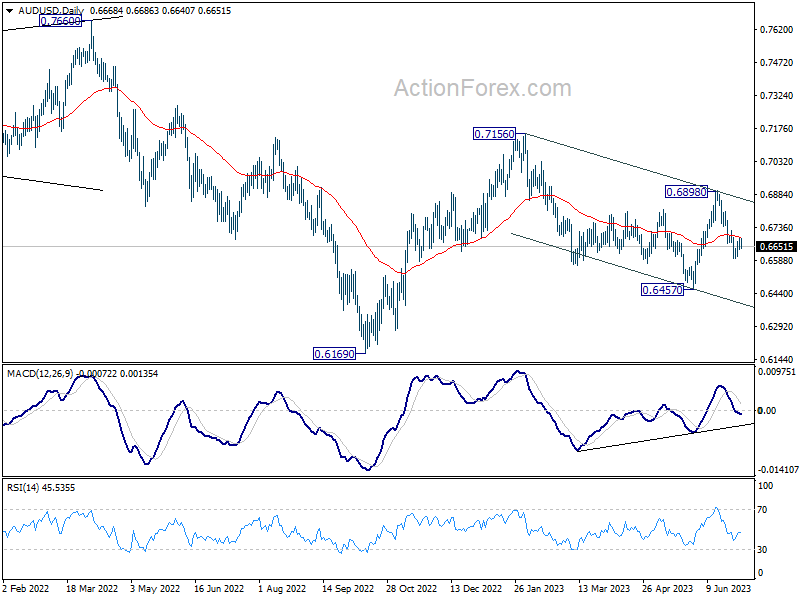
AUD/USD falls slightly after failing to sustain above 55 4H EMA, but stays above 0.6594 support. Intraday bias remains neutral this point. Further fall is in favor with 0.6719 resistance intact. On the downside, break of 0.6594 will resume the decline from 0.6898 to 0.6457 support next. Nevertheless, firm break of 0.6719 will turn bias back to the upside for stronger rebound.
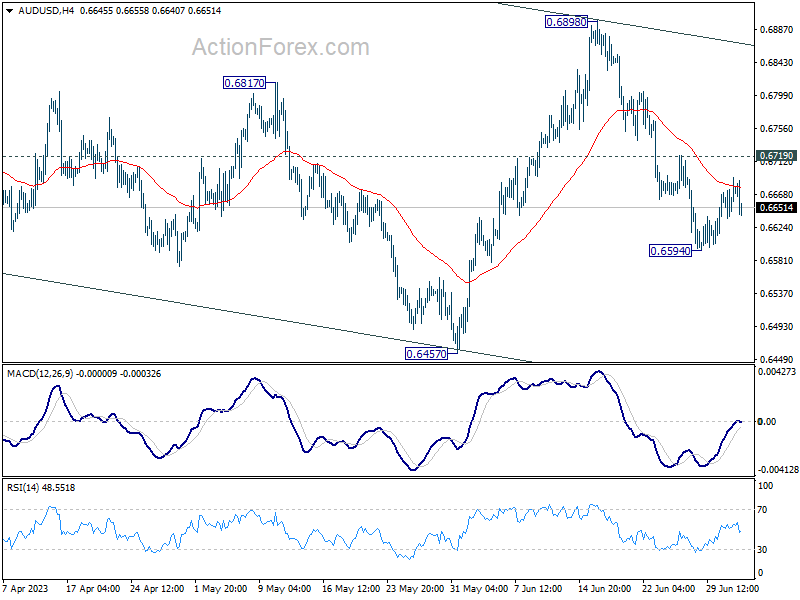
In the bigger picture, price actions from 0.7156 are seen as a correction to the rebound from 0.6169 only, rather than part of larger down trend from 0.8006 (2021 high). Break of 0.6457 could be seen but downside should be contained above 0.6169. This will now remain the favored case as high as 0.6898 resistance holds. Nevertheless, break of 0.6898 resistance will argue that rise form 0.6169 is ready to resume through 0.7156.
Aussie Down Slightly after RBA, Bitcoin Ready for Breakout in Calm Markets
Australian Dollar dips slightly after RBA decided stand pat. But it hasn't seen substantial follow through selling pressure yet. While the decision might have surprised half of the market participants, it doesn't change the tightening path of the central bank. It's more of a decision on delivering the hike today or in August. What next will continue to depend on upcoming economic data. The forex markets are overall rather quiet, with major crosses and pairs generally trapped inside yesterday's range for now. Trading could remain subdue considering that the US is on July 4 holiday today.
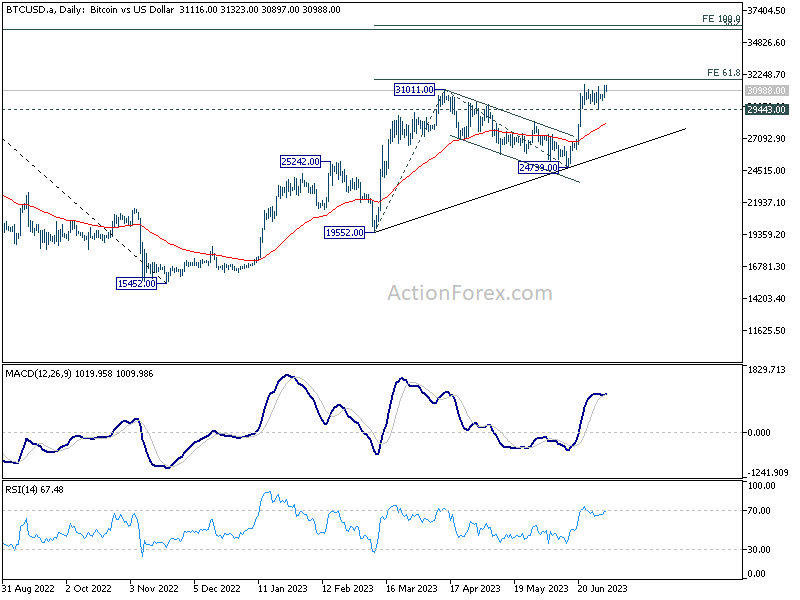
Technically, Bitcoin looks ready to break through 31412 short term top to resume recent rally. But the real test lies in 61.8% projection of 19552 to 31011 from 24739 at 31820. Rejection by this level, followed by break of 29443 support would trigger steep pull back to 55 D EMA (now at 28222) and below. Nevertheless, strong break there could pave the way to 100% projection at 36198. As usual, Bitcoin will be used as one of the guides to gauge the over sentiment on NASDAQ.
Overnight, DOW rose 0.03%. S&P 500 rose 0.12%. NASDAQ rose 0.21%. 10-year yield rose 0.039 to 3.858. In Asia, at the time of writing, Nikkei is down -0.94%. Hong Kong HSI is up 0.38%. China Shanghai SSE is down -0.14%. Singapore Strait Times is down -0.07%. Japan 10-year JGB yield is down-0.0233 at 0.383.
RBA holds cash rate steady, further tightening may be in the offing
RBA keeps cash rate target at 4.10% today, leaving room for further evaluation of the economic landscape. However, the central bank's statement hinted at the possible need for further tightening of monetary policy in the future.
The statement noted, "Some further tightening of monetary policy may be required to ensure that inflation returns to target in a reasonable timeframe," with the stipulation that this would be dependent on how the economy and inflation evolve.
The bank justifies its decision to keep rates unchanged, stating it "provides the Board with more time to assess the state of the economy and the economic outlook and associated risks."
The statement highlighted concerns over the risk of persistent high inflation leading to broader increases in both prices and wages. This concern is heightened due to the limited spare capacity in the economy coupled with a very low unemployment rate.
In response to these potential inflationary pressures, RBA pledged vigilance, stating it "will continue to pay close attention to both the evolution of labour costs and the price-setting behaviour of firms."
AUD/NZD dips after RBA, but holding above 1.0795 temp low
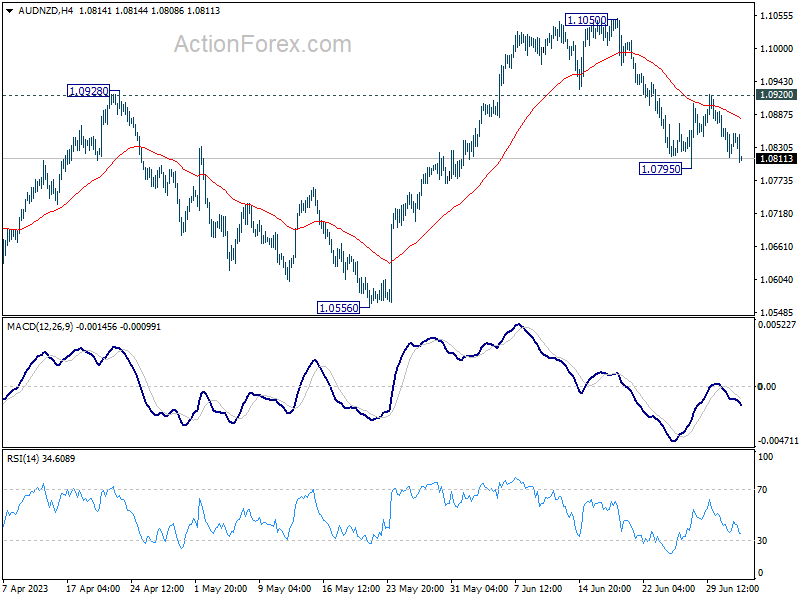
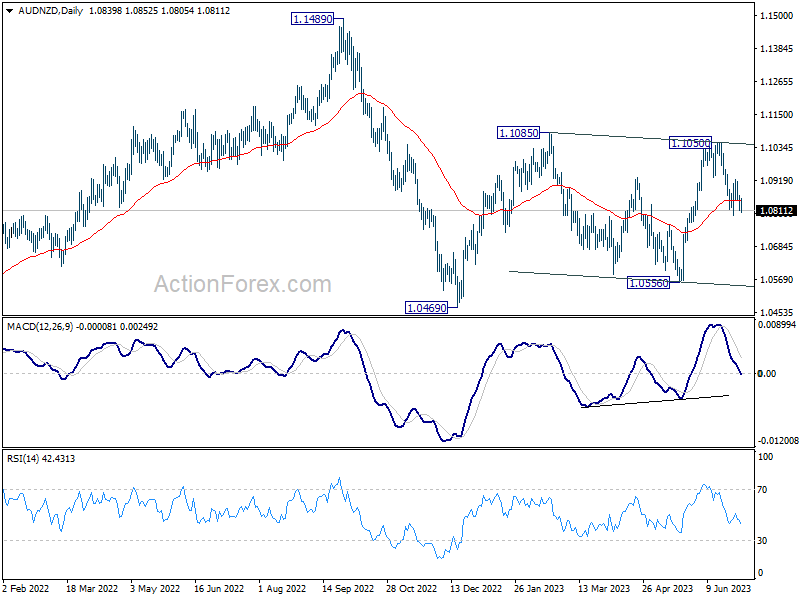
Australian Dollar dips broadly after RBA's hold, but loss is so far limited. AUD/NZD is staying above 1.0795 temporary low for now, even though near term bearish bias is maintained after prior rejection by 55 4H EMA.
Current fall in AUD/NZD from 1.1050 is seen as the third leg of the pattern from 1.1085 for now. Deeper decline is expected as long as 1.0920 resistance holds. Break of 1.0795 will target 1.0056 support and possibly below. But in that case, buying should emerge above 1.0469 support to finish the fall from 1.1050, as well as the pattern from 1.1085.
Looking ahead
Germany trade balance and Canada manufacturing PMI are the only features for today. US is on July 4 holiday.
AUD/USD Daily Report
Daily Pivots: (S1) 0.6643; (P) 0.6667; (R1) 0.6698; More...
AUD/USD falls slightly after failing to sustain above 55 4H EMA, but stays above 0.6594 support. Intraday bias remains neutral this point. Further fall is in favor with 0.6719 resistance intact. On the downside, break of 0.6594 will resume the decline from 0.6898 to 0.6457 support next. Nevertheless, firm break of 0.6719 will turn bias back to the upside for stronger rebound.
In the bigger picture, price actions from 0.7156 are seen as a correction to the rebound from 0.6169 only, rather than part of larger down trend from 0.8006 (2021 high). Break of 0.6457 could be seen but downside should be contained above 0.6169. This will now remain the favored case as high as 0.6898 resistance holds. Nevertheless, break of 0.6898 resistance will argue that rise form 0.6169 is ready to resume through 0.7156.
Economic Indicators Update
| GMT | Ccy | Events | Actual | Forecast | Previous | Revised |
|---|---|---|---|---|---|---|
| 22:00 | NZD | NZIER Business Confidence Q2 | -63 | -66 | ||
| 23:50 | JPY | Monetary Base Y/Y Jun | -1.00% | -0.70% | -1.10% | |
| 04:30 | AUD | RBA Interest Rate Decision | 4.10% | 4.35% | 4.10% | |
| 06:00 | EUR | Germany Trade Balance (EUR) May | 17.0B | 18.4B | ||
| 13:30 | CAD | Manufacturing PMI Jun | 49 |