Sample Category Title
Nikkei Perfect Reaction Higher From The Blue Box Area
In this technical blog, we will look at the past performance of the 1-hour Elliott Wave Charts of Nikkei. We presented to members at the elliottwave-forecast. In which, the rally from 03 May 2023 low unfolded as an impulse structure. And showed a higher high sequence favored more upside extension to take place. Therefore, we advised members not to sell the $NKD_F & buy the dips in 3, 7, or 11 swings at the blue box areas. We will explain the structure & forecast below:
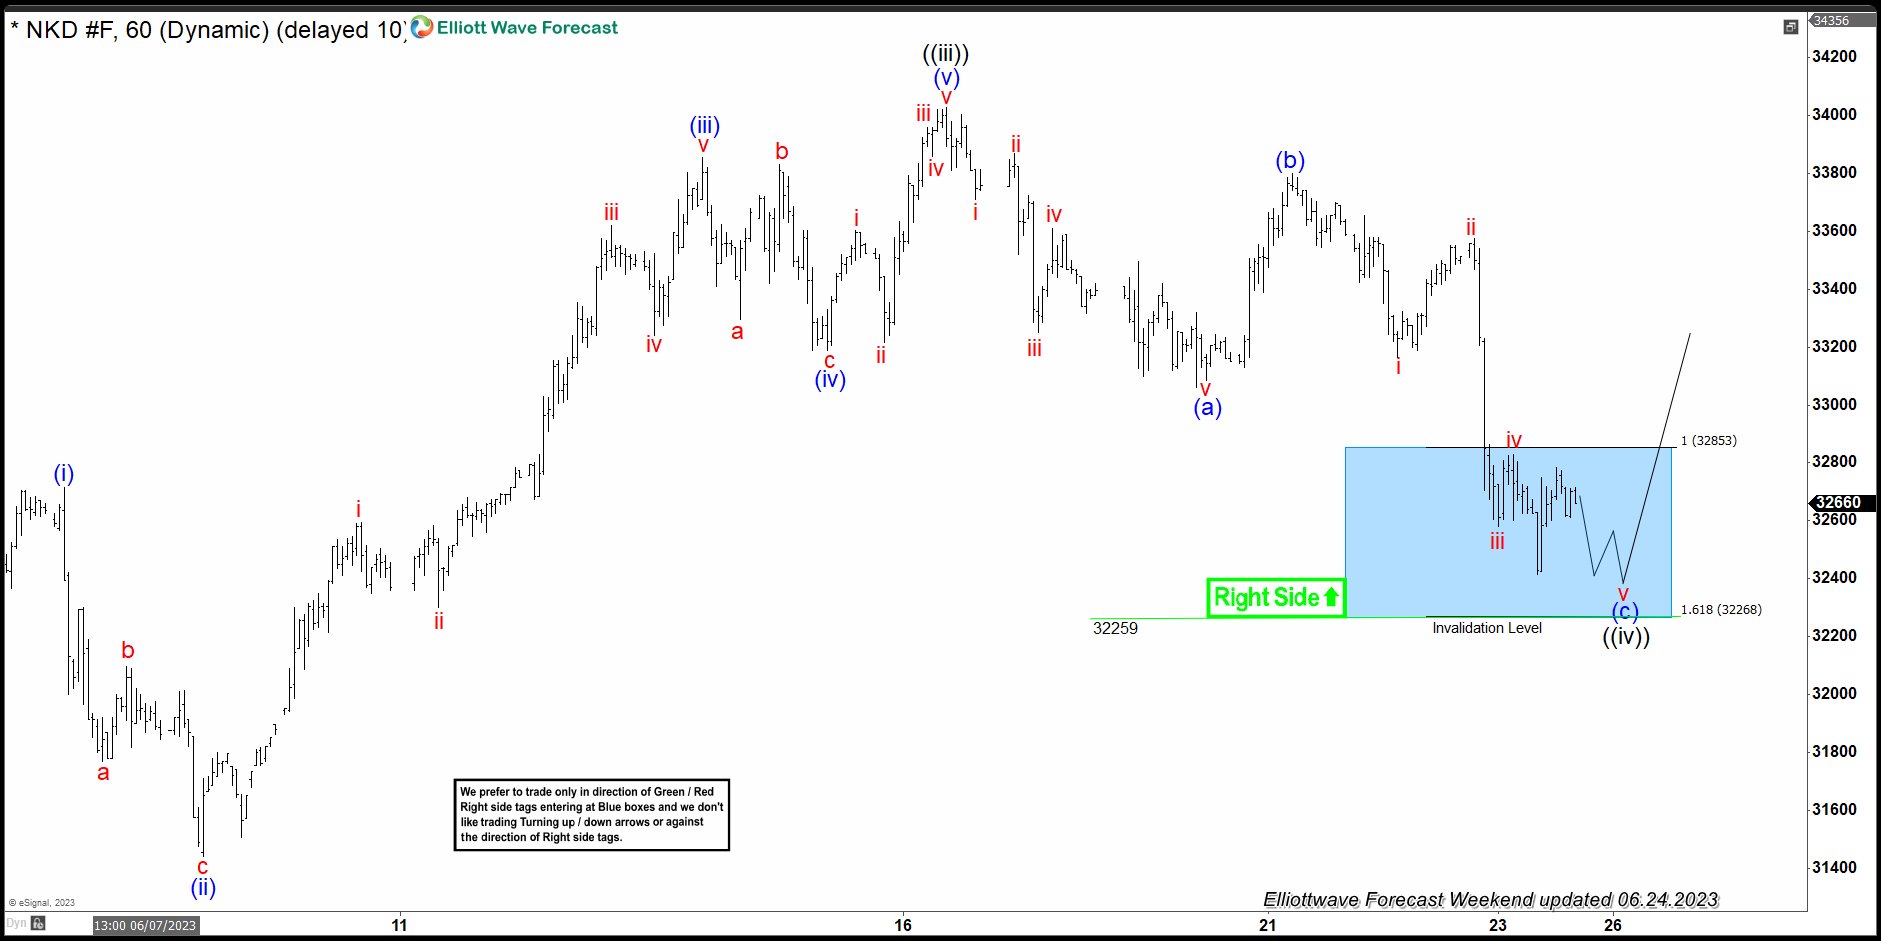
Nikkei 1-Hour Elliott Wave Chart From 6.24.2023
Here’s the 1hr Elliott wave chart from the 6/24/2023 Weekend update. In which, the cycle from the 5/03/2023 low ended in wave ((iii)) as an impulse structure at 34030 high. Down from there, the index made a pullback in wave ((iv)) to correct that cycle. The internals of that pullback unfolded as Elliott wave zigzag structure where wave (a) at 33085 low. Wave (b) ended at 33800 high and wave (c) managed to reach the blue box area at 32853- 32268 area. From there, buyers were expected to appear looking for the next leg higher or for a 3 wave bounce minimum.
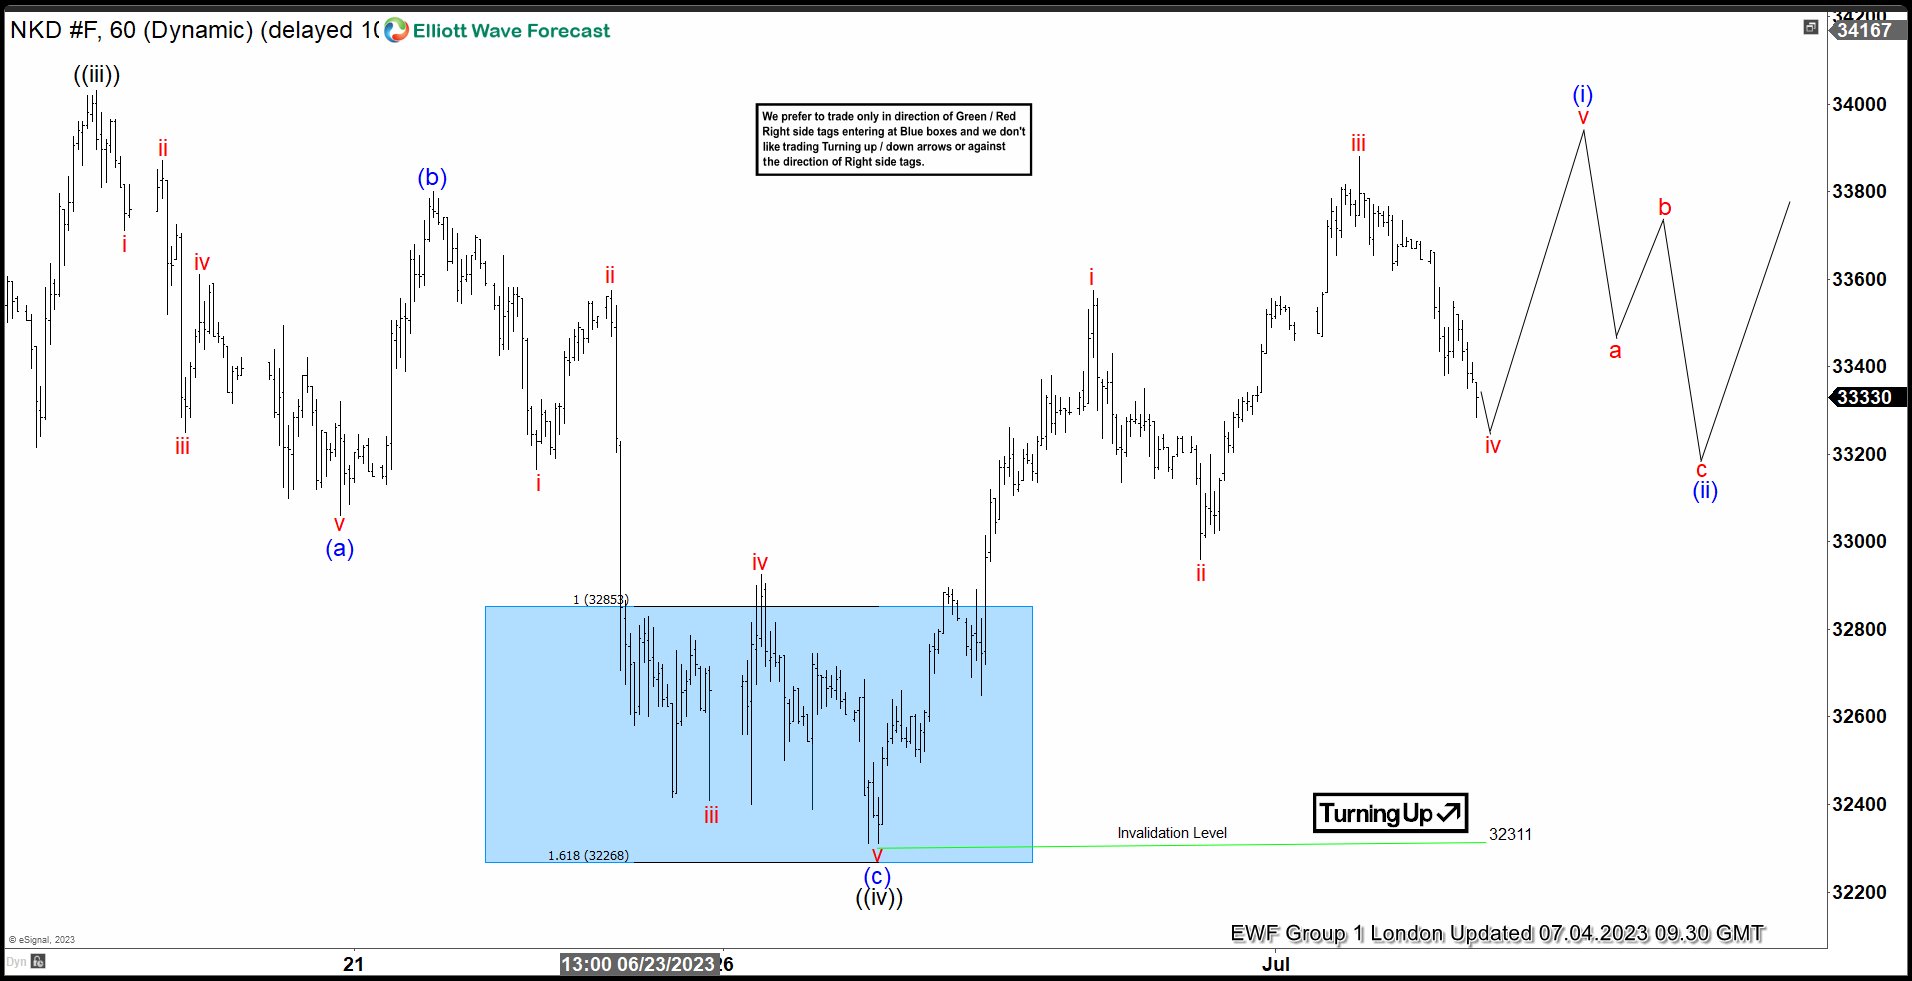
Nikkei Latest 1-Hour Elliott Wave Chart From 7.04.2023
This is the latest 1hr Elliott wave Chart from the 7/04/2023 London update. In which the Nikkei is showing a strong reaction higher taking place, right after ending the zigzag correction within the blue box area. Allowed members to create a risk-free position shortly after taking the long position at the blue box area. However, a break above 34030 high is still needed to confirm the next extension higher & avoid a double correction lower.
Oil Price Gets Harder to Grow
Oil has risen since last Thursday and regained momentum on Monday on news of new production cuts from Russia and Saudi Arabia.
Russia announced on Monday that it would cut oil exports by an additional 500K BPD from August, on top of the same move in March. Saudi Arabia said it would extend its voluntary production cut by 1M BPD for another month. The major OPEC+ players are moving further down the supply cut path to support the price.
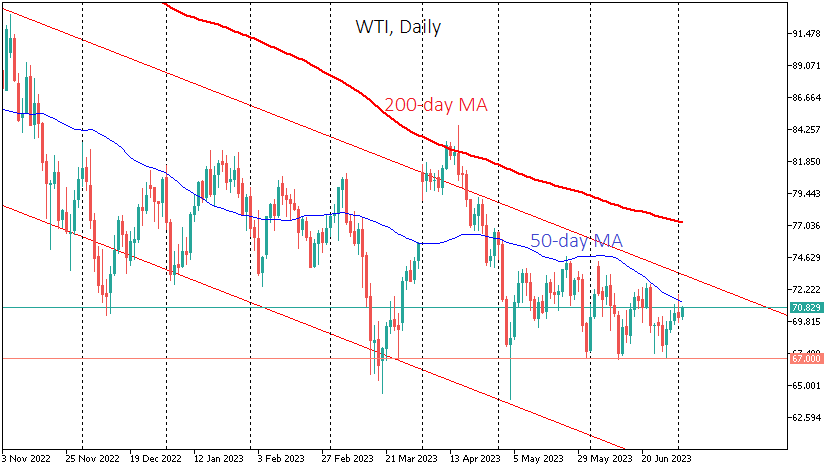
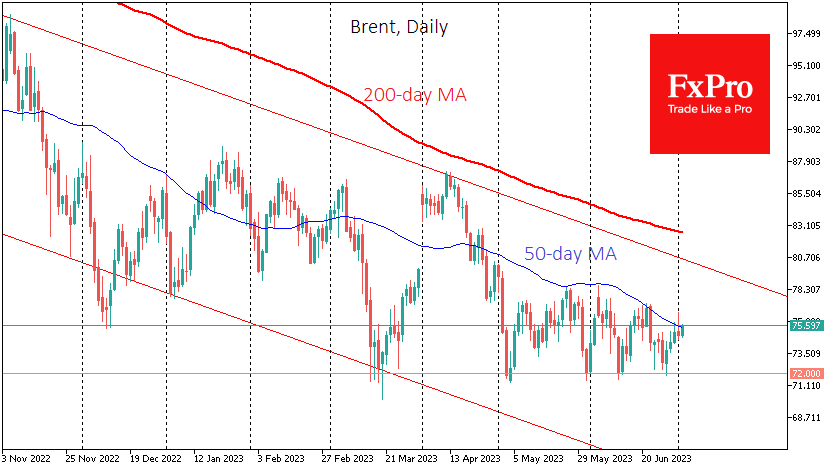
These actions have an effect as they form a solid support line on the charts near $67 per barrel WTI and $72 for Brent. Repeated interventions in the oil market by OPEC+ leaders contribute to a positive feedback loop, with expectations of cartel intervention keeping prices above the desired level.
In addition, reports of a new contract to buy oil into US reserve storage facilities also play into oil’s hands. So, politicians from the biggest oil producers are delivering bullish news for oil.
However, the market is taking a more pragmatic view, and multiple supply cut announcements only have a short-term positive effect on the price but do not change the overall trend. As a result, in addition to the horizontal support since March, the price charts continue to show a downtrend throughout the year. These lines will cross in August, but the market will likely decide on a direction before then.
Given the economic performance and the continued hawkishness of monetary policy, the chances of a bearish breakout are higher.
The short-term technical picture is also bearish, as oil failed to break above its 50-day moving average on Monday, although it was in positive territory early on Tuesday.
Sunset Market Commentary
Markets
The US is closed for Independence Day and there’s no economic data scheduled for release in Europe either. Things can’t possibly get more dull for traders and the likes. A speech by German ECB member Nagel didn’t hold much information other than the by now well-known “a July hike is a done deal, we’ll see in September”. Rates in the country rise a few bps, especially at the long end of the curve (30-y +4.9 bps) though under much lighter volumes than usual. Short maturities, including in swap yields, remain just inches away from the previous cycle/15-yr high. European equity markets hold no direction whatsoever. The EuroStoxx50 flatlines (-0.042%) after again testing but failing to clear the 2021/2022/2023 high yesterday. The euro is under marginal selling pressure against most G10 peers. EUR/USD is trending lower towards the 1.09 pivot compared to an open of 1.0915. Sterling has a remarkable run higher even as Gilts today outperform (3.4-4.9 bps lower) following a sell-off yesterday. EUR/GBP slips sub 0.86 to trade around 0.856 currently. We didn’t see a specific trigger but the EUR/GBP move lower did accelerate after losing end last week/this week’s lows. The Aussie dollar was a bit disappointed after the RBA’s status quo this morning but in the meantime reversed losses into gains. AUD/USD is trading close to 0.67 at the time of writing. We note the strong performance of cyclical/commodity currencies in general. NZD/USD extends gains into a third day, rising to 0.6195. The NOK (EUR/NOK 11.6) and to a lesser extend CAD (USD/CAD 1.321) profit from advancing oil prices. Brent oil bumps higher from $74.65 to $75.95 currently. Saudi Arabia yesterday announced it will extend its voluntary 1 mln b/d production cut into August.
In a tribute to the US celebrating Independence day, we present an often quoted end from founding father Patrick Henry’s speech during the Second Virginia Convention in March, 1775. He sought to rally support in Virginia to oppose any British military intervention in that colony. The convention passed Henry’s resolution to form militias to defend Virginia, and in the following month, fighting broke out at Lexington and Concord up north between British troops and the colonists, marking the official start of the Revolutionary War. (source: Constitutioncenter.org)
“Gentlemen may cry, ‘Peace, Peace,’ but there is no peace. The war is actually begun! The next gale that sweeps from the north will bring to our ears the clash of resounding arms! Our brethren are already in the field! Why stand we here idle? ... Is life so dear, or peace so sweet, as to be purchased at the price of chains and slavery? Forbid it, Almighty God! I know not what course others may take; but as for me, give me liberty, or give me death!" - Patrick Henry March 23, 1775 News & Views
Bloomberg News refers to a draft report from the EU’s executive arm which suggests that the bloc must invest an additional €700bn/year to green the economy while shutting out cheap Russian fossil fuels. That’s a significant increase from the previous (Nov 2021) estimate of €470bn annually already on top of the €578bn earmarked in the multiannual budget (2021-2027). The Strategic Foresight report will be published tomorrow. The bulk of the new investment will have to come from the private sector, while member states must also tap their own funds, according to the report.
Czech National Bank policy maker Kubicek backed this weekend’s comments by CNB governor Michl by pointing out that Q3 rate cut bets are premature. Contrary to Michl, who floated the option of raising policy rates first if needed, Kubicek thinks that monetary policy is sufficiently restrictive. But that of course requires holding on to peak rates for longer… The Czech currency trades marginally stronger today with EUR/CZK declining from 23.75 to 23.70. The next key input for the CNB are next week’s monthly CPI readings (June) which might show single digit inflation for the first time since January 2022. The CNB meets next on August 3rd.
Bitcoin Struggles to Keep Growing
Market picture
The crypto market cap rose 0.4% over the past 24 hours to $1.21 trillion, peaking at $1.22 trillion, to the highest since April. Bitcoin’s dominance remains nearly 50%, the highest since 2021.
This uptrend was formed late last year and marks a typical market recovery pattern, with the most significant asset in the sector attracting buyer interest first.
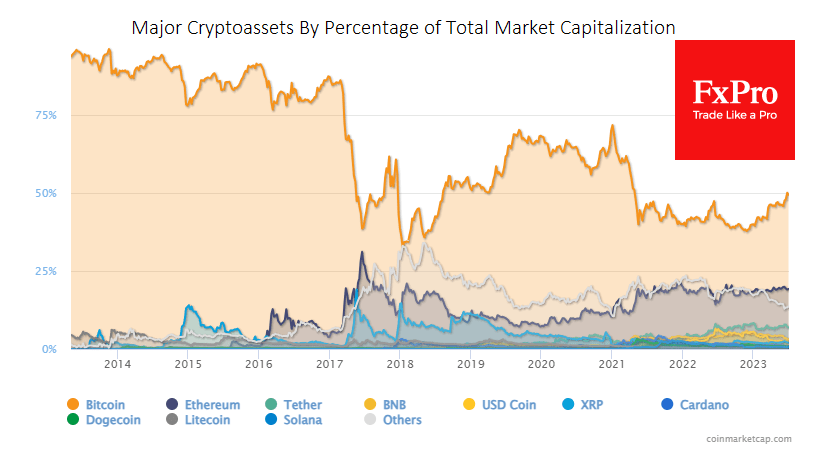
It will probably take about a year of bitcoin price recovery before crypto enthusiasts start looking for one with higher potential (risk), pushing altcoins higher and leading to a new wave of capitalisation swell. This means that a real altcoin rally is unlikely before November. In addition, macroeconomic and regulatory conditions should be supportive.
According to CoinShares, investments in cryptocurrencies rose by $125 million last week, the second consecutive week of inflows. Bitcoin investments increased by $123 million and Ethereum by $3 million.
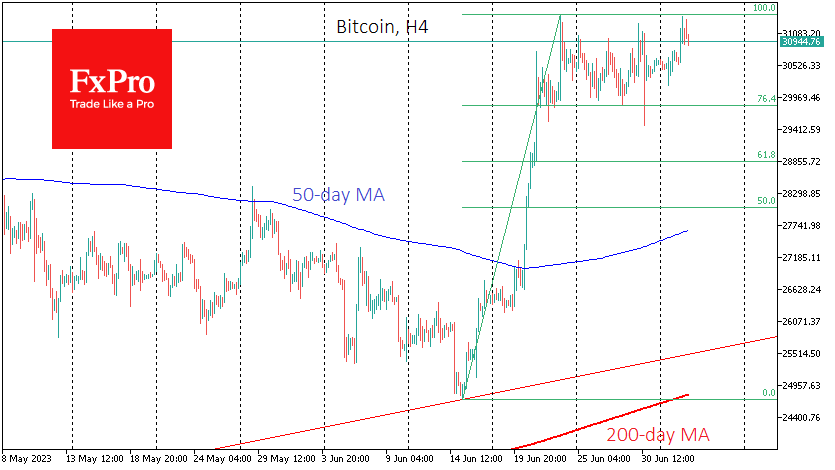
Meanwhile, Bitcoin briefly rebounded above $31.3K on Monday evening, repeating the highs of 23 June, but failed to confirm an upside breakout from the consolidation channel at the start of the European session on Tuesday.
News background
Invesco, VanEck, 21Shares, WisdomTree and Fidelity, sent revised proposals to the SEC to launch a spot bitcoin ETF after previous ones were called “unclear and non-exhaustive” by the Commission. Bloomberg notes the applicants’ increased chances of receiving regulatory approval.
The Bittrex exchange has filed a motion to dismiss the litigation with the SEC. According to the company, the agency has no authority to regulate cryptocurrencies without congressional approval.
Thailand has banned staking and lending in crypto assets in the country. The country’s regulator required exchanges to inform users about the potential risks associated with cryptocurrency trading.
Cryptocurrency ATM operator Bitcoin Depot has announced a listing on Nasdaq. Bitcoin Depot became the first company whose shares were admitted to trading on a major US stock exchange.
Nonfarm Payrolls Awaited as Dollar’s Recovery Stalls
It will be a busy week in the United States, with the Fed minutes on Wednesday serving as an appetizer for the latest edition of nonfarm payrolls at 12:30 GMT on Friday. Some early signs suggest the labor market lost momentum in June, but nothing too dramatic. While a slightly disappointing jobs report could briefly hurt the dollar, the broader outlook seems positive as the US economy continues to outshine its competitors.
Fed rethink
It’s been a solid start to the year for the US economy. Economic growth is running around 2%, the housing market has staged a stunning recovery, and the jobs market remains in good shape. In addition, inflationary pressures have started to cool off, albeit at a relatively slow pace.
With the economy so resilient, investors have priced in a higher-for-longer scenario for interest rates. Market pricing suggests the Fed will raise rates once again by September, with a second rate hike beyond that seen as a coin toss. Most importantly, the timing of any rate cuts has been pushed out into the second half of 2024.
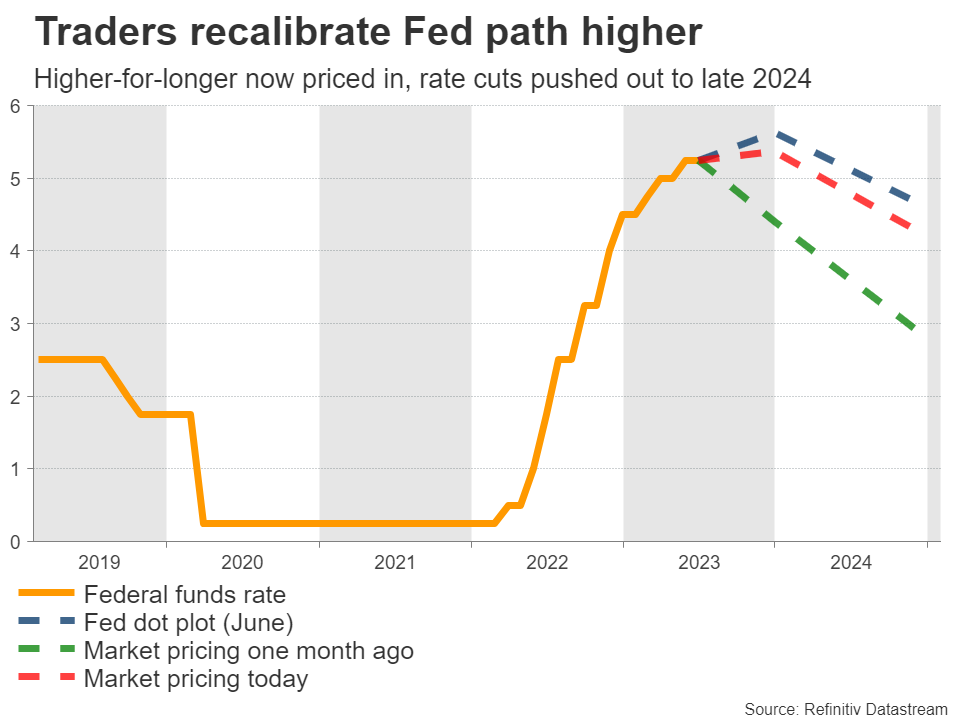
In other words, recession concerns have melted away and traders increasingly believe inflation might prove to be persistent, forcing the Fed to keep policy tighter for a longer period. The striking part is that the dollar could not capitalize on this narrative shift and has instead languished for most of June, as the central-bank-infused strength in the euro and sterling clipped its wings.
Slowdown in nonfarm payrolls?
Turning to this week’s events, the ball will get rolling on Wednesday with the ADP jobs data, ahead of the minutes of the latest FOMC meeting. We’ve heard from Chairman Powell multiple times lately, so the minutes are unlikely to contain any revelations. Then on Thursday, the ISM services survey will be released, before all eyes turn to the official employment report on Friday.
Nonfarm payrolls are forecast at 225k in June, less than the previous month but still a healthy number overall, consistent with continued tightening in the labor market. The unemployment rate is projected to decline back to 3.6%, while wage growth is anticipated to cool slightly in yearly terms to reach 3.6% as well.
As for any risks, most early indicators point to some softness in June. Business surveys revealed the weakest employment growth so far this year, something reaffirmed by the ISM manufacturing index. Meanwhile, initial jobless claims rose during the month, although not much.
The ADP report and the ISM non-manufacturing index will provide further clues as the week progresses, but with the indicators we have seen so far, there is some scope for a slight disappointment in the employment data.
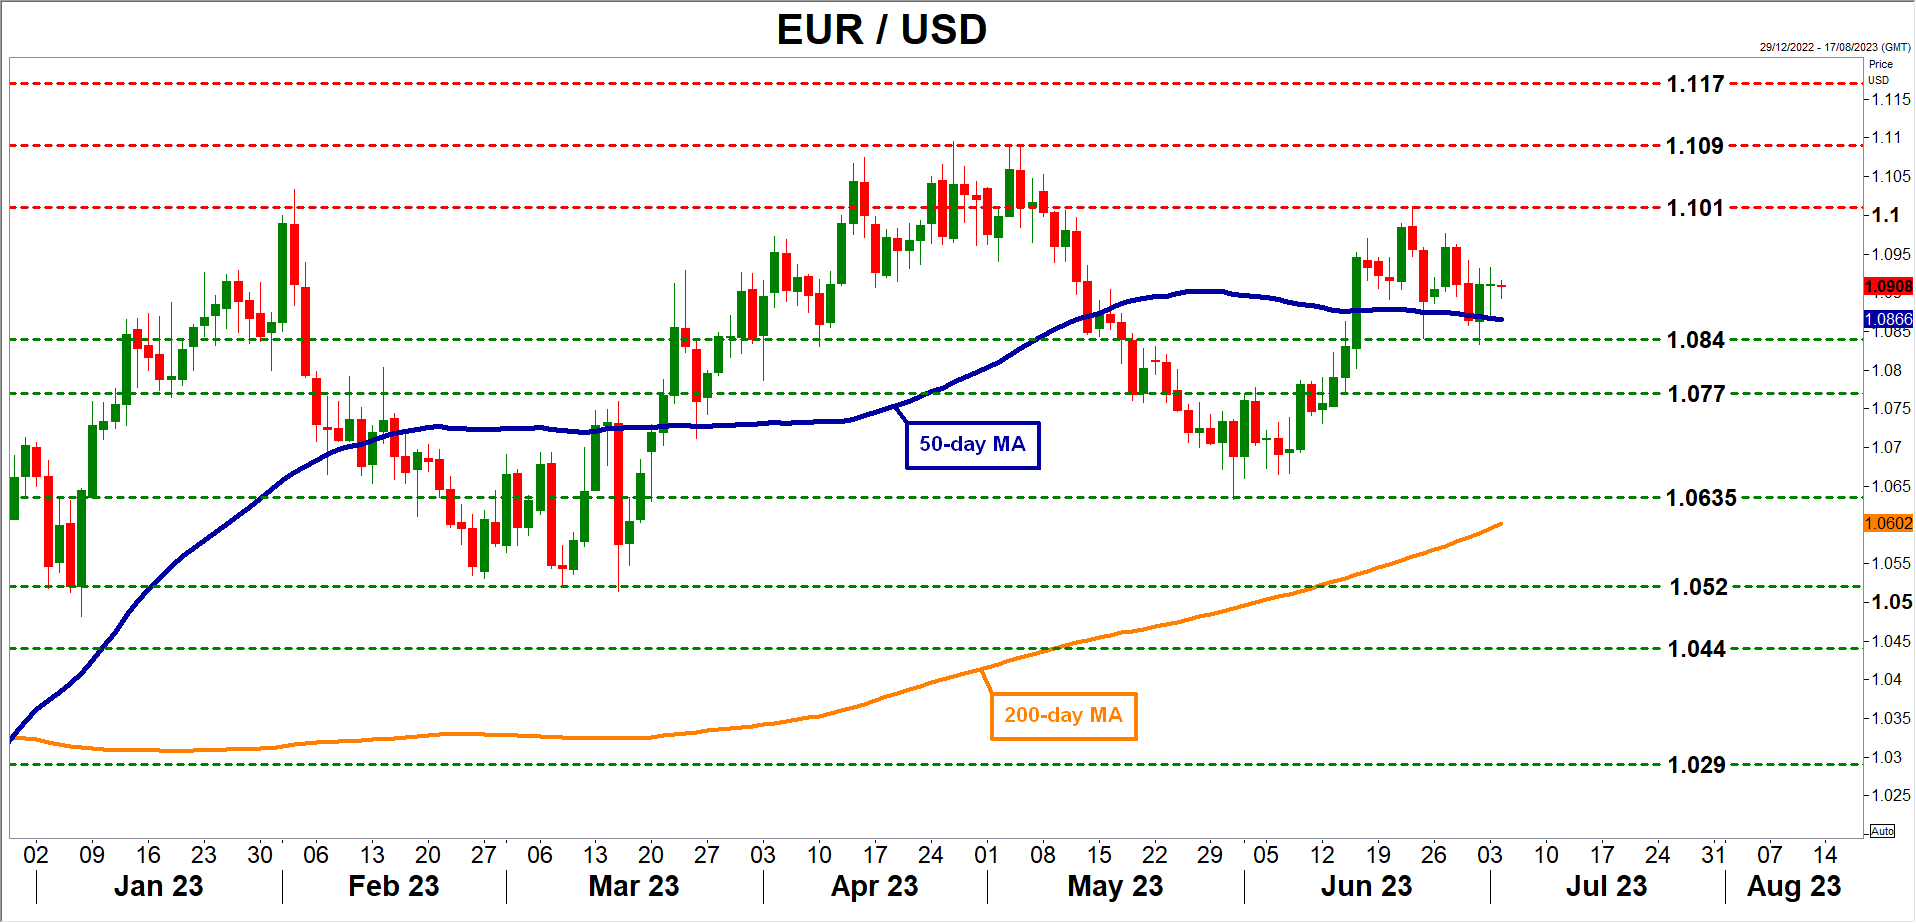
If indeed nonfarm payrolls come in slightly below projections, the dollar could absorb some damage. Looking at the euro/dollar chart, the first major barrier on the upside might be the recent high near 1.1010.
On the flipside, a surprisingly strong employment report - particularly on the wage front - could breathe some life back into the dollar as traders price in higher odds of another rate increase beyond September. In this scenario, euro/dollar could edge lower, perhaps to retest the 1.0840 region.
What’s next?
Looking beyond this week, the outlook for the dollar seems quite favorable. It boils down to relative economic performance, as the US economy is far superior to the Eurozone’s, and this gap could widen further amid warnings from business surveys that the European economy is headed downhill.
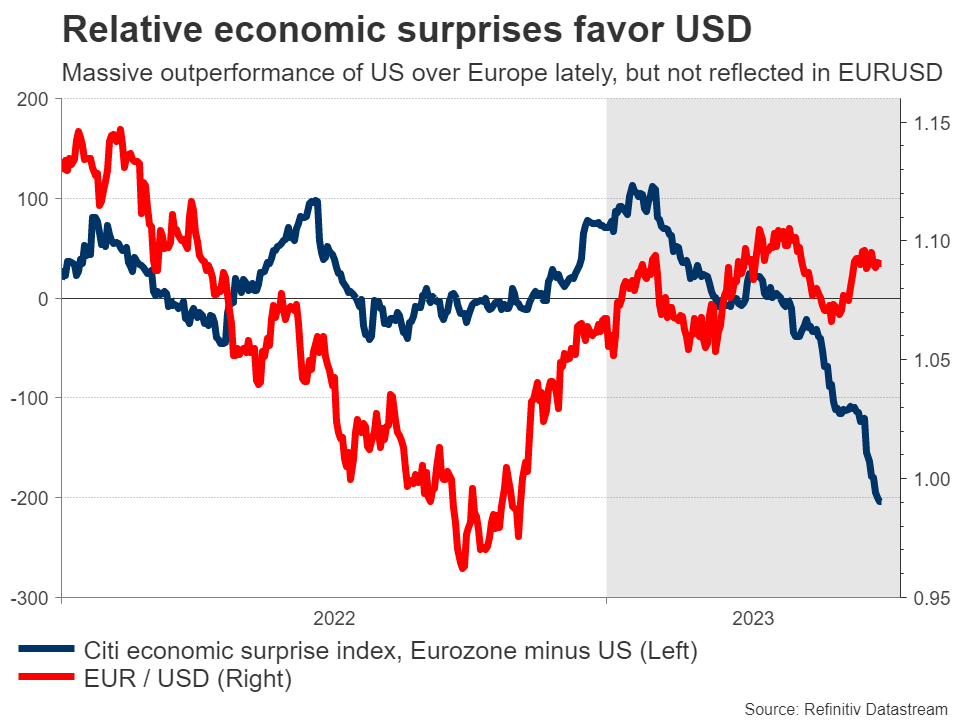
Another element that can help the dollar recover is risk appetite. With stock markets staging a furious rally lately, demand for safe haven instruments has suffered a major blow. If this euphoria calms down and there’s a correction in riskier assets later this year, the dollar could finally attract some defensive flows.
In short, the US economy seems like the cleanest shirt in a dirty laundry basket globally. That might allow the dollar to shine as other economies lose steam, particularly if risk aversion returns to global markets.
Canadian Labour Data in Sight But Market Prepping for Next Week’s BoC Meeting
With the July Bank of Canada meeting gradually creeping into the traders’ minds, this week’s calendar is unlikely to tip the balance in favour of another rate hike or a rate pause. Nevertheless, the loonie might enjoy a boost as the euro/loonie pair is trading very close to its 2023 lows.
Market split on the next BoC decision
The focus this week will understandably be on the US labour market data and their likely impact on the end-of-July Fed meeting. In the meantime, the BoC is holding its fifth meeting for 2023 next week and the market is currently split on the outcome. Earlier this year, the BoC surprised when it restarted its rate hikes following two consecutive meetings, the March and April gatherings, with no rate changes. This "stop-and-go" strategy appears to have been adopted by other central banks as they prefer to keep their options open. However, there is a widespread feeling that most of them are at or very close to their interest rates’ peak.
Manufacturing surveys are not a pleasant reading
The week kicked off with another weak print by the Manufacturing PMI survey. This is a common theme across the globe, evident even in the neighboring US that is arguably in the best economic spot at this stage. Crucially, the closely watched new orders components in both the US and the euro area remain stuck below the 50-midpoint, pointing to a rather bleak outlook for the sector. China holds the key to the manufacturing sector’s recovery, a potentially crucial growth factor for the second half of 2023 that just commenced.
Next stop is Thursday’s trade balance and the BoC would be happy if the current trade surplus continues, confirming that the 2021-2022 phase was not a result of the Covid situation. But Friday is the key day in terms of data releases. Wages are the hottest topic of discussion among central bankers, with ECB’s president Lagarde being quite vocal about the impact of unit labour costs on the elevated inflation outlook at the post-meeting press conference in June.
Tight labour market fuels higher wages
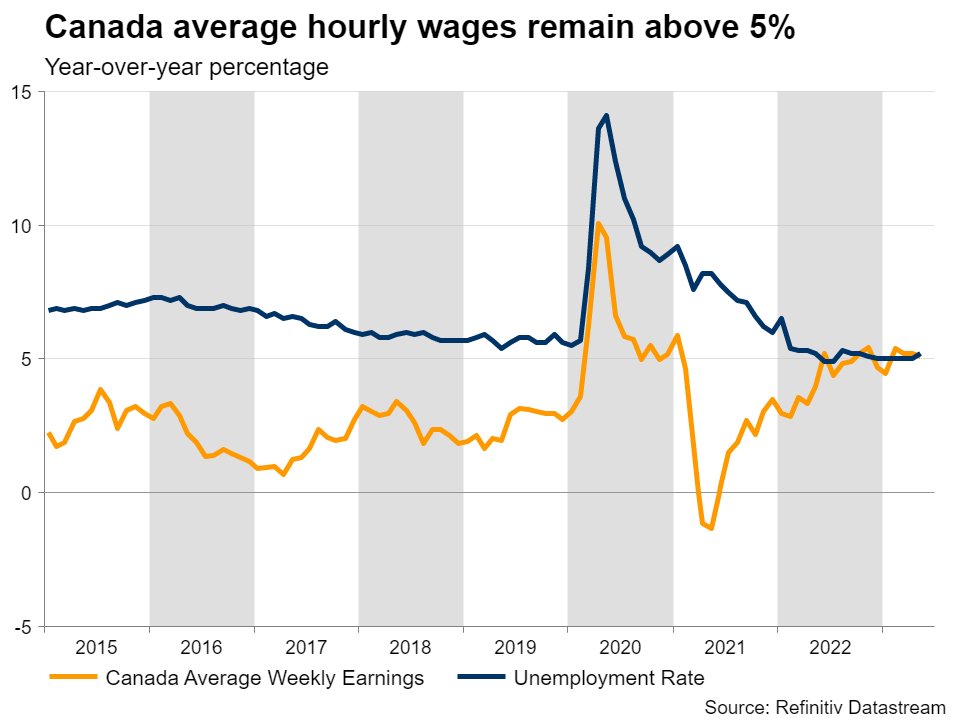
In the case of Canada, the average hourly wages remain above 5%, clearly surpassing the pre-Covid rate. If this trend continues, there is a considerable risk of these increases becoming the norm, elevating workers’ expectations and hence making the 2% inflation target a tough challenge for the BoC. Its April Monetary Policy Report had headline inflation dropping to 2.1% by the end of 2024. A potential revision higher at next week’s update would mostly be due to the elevated labour costs.
Similar to other regions, Canada is enjoying a golden period of employment with the unemployment rate hovering at record-low levels. It is worth noting that the labour force participation rate remains around 0.5% lower than its pre-Covid average level. On the margin, this could mean that the return of this population segment in the labour force - to take advantage of the increased wages - could gradually put downwards pressure on labour costs.
Loonie would love a bit of a boost
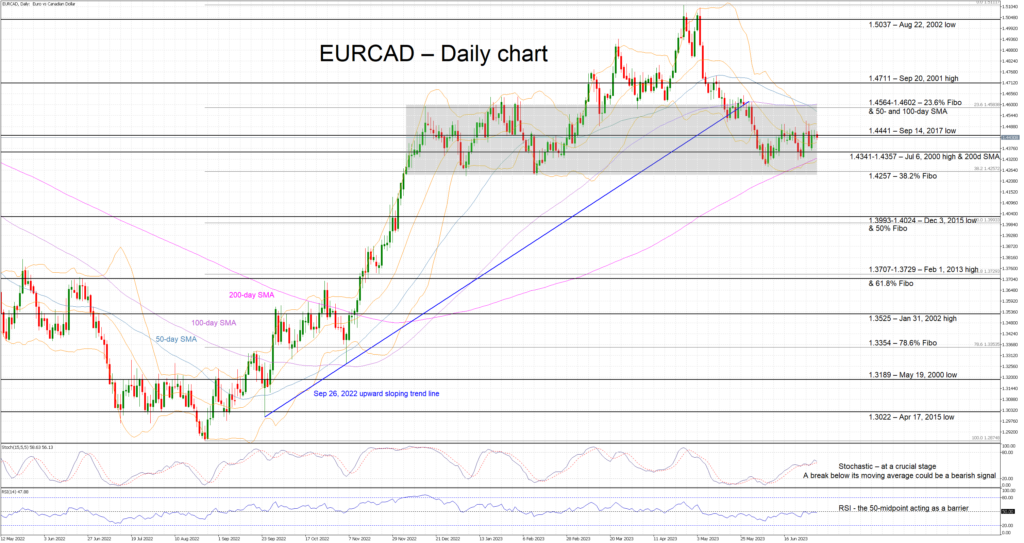
Despite the fluctuations, the euro/loonie pair is just pips above the level it opened on January 1, 2023. Actually, the loonie has been on the back foot until April 2023, weakening to the lowest level against the euro since August 2021. However, it has managed to recover since, with the pair now trading in the 1.4425 area.
A positive set of data on both Thursday and Friday, especially if the average hourly wages surprise on the upside, would be welcomed by the loonie bulls. They could then defend the 1.4441 level and attempt a retest of the busier 1.4341-1.4357 range. This correction could gain further strength if the stochastic halts its recent upward sloping trend and breaks below its moving average.
On the other hand, weaker data releases, which will essentially reduce the chances of a BoC rate hike next week, would most likely disappoint the loonie bulls and potentially result in a sizeable rally towards the 1.4565-1.4602 area.
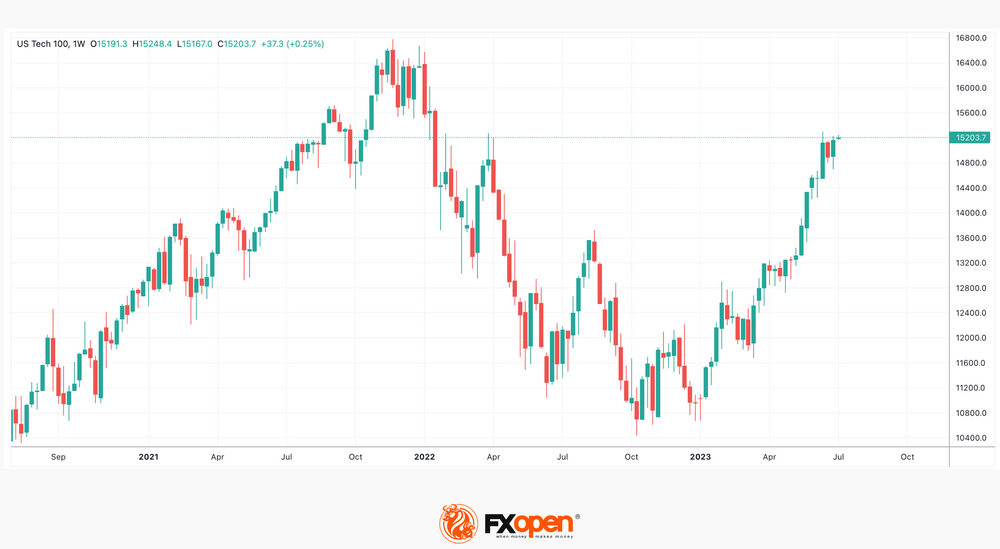
NASDAQ Analysis: Index Is at 1-year High! Is It Sustainable?
2020 may well have been the year of the massive rises in the value of stocks of Silicon Valley-based big tech companies, largely because their area of 'tech' is around e-commerce, social networks, online streaming services and internet access.
This new era of what constitutes technology – online services rather than mechanical engineering – means that during 2020, when many governments instigated the closure of shops and workplaces, whole populations were forced to do almost everything online.
The Silicon Valley giants went from strength to strength.
Given the newfound way of life in which everything from groceries to entertainment is just a click away, it would be easy to consider that this band of internet giants would continue to bolster the US stock market.
This was not the case, and parts of 2021 and 2022 represented a period of tech stock volatility. As most technology firms are listed on the NASDAQ exchange in New York, the NASDAQ Composite Index showed a very varied pattern, including a sustained period in which tech stocks were depreciating rapidly.
That may well have been a surprise for many investors, especially during the halo effect that the new Special Purchase Acquisition Company (SPAC) listings were giving to the tech-friendly exchange. At that time, relatively new companies that few people had heard of were suddenly bypassing the majority of entry requirements and listing for valuations of tens of millions of dollars on the NASDAQ exchange.
This fad has now passed, and the NASDAQ Composite Index had lulled for some time.
Today, however, the index begins the trading day at its highest point in an entire year.
Yesterday's close of business resulted in the index reaching 13,816.77, which is a staggering 2,494 points higher than this time last year. During the past three months, the NASDAQ Composite Index has been consistently rising in value, and today's peak is of great interest.
AUD/USD: Aussie Dollar Stays Afloat after RBA Paused But Kept Hawkish Stance
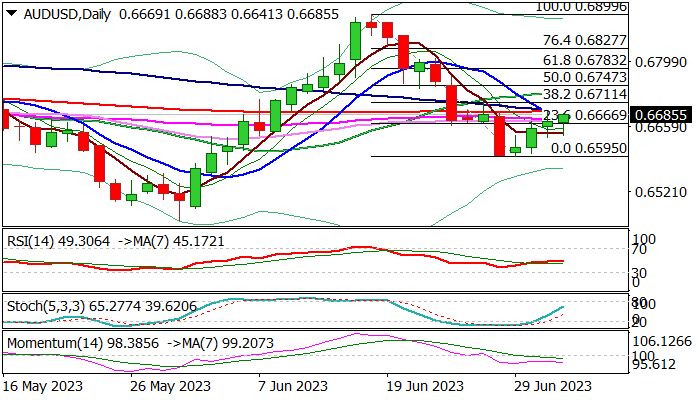
Australian dollar regained traction after post-RBA dip and holding above thin daily cloud, pressuring strong barriers at 0.0.6690 zone (Monday’s high/converged 100/200DMA’s).
The Australian central bank surprised markets by holding interest rates unchanged at 4.10%, the highest in 11 years, as wide expectations were for another 25 basis points hike.
The RBA opted to pause after raising rates by 400 basis points since May last year, to asses the impact of the past hikes, although kept hawkish tone and signaled that further tightening might be needed to bring elevated and sticky inflation, which was running at 7% in Q1, under control and push it towards central bank’s 2-3% target by mid-2025.
Technical picture on daily chart remains bearishly aligned as 14-d momentum is negative and most of moving averages still in bearish setup, keeping the downside at risk as long as price action stays below key barriers at 0.6690/0.6711 zone (100/200DMA’s / Fibo 38.2% of 0.6899/0.6595 fall.
Bearish scenario on repeated rejection at 0.6690 zone sees risk of surge through thin daily cloud and retest of pivotal support at 0.6595 (higher base of June 28/29).
Conversely, sustained break of 0.6690/0.6711 triggers would open way for acceleration of recovery leg from 0.6595.
Res: 0.6690; 0.6711; 0.6747; 0.6783.
Sup: 0.6641; 0.6618; 0.6595; 0.6562.
USDCHF Flattens, But Stays Within Downtrend Channel
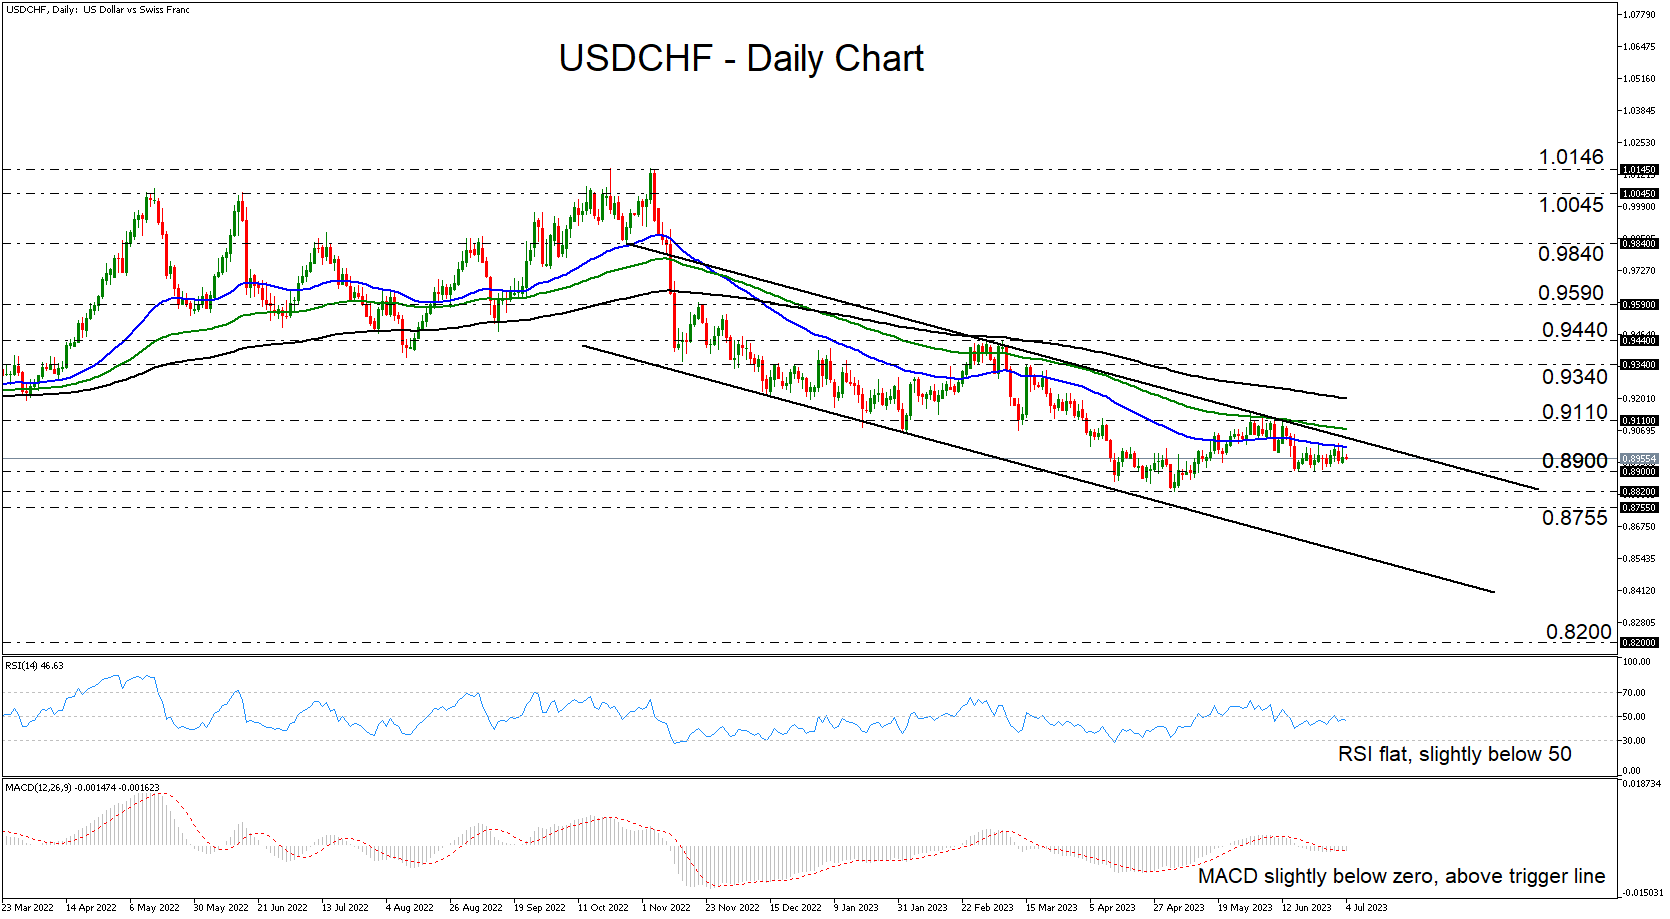
USDCHF has been trading in a sideways manner since June 16, between the 0.8900 support zone and the 50-day exponential moving average (EMA). That said, in the bigger picture, the pair remains within the downward sloping channel that’s been containing the price action since November 10, which keeps the risk of another leg south firmly on the table.
Both the RSI and the MACD indicate a lack of directional speed, corroborating the latest sideways action above 0.8900. The former is flat slightly below its equilibrium 50 mark, while the latter lies fractionally below zero, but still above its trigger line.
For the downtrend to decently extend, the bears may need to overcome, not only the 0.8900 zone, but also the 0.8820 level, marked by the low of May 4, and the 0.8755 territory, which stopped the pair from falling further back in January 2021. If this happens, USDCHF may tumble all the way down to the 0.8200 zone, which marks the low hit just after the SNB removed the 1.20 EURCHF floor back in 2015.
For the outlook to start being considered bullish, USDCHF may need to overcome the 0.9110 area, which offered strong resistance between May 30 and June 12. Such a move would confirm a higher high and the upside exit out of the aforementioned downside channel. The bulls may then get encouraged to climb to the 0.9340 zone, the break of which could aim for the 0.9440 barrier, marked by the highs of March 2 and 8.
To wrap up, USDCHF has been trading sideways since mid-June, but in the bigger picture, it remains within a downside channel since November. This keeps the near-term outlook cautiously negative. For the outlook to change to bullish, the pair may need to rebound and break above the 0.9110 zone.
Is EURJPY Overbought?
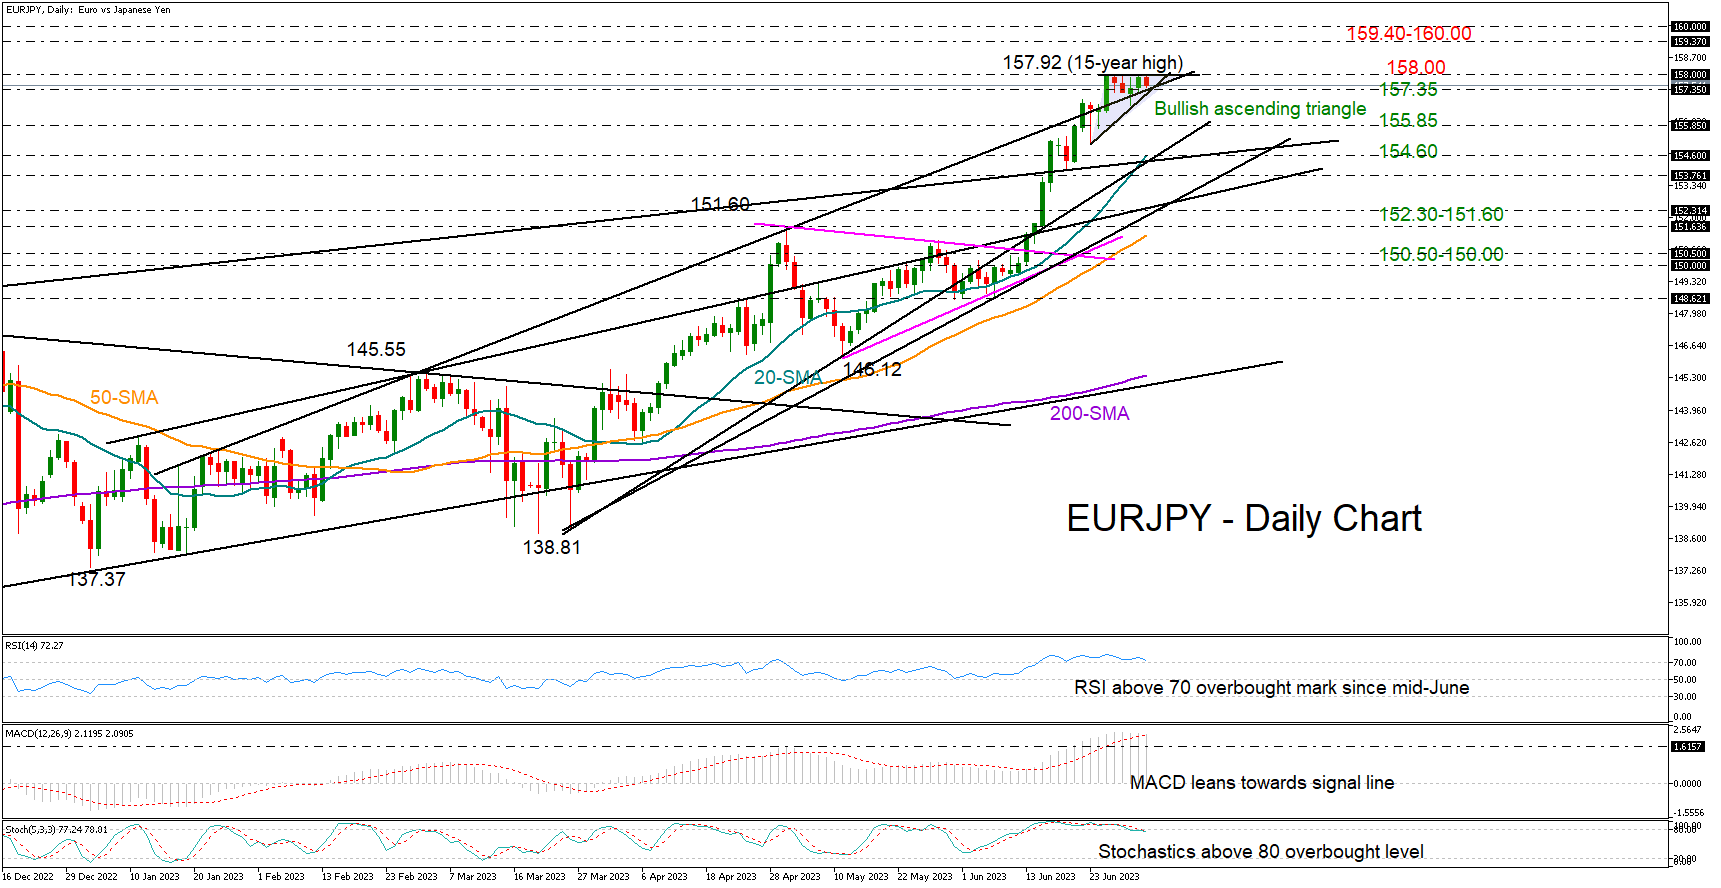
EURJPY bulls ran out of fuel after unlocking a 15-year high of 157.92 last week.
The pair remained trapped below the 158.00 ceiling for the fifth consecutive trading day, increasing speculation that the latest fast rally might have matured. The RSI and the stochastic oscillator have been moving sideways within the overbought zone since mid-June in the daily, weekly and monthly timeframes, backing this narrative too.
The market structure in the very short-term picture, however, seems to be taking the shape of an ascending triangle, which is typically a bullish continuation pattern. If the price exits the triangle on the upside, resistance could next commence within the 159.40-160.00 constraining zone last active during the 2007-2008 period. Another leg higher could pause somewhere between 162.50 and 163.00.
In the event the price slides below the 157.35 floor, where the triangle’s lower trendline intersects the broken resistance line from January 18th, selling pressures could intensify towards the 155.85 handle. Another defeat there could threaten a plunge towards the 20-day simple moving average (SMA) and the broken long-term ascending line from August 2020 at 154.45.
All in all, EURJPY could end lower on profit-taking in the short term. Yet, as long as the price trades above the 157.35 base, there is potential for a rally aiming for the 160.00 psychological mark.