

Sample Category Title
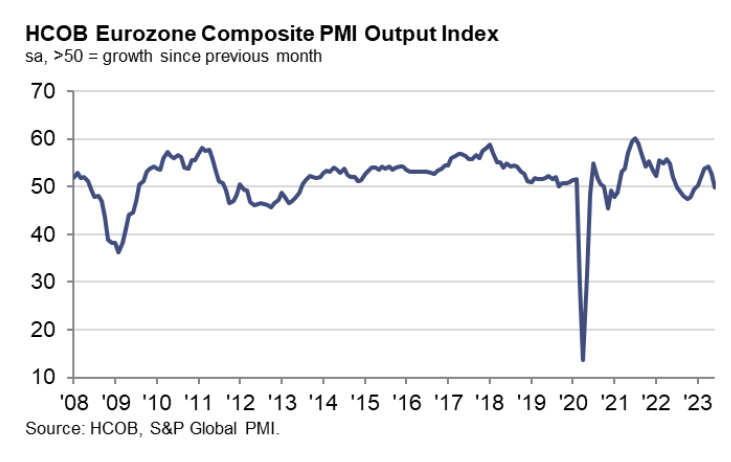
Eurozone PMI composite finalized at 49.9, all major euro countries lost considerable momentum
Eurozone Services PMI was finalized at a 5-month low at 52.0 from May's 55.1, while Composite PMI was finalized at a 6-month low at 49.9, down from May's 52.8.
Exploring some member states' performance, a general slowdown was observed with Spain hitting a 5-month low at 52.6, Ireland at a 6-month low with 51.4, Germany at a 5-month low at 50.6, Italy hitting a 6-month low with 49.7, and France, with the most significant contraction, at a 28-month low of 47.2.
Cyrus de la Rubia, Chief Economist at Hamburg Commercial Bank, noted that "all major euro countries have again lost considerable momentum." Slowdown was accompanied by weaker rise in new business, lower price increases, and decline in business expectations." Neertheless, job creation remained roughly as solid as in the previous month
While price pressure in the services sector, a key point of focus for ECB, has somewhat eased, de la Rubia cautioned that input costs are still rising robustly by historical standards. This is forcing service firms to pass on at least some of these cost increases, partially driven by higher wages, to end customers. The resulting stubbornly high core inflation suggests that the ECB may continue hiking policy rates in response.
EUR/GBP Technical: Still Evolving in a Medium-Term Downtrend
- The medium-term downtrend phase of EUR/GBP in place since the 3 February 2023 high of 0.8979 remains intact.
- Recent price actions have staged a decline from its 28 June 2023 high of 0.8658 and reintegrated below the 20-day moving average.
- Watch the key short-term resistance of 0.8610 to maintain a bearish tone
Since its 3 February 2023 high of 0.8979, the EUR/GBP has continued to evolve in a medium-term downtrend phase as depicted by its price actions that oscillated within a descending channel.
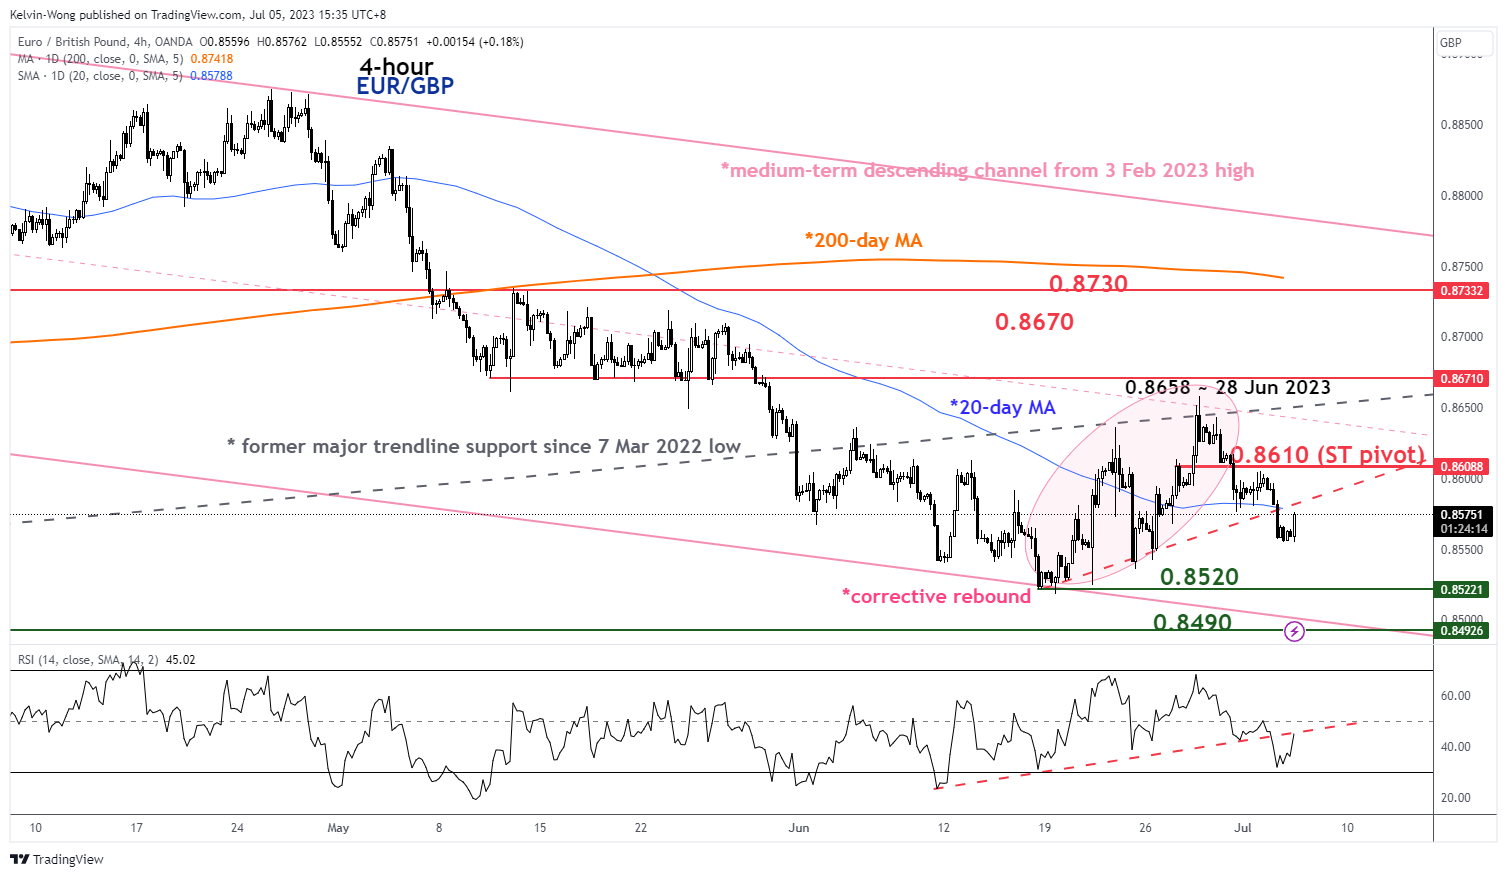
Fig 1: EUR/GBP short-term and medium-term trends as of 5 Jul 2023 (Source: TradingView, click to enlarge chart)
Minor corrective rebound may have ended
In the past two weeks, the EUR/GBP has staged a minor corrective rebound within the medium-term downtrend phase where it rallied by 140 pips from its 0.8518 low printed on 19 June 2023 to a high of 0.8658 on 28 June 2023.
The corrective rebound has managed to stall (the second time) after a retest on the pull-back resistance of the former major trendline support from the 7 March 2022 low and reintegrated back below its 20-day moving average yesterday, 7 July. These observations suggest that the corrective rebound may have ended.
Downside momentum intact
The 4-hour RSI oscillator has not hit its oversold region which suggests that the recent slide from the 28 June 2023 high of 0.8658 has not been overextended to the downside.
Watch the 0.8610 short-term pivotal resistance to maintain the bearish tone with the next supports coming in at 0.8520 and 0.8490 (the lower limit of the medium-term descending channel & Fibonacci extension/retracement cluster).
On the other hand, a clearance above 0.8610 sees the next resistances coming in at 0.8670 and 0.8730 (200-day moving average).
USDJPY Trades Sideways, Momentum Ready to Turn Bearish
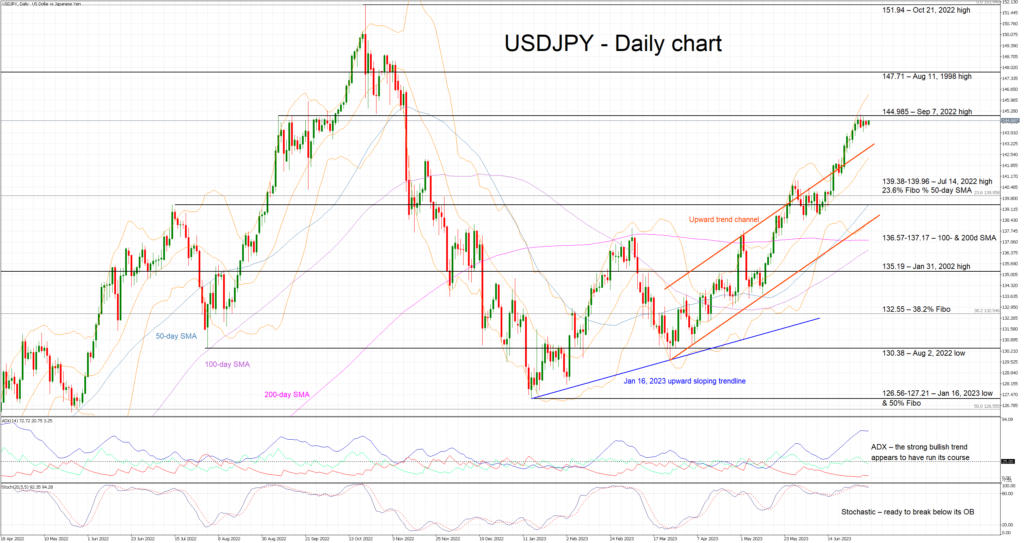
USDJPY has been trading sideways over the past five sessions as the aggressive rally that started on March 24, 2023 appears to have halted. There are a few reasons for the latest move, including the intervention talk, but the bears are still not satisfied. They are desperately looking for a small pullback to recover part of their recent losses and dent the bulls’ confidence.
It is fair to say that the momentum indicators are finally showing some rally exhaustion signs. The stochastic oscillator continues to trade in its overbought territory, but it appears to be making another effort to move below the 80-threshold and therefore confirm the increased bearish pressure. In the meantime, the Average Directional Movement Index (ADX) has topped, and it is currently trading sideways. A continuation of this move or even a drop by the ADX would be seen as a signal that the bullish trend has run its course.
Having said that, the bears are ready to defend the September 7, 2022 high at 144.99 and push USDJPY back inside the recent upward trend channel. Even lower, the key 139.38-139.96 range, populated by the July 14, 2022 high and the 23.6% Fibonacci retracement level of the March 9, 2022 - October 21, 2022 uptrend, awaits them. A successful break of this area would be a significant win for the bulls from a market sentiment perspective.
On the flip side, the bulls accept the need for a small correction, but they are still keen on registering a new 2023 high. They are keen on quickly clearing the 144.99 level and then targeting the August 11, 1998 high at 147.71. They can then set their eyes on the 32-year high at 151.94.
To conclude, the path of least resistance remains for higher USDJPY prints but, for the first time in a while, the bears could count on the momentum indicators' support to finally engineer a pullback towards the 139.96 area.
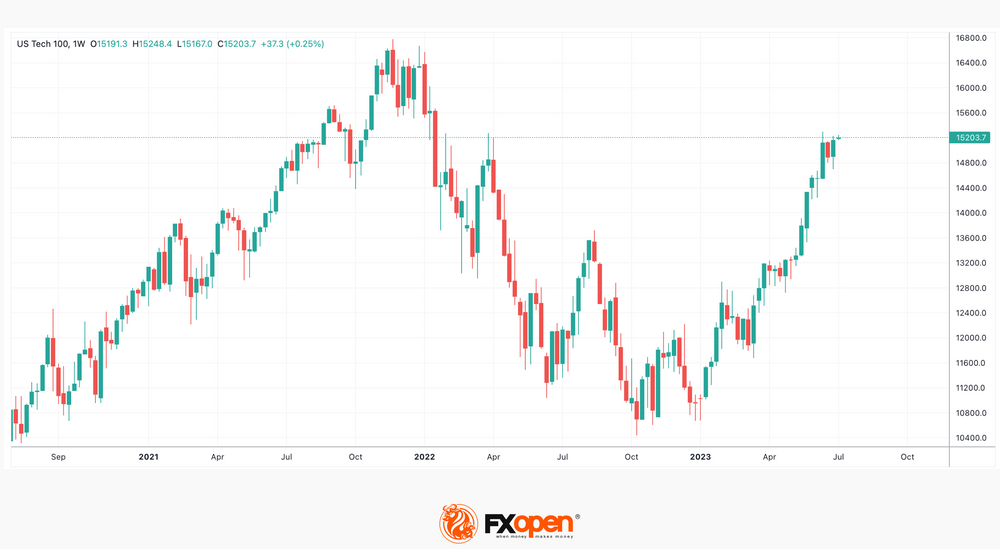
EUR/USD Drops Again While USD/CHF Gains Strength
EUR/USD started a fresh decline from the 1.0930 resistance. USD/CHF is rising and might aim a move toward the 0.9015 resistance.
Important Takeaways for EUR/USD and USD/CHF Analysis Today
- The Euro struggled to clear the 1.0930 resistance against the US Dollar.
- There is a major bearish trend line forming with resistance near 1.0890 on the hourly chart of EUR/USD at FXOpen.
- USD/CHF is gaining pace above the 0.8965 resistance zone.
- There is a key bearish trend line forming with resistance near 0.8980 on the hourly chart at FXOpen.
EUR/USD Technical Analysis
On the hourly chart of EUR/USD at FXOpen, the pair struggled many times near the 1.0930 resistance. The Euro started a fresh decline from the 1.0931 swing high against the US Dollar.
There was a move below the 50-hour simple moving average at 1.0890. The bears were able to push the pair below the 50% Fib retracement level of the upward move from the 1.0835 swing low to the 1.0931 high.
It seems like the pair might continue to move down considering the RSI is below 35. On the downside, immediate support on the EUR/USD chartis seen near 1.0845. It is close to the 76.4% Fib retracement level of the upward move from the 1.0835 swing low to the 1.0931 high.
The next major support is near the 1.0835 level. A downside break below the 1.0835 support could send the pair toward the 1.0780 level.
Immediate resistance on the upside is near the 50-hour simple moving average at 1.0890. It is close to a major bearish trend line. The first major resistance is near 1.0920. The next key resistance is near the 1.0930 level.
An upside break above the 1.0930 level might send the pair toward the 1.0970 resistance. Any more gains might open the doors for a move toward the 1.1010 level.
USD/CHF Technical Analysis
On the hourly chart of USD/CHF at FXOpen, the pair started a decent increase from the 0.8930 support. The US Dollar gained climbed above the 0.8950 resistance zone against the Swiss Franc.
The pair cleared the 50% Fib retracement level of the downward move from the 0.9004 swing high to the 0.8945 swing low. It is now trading above the 0.8965 level and the 50-hour simple moving average.
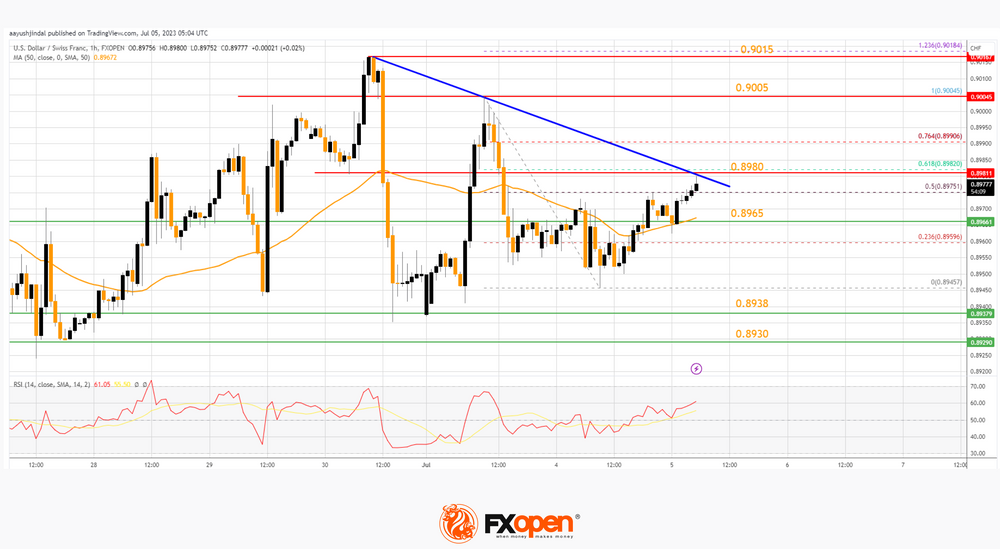
On the upside, the pair is now facing resistance near a key bearish trend line at 0.8980. It is close to the 61.8% Fib retracement level of the downward move from the 0.9004 swing high to the 0.8945 swing low. The next major resistance is near the 0.9005 level.
If there is a clear break above the 0.9005 resistance zone and the RSI climbs above 70, the pair could start another increase. In the stated case, it could test 0.9050.
On the downside, immediate support on the USD/CHF chart is near the 50-hour simple moving average at 0.8965. The first major support is near 0.8938. The next major support is near the 0.8930 level. Any more losses may possibly open the doors for a move toward the 0.8900 level or even 0.8880 in the near term.
USDJPY Analysis: Calm Before the Storm?
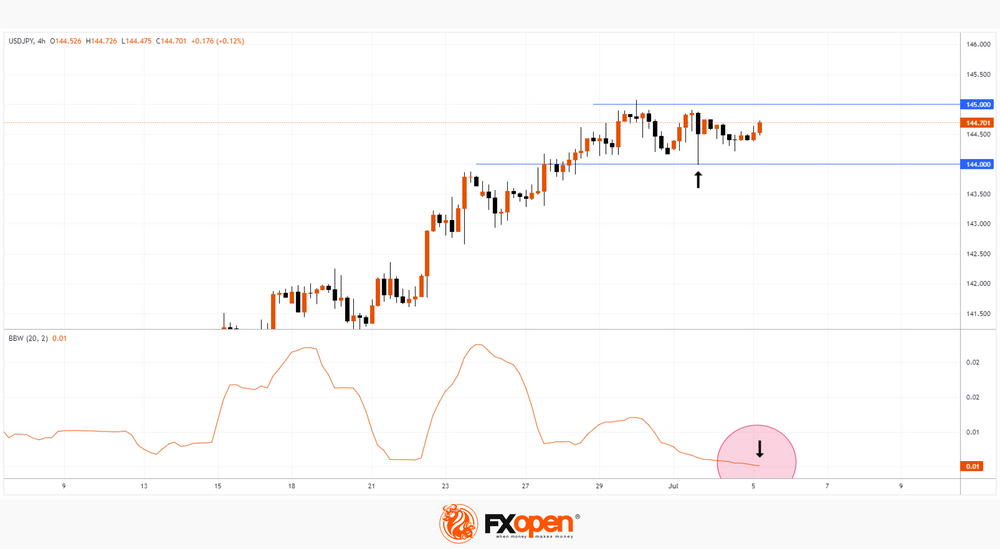
There is some lull (consolidation) in the USD/JPY market, which is evidenced by the width of the Bollinger bands, which dropped to the lows of the end of February on the 4-hour chart. Bank holidays in the US in connection with the celebration of Independence Day contributed to the decrease in volatility.
However, the calm could be replaced by a storm.
The USD/JPY chart shows that the bulls have tested the level of 144 and on the morning of July 5, the rate is gradually rising towards the level of 145 — technically this can be interpreted as a demand force for dollars.
Reuters reports the words of Shusuke Yamada, chief forex strategist at Bank of China, who believes that the market expects further weakening of the yen in the medium term. And this is important, because last fall, the level of 145 yen per US dollar was the trigger for intervention by the Bank of Japan.
Add here the news from the FOMC, which will be released today at 21:00 GMT+3, and you will get a set of drivers that can cause a surge in market volatility in July and an expansion of Bollinger bands.
EUR/USD: Euro Steady Above Daily Cloud Ahead of This Week’s Key Events
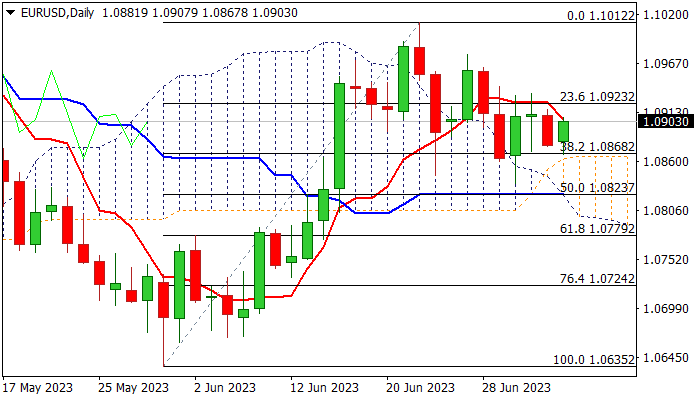
EURUSD is holding in a choppy and sideways mode for the fifth consecutive day, as traders look for fresh signals from this week’s key events – Fed minutes and the US June labor data.
Although the pair is moving within the range, near-term action is expected to remain bullishly aligned while staying above pivotal support at 1.0868 (cracked Fibo 38.2% of 1.0635/1.1012 / top of thickening daily cloud), but without clear direction as long as recent range tops at 1.0930 zone cap.
Daily studies lack direction signal as momentum is negative, MA’s are in mixed setup and RSI is turning up.
Markets await release of minutes of Fed’s last policy meeting (due later today) for more clues about the central bank’s monetary policy path and key event this week – US non-farm payrolls (June 225K f/c vs May 339K), which are expected to spark stronger volatility in the market.
Expect initial direction signals on breach of either pivotal level (1.0868 / 1.0930) which will look for verification on extension through next triggers (1.0823 at the downside or 1.0976 at the upside).
Res: 1.0930; 1.0976; 1.1000; 1.1012.
Sup: 1.0868; 1.0835; 1.0823; 1.0779.
Markets Slip Ahead of Fed Minutes, US NFP in Focus
Most Asian shares flashed red on Wednesday, with Chinese markets under renewed selling pressure after disappointing PMI data fuelled concerns over its weak economic recovery. European futures are pointing to a negative open despite stocks closing higher in the previous session, as investors turn cautious ahead of the release of Fed minutes later in the day.
In the currency arena, the dollar seems to be drawing support from the risk-off sentiment while the yen is hovering below the 145 level that triggered intervention by Japanese authorities last year. Oil prices have edged higher after gaining more than 2% on Tuesday. This came after Saudi Arabia, and more surprisingly Russia, announced a rollover and new supply cuts into August. Gold has enjoyed four consecutive days of mild gains with bugs eyeing up top tier US data in the days ahead.
Fed minutes and US NFP in focus
The second half of the trading week could be volatile for the US dollar thanks to the FOMC minutes this evening and the US jobs report on Friday. Investors will closely scrutinise these key risk events for clues on whether the Federal Reserve will hike rates more than once to tame still stubborn inflation.
Back in the June FOMC meeting, the Fed delivered a hawkish “skip” when it held rates steady after ten straight rate hikes but published its updated dot plot signalling two more rate rises in 2023. However, there has been conflicting economic data since the meeting with depressing manufacturing survey numbers and more resilient labour market numbers further supporting expectations around more rate hikes. Should the minutes strike a more dovish tone, this may weaken the dollar as expectations cool over the Fed pushing rates higher. However, if the minutes come across as more hawkish, the dollar could appreciate as bets rise over the Fed raising and keeping rates in restrictive territory for longer.
On Friday, the US nonfarm payrolls report could rock markets if it beats market expectations like we have witnessed in recent months. Markets expect the US economy to have created 225k jobs in June with the unemployment rate forecast to fall to 3.6% compared to the 3.7% seen in August. Ultimately, another jobs report that surpasses consensus may reinforce expectations around the Fed raising interest rates two more times this year. Alternatively, a weak report could fuel speculation around the Fed pausing hikes down the road.
Commodity spotlight – Gold
Gold remains on standby mode ahead of the Fed minutes this evening and Friday’s US nonfarm payrolls report, which could offer fresh clues on the central bank's policy path.
After shedding roughly 2.5% in the second quarter of 2023, the precious metal remains under pressure with the scales of power slowly swinging in favour of the bears. A hawkish set of Fed minutes and a robust US jobs report is likely to deal a heavy blow to the zero-yielding metal, sending prices back below $1900, with $1893 and $1858 acting as key levels of support. Should prices push back above $1932 with bulls gaining further support from a soft US jobs report, this could open the doors back toward $1959 and $1985, respectively.
Economic and Monetary Divergence Between China and Most of the Rest of the World
Markets
We’ll move quickly over yesterday’s uninspiring day which lacked guidance from the eco calendar as well as from the US (celebrating 4th of July). German yields fell up to 3.9 bps at the front while adding 5.3 bps at the longest tenor. After Monday’s sell-off, UK Gilts marginally outperformed Bunds from the 5y tenor on with yields easing 2.3-2.9 bps across the curve. European stocks traded with a soft downward bias. The EuroStoxx50 finished 0.16% in the red. The euro underperformed G10 peers on currency markets. EUR/USD moved from 1.0912 to 1.0879 even as the dollar himself wasn’t particularly strong. On the other side of the strength barometer we find the cyclicals, including the Kiwi and Aussie (swapping post RBA losses for gains) dollar and the Norwegian krone. If anything, rising oil prices helped these commodity currencies higher too. Brent added 2% yesterday, closing at $76.25/b.
It’s an awfully quiet session in the Asian-Pacific region too. A setback in the Chinese services PMI (Caixin) adds yet another layer of doubt to the country’s hoped-for economic rebound (see below). The yuan dips after the data was released with USD/CNY trading in the 7.233 area. The US dollar in general receives a better bid with EUR/USD moving further south to 1.0869. DXY rises marginally to 103.19. A fragile risk environment, in part triggered by the Chinese data, helps explain the USD performance. Equities mostly trade lower for the day. Chinese/Hong Kong markets unsurprisingly underperform. US Treasuries reopen with small gains.
Today’s economic calendar contains some interesting events, including the publication of the FOMC minutes from the June meeting. The central bank kept rates steady back then but penciled in two more hikes for later this year as it first wants to assess the impact of the previously delivered tightening and the regional bank implosion. We’re keen to know about any other compelling arguments why the Fed thought it had to pause instead of just moving ahead. The ECB publishes its Consumer Expectations Survey, polling on future inflation. The questionnaire does get market attention, as we saw last month. Inflation expectations eased significantly in the April edition (published June 6), especially in the one year ahead gauge (from 5% to 4.1%, lowest since Feb 2022). That briefly triggered a downleg in yields and the euro. We think markets may particularly respond to another (steep) decline. But the latter is not a given. The series is volatile and tends to be correlated somewhat to what consumers pay at the oil pump. That would at least help explain the uptick in March and consequent decline in April, when (international) oil prices dropped almost 20% in the data collection period. Prices in recent months however, traded a tight sideways pattern.
News and views
Greek PM Mitsotakis yesterday said that his country will before the end of the year actually repay part of its bailout loans 2 years ahead of schedule. The repayments will be made under the umbrella of the Greek Loan Facility. That’s the first rescue plan consisting of IMF loans (already repaid) and bilateral loans from EU countries consisting of €52.9bn (€8bn of which already repaid). The PM, who won a new 4-yr term in office last month, calls it a commitment to investors and aims to regain an investment grade credit rating by the end of the year. Greece is currently rated BB+ both at S&P (positive outlook) and Fitch (stable) and Ba3 (two notches lower) at Moody’s (positive). “Not only are we focused on growth, but we also want to make sure that our debt to GDP ratio continues to decline at a very rapid pace.” The Greek/German 10-yr yield spread narrowed this year from around 200 bps ahead of the election to 134 bps currently. The 2021 low stands at 98 bps.
The Chinese Economic Information Daily says in a report citing analysts that China will step up monetary policies to support the continued recovery of the economy in the second half of the year. Options include structural loan tools such as increasing the relending and rediscount quota to aid small businesses and agriculture, lowering the Loan Prime Rate and another rate cut. An economic and monetary divergence between China and most of the rest of the world, harmed the Chinese yuan this year. USD/CNY recently set a YTD top at 7.27, closing in on the 2022 top at 7.33 (weakest CNY level since 2007). The June Caixin services PMI this morning fell from 57.1 to 53.9 (vs 56.2 expected) suggesting that post-Covid recovery momentum is waning.
Focus on FOMC Minutes
European markets were mostly flat; the Stoxx600 remained close to its 50-DMA, while the FTSE 100 remained offered near its 200-DMA, near the 7544 level. The FTSE has been one of the biggest laggards of the year, as capital flew into the tech stocks. The slow Chinese reopening and the crumbling commodity prices didn’t help FTSE extend the last year’s outperformance to this year. Happily, more rate hikes from the Bank of England (BoE) and the darkening economic and political picture for the UK is not a cause for concern for the British blue-chip index. A major part of their revenue comes from outside the UK. Therefore, a rotation from tech to value could throw a floor under the FTSE100’s selloff near the 7300 level if of course we don’t see a global selloff due to recession and hawkish central banks-
OPEC meets industry heads
The barrel of oil remains sold near the 50-DMA as OPEC meeting with industry heads is due today. Everything that involves OPEC is an upside risk to oil prices. Yet any OPEC-related rally will attract top sellers and won’t let OPEC reach stability around $80pb level. The major medium-term risk is that the unresponsive price action could hide a worsening global glut that could hit suddenly in the H2, and send oil prices higher. Until then, bears will keep selling.
Fed releases minutes
The Federal Reserve (Fed) will release the minutes of its latest policy meeting today, and there will clearly be a couple of hawkish sentences that will hit the headlines, given that the Fed officials paused their rate hikes in their June meeting, but their dot plot showed two more interest rate hikes before a real and a longer pause.
At this point, the Fed expectations went so hawkish that there is a growing chance of correction. Fed funds futures gives near 90% chance for a another 25bp hike in July, and another 25bp after that is more likely than not. No one expects or is positioned for a rate cut from the Fed this year. Unless there is another baking stress or chaos in the housing market, nothing could stop the Fed from pursuing its battle against inflation. And interestingly, Bloomberg research found out that interest rate increases in the US are benefitting savers more than they are costing mortgage payers, because many mortgages are on fixed rates for 30-years and they have yet to expire.
Housing cracks
Note that that’s not the case elsewhere. The UK, Hong Kong and Commonwealth countries including Canada, Australia and New Zealand are the most vulnerable to the cracks in the housing market because the share of houses bought on mortgages on shorter-term fixed rates or variable rates are higher. In New Zealand, for example, house prices fell the most in 8 months in June and are down by more than 10% since a year earlier.
Interestingly, the US dollar index remains broadly unresponsive to the Fed’s hawkishness, but against the greenback could perform better against the Aussie, Kiwi, sterling, and the Loonie in the second half, because the central banks of all the cited countries will have to sit down and think of broader economic implications of a full-blast housing crisis. History shows that, going back to the 1990s’ Japan, where the Bank of Japan (BoJ) raised rates to halt the housing bubble, and which then triggered a real estate crisis, the implications were a long and dark tunnel of asset devaluation, reduced consumer spending, bankruptcies, a weakened banking sector, deflation, and long-term economic stagnation. That’s certainly why Japan prefers letting inflation run hot, rather than hiking the rates and send the country to another, and a very sticky deflationary phase.
USD/JPY capped near 145
And speaking of Japan, the rally in dollar-yen remains capped at 145 level. The only direction that the BoJ could take from here is the hawkish path, therefore turning long yen will, at some point, become a star trade. Yet getting the timing right is crucial and it all depends on a greenlight from the BoJ.
Subdued Trading Continues as Dollar Range Bound, Gold Extending Recovery
Commodity currencies are maintaining their position as the stronger performers of the week, while overall trading continues in a noticeably subdued manner. Both Dollar and Yen are seen navigating within familiar ranges against their European counterparts. Market volatility might experience a slight uptick as US traders return from holiday break today. While FOMC minutes are expected to garner attention, traders will likely hold off on any major bets until Friday's non-farm payroll data release.
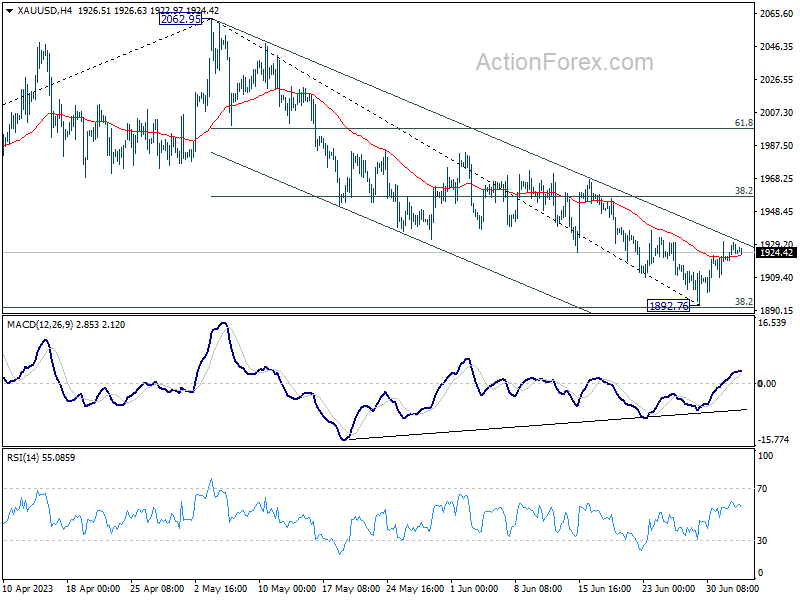
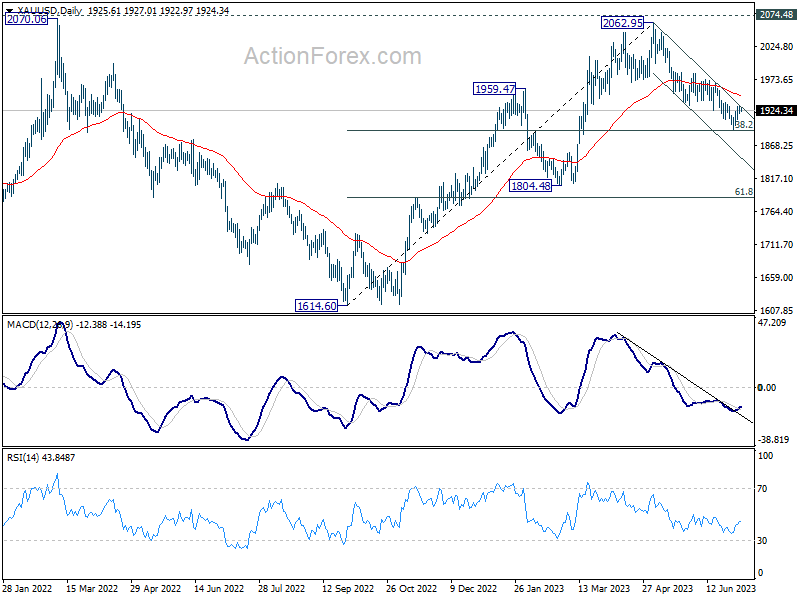
Technically, Gold continues to warrant some attention as the rebound from 1892.76 support is trying to extend. Decisive break of near term channel resistance (now at 1931) will be another sign of bottoming, along with bullish convergence condition in 4H MACD. That came after just missing 38.2% retracement of 1614.60 to 2062.95 at 1891.68. In this case, stronger rally should be seen towards 55D EMA (now at 1947) and above. If realized, that would likely be accompanied by renewed weakness in Dollar.
In Asia, at the time of writing, Nikkei is down -0.25%. Hong Kong HSI is down -1.46%. China Shanghai SSE is down -0.51%. Singapore Strait Times is down -0.54%. Japan 10-year JGB yield is up 0.0187 at 0.394.
China Caixin PMI services fell to 53.9, recovery losing steam
China's Caixin Services PMI for June plunged to 53.9, down from 57.1 in the previous month and significantly below the expectation of 56.2. The composite PMI also tumbled from 55.6 to a discouraging 52.5, marking the lowest readings since the growth cycle kick-started in January.
Wang Zhe, a senior economist at the Caixin Insight Group, commented on the less-than-promising data: "A slew of recent economic data suggests that China's recovery has yet to find a stable footing, with prominent issues including a lack of internal growth drivers, weak demand, and dimming prospects persisting."
Zhe emphasized the disparity between the manufacturing and services sectors, noting that "In June, Caixin China PMIs showed that conditions in the manufacturing sector lagged far behind services. Employment contracted, deflationary pressure mounted, and optimism waned in the manufacturing sector."
Despite the ongoing post-Covid rebound of the services sector, Zhe expressed concerns about the sustainability of the recovery, adding that "the services sector continued a post-Covid rebound, but the recovery was losing steam."
WTI oil hovers in range on divided interpretation of output cut
Despite an early-week upswing, oil prices have struggled to extend gains and remain bounded within a familiar range. Saudi Arabia announced extension of its voluntary output cut. Russia and Algeria offered to trim their August output and exports. But these decisions are more seen as a sign affirming a waning optimism in demand growth.
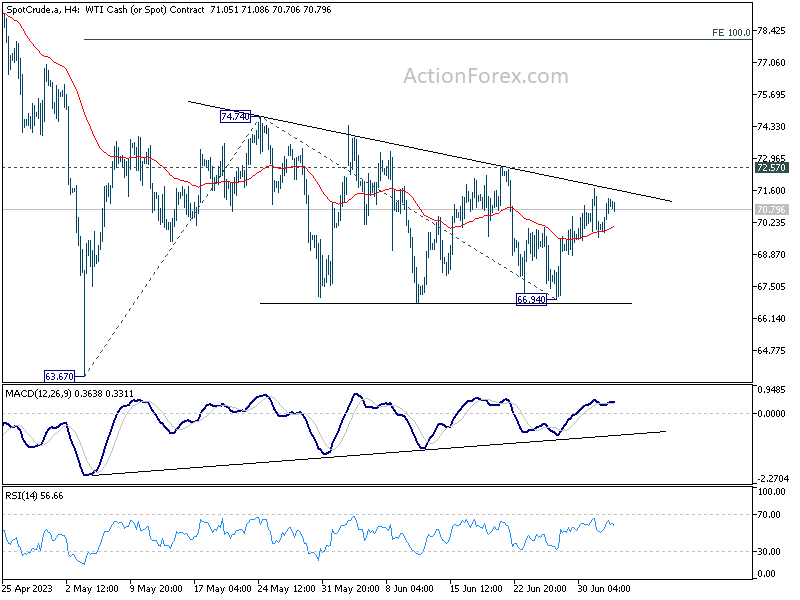
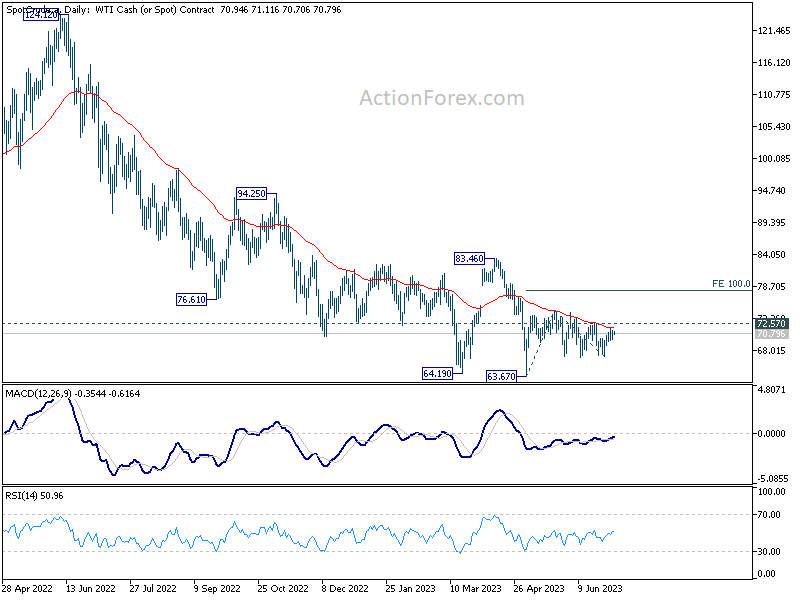
Technically, outlook in WTI crude oil is rather mixed for now. Repeated rejection by 55 D EMA is retaining bearishness. Yet there is no clear sign of extended selling.
Indeed, recent price actions could be interpreted as a triangle pattern that started in 74.74. If that's true, there is prospect of another bounce to resume the rebound from 63.67. Break of 72.57 resistance will solidify this case and push WTI through 74.74 resistance. Yet, upside would likely be capped by 100% projection of 63.67 to 74.74 from 66.94 at 78.01.
On the other hand, break of 66.94 support could prompt deeper selloff back to retest 63.67 low.
Looking ahead
France industrial production, Eurozone PMI services final and PPI, UK PMI services are the main features in European session. US will release factory orders and FOMC minutes.
EUR/USD Daily Outlook
Daily Pivots: (S1) 1.0863; (P) 1.0893; (R1) 1.0908; More...
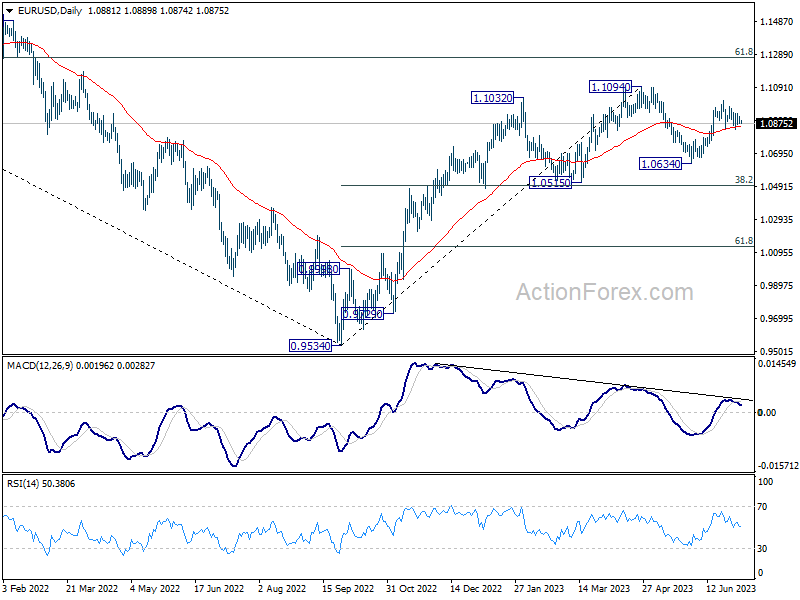
Intraday bias in EUR/USD remains neutral and further rally is still in favor with 55 D EMA (now at 1.0854) intact. On the upside, break of 1.1011 will resume the rise from 1.0634 and target 1.1094 resistance. Decisive break there will resume larger up trend from 0.9534 to 1.1273 fibonacci level. However, firm break of 1.0834 will turn bias to the downside for 1.0634 support instead.
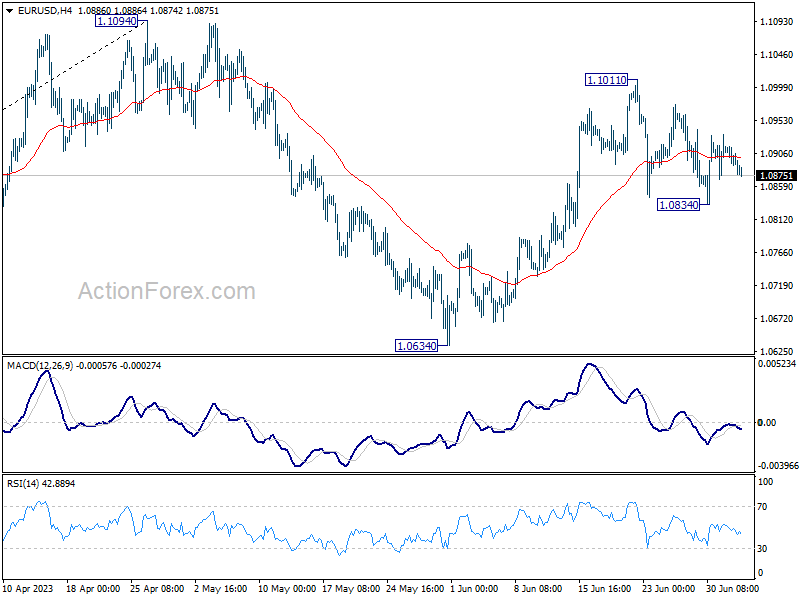
In the bigger picture, as long as 1.0515 support holds, rise from 0.9534 (2022 low) would still extend higher. Sustained break of 61.8% retracement of 1.2348 (2021 high) to 0.9534 at 1.1273 will solidify the case of bullish trend reversal and target 1.2348 resistance next (2021 high).
Economic Indicators Update
| GMT | Ccy | Events | Actual | Forecast | Previous | Revised |
|---|---|---|---|---|---|---|
| 01:45 | CNY | Caixin Services PMI Jun | 53.9 | 56.2 | 57.1 | |
| 06:45 | EUR | France Industrial Output M/M May | -0.20% | 0.80% | ||
| 07:45 | EUR | Italy Services PMI Jun | 53 | 54 | ||
| 07:50 | EUR | France Services PMI Jun F | 48 | 48 | ||
| 07:55 | EUR | Germany Services PMI Jun F | 54.1 | 54.1 | ||
| 08:00 | EUR | Eurozone Services PMI Jun F | 52.4 | 52.4 | ||
| 08:30 | GBP | Services PMI Jun F | 53.7 | 53.7 | ||
| 09:00 | EUR | Eurozone PPI M/M May | -3.90% | -3.20% | ||
| 09:00 | EUR | Eurozone PPI Y/Y May | 6.10% | 1.00% | ||
| 14:00 | USD | Factory Orders M/M May | 0.60% | 0.40% | ||
| 18:00 | USD | FOMC Minutes |