Sample Category Title
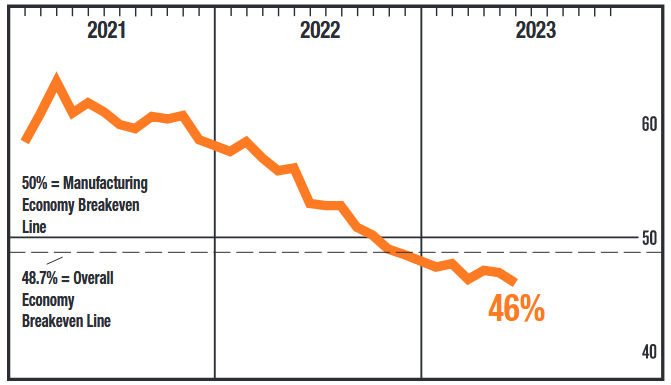
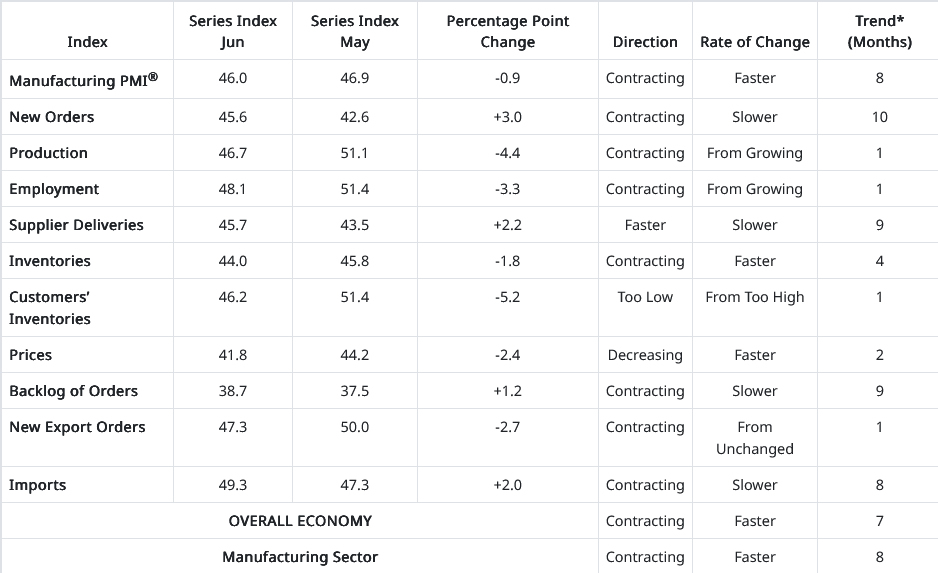
US ISM manufacturing fell to 46, all sub indexes below 50
US ISM Manufacturing PMI fell from 46.9 to 46.0 in June, below expectation of 47.2. Looking at some details, production fell from 51.1 to 46.7. Employment fell from 51.4 to 48.1. Prices fell from 44.2 to -2.4. New orders rose from 42.6 to 45.6, but stay below 50.
The headline reading indicates that the manufacturing sector is in the eighth month of contraction. None of the 10 subindexes were above 50 percent for the period. "The past relationship between the Manufacturing PMI and the overall economy indicates that the June reading (46 percent) corresponds to a change of minus-1 percent in real gross domestic product (GDP) on an annualized basis," ISM said.
Sunset Market Commentary
Markets
Core bonds rapidly forgot about last Friday’s rebound on the back of a tough trading week. They turned into sell-off mode was once more with the move ignited by UK Gilts following the monthly consumer survey by US bank Citi and polling firm YouGov. It showed that public expectations for 1y ahead inflation increased from 4.7% in May to 5% in June. It triggered a further repricing of BoE rate hikes bets with a 6.25% policy rate peak (compared to 5% currently) now fully discounted by the end of the year. It’s almost a done deal (from a market point of view) that we’ll see back-to-back 50 bps rate hikes at the early August meeting. Long term inflation expectations (5y to 10y) decreased for a fourth consecutive month from 3.5% to 3.3%, the joint-lowest since April 2021 but still far above the UK central bank’s 2% inflation target. UK gilt yields add 11 bps (2-yr) to 1 bp (30-yr) in a daily perspective, further inverting the curve. The UK 2-yr yield sets a new 15-yr high at 5.4% with the UK 10-yr yield (4.43%) approaching the 4.5% resistance area (2022 & 2023 tops). Sterling can’t profit from the interest rate support with EUR/GBP holding steady around 0.86. The UK Gilt sell-off spilled to German Bunds and a lesser extent to US Treasuries. German yields gain 2.5 bps (30-yr) to 7.1 bps (5-y). The EU 2-y swap rate tests last year’s cycle high at 3.96%. US yields increase by up to 2.5 bps at the front end of the curve with two factors holding back a stronger reaction. First thin volumes with the first Monday of summer holiday’s packed between a weekend and a closing day (Independence Day). Second, the release of today’s only meaningful figure (US manufacturing ISM) still ahead of us. EUR/USD flipflopped around the 1.09 big figure. On other markets, we retain a spike in oil prices. Brent crude rises from $75/b to $76.5/b after a statement published by the state-run Saudi Press Agency. It said that the Kingdom will prolong its unilateral oil production cut (1mn barrel/day in place since this month on top of OPEC+ deal) by at least one month, keeping a lid on supply when global demand risks faltering. Russian deputy PM Novak later said that his country will reduce production (and exports) by 500k barrels/day. European stock markets started on a solid footing, copying Friday’s action in the US, but are slipping towards Friday’s closing levels as US dealings are about to start. The EuroStoxx 50 did another failed attempt to take out key resistance at 4400 (2021/2022/2023 top).
News & Views
Swiss inflation slowed slightly more than expected in July, easing from 0.3% M/M and 2.2% Y/Y in May to 0.1% M/M and 1.7% Y/Y in June. Core CPI also dropped further below the 2% barrier, slowing down from 1.9% Y/Y to 1.8%. Prices of food and non-alcoholic beverages rose by 0.9% M/M. Costs for leisure (0.4%) and hotels & restaurants (0.6%) also increased. Prices for several other categories including transport (-0.4% M/M), clothing and shoes (-1.7%), communication and household goods (both -0.2%) showed further easing in the inflationary dynamics. Prices of goods flatlined (0.0%). Services inflation slowed to 0.1% in June. In its June 2023 forecasts, the Swiss national bank downgraded its forecast for Q3 and Q4 2023 inflation to 1.7% and 2% respectively mainly due to lower energy prices and the strong Swiss franc tempering inflationary pressures. However, SNB upwardly revised its 2024 forecast on the risk of second round effects, higher electricity and rent prices and more persistent inflation from aboard. Today’s inflation still can be considered in line with the SNB forecast and keeps the door open for an additional SNB rate hike at the September meeting. The Swiss franc declined after the release of the inflation data, with EUR/CHF currently testing the 0.98 barrier, compared to 0.9765 at the start of trading this morning.
Minutes of the June 22 policy meeting by the Turkish central bank (CBRT) indicated that monetary policy tightening is expected to continue. Recent indicators point to an increase in the underlying inflation trend. Strong domestic demand, cost pressures and the stickiness of services inflation have been the main drivers. The Committee also anticipates that the deterioration in pricing behavior will put further pressure on inflation. Monetary tightening will be further strengthened as much as needed in a timely and gradual manner until a significant improvement in the inflation outlook is achieved. The CBRT previously raised its policy rate from 8.5% to 15%. The Turkish lira is holding near recent lows against the euro (EUR/TRY 28.43) and the dollar (USD/TRY 26.07).
Bundesbank Nagel: ECB still has a way to go with tightening
Bundesbank President Joachim Nagel acknowledged the rising doubt and escalating criticism around the necessity for more rate hikes. Yet, he insisted on the need for further tightening. He attributed his stance to the robust health of the labor market and the positive growth in the economy.
"We still have a way to go," Nagel stated, referring to the ECB's inflation-fighting measures. "Monetary policy signals are clearly pointing in the direction of more tightening".
Furthermore, Nagel voiced his advocacy for the significant reduction of the Eurosystem's balance sheet in the forthcoming years, following its expansion due to massive bond purchases and bank loans.
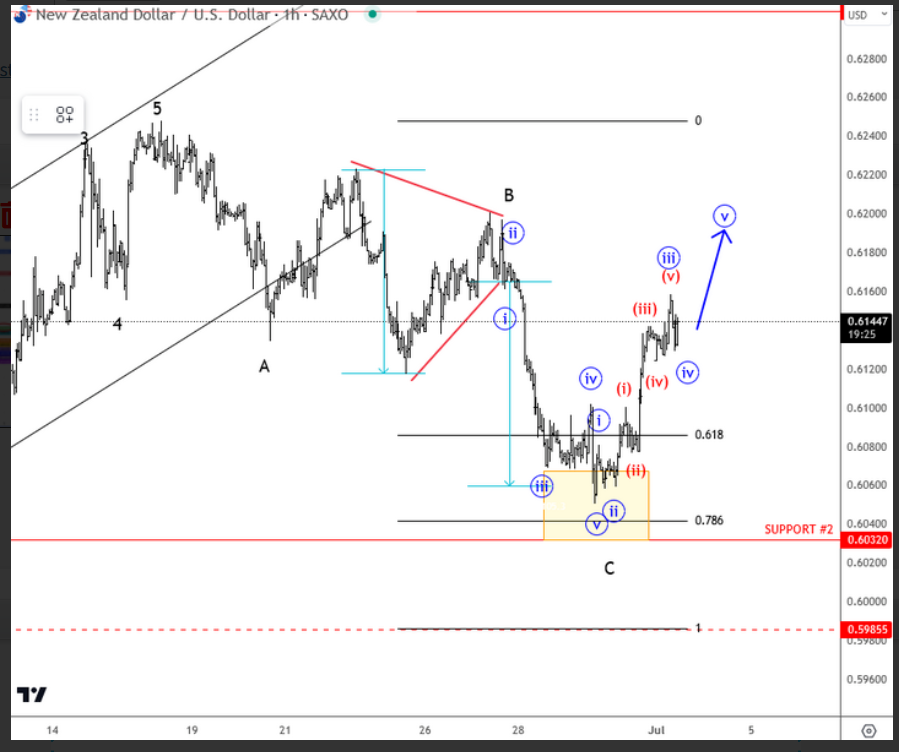
Kiwi Waking Up, Pointing Towards 0.6250
Stocks did well last week, when they closed at the highs, despite hawkish Powell, which can be one of the reasons why maybe USD did not sell off that much. However, there was a nice turn down on Friday of the US currency, when other majors rallied. Kiwi appears to be on the top of xxx/USD list, so if stocks will continue to rise then I think that NZDUSD will continue to do well. In fact, pair has some nice ongoing impulse away from 0.6050/40 key support area. I am long NZDUSD still, and will update it when needed.
Canadian Dollar Drifting, ISM Manufacturing PMI Next
- Canada’s GDP surprises to the upside
- US PCE Price Index eases in June
- ISM Manufacturing PMI expected to contract
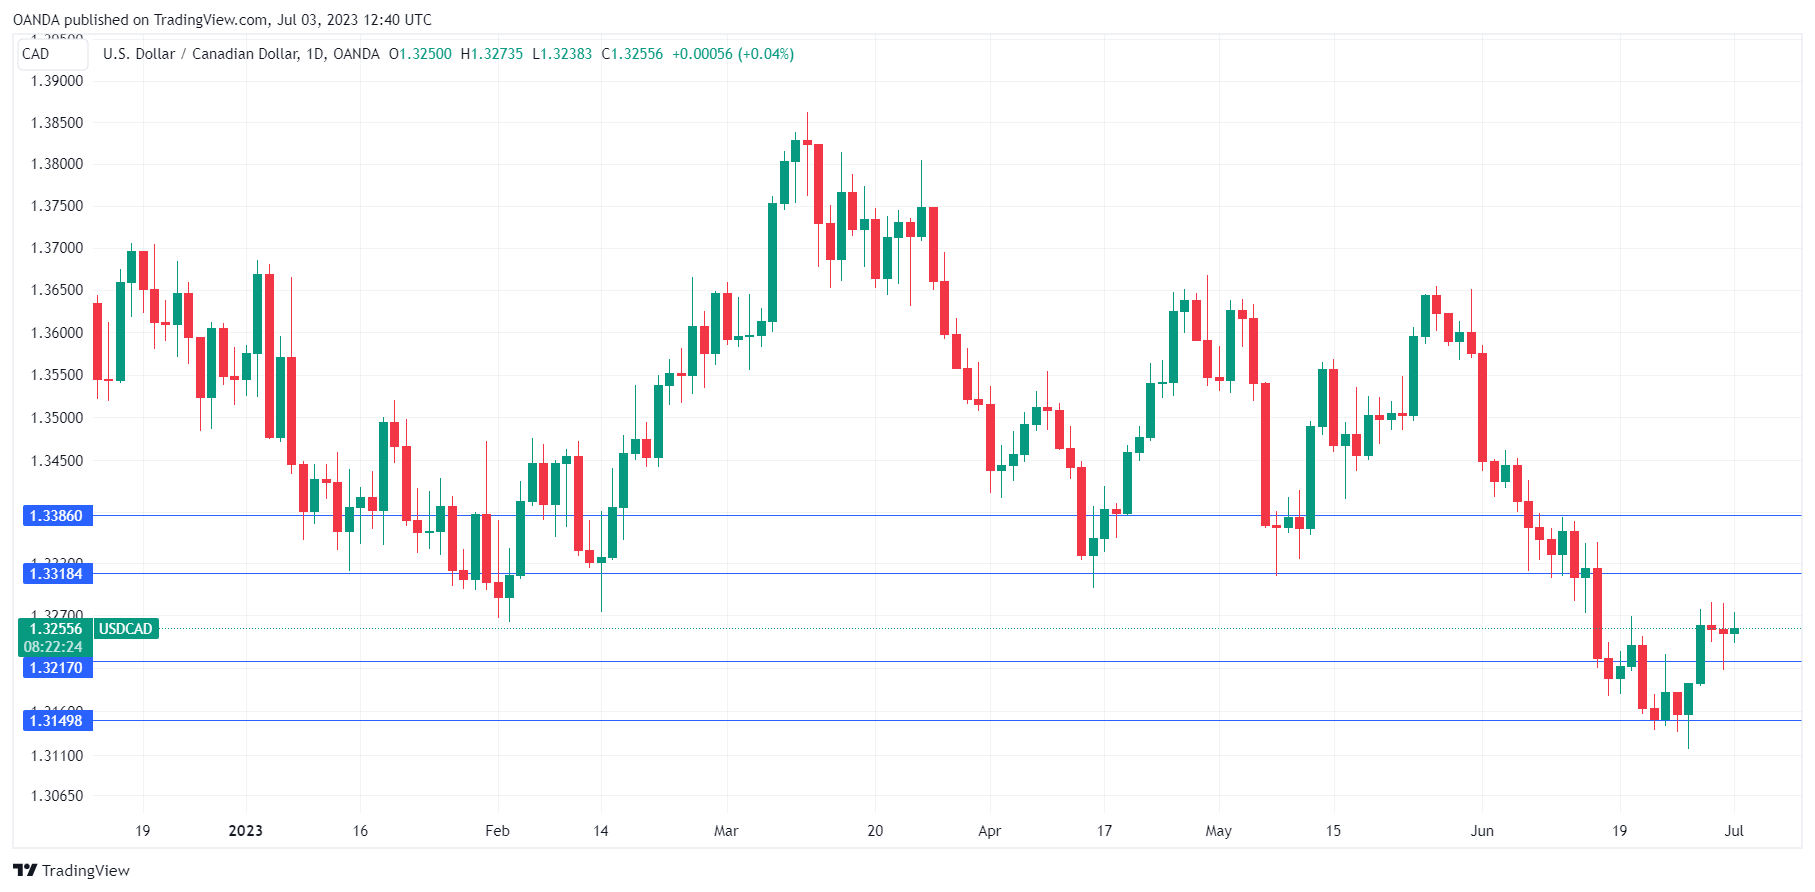
The Canadian dollar is trading at 1.3259, up 0.07%. Canadian markets are closed for a holiday and I expect USD/CAD movement to be limited. On the economic front, the US releases ISM Manufacturing PMI. The index is projected to tick lower to 46.9 in June, down from 47.0 in May.
Canada’s GDP climbs in May
Canada wrapped up the week with a strong GDP report. The economy is estimated to have gained 0.4% in May, after flatlining in April. The Canadian economy continues to surprise with its resilience despite rising interest rates.
The Bank of Canada raised rates to 4.75% earlier this month after a five-month pause, arguing that monetary policy was not restrictive enough. The BoC statement pointed at strong consumer spending and higher-than-expected growth as factors in the decision to raise rates. The BoC also expressed concerns that inflation could remain entrenched above the 2% target.
The strong GDP report has added fuel to speculation that the BoC will raise rates again on July 12th but there is also concern that higher rates will lead to a recession. Canadian 10-year bonds have fallen further below the 2-year bonds, as the yield curve inversion, a predictor of recession, has become even more pronounced.
Inflation has been falling and headline inflation eased to 3.4% in May, down from 4.4% in April. Core inflation also declined to 3.8%, down from 4.2%. The question remains whether inflation, still well above the 2% target, is falling fast enough to prevent another rate hike in July.
In the US, there were more signs that inflation is weakening. On Friday, the PCE Price Index, which is the Fed’s favourite inflation gauge, declined from 0.4% to 0.1% in June. As well, UoM Inflation Expectations dropped to 3.3% in June, down from 4.2% in May and the lowest since March 2021. Despite these signals that inflation is decelerating, the Fed is widely expected to raise rates at the July meeting.
USD/CAD Technical
- USD/CAD is putting pressure on resistance at 1.3254. Next, there is resistance at 1.3328
- 1.3175 and 1.3066 are providing support
Gold Attempts to Re-enter Range after Bearish Breakout
Gold had been stuck within a sideways pattern for more than a month, but the bears managed to push the price below the lower boundary of that range. However, gold quickly found its feet and retraced higher, hinting that the decline could prove to be a false breakout.
Despite the latest bounce, the short-term oscillators are not providing positive signs for buyers. The RSI has flatlined way beneath its 50-neutral mark, while the MACD remains below both zero and its red signal line.
Should the bearish near-term structure extend, the price could initially challenge the recent three-month low of 1,893. Sliding beneath that floor, bullion might retreat towards the March resistance of 1,857, which overlaps with the 200-day simple moving average (SMA). A violation of that zone could pave the way for the 2023 bottom of 1,804.
Alternatively, if the price edges higher, the lower end of the rangebound pattern at 1,925 could curb any upside attempts. Conquering this barricade, the bulls could try to pierce through the restrictive trendline that connects the price’s recent highs before they attack the upper boundary of the tight range at 1,985. Further advances may then cease at the crucial 2,000 psychological mark.
Overall, gold seems ready to retest the lower boundary of the rectangle pattern after it managed to halt its decline. A failure to jump above that territory could trigger a significant retreat.

AUD/USD Pares Losses ahead of RBA Rate Decision
- Money markets split on RBA decision on Tuesday
- US PCE Price Index eases in May
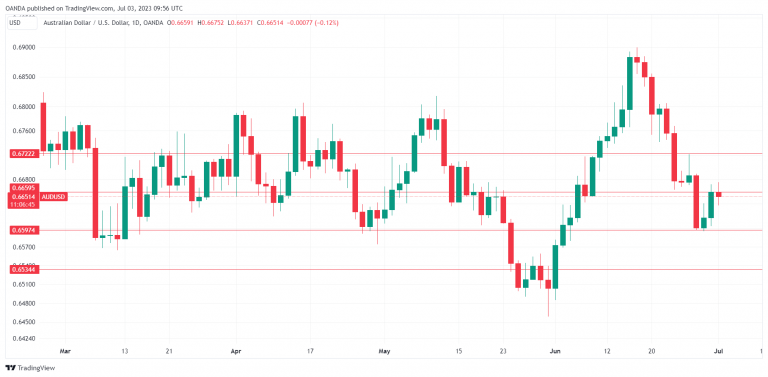
The Australian dollar is showing some movement right off the bat on Monday. AUD/USD fell as much as 70 pips in the Asian session but has recovered most of those losses. In the European session, AUD/USD is trading at 0.6657 down 0.03%.
Money markets split on RBA decision
The Reserve Bank of Australia meets on Tuesday, and it’s a coin-toss as to whether the central bank will raise rates for a third straight time or will it take a pause. Traders have priced in a 52% chance of a pause, according to the ASX RBA rate tracker. Just one week ago, the odds of a pause were 70%, after May inflation declined more than expected. Headline CPI fell from 6.8% to 5.6%, its lowest level in 13 months. Core CPI eased to 6.1%, down from 6.7%.
The split over what call the RBA will make on Tuesday is indicative of the case that can be made both for a hike and a pause. The drop in inflation is certainly welcome news, but the RBA wants inflation to fall faster, as it remains almost triple the target of 2%. Additional rate hikes would likely send inflation lower, but that would raise the risk of the economy tipping into a recession.
The Australian economy has cooled down, but the labor market remains strong and consumer spending has been resilient, despite high inflation. Retail sales for May jumped 0.7% m/m, up from 0.0% in April and smashing the consensus of 0.1%. RBA members in favor of a hike can point to employment and retail sales data as evidence that the economy can withstand additional hikes.
The RBA minutes, which can be considered a guide of its rate policy plans, might point to a pause at Tuesday’s meeting. The April and May minutes were hawkish and the RBA raised rates after these releases. The June minutes were more dovish, sending the Australian dollar lower. Could that signal a pause?
In the US, the week wrapped up with the PCE Price Index, the Fed’s preferred inflation indicator. In June, the index rose 0.1% m/m, down from 0.4% in May. This indicates that the disinflation process continues and traders have raised the probability of a July hike to 88%, up from 74% a week ago, according to the CME FedWatch tool.
AUD/USD Technical
- 0.6659 is a weak resistance line. Above, there is resistance at 0.6722
- 0.6597 and 0.6534 are providing support
USD/CHF: Swiss Franc Falls on Lower than Expected June Inflation in Switzerland
USDCHF jumped in European trading on Monday, as inflation in Switzerland fell significantly in June, increasing pressure on franc.
Swiss CPI dropped to 1.7% from 2.2% in May and below 1.8% forecast, returning to the SNB’s 0%-2% target zone for the first time since January 2022.
Lower inflation made the Swiss franc less attractive, although markets still expect the central bank to raise interest rates at least one more time, despite favorable June CPI numbers.
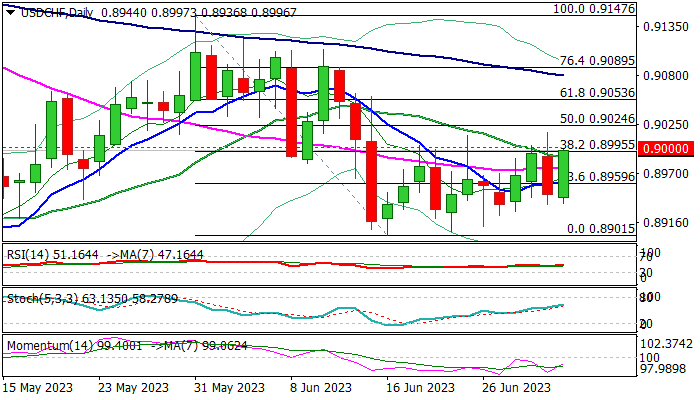
Fresh post-data advance is pressuring pivotal 0.90 resistance zone (psychological / Fibo 38.2% of 0.9147/0.8901) which also marks the ceiling of the range of past three weeks, break of which would generate strong bullish signal on completion of a higher base at 0.8900 zone (June 16-22).
Technical studies on daily chart are improving, but 14-d momentum is still in negative territory, suggesting that the downside will remain vulnerable if 0.90 zone resists another attack.
Rising 10DMA (0.8961) offers solid support, which should keep the downside protected to maintain fresh bullish bias.
Res: 0.9016; 0.9053; 0.9080; 0.9110.
Sup: 0.8961; 0.8936; 0.8923; 0.8901.
Gold Price Technical Analysis
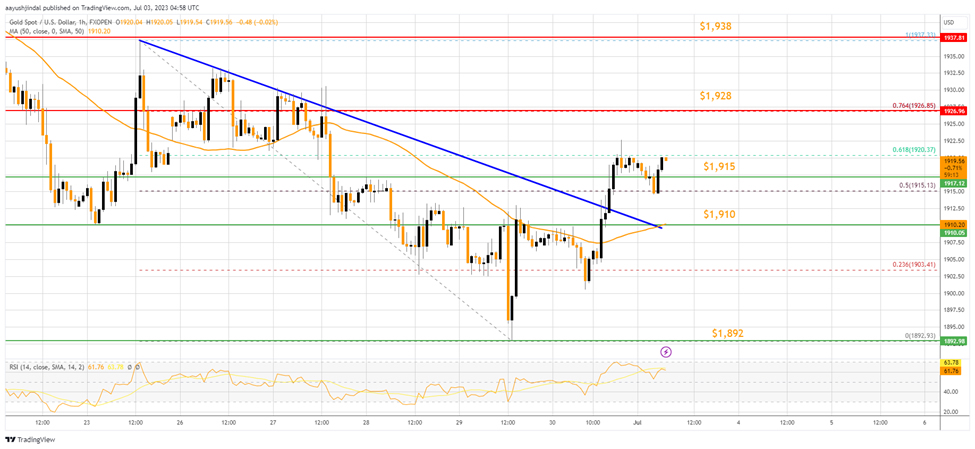
On the hourly chart of Gold on FXOpen, the price started a decent increase from the $1,892 zone against the US Dollar. The price climbed above the $1,910 resistance and the 50-hour simple moving average.
There was a move above a connecting bearish trend line at $1,912. On the upside, the price seems to be facing resistance near $1,928. The next major resistance is near the $1,938 level and the last swing high.
A clear move above the $1,938 resistance could send the price toward the $1,955 resistance. Any more gains might send the price toward $1,965.
On the downside, immediate support is near the $1,915 level. The next major support is near the $1,910 level, below which the price might drop toward the $1,892 support. Any more losses may perhaps set the tone for a test of the $1,880 zone.
GBP/JPY Daily Outlook
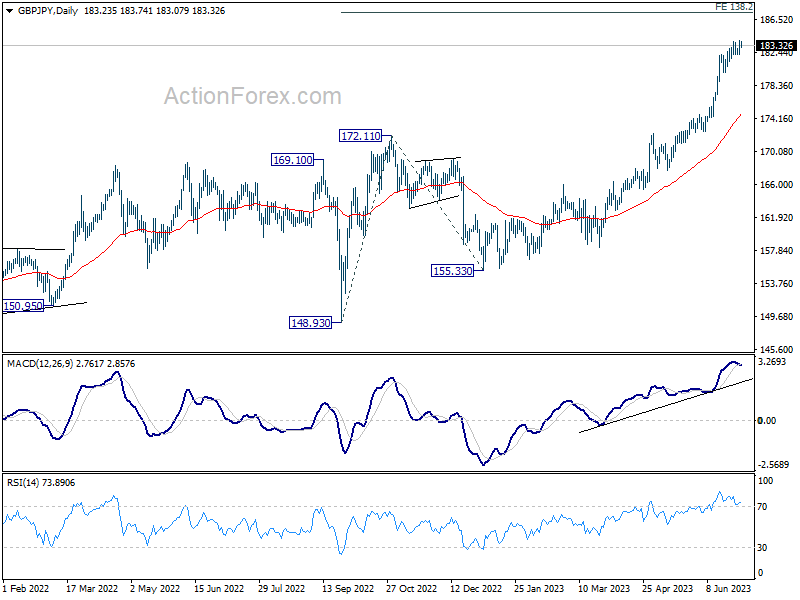
Daily Pivots: (S1) 182.36; (P) 183.12; (R1) 184.03; More...
Intraday bias in GBP/JPY stays mildly on the upside at this point. Current up trend should target 138.2% projection of 148.93 to 172.11 from 155.33 at 187.36. On the downside, break of 182.12 minor support will turn bias back to the downside for deeper pull back first.
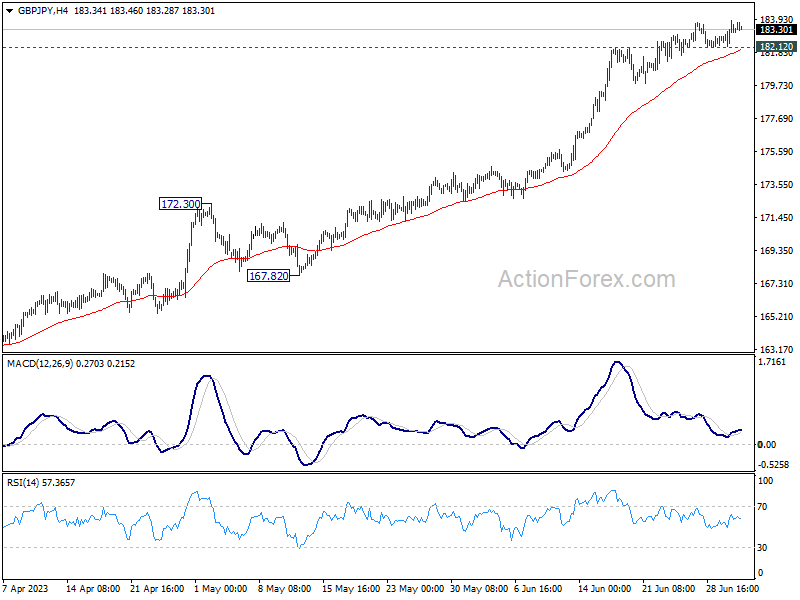
In the bigger picture, up trend from 123.94 (2020 low) is extending. Next target is 195.86 (2015 high). For now, medium term outlook will remain bullish as long as 172.11 resistance turned support holds, even in case of deep pull back.