Sample Category Title
What a Half Year
The first half of the year ends on a positive note for equities and not so much for the bonds. This is the exact opposite of what was predicted. The bond markets were supposed to recover due to economic pains which should have led to a more dovish central bank landscape, while equities should have suffered due to the economic woes, slowing spending and recession. But no. Equities did well. Even though profits fell, they fell less than expected and more importantly, AI saved the day sending the Big Tech stocks to a nice bull market. Bonds on the other hand tumbled as US spending and growth remained resilient. The latter convinced the Federal Reserve (Fed) that it should keep hiking the interest rates. The spread between the US 2 and 10-year yield hit nearly 110bp, as an indication of recession in the coming months.
But last week’s strong economic data released in the US, combined with Friday’s softer-than-expected PCE figures supported, yet again, the idea of a soft landing and further fueled the rally in stocks. As such, the S&P500 hit a fresh year high at the last trading day of the first half and gained more than 17% so far this year, while Nasdaq 100 soared more than 40%! Apple hit $194 per share, and closed last week with a valuation above $3 trillion.
Of course, this incredible performance makes many investors wonder whether the equit rally could continue in the second half.
On the data dock
The Reserve Bank of Australia (RBA) is expected to keep its rate unchanged at this week’s policy meeting, after being partly responsible of the latest hawkish spree in global central bank expectations when it raised rates unexpectedly the last time. A no action from the RBA could calm down the nerves this week. But for that, we must also see loosening in US jobs data. Due Friday, the US NFP is expected to print more than 220K nonfarm job additions in June, with steady wage growth of around 0.3% over the month. The best scenario for stock investors is a strong NFP read combined with softening wages growth.
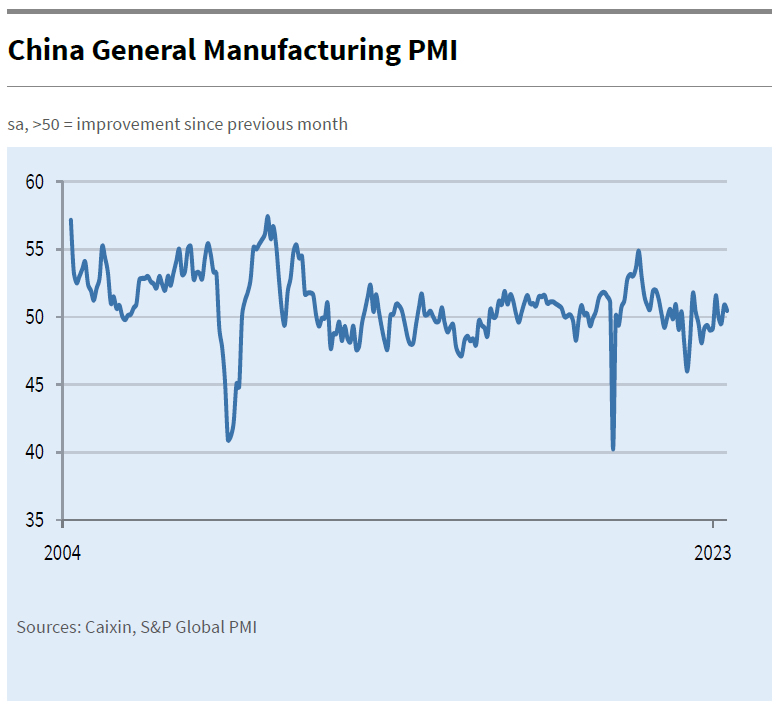
In China, Caixin manufacturing index for China came in slightly better than expected, and slightly above the 50 threshold, though sentiment weakened to an 8 month low and new orders rose at a softer pace. China could recover in the H2 amid People’s Bank of China’s (PBoC) efforts to boost growth, but we won’t get the growth bang that we were looking for. That means that we will probably bypass a dangerous long-lasting rally in energy and commodity prices, which could help central banks contain inflationary pressures with more success.
For now, oil prices remain mostly ranged despite OPEC’s malicious efforts to boost them artificially. The barrel of crude jumped past the $70 level on the back of a broad-based risk rally following the US softer than expected PCE read, which fueled some dovish central bank expectations. The Chinese data also give some support this morning, but the 50-DMA, near $71.30pb will likely act as a solid resistance. This week, risks remain tilted to the upside, as OPEC meets with the industry heads. This week’s meeting is not a policy meeting so there won’t be any production cuts, or any important decision from OPEC, but what we could well hear slowing demand forecasts, which would then bring traders to assess another production cut from OPEC down the road. In all cases, we have seen clearly that cutting production hasn’t been enough for a sustained price rally so far. Therefore, any rally triggered by comments could be interesting top selling opportunities for short-term traders.
Tesla delivered a record number of cars worldwide in Q2, something like 466K cars, as Elon Musk is up to aggressively cutting prices to boost volume. It looks like it is paying off. The latest figures will likely keep Tesla shares on a positive path to challenge the $280 level again. But competition is not far. The Chinese BYD did better than Tesla, selling more than 700K cars last quarter, its best-ever quarter as well. BYD shares jumped 2.70% in Hong Kong.
Technical Outlook and Review
DXY:
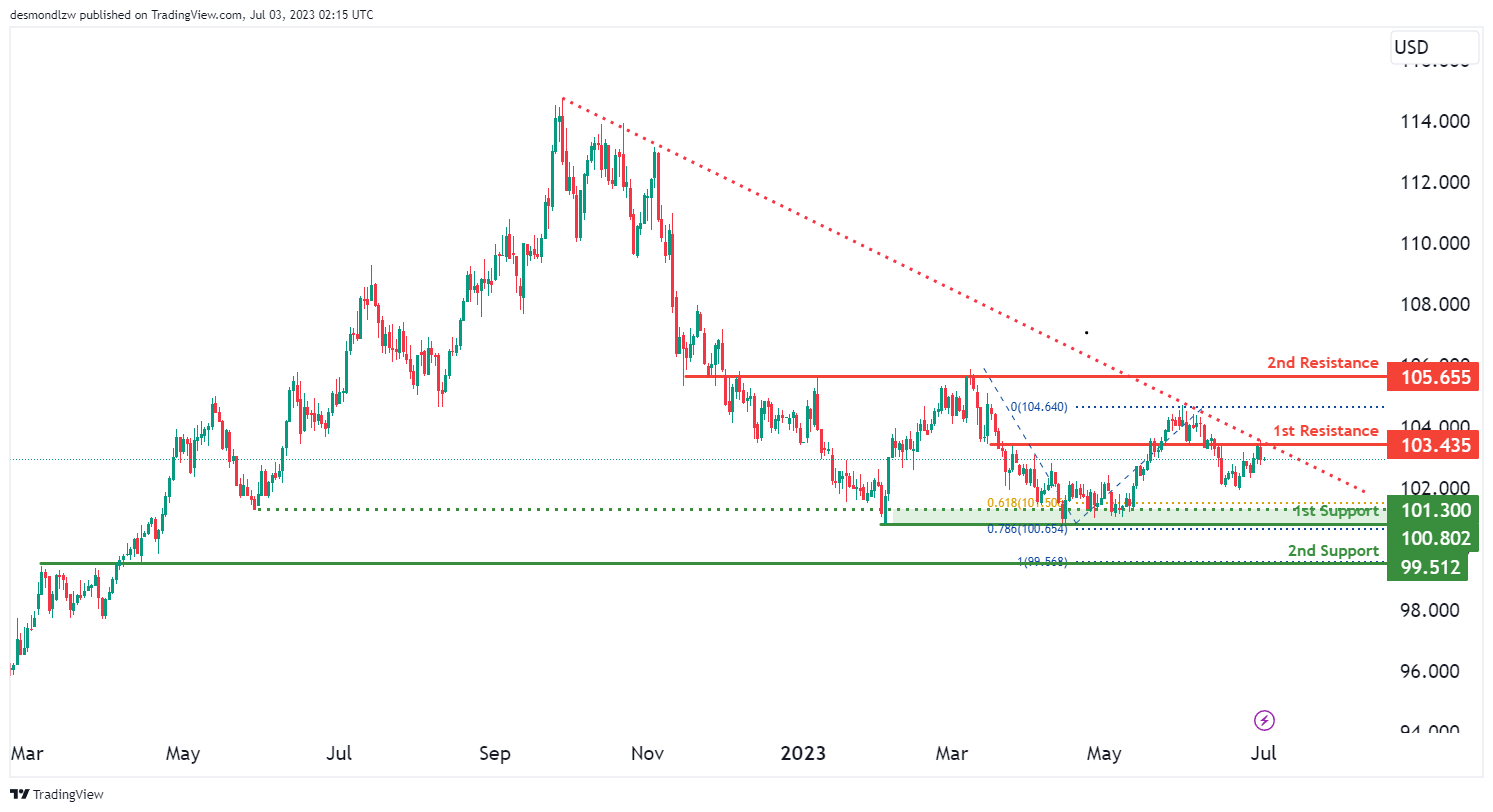
The DXY (US Dollar Index) chart exhibits a bearish momentum, indicated by the price being below a major descending trend line, suggesting the potential for further downward movement. The price is currently testing this descending trend line, which acts as a resistance.
There is a possibility for a bearish reaction off the 1st resistance level at 103.43, leading to a drop towards the 1st support level at 100.80. The 1st support level is considered a significant multi-swing low support, further reinforced by the presence of the 78.60% Fibonacci Projection. Additionally, the 2nd support level at 99.51 is identified as an overlap support and coincides with the 100% Fibonacci Projection.
On the upside, the 1st resistance level at 103.43 is an overlap resistance. Furthermore, the 2nd resistance level at 105.65 is also categorized as an overlap resistance, indicating its potential role in impeding upward price advancement. An intermediate support level at 101.30 adds further significance as a multi-swing low support, aligning with the 61.80% Fibonacci Projection.
EUR/USD:
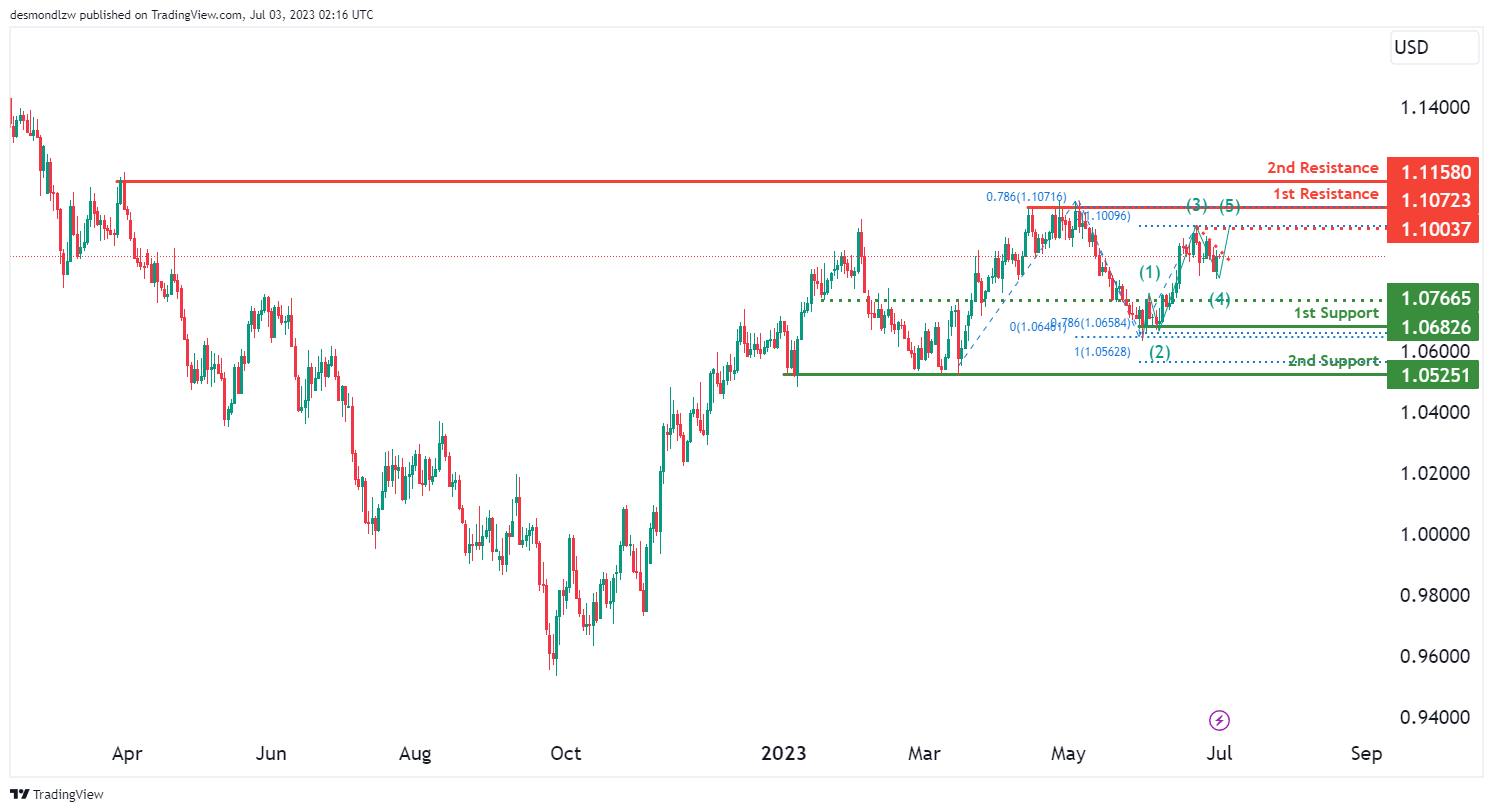
The EUR/USD chart currently exhibits a bullish momentum, suggesting an overall upward trend in the market.
There is a possibility for a bearish continuation towards the 1st support level at 1.0682. This support level is identified as a multi-swing low support and is further reinforced by the presence of the 78.60% Fibonacci Projection. Additionally, the 2nd support level at 1.0525 serves as another multi-swing low support and aligns with the 100% Fibonacci Projection.
On the upside, the 1st resistance level at 1.1072 represents a multi-swing high resistance, accompanied by the 78.60% Fibonacci Projection. Furthermore, the 2nd resistance level at 1.1158 is categorized as a swing high resistance.
An intermediate resistance level at 1.1003 adds further significance as a swing high resistance.
GBP/USD:
The GBP/USD chart currently demonstrates a bullish momentum, indicating a potential for further upward movement in the market. This bullish momentum is supported by the fact that the price is above a major ascending trend line, suggesting a continuation of the bullish trend.
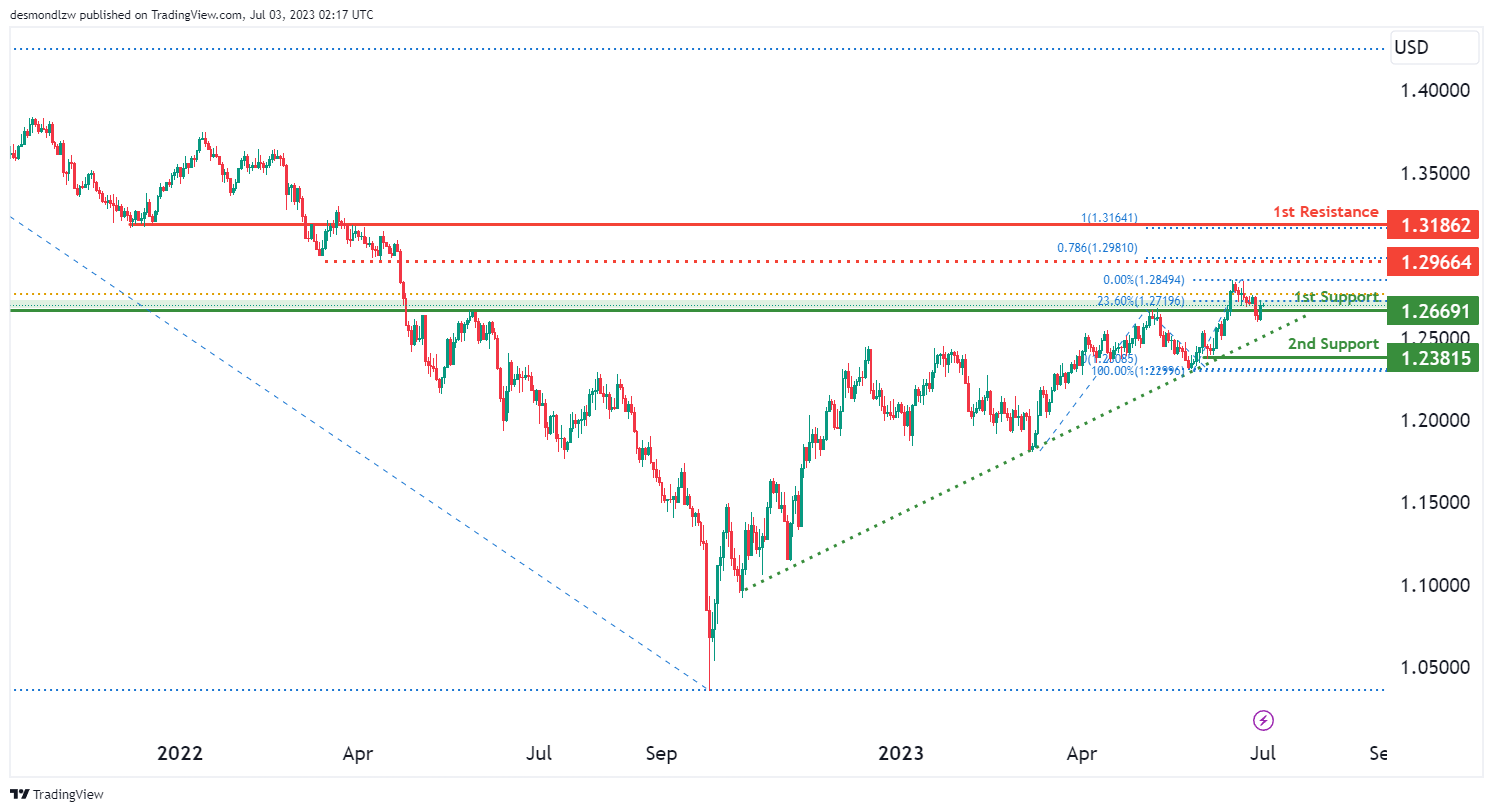
There is a possibility for a bullish bounce off the 1st support level at 1.2669. This support level is identified as an overlap support and is further reinforced by the presence of the 23.60% Fibonacci Retracement. Additionally, the 2nd support level at 1.2381 represents a swing low support.
On the upside, the 1st resistance level at 1.3186 acts as an overlap resistance. Furthermore, an intermediate resistance level at 1.2966 serves as a pullback resistance.
USD/CHF:
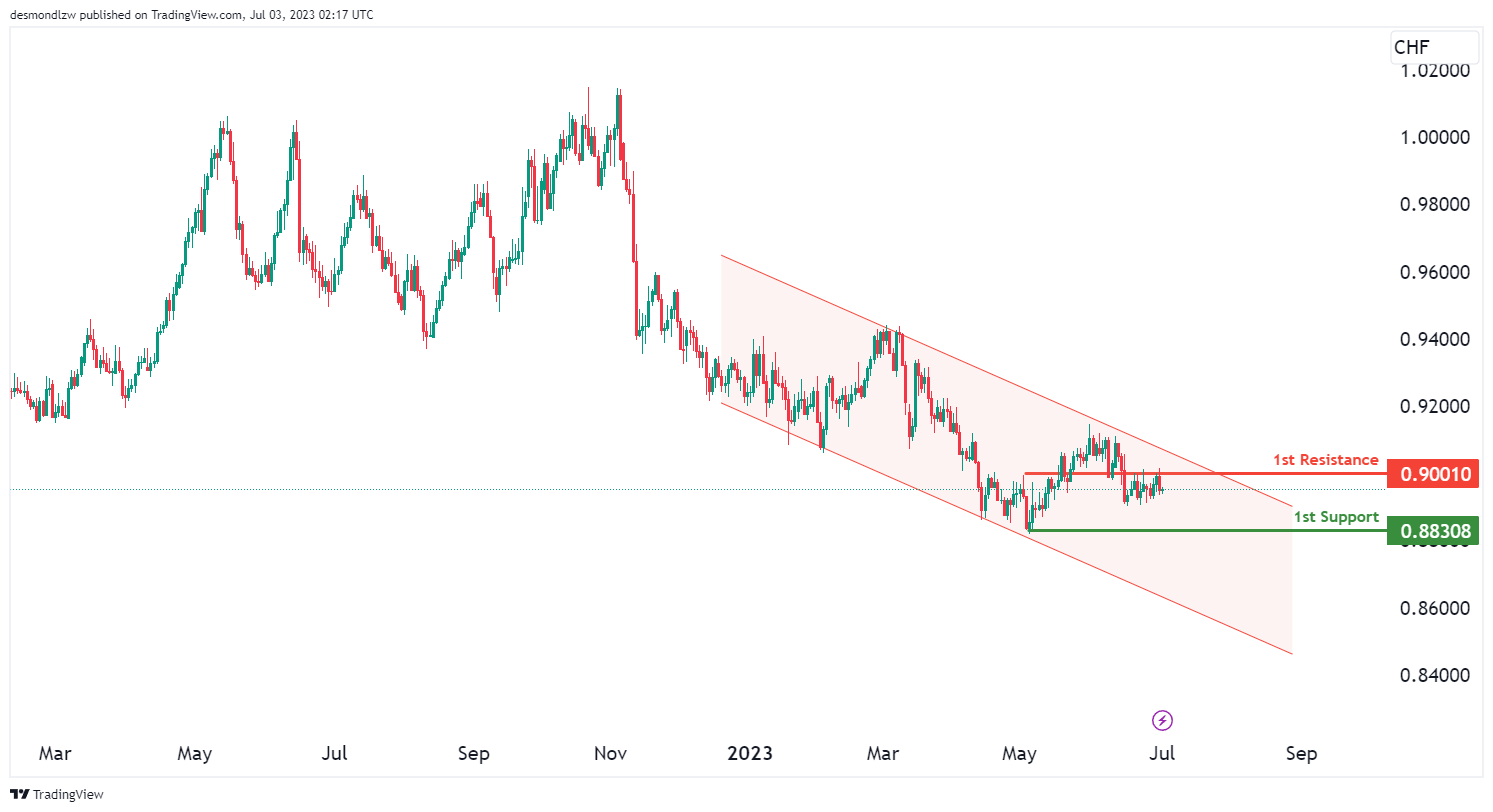
The USD/CHF chart currently demonstrates a bearish momentum, indicating a downward trend in the market. This is supported by the fact that the price is within a bearish descending channel, suggesting the potential for further downward movement.
There is a possibility for a bearish continuation towards the 1st support level at 0.8830. This support level is identified as a swing low support.
On the upside, the 1st resistance level at 0.9001 acts as an overlap resistance.
USD/JPY:
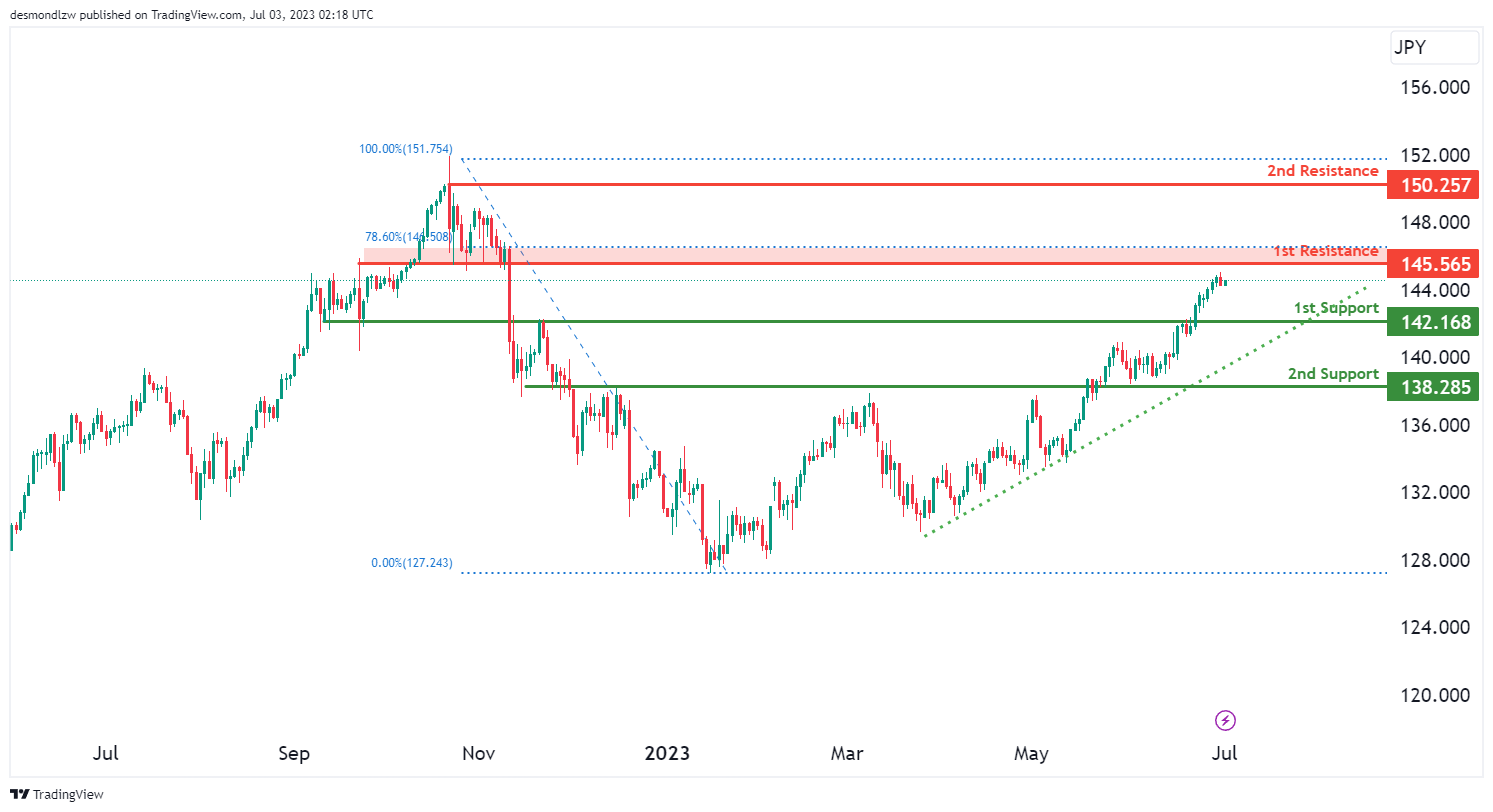
The USD/JPY chart currently demonstrates a bearish momentum, suggesting a downward trend in the market. This is supported by the fact that the price is above a major ascending trend line, which indicates potential bullish momentum, but in this case, it might lead to a bearish reaction.
There is a possibility for a bearish reaction off the 1st resistance level at 145.56, potentially causing a drop towards the 1st support level at 142.16. The 1st support level is identified as a pullback support, while the 2nd support level at 138.28 is an overlap support.
On the upside, the 1st resistance level at 145.56 acts as a pullback resistance, coinciding with the 78.60% Fibonacci Retracement. The 2nd resistance level at 150.25 represents a swing high resistance.
USD/CAD:
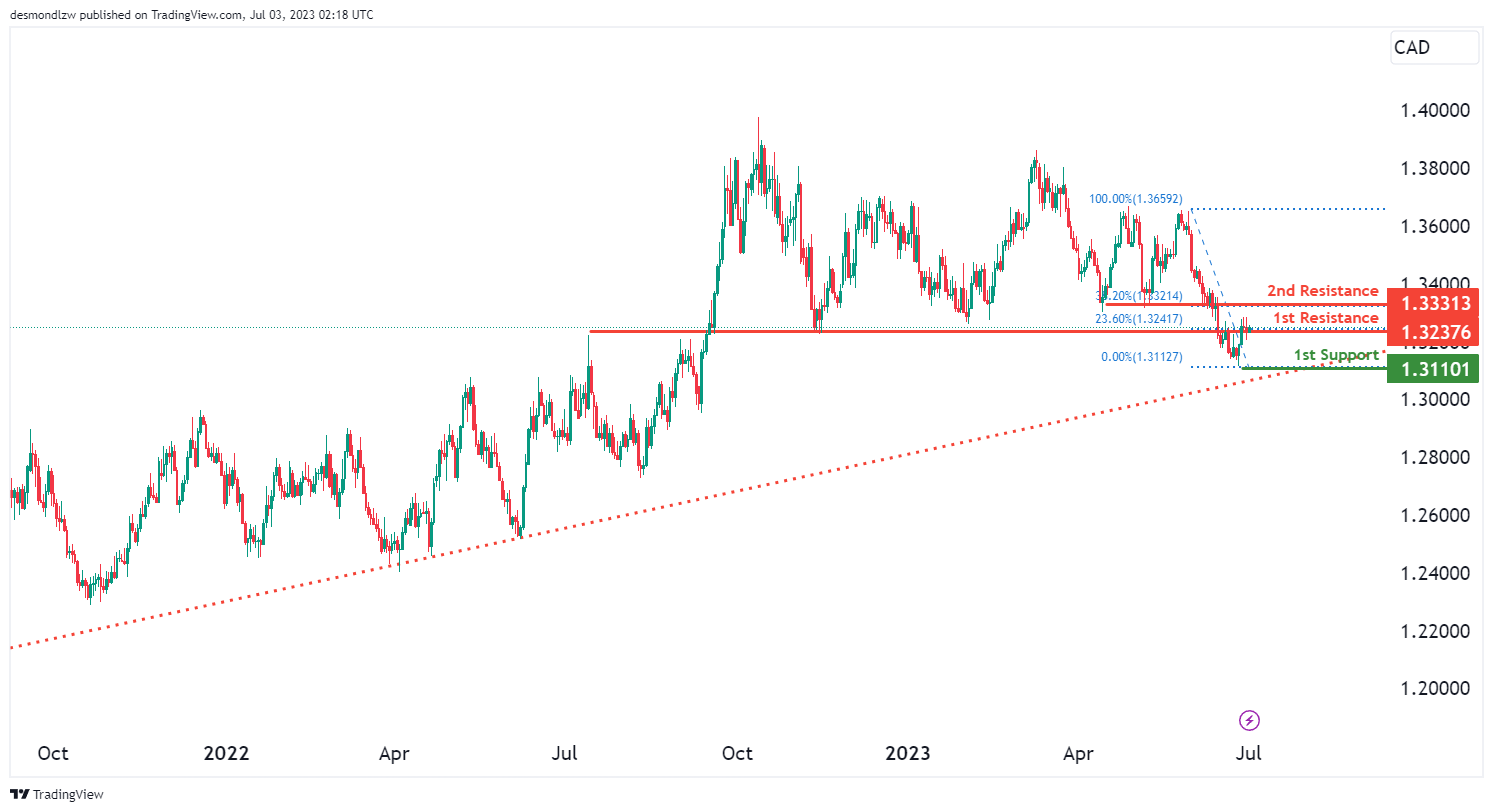
The instrument USD/CAD exhibits an overall bearish momentum. This momentum is attributed to the potential bearish reaction off the first resistance, potentially leading to a drop down to the first support. The first support stands at 1.3110, offering a robust level due to its positioning as a swing low support.
Moving higher, the first resistance is found at 1.3237, which acts as a pullback resistance and also signifies the 23.60% Fibonacci retracement.
Beyond that, the second resistance at 1.3331 serves as an overlap resistance as well as the 38.20% Fibonacci retracement point. Both resistances could contribute significantly to the bearish momentum of the USDCAD chart.
AUD/USD:
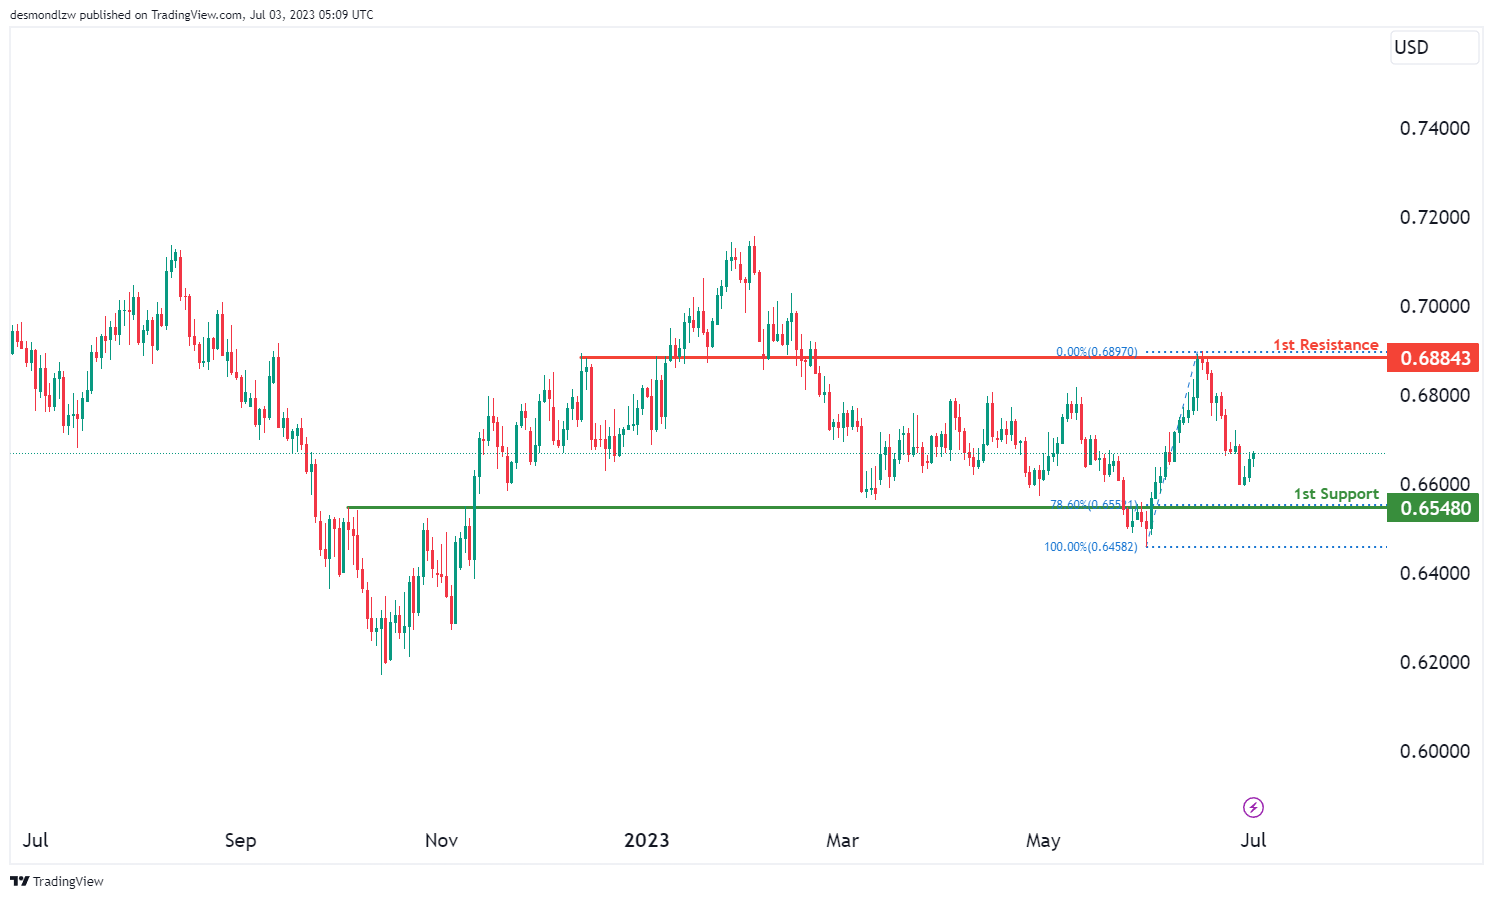
The AUD/USD chart currently exhibits a bullish momentum, suggesting an upward trend in the market.
There is a possibility for the price to continue its bullish movement towards the 1st resistance level at 0.6884. On the downside, the 1st support level at 0.6548 is identified as a pullback support, with additional significance provided by the presence of the 78.60% Fibonacci Retracement.
NZD/USD
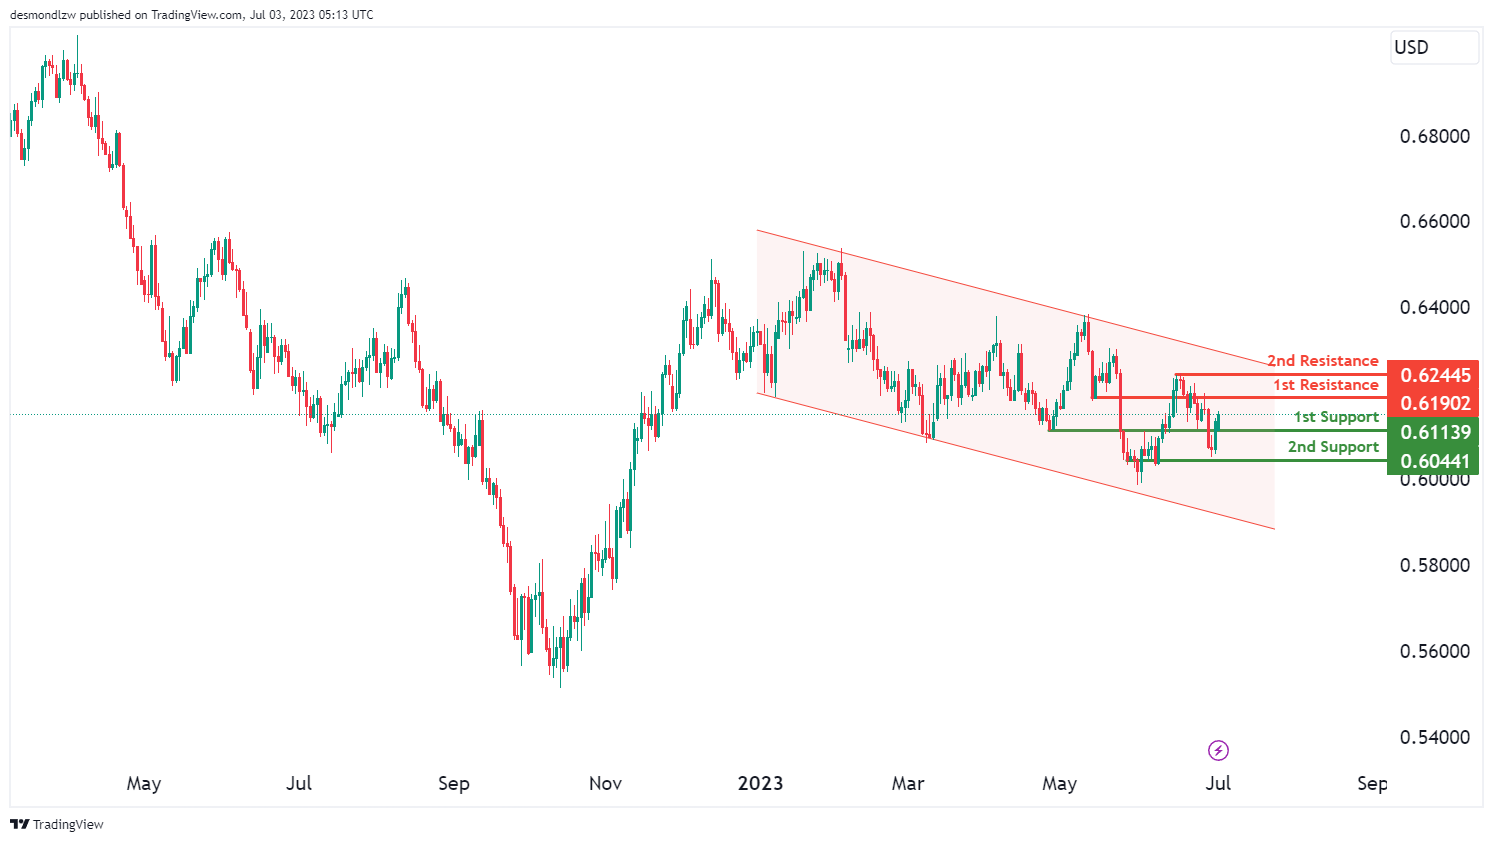
The NZD/USD chart currently shows a bearish momentum, indicating a downward trend in the market. This is supported by the fact that the price is within a bearish descending channel, suggesting a continuation of the downward movement.
There is a possibility for the price to rise towards the 1st resistance level at 0.6190 in the short term before reversing off it and dropping towards the 1st support level at 0.6113. The 1st support level is identified as an overlap support, while the 2nd support level at 0.6044 represents a multi-swing low support.
On the upside, the 1st resistance level at 0.6190 acts as an overlap resistance, while the 2nd resistance level at 0.6244 represents a multi-swing high resistance.
DJ30:
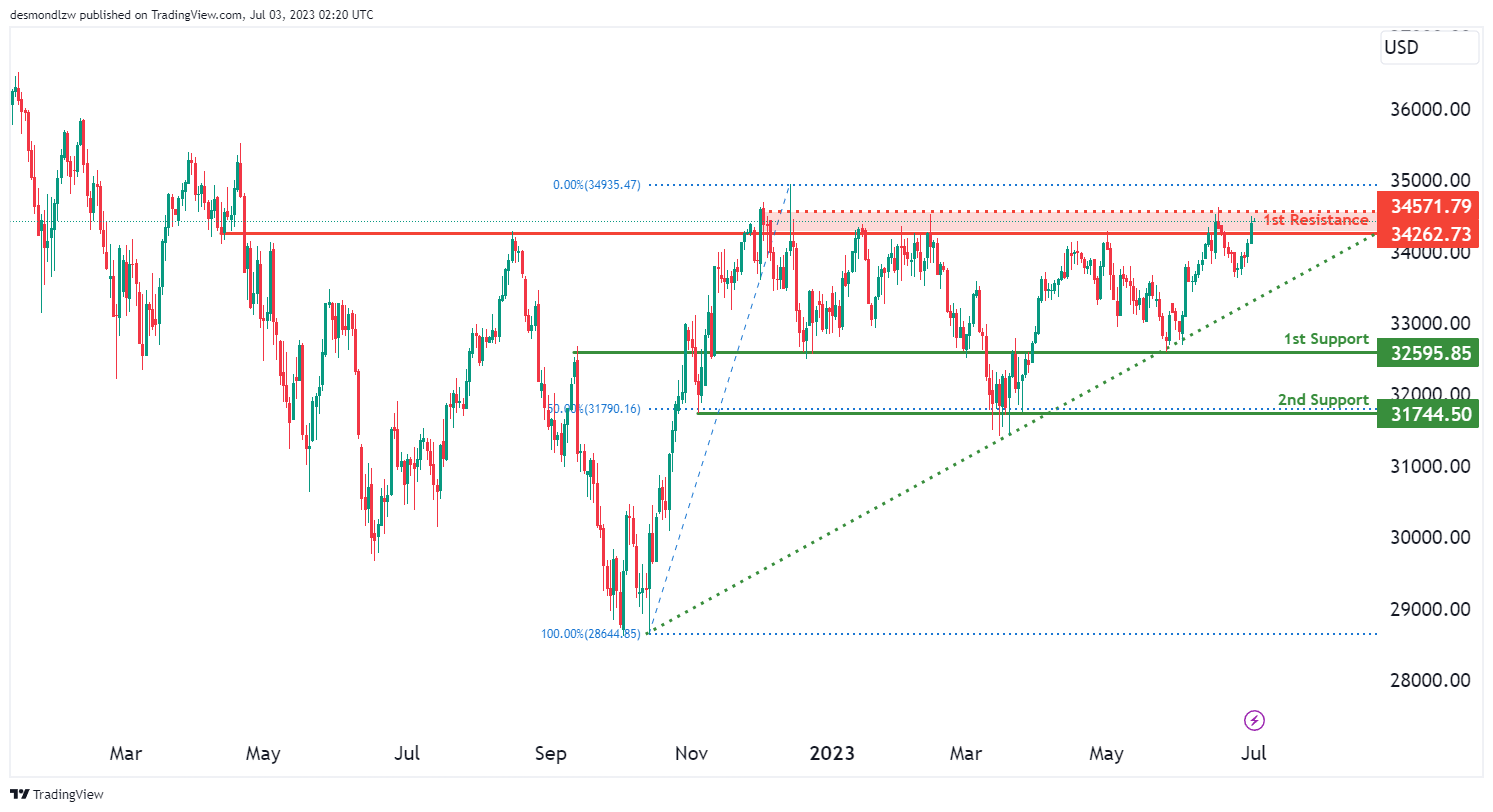
The DJ30 instrument is currently showcasing a bullish momentum. This uptrend is expected to continue with a potential bullish move towards the first resistance. The first support for this instrument is set at 32595.85, providing a strong base due to its overlap support. Further down, the second support at 31744.50 acts as a swing low support and represents a crucial 50% Fibonacci retracement point.
Looking upwards, the first resistance level is positioned at 34262.73, presenting an overlap resistance that could challenge the bullish continuation. Additionally, there is an intermediate resistance at 34571.79, which can serve as a significant barrier due to its multi-swing high resistance. These resistance levels may determine the extent of the bullish momentum for the DJ30 instrument.
GER30:
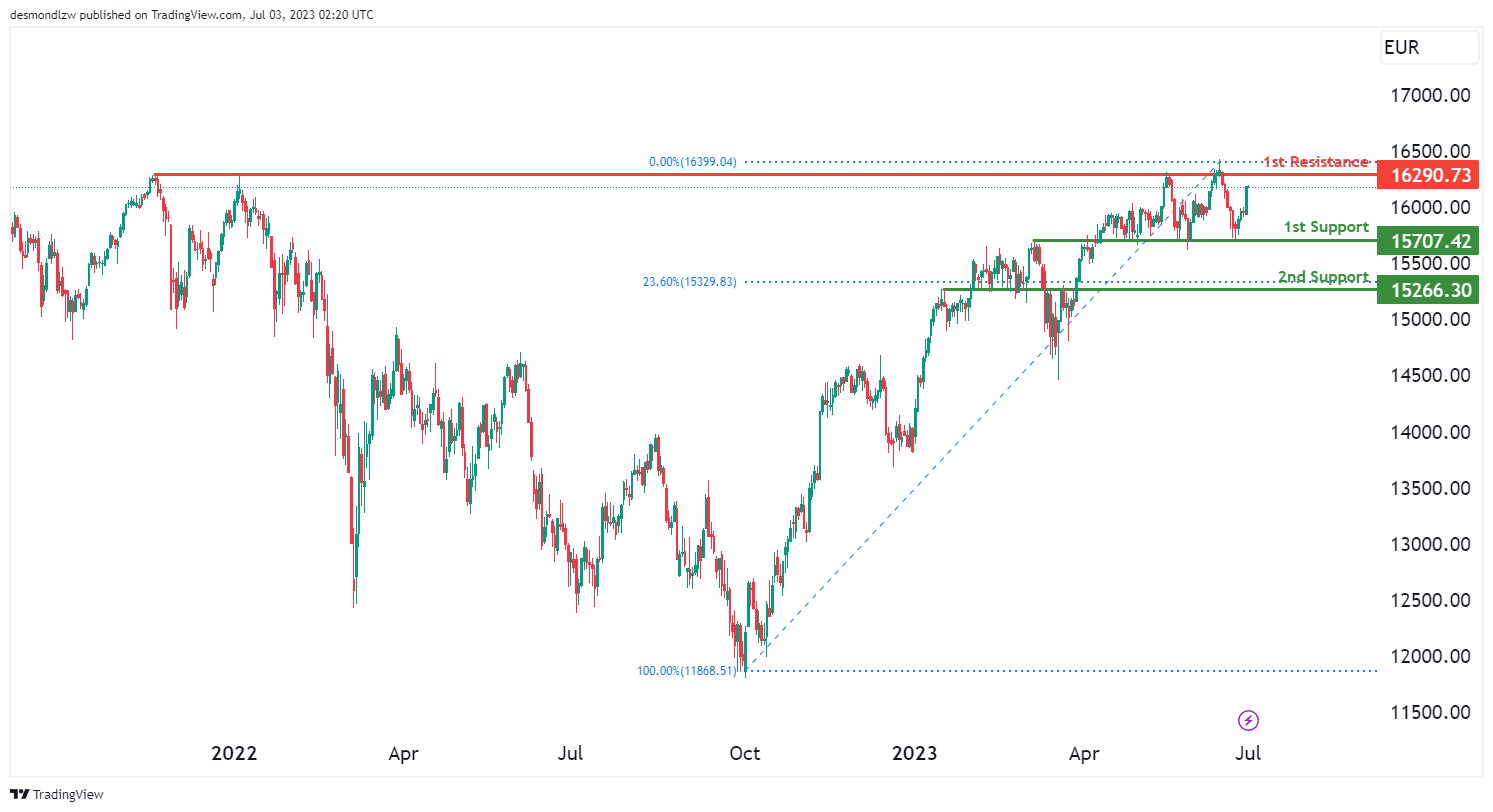
The GER30 instrument is currently displaying a bullish momentum. This is expected to potentially lead to a bullish continuation towards the first resistance level. The first support level for this instrument is established at 15707.42, which is considered a strong base due to its nature as an overlap support. Further down, the second support level is positioned at 15266.30 and acts as another overlap support, coinciding with a significant 23.60% Fibonacci retracement level.
On the upper side, the first resistance is located at approximately 16290.73. This level presents a notable challenge to the bullish trend due to its position as a multi-swing high resistance. These levels of support and resistance will play a crucial role in determining the future trajectory of the GER30’s bullish momentum.
US500
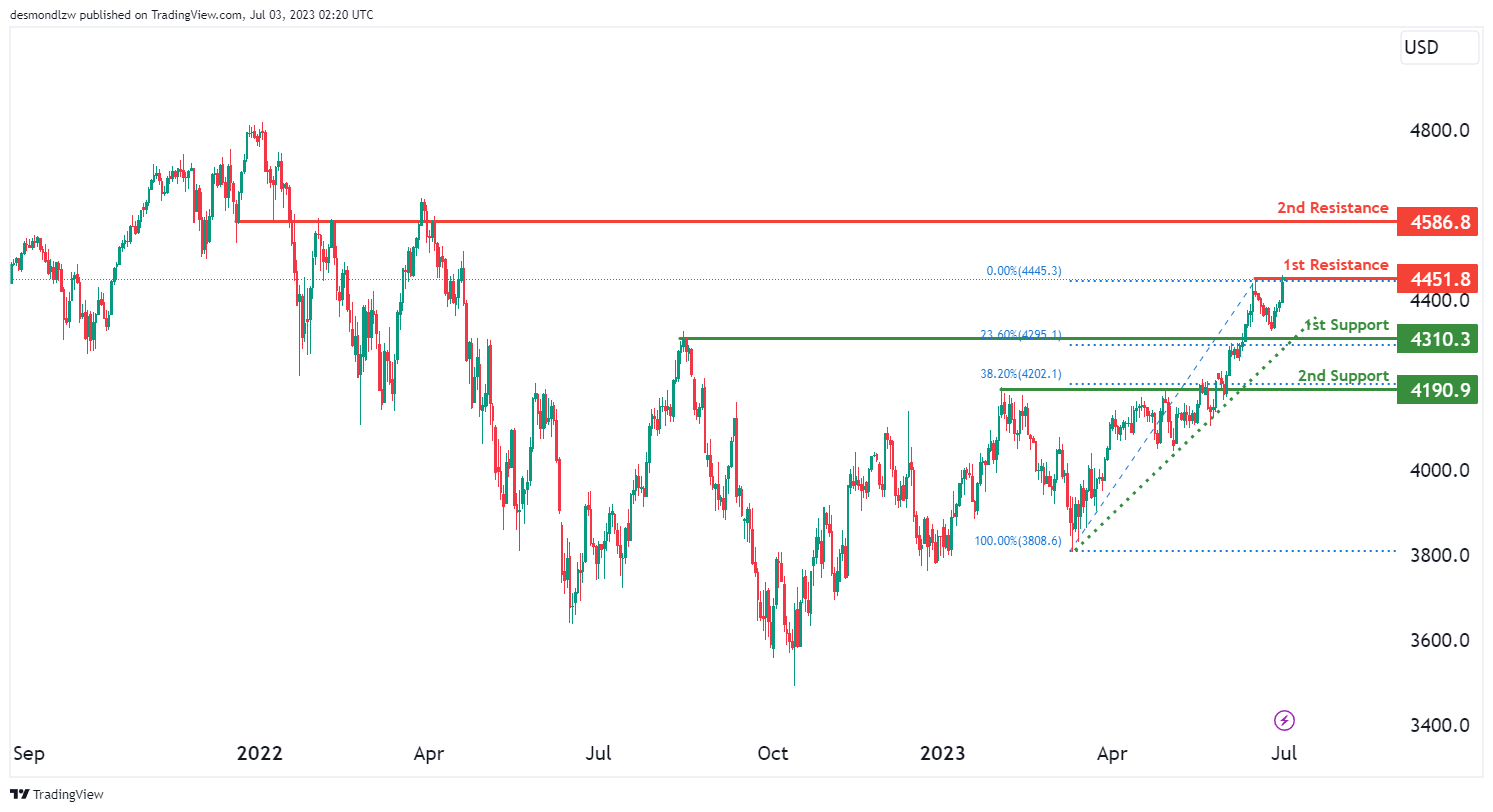
The US500 instrument is currently exhibiting a weak bearish momentum with low confidence. This trend could potentially lead to a bearish reaction off the first resistance and a subsequent drop to the first support level.
The first support level is identified at 4310.3, providing a solid base due to its nature as an overlap support and its correlation with a 23.60% Fibonacci retracement level. Lower down, the second support at 4190.9 serves as another overlap support and coincides with the 38.20% Fibonacci retracement level, adding to its strength.
On the flip side, the first resistance level is found at 4451.8, acting as a swing high resistance that could potentially deflect the bearish trend. Further up, the second resistance at 4586.8 stands as an overlap resistance. These support and resistance levels could play significant roles in determining the continuation or potential reversal of the US500’s weak bearish momentum.
BTC/USD:
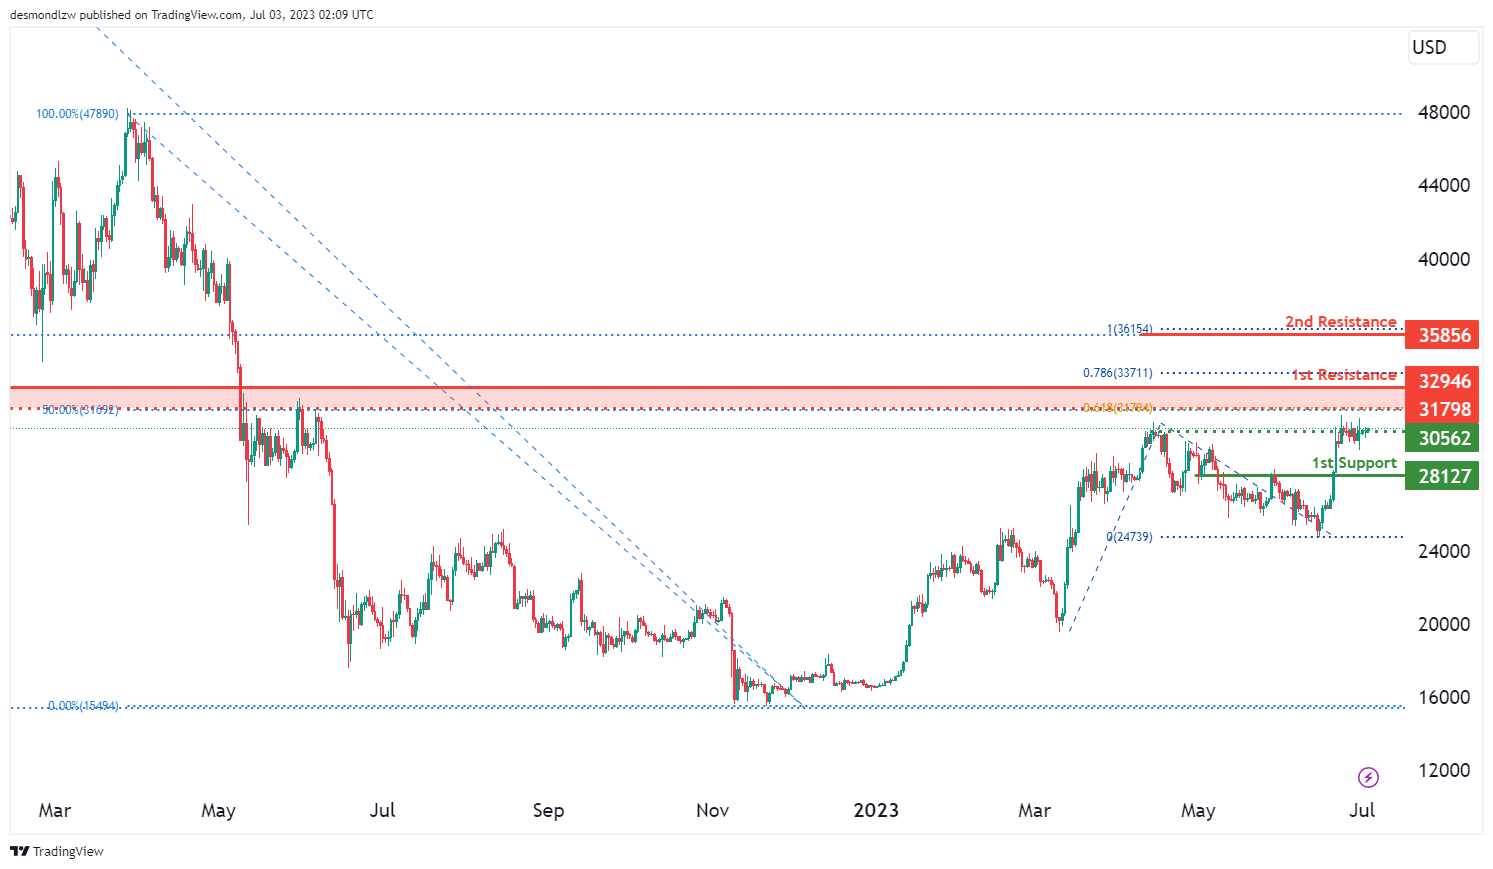
The BTC/USD instrument currently has a neutral overall momentum. This trend suggests that the price could potentially fluctuate between the first resistance and first support levels.
The first support level is found at 28127, which is considered robust due to its nature as an overlap support. On the upper side, the first resistance level is positioned at 32946 and is characterized as an overlap resistance, which may present a challenge to any bullish momentum. Beyond this, the second resistance is located at 35856, which also acts as an overlap resistance.
An intermediate resistance exists at 31798. It is notable due to its identification as an overlap resistance and its correlation with significant Fibonacci indicators. It lies at the 50% Fibonacci retracement level and the 61.80% Fibonacci projection level, indicating a Fibonacci confluence. This can serve as a crucial point in determining the future trajectory of BTC/USD’s neutral momentum.
ETH/USD:
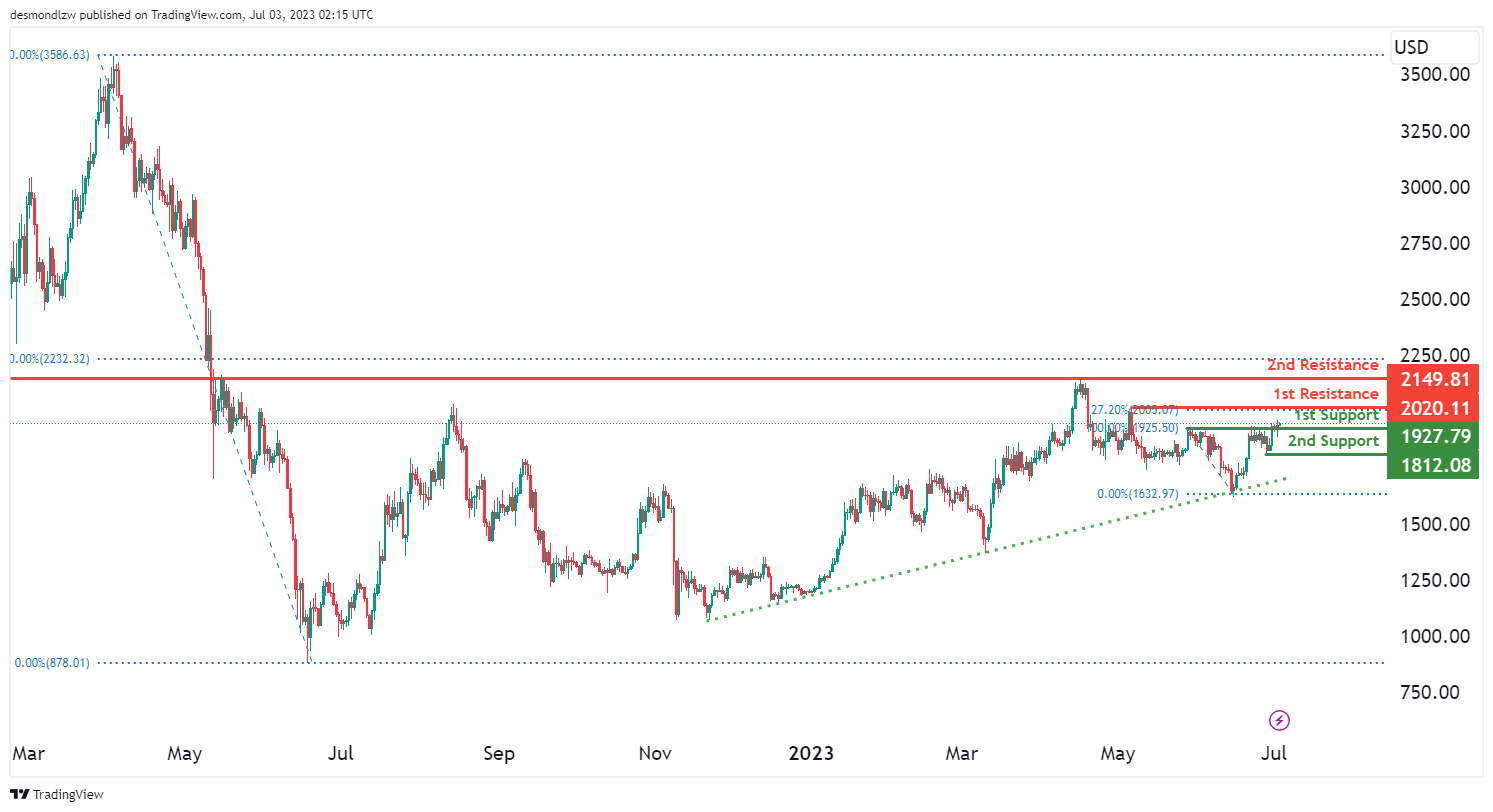
The ETH/USD instrument is currently displaying a bullish momentum. This trend suggests the possibility of a bullish continuation towards the first resistance level.
On the downside, the first support is found at 1927.79 and is considered strong due to its position as a pullback support. Further down, the second support is set at 1812.08 and offers robustness by virtue of its swing low support.
On the upside, the first resistance level is identified at 2020.11. This level presents a significant barrier due to its swing high resistance. Beyond that, the second resistance is at 2149.81, acting as an overlap resistance. These support and resistance levels will play key roles in determining the continuation or potential reversal of the bullish momentum in the ETH/USD chart.
WTI/USD:
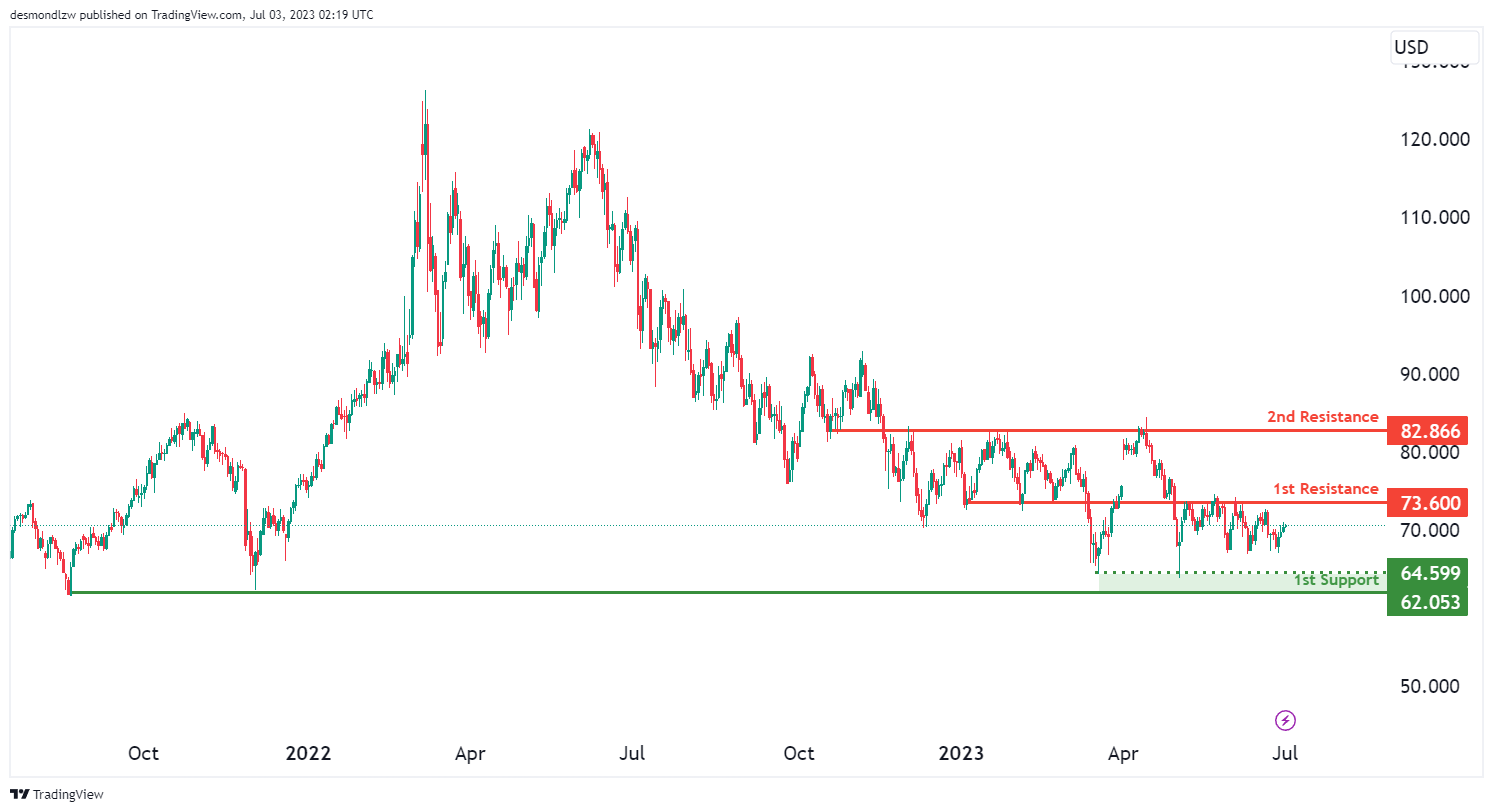
The WTI (West Texas Intermediate) instrument is currently exhibiting a bearish momentum. In the short term, the price could potentially rise towards the first resistance before reversing off it and dropping towards the first support.
The first support level for this instrument is positioned at 62.053, which is considered robust due to its role as a multi-swing low support. Meanwhile, there is an intermediate support at 64.599, also offering strength as a multi-swing low support.
On the upside, the first resistance level is identified at 73.600 and is marked as an overlap resistance. Beyond that, the second resistance level is located at 82.866, also serving as an overlap resistance. These levels of support and resistance will be key determinants in shaping the bearish momentum of the WTI instrument.
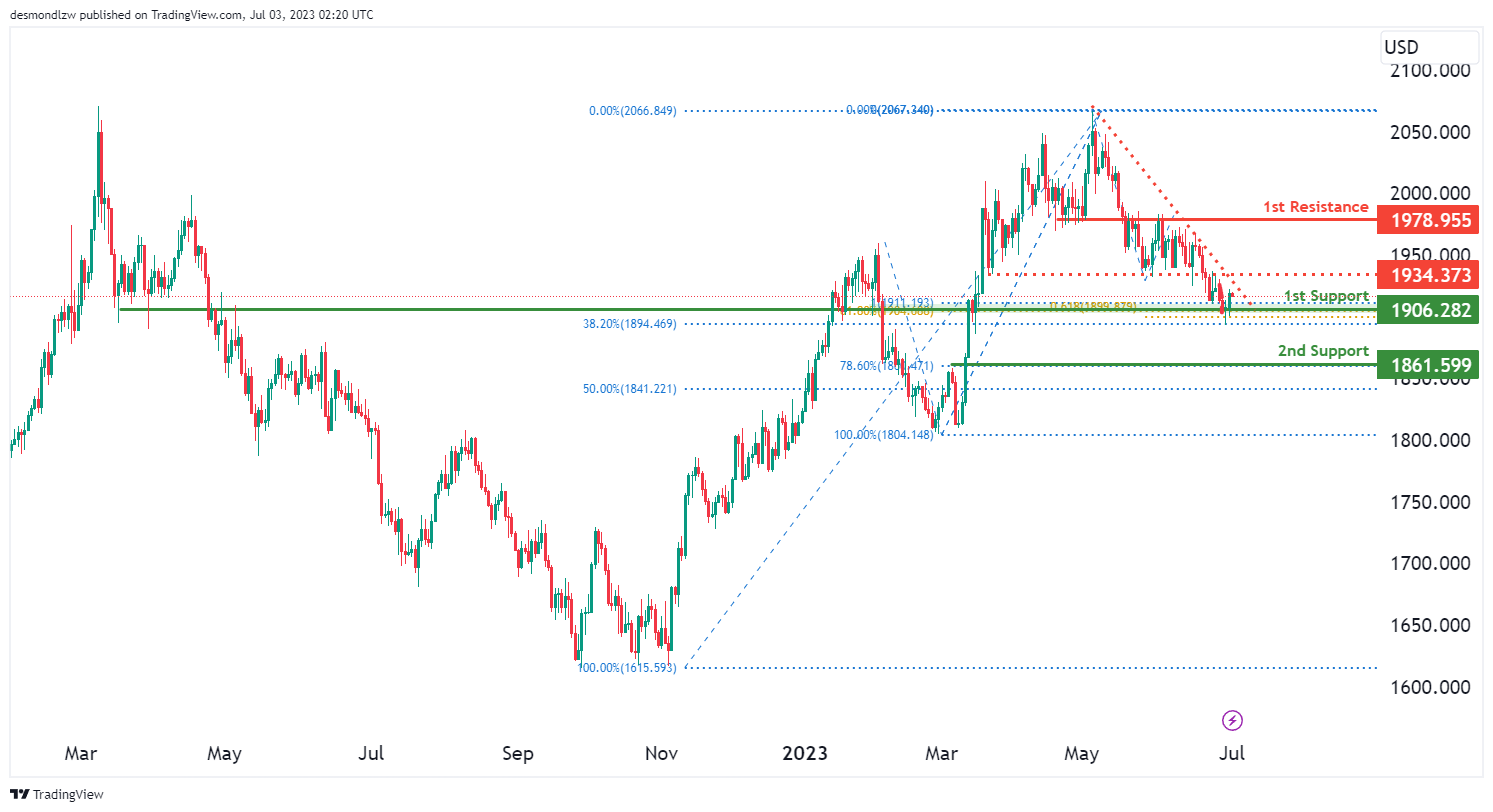
XAU/USD (GOLD):
The XAU/USD instrument is currently displaying a weak bullish momentum with low confidence. This suggests the potential for a bullish continuation towards the first resistance level.
On the downside, the first support level is found at 1906.282. This is considered robust due to its nature as an overlap support, as well as its position at the 38.20% Fibonacci retracement level and the 61.80% Fibonacci projection level, indicating a Fibonacci confluence. Further down, the second support is at 1861.599, providing a sturdy base as a pullback support and a significant 78.60% Fibonacci retracement level.
On the upside, the first resistance level is located at 1978.955, acting as an overlap resistance. Additionally, an intermediate resistance exists at 1934.373, also characterized as an overlap resistance. These support and resistance levels could play key roles in determining the future trajectory of XAU/USD’s weak bullish momentum.
EUR/USD Could Resume Increase Above 1.0950
Key Highlights
- EUR/USD corrected lower and tested the 1.0835 support.
- A key bearish trend line is forming with resistance near 1.0925 on the 4-hour chart.
- GBP/USD is finding bids near the 1.2600 support zone.
- The US ISM Manufacturing Index could increase from 46.9 to 47.2 in June 2023.
EUR/USD Technical Analysis
The Euro started a downside correction below the 1.0950 support against the US Dollar. EUR/USD even traded below the 1.0880 level before the bulls appeared.
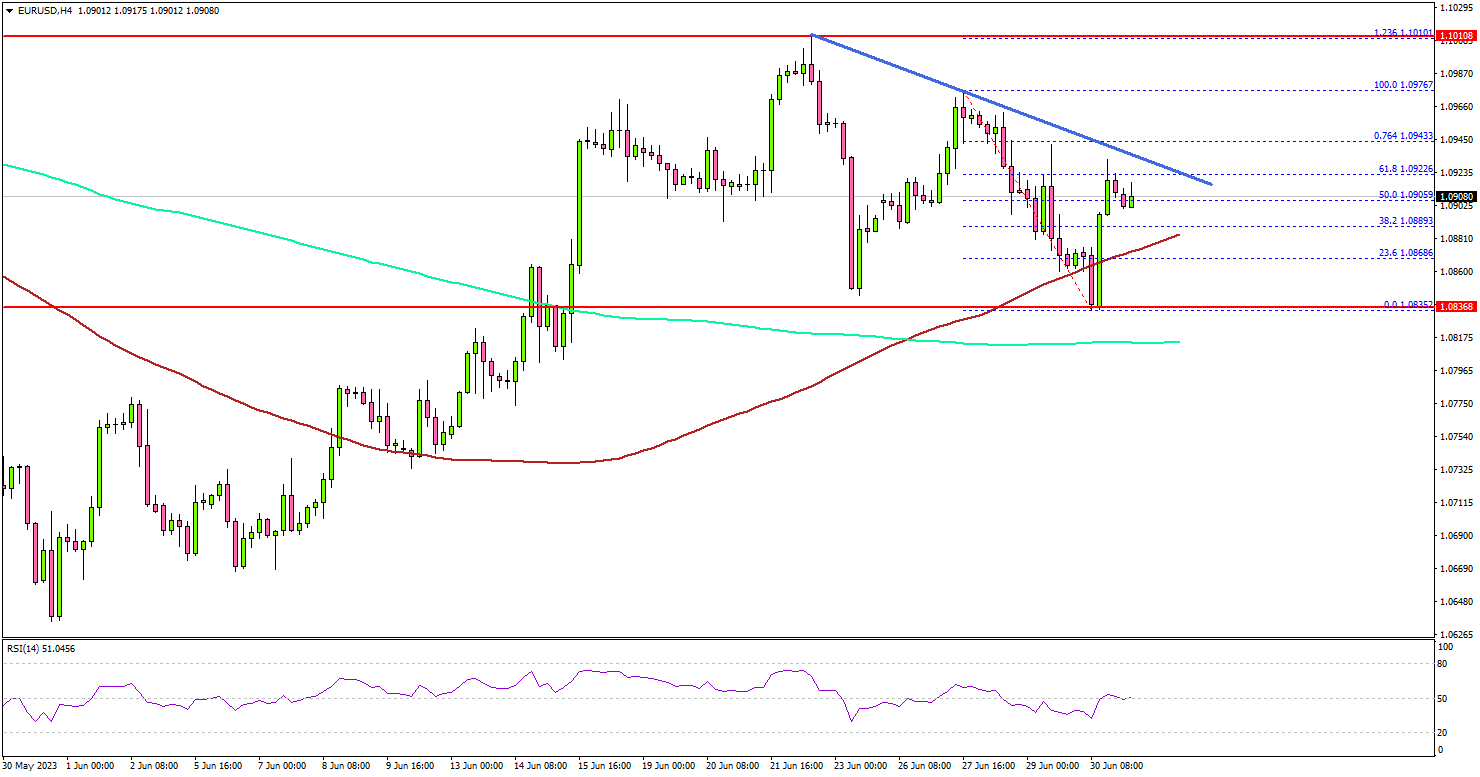
Looking at the 4-hour chart, the pair found support near the 1.0835 zone. It remained stable and recently started a fresh increase. It is now trading well above the 100 simple moving average (red, 4 hours) and the 200 simple moving average (green, 4 hours).
It is now consolidating near the 50% Fib retracement level of the downward move from the 1.0976 swing high to the 1.0935 low. On the upside, the first major resistance is near 1.0925.
There is also a key bearish trend line forming with resistance near 1.0925 on the same chart. The trend line is close to the 61.8% Fib retracement level of the downward move from the 1.0976 swing high to the 1.0935 low.
If there is a move above the 1.0925 resistance, the pair could rise toward 1.0950. Any more gains might send EUR/USD toward the 1.1010 level.
Immediate support is near the 1.0865 level. The next major support is near the 1.0835 level. If there is a downside break below the 1.0835 support, the pair could decline toward the 1.0750 support.
Looking at GBP/USD, the pair corrected lower sharply below the 1.2750 support and retested the 1.2600 support.
Economic Releases
- Germany’s Manufacturing PMI for June 2023 - Forecast 41, versus 41 previous.
- Euro Zone Manufacturing PMI for June 2023 – Forecast 43.6, versus 43.6 previous.
- UK Manufacturing PMI for June 2023 – Forecast 46.2, versus 46.2 previous.
- US Manufacturing PMI for June 2023 – Forecast 46.3, versus 46.3 previous.
- US ISM Manufacturing Index for June 2023 – Forecast 47.2, versus 46.9 previous.
China Caixin PMI manufacturing dipped to 50.5, dire job market, deflationary pressure, waning optimism
China's Caixin PMI Manufacturing for June recorded a slight decline from 50.9 in May to 50.5. slightly above expectation of 50.2. Caixin indicated that while output marginally increased, demand growth remained modest. Meanwhile, input prices experienced their sharpest decline since January 2016, and business confidence sank to an eight-month low.
Wang Zhe, Senior Economist at Caixin Insight Group, summed up the situation: "Manufacturing activity growth suffered a marginal slowdown."
"A slew of recent economic data suggests that China's recovery has yet to find a stable footing, as prominent issues including a lack of internal growth drivers, weak demand and dimming prospects remain," Wang added.
"Problems reflected in June's Caixin China manufacturing PMI, ranging from an increasingly dire job market to rising deflationary pressure and waning optimism, also point to the same conclusion."
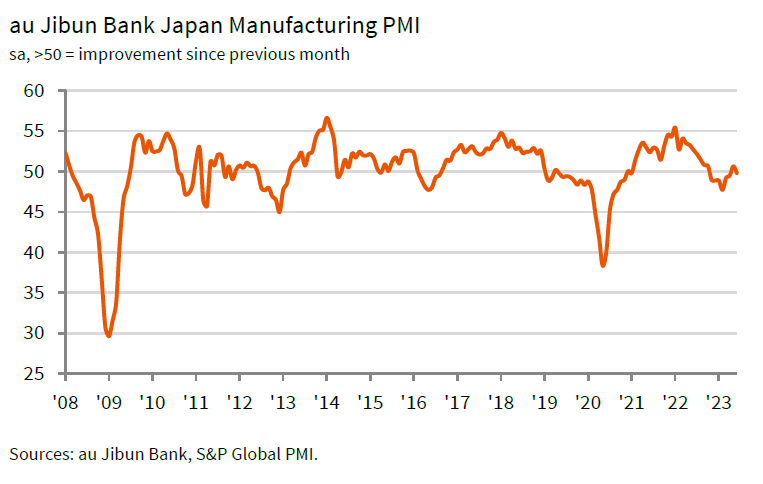
Japan PMI manufacturing finalized at 49.8, fractional deterioration in the sector
Japan's Manufacturing PMI was finalized at 49.8 in June, a downturn from May's 50.6, according to au Jibun Bank. The reading fell just short of the neutral 50.0 threshold that separates expansion from contraction, indicating a slight decline in the health of the nation's manufacturing sector.
The report also highlighted that both output and new orders regressed, while supplier performance showed the most significant improvement since March 2016. Input prices increased at the slowest pace observed in the past 28 months.
Usamah Bhatti of S&P Global Market Intelligence noted, "The latest data pointed to a fractional deterioration in the Japanese manufacturing sector at the midpoint of 2023."
However, the slackening in demand and output conditions had a double-edged effect. On one hand, pressure on supply chains eased in June, with average lead times shortening for the second successive month. Simultaneously, easing pressure on supply chains also alleviated inflationary pressures, driving the Input Prices Index to a 28-month low.
BoJ’s Tankan survey indicates renewed confidence amongst Japanese businesses
BoJ's quarterly Tankan survey for Q2 has pointed to an uptick in confidence among the Japanese businesses, surpassing market expectations.
Large manufacturing index, a key barometer of Japan's industrial sector, saw an impressive rise from a two-year low of 1 to 5, outperforming the market expectation of 3. This level marks the highest index value since Q4 of 2022, signifying a considerable rebound in sentiment within the manufacturing sector.
Similarly, large non-manufacturing index advanced from 20 to 23, again exceeding market forecasts of 22. This development signals the highest reading since Q2 2019, reflecting a resurgence in confidence within the broader service sector.
Looking forward, outlook for large manufacturers also leaped from 3 to 9, beating market predictions of 5. However, the outlook for large non-manufacturing firms was slightly below expectations at 20, compared to an anticipated figure of 21.
On the capital expenditure front, large firms plan to ramp up their outlays by a notable 13.4% in the current fiscal year ending March 2024, dwarfing the 3.2% increase projected in the Q1 survey.
Interestingly, the Tankan survey also revealed that companies foresee inflation hitting 2.6% a year from now, a slight pullback from the 2.8% projection made in March. Looking further ahead, inflation expectations stand at 2.2% for three years' time, a slight reduction from March figure of 2.3%, while projection for inflation five years from now remains stable at 2.1%.
GBPUSD Reacted From The Blue Box After A Double Three Structure
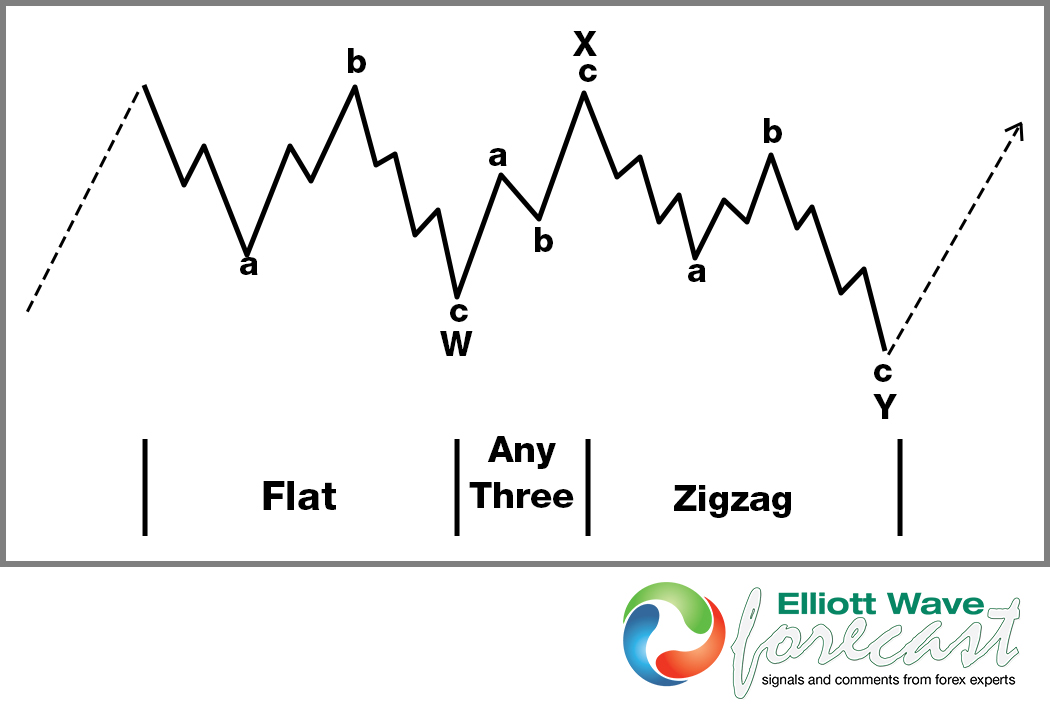
A Double three structure is a sideways combination of two corrective patterns. There are several corrective patterns including zigzag, flat, and triangle. When two of these corrective patterns are combined together, we get a double three. A combination of two corrective structures labelled as WXY. Wave W and wave Y subdivision can be zigzag, flat, double three or triple three of smaller degree. Wave X can be any corrective structure WXY is a 7 swing structure. Now, we are going to check what happened in these days at GBPUSD.
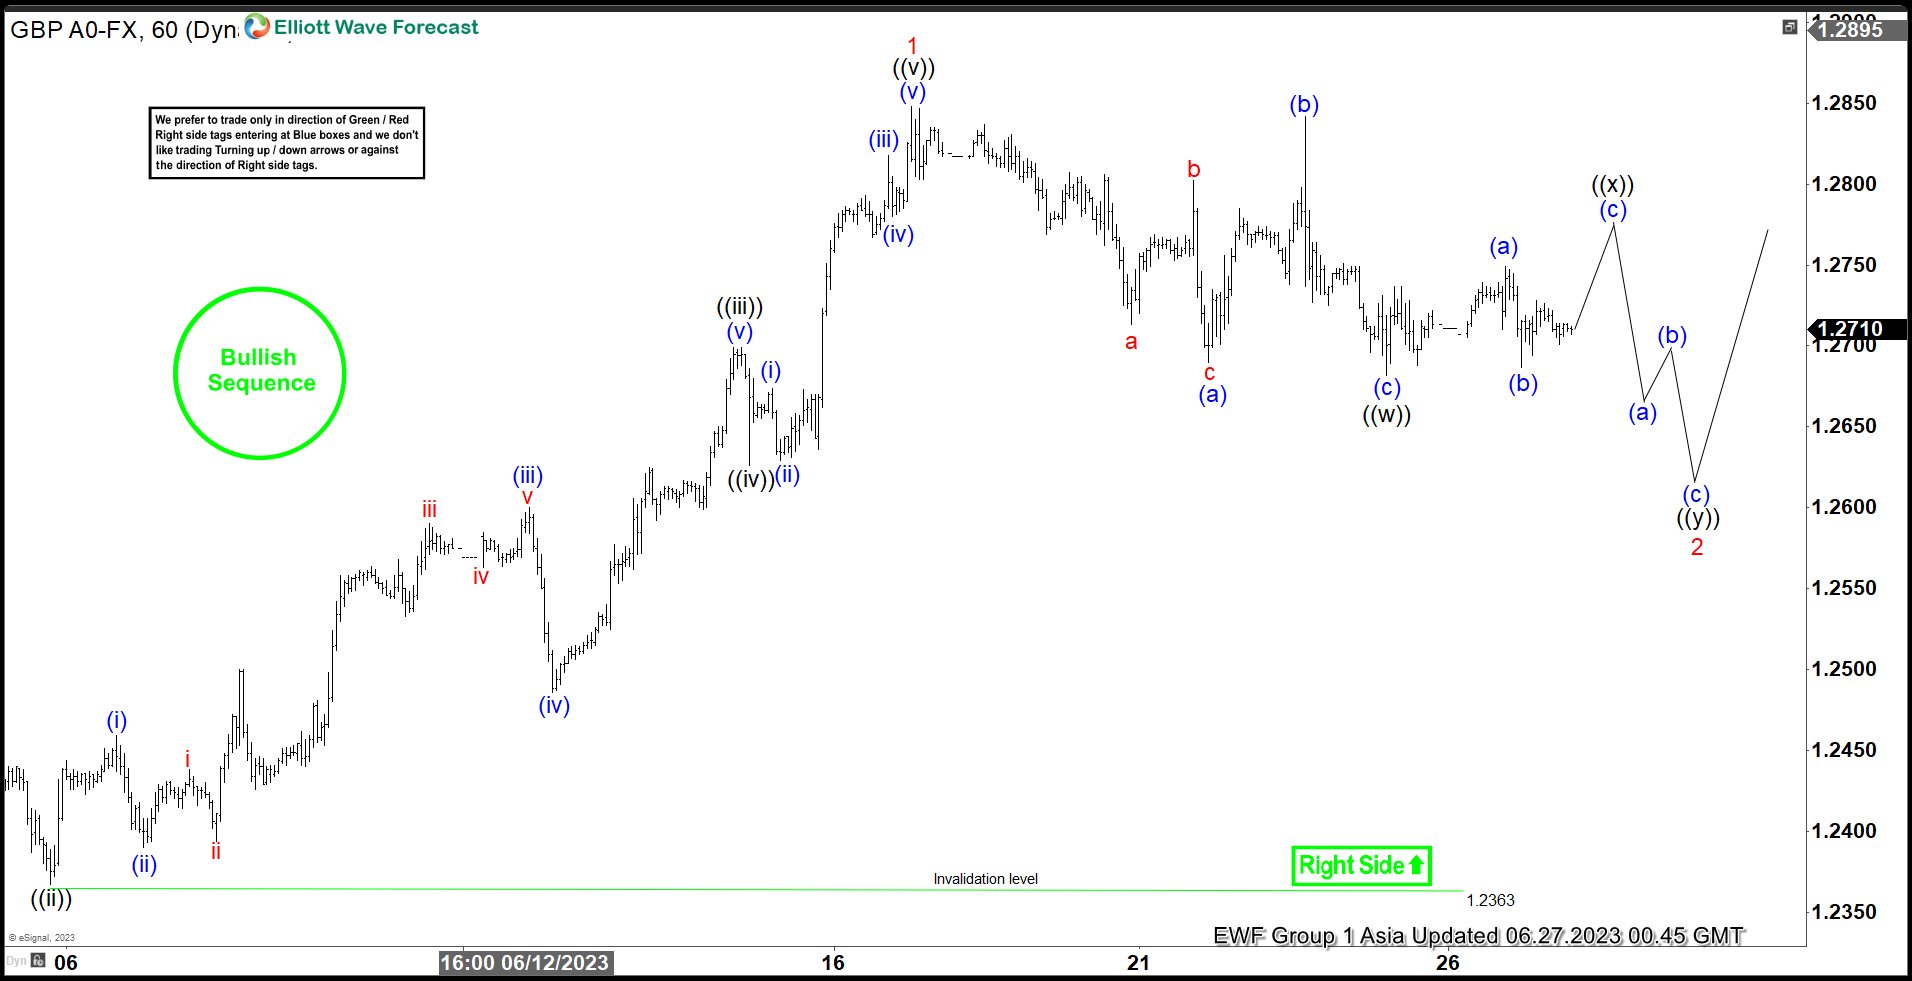
GBPUSD - 1 Hour Chart Asia Update June 27, 2023
GBPUSD ended at cycle at 1.2848 high and we called wave 1. The pair entered in corrective mode building 3 swings lower from the high ended wave (a) at 1.2690. The market bounce in another 3 swings to finish wave (b) at 1.2840. Then the price action fell again building an impulse as wave (c) that ended at 1.2684. These labels (a), (b) and (c) with a 3-3-5 structure is known as flat correction, it is the first part of this double correction, which is known as wave ((w)). Next, we need to look for a corrective bounce as wave ((x)) and then develop 3 more swings lower to finish the double correction as wave ((y)) and wave 2.
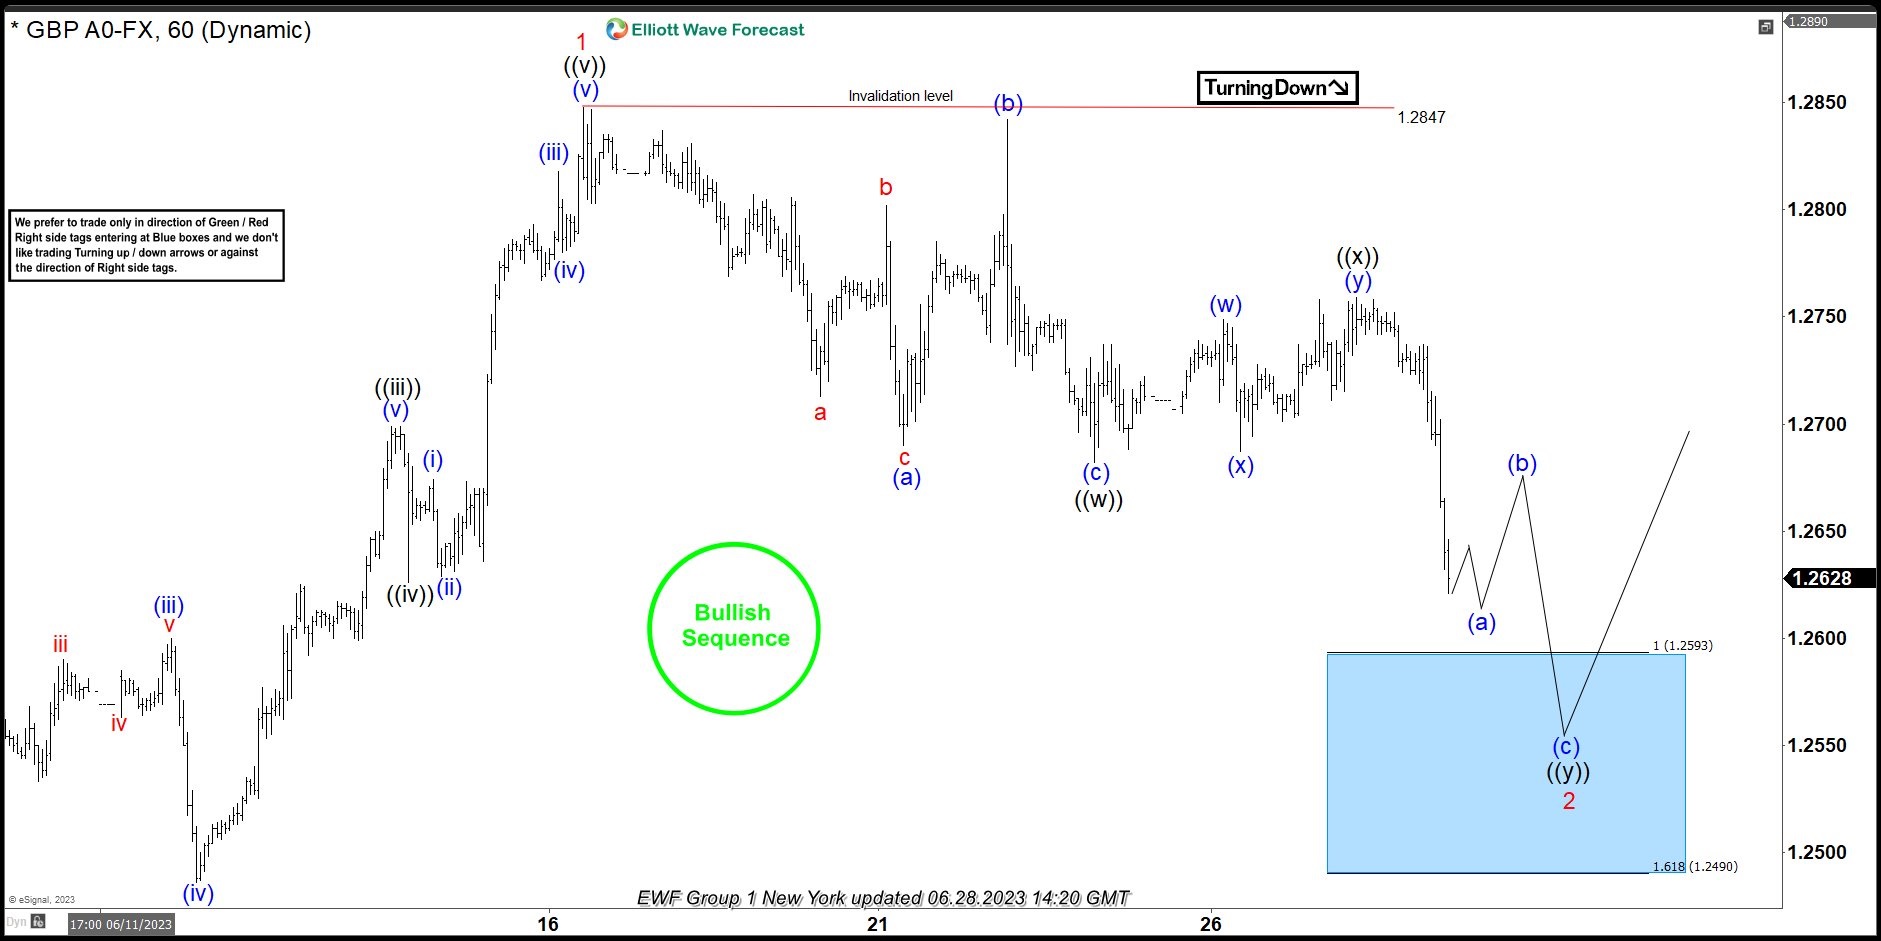
GBPUSD – 1 Hour Chart New York Update June 28, 2023
In the chart above, we can see how the wave ((x)) completed creating a double correction (w), (x), and (y) as an internal structure. This wave ((x)) or connector ends its movement at 1.2759 and kept dropping as expected to continue building the double correction of wave 2. Once the connector is ended, we can determinate the ideal area to look for ending the wave 2 in GBPUSD, that is blue box that comes in 1.2593 – 1.2490 area.
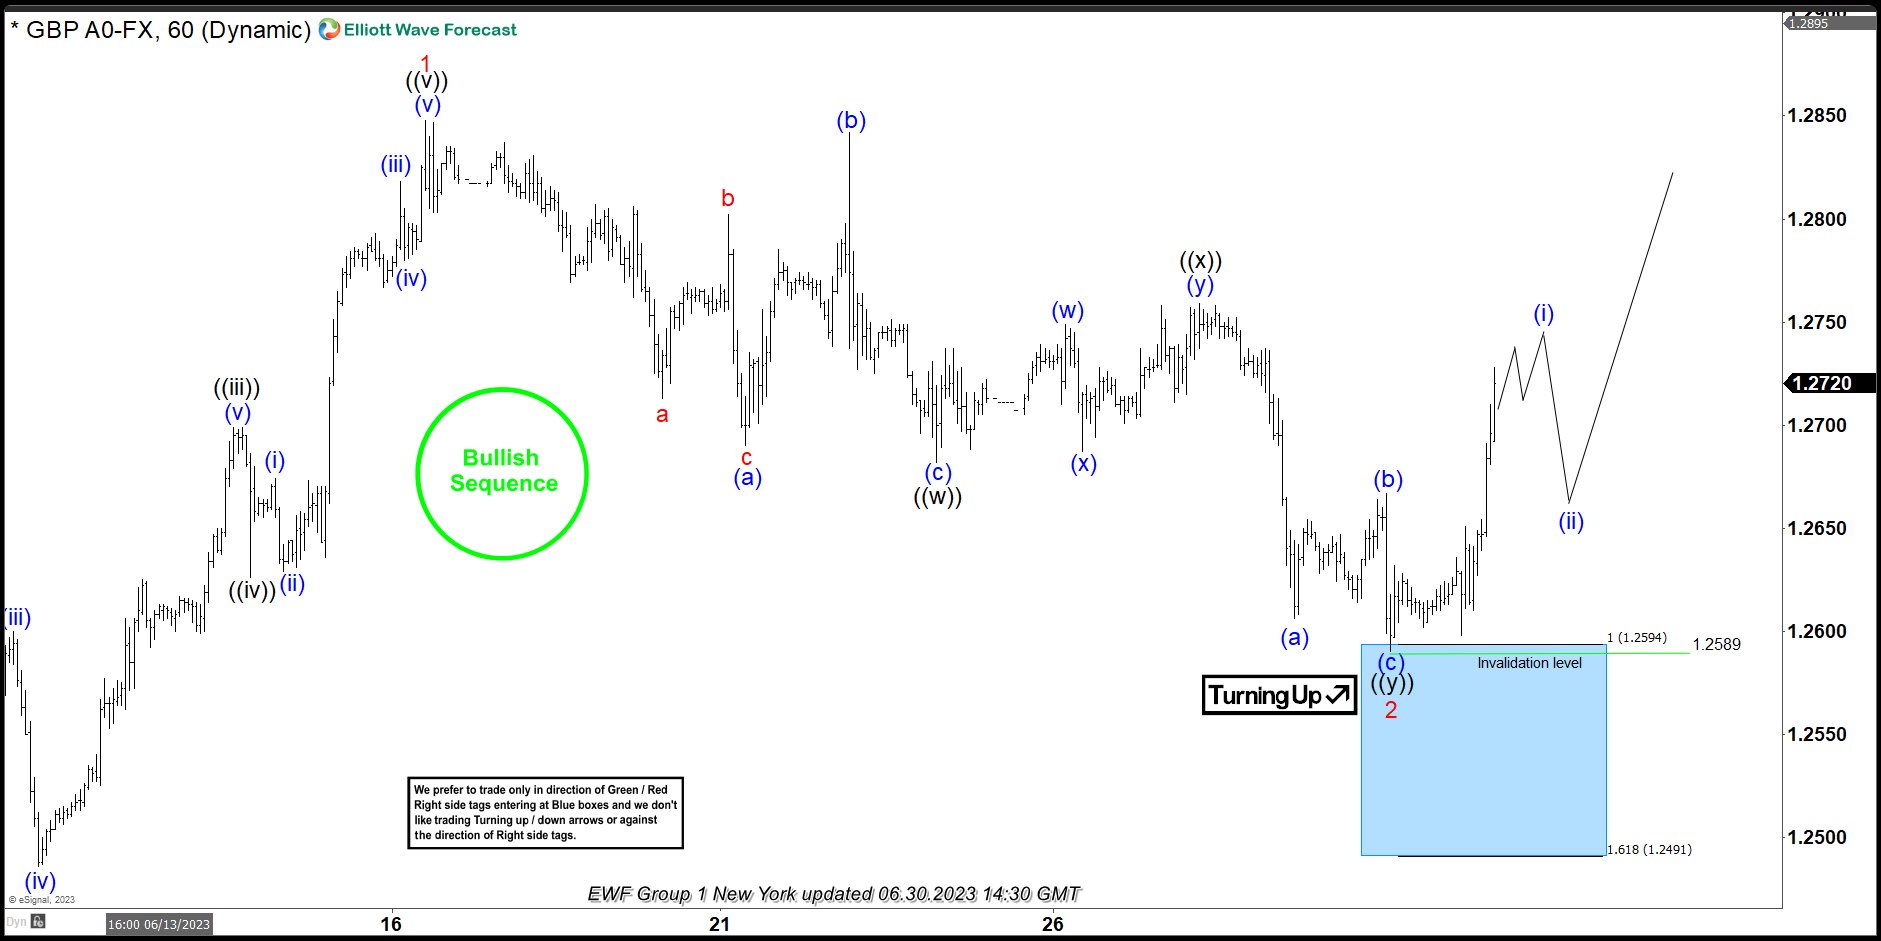
GBPUSD – 1 Hour Chart New York Update June 30, 2023
The result of the blue box is obvious. The market made 3 swings more to the downside (a), (b), and (c), completing the wave ((y)) and wave 2 as double correction at 1.2589, inside the blue box area. The GBPUSD rally from the blue box and currently we are expecting to break wave 1 high. In case that the structure is still correcting, the price action should make 3 swings higher at least before continue to the downside.
Forex and Cryptocurrencies Forecast
EUR/USD: When Will the Pair Return to 1.1000?
Summarizing the second half of June, the result in the EUR and USD confrontation can be said to be neutral. On Friday, June 30, EUR/USD ended up where it traded on both the 15th and 23rd of June.
On Thursday, June 29, some quite strong macroeconomic data came out of the US. The Bureau of Economic Analysis revised its GDP figures for the first quarter upwards to 2.0% year on year (YoY) (forecast was 1.3%). As for the labour market, the number of initial jobless claims for the week dropped by almost 30K, reaching the lowest level since the end of May - 239K.
Recall that the Federal Open Market Committee (FOMC) of the US Federal Reserve decided at its June 14 meeting to take a pause in the process of monetary tightening and left the interest rate unchanged at 5.25%. After this, market participants were left to speculate on the regulator's next moves. The released data reinforced confidence in the stability of the country's economy and raised expectations for further dollar interest rate hikes. According to the CME FedWatch Tool, the probability of a rate hike of 25 basis points (bps) at the Fed's July meeting rose to 87%, and the probability that the total rate hike by the end of 2023 will be 50 bps is nearing 40%. As a result, in the middle of Friday, June 30, EUR/USD recorded a local low at 1.0835.
Speaking at an economic forum in Sintra (Portugal) on Wednesday, June 28, Federal Reserve Chairman Jerome Powell stated that further interest rate increases would be driven by a strong labour market and persistently high inflation. However, the core personal consumption expenditures (PCE) data published on June 30 indicated that inflation, although slowly, is declining. Forecasts suggested that the PCE index for June would remain at the previous level of 4.7%, but in reality, it fell to 4.6%. This somewhat dampened the bullish sentiment on the dollar, with the DXY index heading lower and EUR/USD returning to the central zone of the two-week sideways corridor, ending the five-day period at 1.0910.
As for the state of the economy on the other side of the Atlantic, following high preliminary inflation data from Spain and Germany, markets expected the Harmonised Index of Consumer Prices (HICP) in the Eurozone to rise by 0.7% in June, significantly exceeding the 0.2% a month earlier. However, the actual value, although higher than in May, was only slightly so, at 0.3%. Moreover, the preliminary Consumer Price Index (CPI) published on Friday, June 30th, showed a decrease in Eurozone inflation from 6.1% to 5.5% YoY (forecast was 5.6%).
Recall that after hawkish statements from ECB leaders made in mid-June, the markets had already priced in two euro rate hikes, in July and September, each by 25 basis points. Therefore, the fresh European inflation data had little effect on investor sentiment.
Friday, June 30, marked not only the end of the quarter but also the first half of the year. In this regard, representatives from several banks decided to make predictions for the second half of 2023 and the start of 2024. Economists at Credit Agricole see risks of a decrease in EUR/USD from current levels in the near term and predict its gradual recovery starting from Q4 2023. In their opinion, over the next 6-12 months, the pair could rise to 1.1100.
Strategists at Wells Fargo expect the dollar to be fairly stable or even slightly stronger for the rest of 2023. However, they predict a noticeable weakening over the course of the following year. "Given our expectations for a later and shallow recession in the U.S. and a later easing of Fed policy," Wells Fargo analysts write, "we anticipate a later and more gradual depreciation of the U.S. dollar. [...] We predict that by the end of 2023, the trade-weighted U.S. dollar rate will change little compared to the current level, and by 2024 it will have declined by 4.5%."
Economists at Goldman Sachs also updated their EUR/USD forecasts. They too now indicate a smaller drop in the coming months and a more prolonged recovery of the euro by the end of 2023 and the first half of 2024. They predict the pair rate to be at 1.0700 in three months, 1.1000 in six months, and 1.1200 in twelve months.
As for the near-term prospects, at the time of writing this review on the evening of June 30, 50% of analysts voted for the pair's decline, 25% for its rise, and the remaining 25% took a neutral position. Among oscillators on D1, 35% are on the side of the bulls (green), 25% are on the side of the bears (red), and 40% are painted in neutral grey. Among the trend indicators, 90% are coloured green, and only 10% are red. The nearest support for the pair is located around 1.0895-1.0900, followed by 1.0865, 1.0790-1.0815, 1.0745, 1.0670 and, finally, the May 31 low of 1.0635. The bulls will encounter resistance in the area of 1.0925-1.0940, followed by 1.0985, 1.1010, 1.1045, 1.1090-1.1110.
Upcoming events to note include the release of the Manufacturing Purchasing Managers' Index (PMI) for Germany and the US on Monday, July 3. The minutes from the latest FOMC meeting will be published on Wednesday, July 5. The following day, on Thursday, July 6, data on retail sales volumes in the Eurozone will be available. On the same day, the ADP employment report and the PMI for the US service sector will also be published.
Closing out the work week, another batch of data from the US labour market will be released on Friday, July 7, including the unemployment rate and the important nonfarm payroll (NFP) figure. ECB President Christine Lagarde will also deliver a speech on the same day.
Furthermore, traders should be aware that Tuesday, July 4 is a public holiday in the US, as the country observes Independence Day. As a result, the markets will close earlier the day before due to the holiday.
GBP/USD: How Mr. Powell "Defeated" Mr. Bailey
In the previous review, we noted how strongly the words of officials affect quotes. This week was another confirmation of this. On Wednesday, June 28, GBP/USD showed an impressive drop. The cause were the speeches of the Federal Reserve Chair Jerome Powell and Bank of England's Governor Andrew Bailey in Sintra. Mr. Bailey promised that his Central Bank would "do whatever it takes to get inflation to target level". This implies at least two more rate hikes. However, Mr. Powell did not rule out further tightening of the Fed's monetary policy, even though inflation in the US is much lower than in the United Kingdom. As a result of these two speeches, Jerome Powell and the US currency won, and GBP/USD dropped sharply.
The next day, strong US macro statistics added strength to the dollar. If it were not for the data on the Personal Consumption Expenditures (PCE) in the US published at the end of the week, the pound would have suffered quite a bit. But thanks to the PCE, in just a few hours it managed to recover almost all the losses and put the final chord at the mark of 1.2696.
In the mentioned speech in Sintra, Andrew Bailey also stated that "the UK economy has proven much more resilient" than the Central Bank expected. We would like to believe the head of the BoE. However, the data published by the Office for National Statistics (ONS) on June 30 raise certain concerns. Thus, the country's GDP grew in Q1 2023 by 0.1% in quarterly terms and 0.2% in annual terms. And if the first indicator remained at the previous level, then the second showed a significant decline: it turned out to be 0.5% lower than the data for Q4 2022.
According to Credit Suisse economists, the situation facing the Bank of England should be defined as genuinely exceptional. But the slowdown in British GDP does not seem to worry the BoE leadership too much, which is focused on combating high inflation.
Following the May and June meetings, the BoE raised the interest rate by 25 basis points and 50 basis points to 5.00%. Many analysts believe that the regulator may bring it up to 5.50% already at the two upcoming meetings, and then to 6.25%, despite the threat of economic recession. Such steps in the foreseeable future will support the pound. At Credit Suisse, for example, they believe that even though the pound has significantly strengthened since September 2022, GBP/USD still has the potential to grow to 1.3000.
From a technical analysis perspective, the indications of oscillators on D1 appear quite uncertain - a third point to the north, a third to the south, and a third to the east. The picture is clearer for trend indicators - 90% recommend buying, 10% selling. If the pair moves south, it will encounter support levels and zones at 1.2625, 1.2570, 1.2480-1.2510, 1.2330-1.2350, 1.2275, 1.2200-1.2210. In case of the pair's rise, it will meet resistance at levels of 1.2755, 1.2800-1.2815, 1.2850, 1.2940, 1.3000, 1.3050, and 1.3185-1.3210.
As for the events of the coming week, the focus will be on the publication of the PMI in the UK manufacturing sector on Monday, July 3. On Tuesday, July 4, the Bank of England's report will be published, which may shed light on the future course of monetary policy. And at the end of the week, on Friday, July 7, the data on the US labour market, including the level of unemployment and such an important indicator as the number of new jobs outside the agricultural sector (NFP), will be released.
In the events for the upcoming week, one can note Monday, July 3, when the Manufacturing Purchasing Managers' Index (PMI) for the United Kingdom will be published.
USD/JPY: The "Ticket to the Moon" Turned Out to be Multi-Use
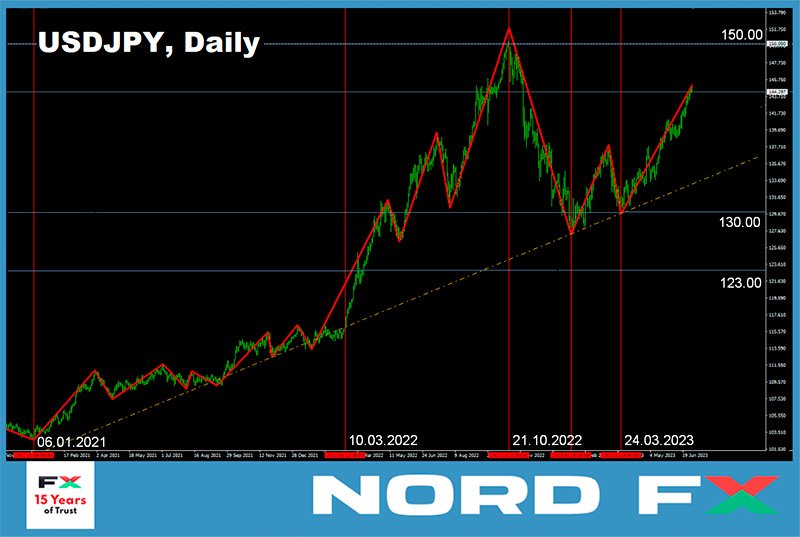
As soon as we mentioned the potential interventions to support the yen in our last review, almost everyone started discussing this topic, including analysts and even officials from the Japanese Government. Of course, our speculations were not the trigger; it was the exchange rate of the Japanese currency. Last week, USD/JPY continued its "flight to the moon," setting another record at the height of 145.06. Interestingly, it was at the 145.00 mark that the Bank of Japan (BoJ) conducted its first intervention in many years.
It has been said a thousand times that increasing divergence in monetary policy between the Bank of Japan and other major central banks is a recipe for further yen weakening. Thus, last week, following the release of US GDP and unemployment claims data, the yield on 10-year US treasury bonds jumped to 3.84%, and two-year bonds to 4.88%, the highest level since March. Therefore, the spread between US and Japanese bonds continues to widen, reflecting the growing divergence in the monetary policy of the Fed and the BoJ and pushing USD/JPY to astronomical heights. Understandably, in such a situation, the question arose about the ability of the Japanese regulator to artificially support its national currency.
Hirokazu Matsuno, the Chief Cabinet Secretary of Japan, stated on Friday, June 30 that the authorities are "closely monitoring currency movements with a high sense of urgency and immediacy." "It's important that the exchange rate moves steadily, reflecting fundamental economic indicators. Recently, sharp unilateral movements have been observed. [We] will take appropriate measures in response to excessive currency movements," promised the high-ranking official.
However, several experts doubt that the Japanese Government and Central Bank have the strength and capability not just to strengthen the yen once, but to maintain it in such a state over an extended period of time. It's enough to recall that less than eight months have passed since the last intervention in November 2023, and here again, USD/JPY is storming the height of 145.00. Since all currency reserves are finite, say Commerzbank specialists, solving this problem will be infinitely difficult, and "all that remains is to hope that officials from the [finance] ministry realize this and do not overestimate their capabilities.".
The monetary policy pursued by the Japanese Government and Central Bank in recent years clearly indicates that their focus is not solely on the yen exchange rate, but on economic indicators. However, it is important to note that one of these indicators is inflation. In this regard, we have seen an acceleration in the Consumer Price Index (CPI) to 3.1% YoY, compared to 3.0% the previous month and 2.7% in February. While these values are significantly lower than those observed in the US, Eurozone, or the UK, no one can guarantee that inflation will not continue to rise further. If the BoJ does not intend to tighten its ultra-easy policy and raise interest rates, the only tool left to maintain the exchange rate is currency interventions. The only remaining question is when they will begin – now or when the rate reaches 150.00, as it did in the autumn of 2022.
Many experts still hold hope that the Bank of Japan will eventually decide to tighten its policy. These hopes allow economists at Danske Bank to forecast a USD/JPY rate below 130.00 within a 6–12-month horizon. Similar predictions are made by strategists at BNP Paribas, who target 130.00 by the end of this year and 123.00 by the end of 2024. However, Wells Fargo's forecast appears more modest, with their specialists expecting the pair to only decrease to 133.00 by the end of 2024. Nonetheless, reaching that level would still be considered a significant achievement for the Japanese currency, as it concluded the past week at 144.29 after the publication of US PCE data.
At the time of writing the review, 60% of analysts, like a week ago, anticipate that the yen will recoup at least some of its losses and push the pair to the south, while the remaining 40% of experts point to the east. However, there are no supporters of the pair's growth this time. It is worth noting that there were only a minimal number of supporters the previous week, with only 10%. Nevertheless, USD/JPY continues its journey to the stars. Ultimately, while experts ponder, the market decides. Regarding this matter, there are no doubts from either trend indicators or oscillators: all 100% on D1 point upwards. However, a quarter of the oscillators actively signal overbought conditions for the pair.
The nearest support level is located in the 143.74 zone, followed by 142.95-143.20, 142.20, 141.40, then 140.90-141.00, 140.60, 138.75-139.05, 138.30, and 137.50. The closest resistance is at 144.55, and then bulls will need to overcome barriers at 145.00-145.30, 146.85-147.15, and 148.85, before reaching the October 2022 high of 151.95.
No significant economic information related to the Japanese economy is expected to be released in the upcoming week. However, unless the Bank of Japan announces currency interventions, which they do not typically preannounce.
CRYPTOCURRENCIES: Institutional Bitcoin Frenzy Gains Momentum
What has been talked about and dreamed of for so long seems to be happening: global financial giants are finally believing in the bright future of Bitcoin. Back in 2021, Matt Hougan, Chief Investment Officer at Bitwise, mentioned that futures-based cryptocurrency ETFs were not suitable for long-term investors due to high associated costs. He stated that once spot-based bitcoin exchange-traded funds (ETFs) emerged, institutional investors would start pouring significant investments. Recently, in an interview with Bloomberg, Hougan announced the dawn of a new era, saying, "Now we have BlackRock raising the flag and stating that BTC has value, that it's an asset in which institutional investors want to invest. I believe we are entering a new era of cryptocurrencies, which I call the 'mainstream era,' and I expect a multi-year bull trend that is just beginning.".
A spot BTC ETF is a fund whose shares are traded on an exchange and track the market or spot price of BTC. The main idea behind such ETFs is to provide institutional investors with access to bitcoin trading without physically owning it, through a regulated and financially familiar product.
Currently, eight major financial institutions have submitted applications to the U.S. Securities and Exchange Commission (SEC) to enter the cryptocurrency market through spot-based ETFs. Alongside investment giant BlackRock, these include global asset managers such as Invesco and Fidelity. Global banks such as JPMorgan, Morgan Stanley, Goldman Sachs, Bank of New York Mellon, Bank of America, Deutsche Bank, HSBC, and Credit Agricole have also joined the bitcoin fever.
It is worth noting that the SEC has previously rejected all similar applications. However, the current situation may be different. SEC Chairman Gary Gensler has confirmed that the SEC considers bitcoin a commodity, opening up broad prospects for the leading cryptocurrency. Cameron Winklevoss, one of the founders of the cryptocurrency exchange Gemini, has confirmed that institutional investors are ready to start buying BTC, expecting the approval of spot-based BTC funds. "Bitcoin was the obvious and most profitable investment of the past decade. But it will remain the same in this decade," said Winklevoss. This sentiment is shared by Hugh Hendry, the manager of Eclectica Asset Management hedge fund, who believes that BTC could triple its market capitalization in the medium term.
When it comes to altcoins, the situation is somewhat more challenging. Max Keiser, a popular bitcoin maximalist and now an advisor to the President of El Salvador, believes that Gary Gensler has enough technical and political tools at his disposal to classify XRP and ETH as securities, which would ultimately kill these altcoins. "The Securities and Exchange Commission is working for the banking cartel, engaging in racketeering in the interest of financial structures," Keiser wrote in his blog.
It is worth noting that the SEC has filed lawsuits against Binance and Coinbase, accusing the platforms of selling unregistered securities. In the court documents, the Commission identified Solana (SOL), Cardano (ADA), Polygon (MATIC), Coti (COTI), Algorand (ALGO), Filecoin (FIL), Cosmos (ATOM), Sandbox (SAND), Axie Infinity (AXS), and Decentraland (MANA) as securities. Several cryptocurrency platforms have already taken this SEC statement as guidance and, to avoid potential claims, have delisted these altcoins.
The statements above indicate that bitcoin is likely to maintain its market leadership in the foreseeable future. Mark Yusko, the founder and CEO of Morgan Creek Capital, believes that the bullish trend of BTC could continue until the next halving, which is expected to occur in April 2024. "I think the rally is just beginning. We have just entered what is known as the crypto summer season," wrote the expert. However, he cautioned that after the speculative surge caused by the halving, there is typically an excessive reaction in the opposite direction, known as crypto winter.
According to an analyst known as InvestAnswers, in addition to the upcoming halving, the institutional adoption that has begun will help drive the growth of BTC by increasing demand for the asset and reducing its supply. The aforementioned investment giants collectively manage trillions of dollars in assets, while the market capitalization of Bitcoin is just over $0.5 trillion. Only a tiny fraction of this $0.5 trillion is actively traded on the market.
Peter Schiff, the president of Euro Pacific Capital and a staunch critic of Bitcoin, holds the opposite view. He believes that there is "nothing more low-quality than cryptocurrencies." "Until recently, the rally in highly speculative assets excluded bitcoin. Now that it has finally joined the party, it is likely to end soon," he stated. According to Schiff, such rallies typically come to an end when "the lowest-quality things" eventually join them, referring to digital assets.
Looking at the BTC/USD chart, there is a suspicion that Peter Schiff might be right. After soaring on the news of BlackRock's and other institutional players' interest, the pair has been trading sideways within a narrow range of $28,850 to $31,000 for the past week. According to analysts, besides concerns about SEC actions, bitcoin and the cryptocurrency market are currently being weighed down by miners. Breaking the $30,000 barrier prompted them to send a record volume of coins to exchanges ($128 million in just the past week). Crypto miners fear a price reversal from a significant level due to increased regulatory scrutiny in the industry. Additionally, the average cost of mining remains higher than the current prices of digital assets due to the doubling of computational difficulty over the past year and a half. As a result, miners are forced to sell their coin holdings to sustain production activities, cover ongoing expenses, and repay debts.
As of the time of writing the review, on Friday evening, June 30, BTC/USD is trading around $30,420. The total market capitalization of the crypto market has slightly decreased to $1.191 trillion ($1.196 trillion a week ago). The Crypto Fear & Greed Index is on the border between the Greed and Neutral zones, dropping from 65 to 56 points over the week.
New catalysts are needed for further upward movement. One of them could be the expiration of futures contracts for ethereum and bitcoin on Friday, June 30. According to AmberDate, over 150,000 BTC options with a total value of around $4.57 billion were settled on the Deribit Exchange. Additionally, $2.3 billion worth of contracts were settled for ETH. According to experts from CoinGape, this could trigger significant volatility in July and provide strong support for these assets. However, much will also depend on the macroeconomic data coming out of the United States.
As of the evening of June 30, ETH/USD is trading around $1,920. Several analysts believe that ethereum still has the potential for further bullish momentum. Popular expert Ali Martinez points out that ETH may encounter significant resistance near the $2,000-2,060 range, as over 832,000 addresses previously opened sales in this range. However, if ethereum surpasses this zone, it has a good chance of experiencing a sharp impulse towards $2,330. Furthermore, there is potential for further growth towards $2,750 in the long term.
And finally, a bit of history. Ten years ago, Davinci Jeremie posted a YouTube video strongly recommending his viewers to spend at least one dollar to purchase bitcoin and explained why BTC would grow in the coming years. At that time, Jeremy's forecast angered or amused most people who did not want to listen to his recommendation. However, they now deeply regret it as they could have acquired over 1,000 BTC for the $1 they would have invested, which is worth $30 million today.
In a recent interview, Jeremy emphasized that it is still worthwhile to buy bitcoin. According to him, only 2 percent of the world's population owns cryptocurrency, so it still has the potential to delight its investors with new records. "However, there is also one problem," says Jeremy. "Everyone wants to own a whole bitcoin. No one wants to go to a store and say, 'Can I get one trillionth of an apple?' So, although bitcoin is divisible, this property is essentially its Achilles' heel. The solution to this problem is to make the display of small fractions of BTC more user-friendly and understandable. For example, instead of writing amounts like 0.00001 BTC, they could be replaced by the equivalent amount of satoshis, which is the smallest indivisible unit of one Bitcoin valued at 0.00000001 BTC."
Early Cracks in Canada’s Labour Market Won’t Prevent a July Rate Hike
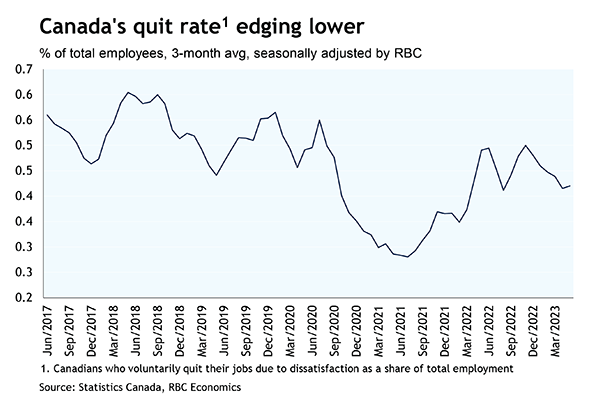
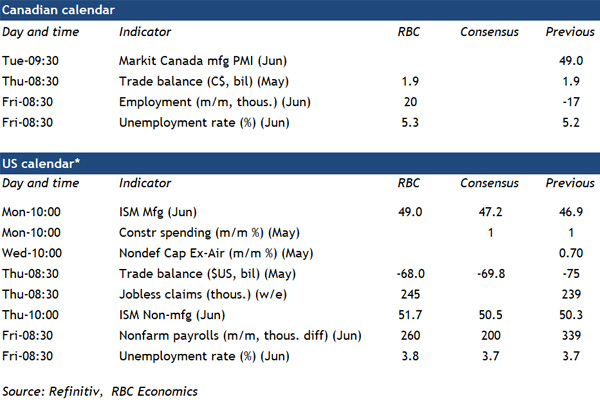
All eyes will be on next week’s labour market data as the Bank of Canada weighs whether raise interest rates again in July. Though Canadian labour markets remain exceptionally tight, job openings have been trending lower, down 21% from peak levels as of April. And May’s unemployment rate inched up—the first increase since August 2022. Meantime, the share of workers quitting their jobs (an indicator of worker confidence in labour markets) has been edging lower. Almost half of businesses are still reporting labour shortages as a key frustration that’s limiting their sales or production—and we still look for a 20,000 increase in employment in June. But with population growth also surging, this won’t be enough to prevent another uptick in the unemployment rate to 5.3%.
The labour report will be the final major economic data release before the BoC meets again on July 12th. And we anticipate an additional 25 basis point hike to emerge from that meeting. Though there are signs that labour markets are softening, the unemployment rate is still historically very low. Inflation has been easing, but slowly, and consumer spending is still running firm. Consumer delinquency rates have been rising and household debt payments will continue to increase due to the lagged impact of earlier interest rate hikes. But economic momentum has likely been too firm for the BoC to change course just yet.
The U.S. Federal Reserve—which will also be eyeing June employment numbers next week—is also likely to hike interest rates by another 25 basis points after taking a pass on an increase in June. The U.S. unemployment rate also edged higher in May. And weaknesses are emerging under the surface in the jobs market. Still, we expect another uptick in the unemployment rate in June but to a 3.8% rate that is still historically very low. With labour markets still too tight, and inflation pressures too firm, the Fed is unlikely to be deterred from at least one more interest rate increase.
- Canadian exports likely ticked down 0.4% in May, mainly driven by a price-related decline in energy exports (oil prices were 10%in May) with offset from higher trade in the auto sector as vehicle production improves. We assume imports also edged higher to leave the trade balance little changed.
- U.S. advance economic indicator reports showed May’s exports of goods fell by $1 billion from the prior month, largely from a drop in food exports. Imports of goods also slowed, by $6.9 billion in May, largest decline saw in the consumer goods sector (-7.3%) with lower oil prices likely also pushing industrial supplies imports lower.
- U.S. jobs report in June likely saw 260K increase in the payroll employment, down from the +339K in May, but still at a high level. We expect the unemployment rate likely edged up to 3.8% (calculated separately from the household survey), from 3.7% in May.