Sample Category Title
Early Cracks in Canada’s Labour Market Won’t Prevent a July Rate Hike
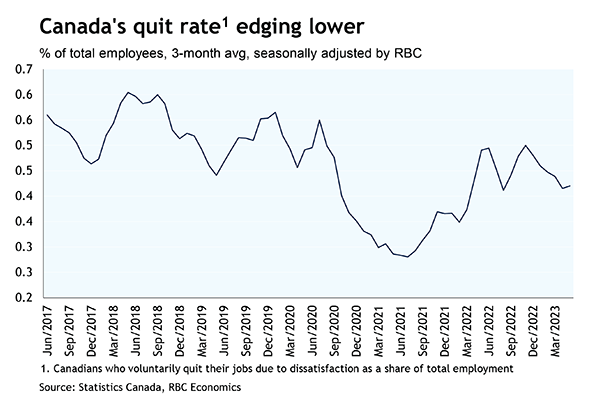
All eyes will be on next week’s labour market data as the Bank of Canada weighs whether raise interest rates again in July. Though Canadian labour markets remain exceptionally tight, job openings have been trending lower, down 21% from peak levels as of April. And May’s unemployment rate inched up—the first increase since August 2022. Meantime, the share of workers quitting their jobs (an indicator of worker confidence in labour markets) has been edging lower. Almost half of businesses are still reporting labour shortages as a key frustration that’s limiting their sales or production—and we still look for a 20,000 increase in employment in June. But with population growth also surging, this won’t be enough to prevent another uptick in the unemployment rate to 5.3%.
The labour report will be the final major economic data release before the BoC meets again on July 12th. And we anticipate an additional 25 basis point hike to emerge from that meeting. Though there are signs that labour markets are softening, the unemployment rate is still historically very low. Inflation has been easing, but slowly, and consumer spending is still running firm. Consumer delinquency rates have been rising and household debt payments will continue to increase due to the lagged impact of earlier interest rate hikes. But economic momentum has likely been too firm for the BoC to change course just yet.
The U.S. Federal Reserve—which will also be eyeing June employment numbers next week—is also likely to hike interest rates by another 25 basis points after taking a pass on an increase in June. The U.S. unemployment rate also edged higher in May. And weaknesses are emerging under the surface in the jobs market. Still, we expect another uptick in the unemployment rate in June but to a 3.8% rate that is still historically very low. With labour markets still too tight, and inflation pressures too firm, the Fed is unlikely to be deterred from at least one more interest rate increase.
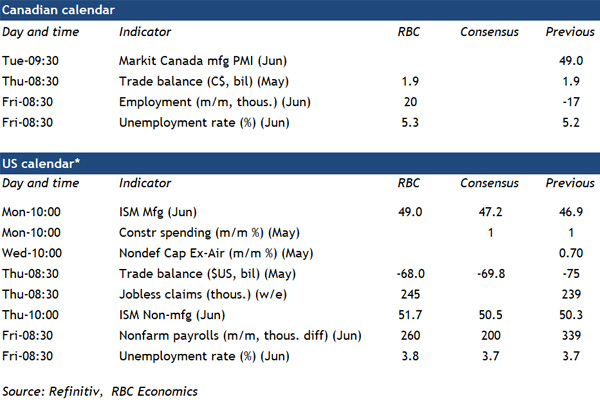
- Canadian exports likely ticked down 0.4% in May, mainly driven by a price-related decline in energy exports (oil prices were 10%in May) with offset from higher trade in the auto sector as vehicle production improves. We assume imports also edged higher to leave the trade balance little changed.
- U.S. advance economic indicator reports showed May’s exports of goods fell by $1 billion from the prior month, largely from a drop in food exports. Imports of goods also slowed, by $6.9 billion in May, largest decline saw in the consumer goods sector (-7.3%) with lower oil prices likely also pushing industrial supplies imports lower.
- U.S. jobs report in June likely saw 260K increase in the payroll employment, down from the +339K in May, but still at a high level. We expect the unemployment rate likely edged up to 3.8% (calculated separately from the household survey), from 3.7% in May.
Markets Resist Fed’s Outlook of Multiple Hikes: Bonds and Stocks Disagree, Dollar Rally Halted
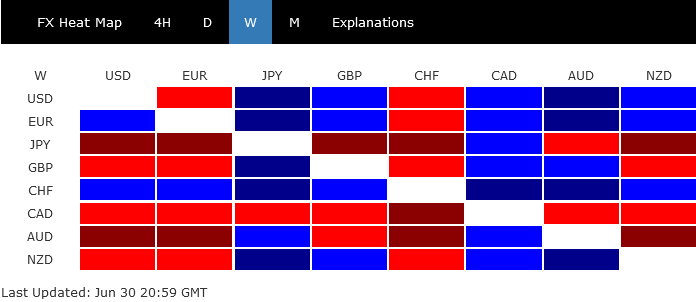
Dollar bulls experienced a somewhat disheartening week, as the initial rally supported by hawkish remarks from Fed Chair was halted by subsequent inflation data release. Consequently, the greenback managed to secure only the third position for the week, trailing behind Swiss Franc and Euro.
The vigorous late-week rally in US stocks, coupled with the sluggishness of benchmark yield, indicates that the markets remain unconvinced by FOMC's projection of two or more rate hikes this year. However, with the tightening cycle at its current phase, all outcomes are highly data-dependent, and the week ahead is packed with significant data releases that traders will need to navigate.
Back to the currency markets, Canadian Dollar emerged as the worst performer of the past week, though this appears to be more a result of a slowing down and consolidation of its strong gains from June, rather than a bearish signal. Yen, as the second-worst performer, confirms its ongoing weakness with little doubt. Risk-sensitive currencies the Aussie, Kiwi, and Sterling delivered mixed results, reflecting the prevailing uncertainties in the global financial markets.
Slowing inflation offset hawkish Fed Powell, S&P 500 resumed up trend
Fed Chair Jerome Powell struck a decidedly hawkish tone at the ECB Forum last week. Referring to the latest economic projections, Powell noted that a "strong majority" of FOMC anticipates "two or more" rate hikes by year's end. Further, he did not rule out the possibility of rate hikes at "consecutive meetings". However, market's response suggested a different interpretation, particularly following Friday's economic data which revealed a slowdown in both headline and PCE inflation.
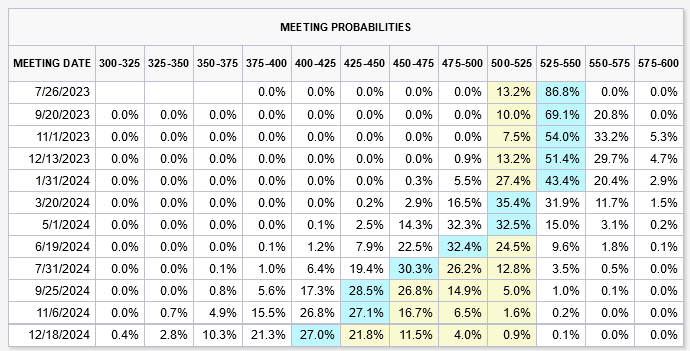
The prospect of a 25 bps hike at the upcoming meeting on July 26 has admitted surged to 86.8%, up from 71.9% just a week ago. However, the likelihood of another subsequent hike this year does not exceed 40%. The expectation for the first rate cut, on the other hand, has been pushed further out, with only around a 55% chance priced in for March 2024.
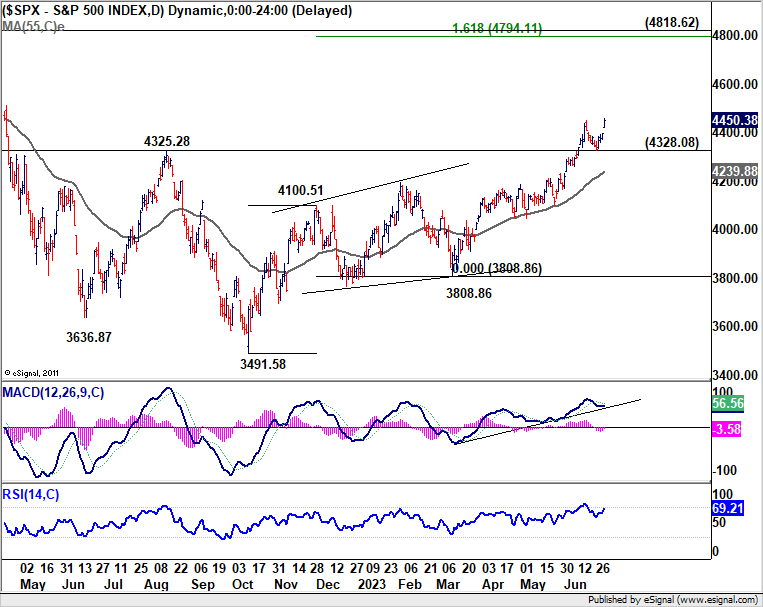
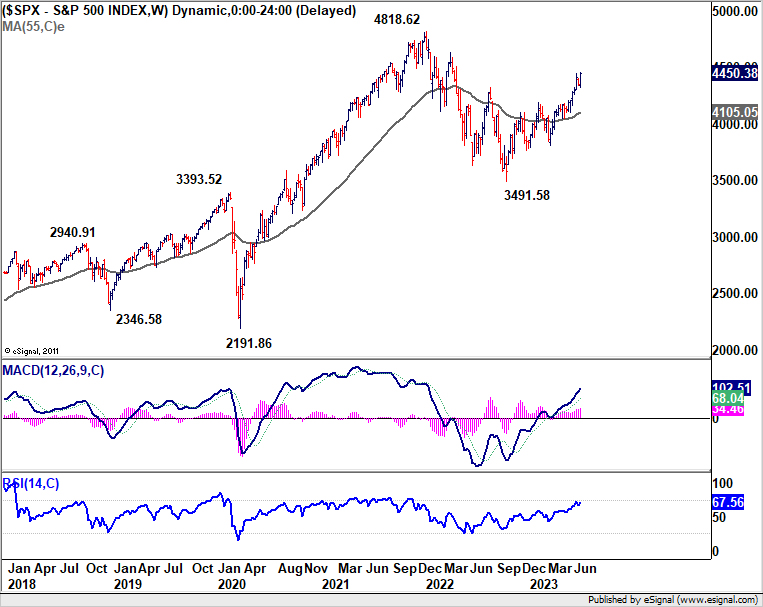
The robust rally in the S&P 500 on Friday, marked by a gap up and a strong close above prior resistance at 4448.47, attests to the bullish momentum in US stocks following PCE data release. This strong performance confirms resumption of the uptrend from 3491.58. Near-term outlook will remain bullish as long as 4328.08 support holds. Next target stands at 161.8% projection of 3491.58 to 4100.51 from 3808.86 at 4794.11, which is close to 2022 high of 4818.62.
10-year yield struggled for momentum, but stays near term bullish
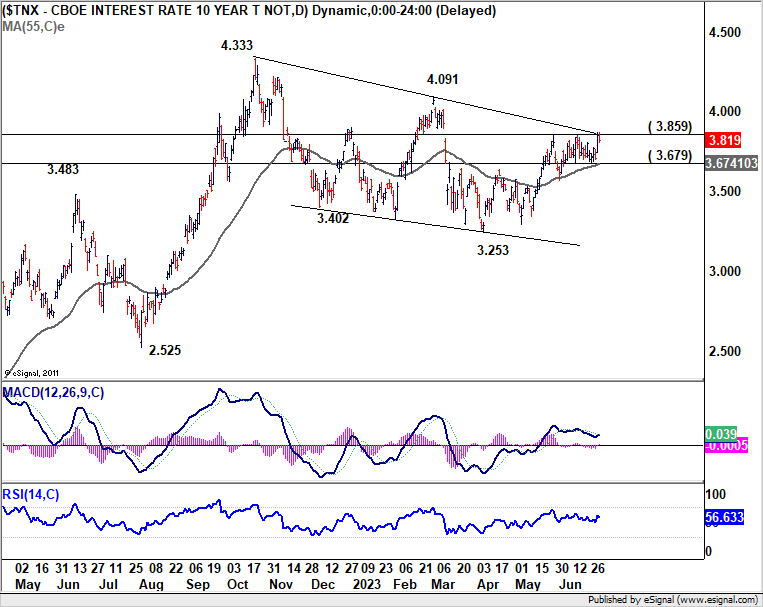
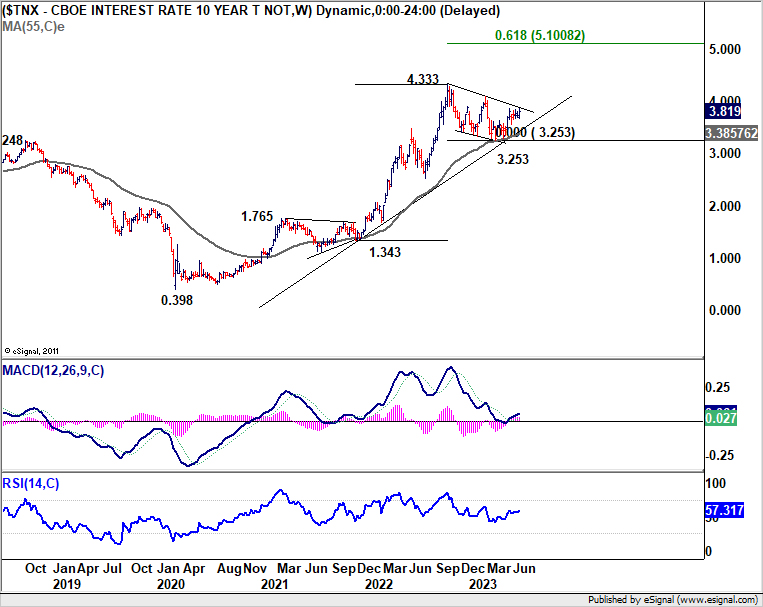
The rally in 10-year yield has been far less convincing, facing challenges to maintain its momentum in the aftermath of PCE inflation data. Despite breaching 3.859 resistance level, TNX failed to close above this mark. Nonetheless, near-term outlook remains bullish as long as 3.679 support level holds firm.
A decisive break above 3.859 will confirm resumption of the overall rise from 3.253, and would further reinforce the view that correction from 4.333 peak has concluded with a three-wave decline to 3.253, upon hitting the 55 W EMA. In this event, next target would be 4.091 structural resistance.
Dollar index failed to build upside momentum
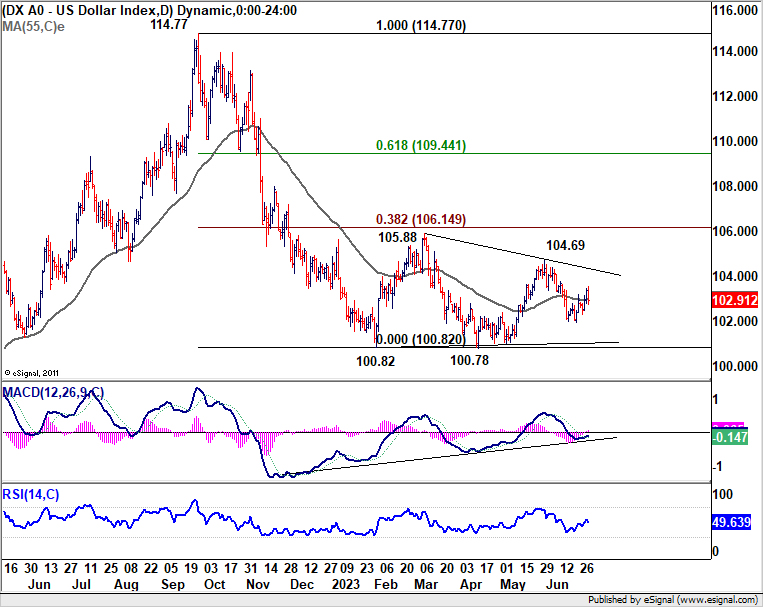
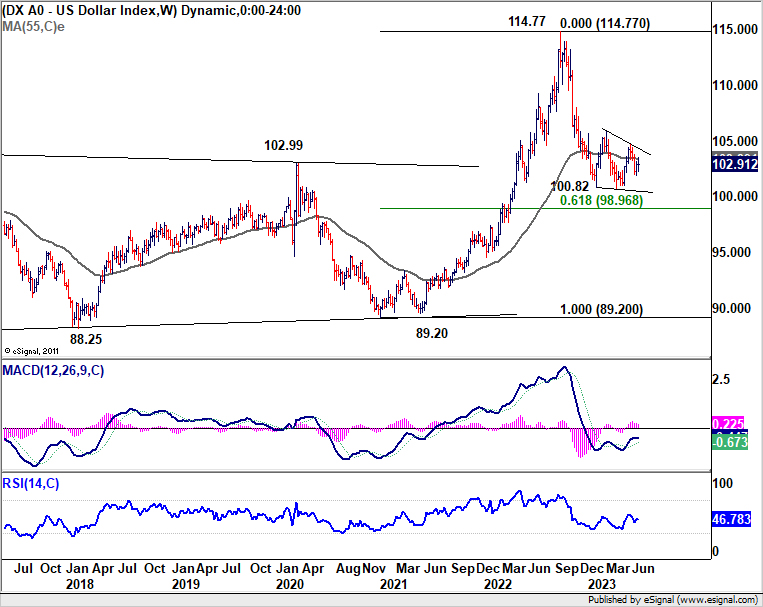
Dollar Index gyrated higher last week but failed to build upside momentum. Dollar's sluggishness against Euro was offset by its rally against Yen and others. Technically speaking, fall from 104.69 is likely not over yet. Break through last week's low at 101.92 is mildly in favor to retest 100.78 low. But even in this bearish case, based on the current momentum, firm break of 100.78 is unlikely on first attempt. At least, the greenback's downside momentum would be capped as long as Yen doesn't stage a strong bullish reversal.
Meanwhile, extended rally and sustained trading above 55 D EMA would argue that consolidation from 100.82 is extending with another rising leg, with prospect of rise breaking through 104.69. The next move inside the recent range would very much depend on forthcoming economic data including ISM indexes and non-farm payrolls, and their impact on stocks and yields.
Gold's decline slows as it nears key fibonacci Level
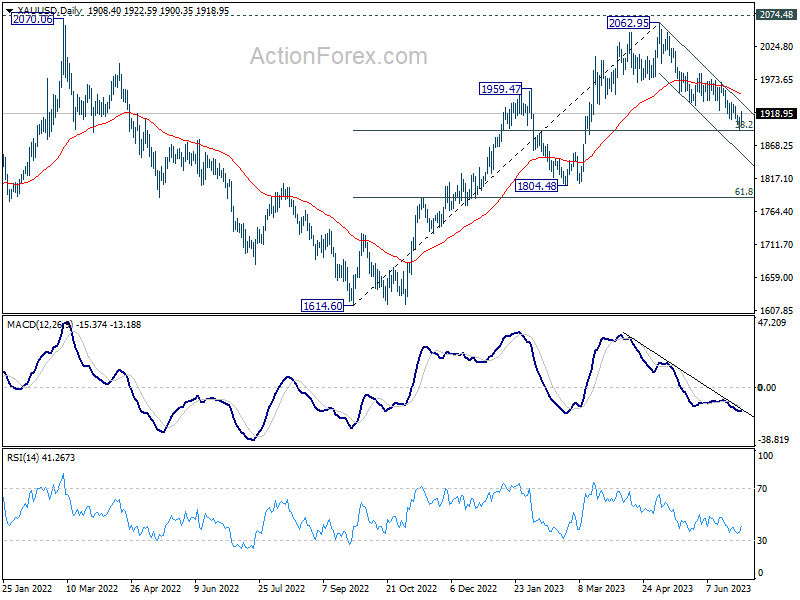
The indecisiveness surrounding Dollar's trajectory is echoed in Gold's development. Gold's slide from its peak of 2062.95 continued last week, which saw it hitting as low as 1892.76. However, decrease in downward momentum is apparent, as suggested by bullish convergence in 4H MACD, as Gold approaches 38.2% retracement of 1614.60 to 2062.95 at 1891.68.
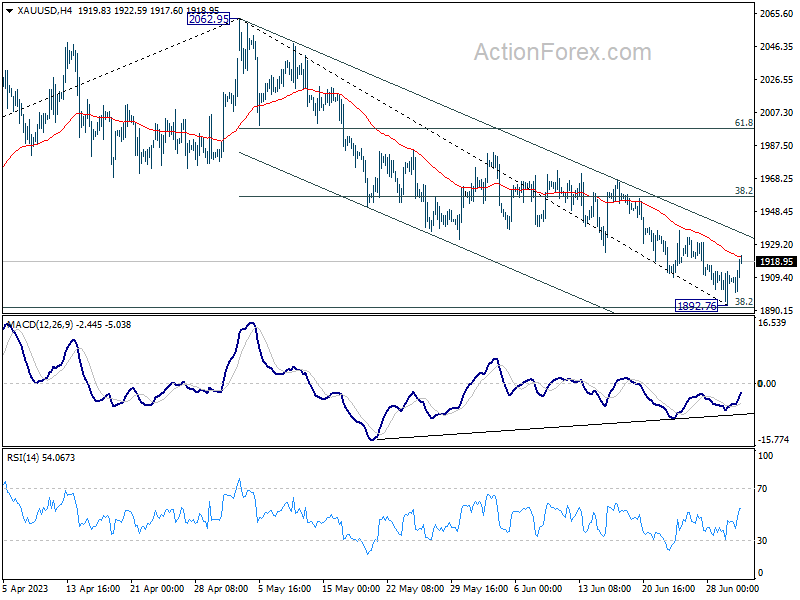
A robust rebound from the current level, followed by decisive break above 55D EMA (now at 1950.30), would suggest completion of the correction from 2062.95. In this bullish scenario, further rise could be expected to 61.8% retracement of the decline from 2062.95 to 1892.76 at 1997.93, with prospect of at least a brief breach of 2000 handle. This move could accompany a descent in Dollar Index towards the aforementioned 100.78 support.
Conversely, if sellers could display some conviction and pushes Gold through 1891.68 fibonacci level sustainably, deeper slump would be seen to 1084.48 support, even still as part of a corrective move. In this case, Dollar index could finally pick up some upside momentum towards 104.69 resistance.
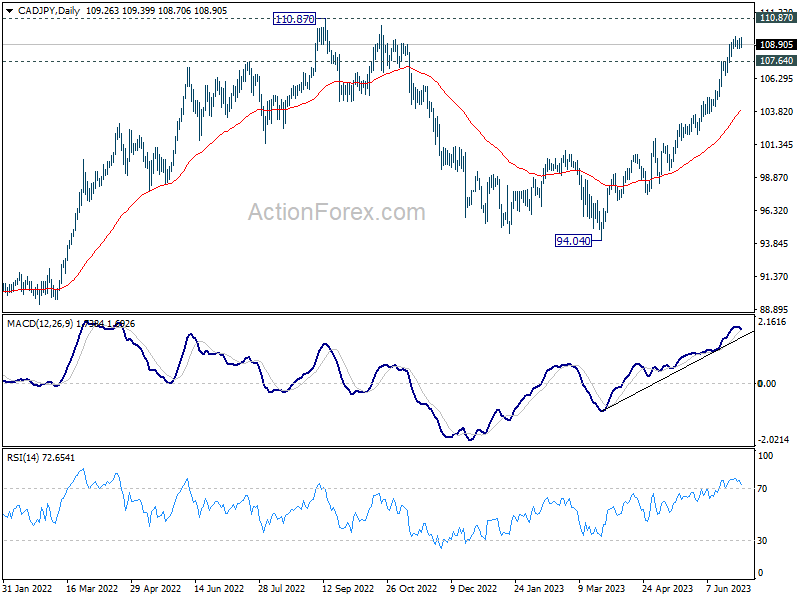
CAD/JPY ended as June's top winner, but a top is near?
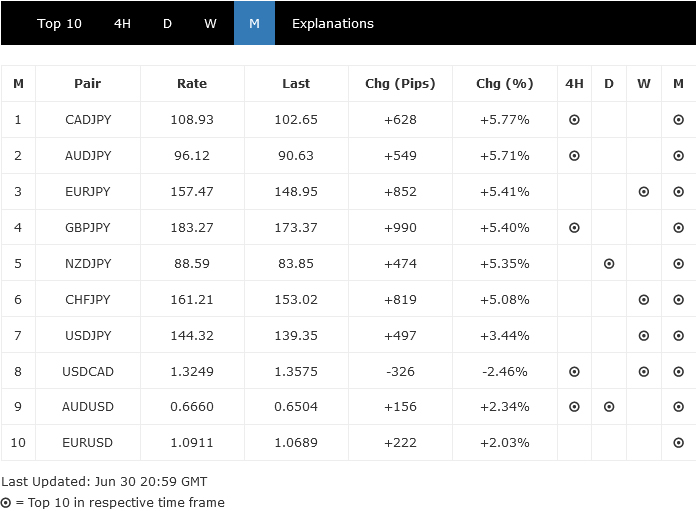
CAD/JPY ended as the biggest mover in June, gaining 5.77%, but others were not too far way, with AUD/JPY, EUR/JPY, GBP/JPY, NZD/JPY and CHF/JPY all rose more than 5%.
Divergence in monetary policy was a clear factor in driving the selloff in Yen. On the one hand, BoJ is still no where near exiting its ultra-loose monetary policy. BoJ Governor Kazuo Ueda was clear that inflation is going to slow later this year, and then bounces in 2024. If the second phase, the re-acceleration in inflation, materialize, there would be "good reason to shift policy".
On the other hand, BoC and RBA surprised the markets this month by raising interest rates. While headline inflation has generally slowed, it remained too high in all major countries and regions, and core inflation showed larger than expected persistence. Tightening is not finished with Fed, ECB, BoE, and likely not even SNB and RBNZ.
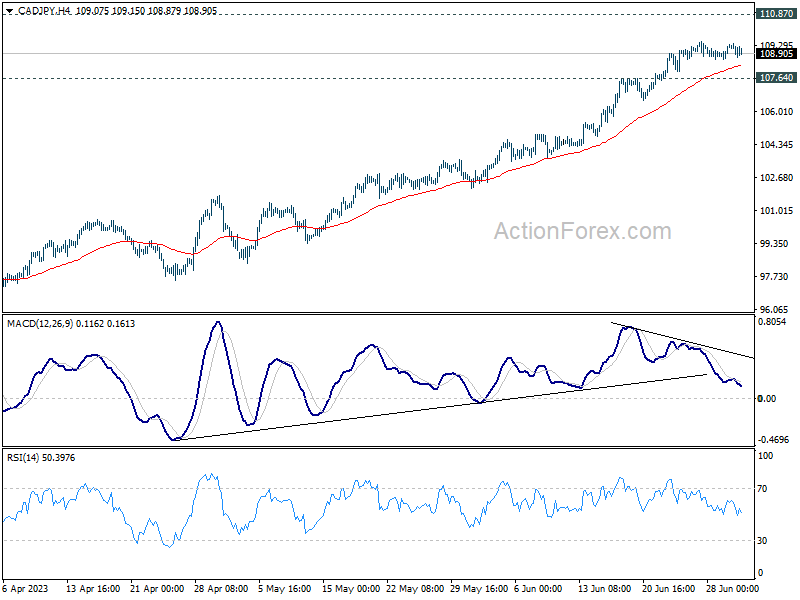
While CAD/JPY's up trend continued last week, upside momentum is waning, as seen in bearish divergence condition in 4 H MACD. The cross might be ready to peak around 110.87 key resistance (2022 high). Break of 107.64 resistance turn support will argue that it's already starting to correct the rally from 94.04, and target 55 D EMA (104.00).
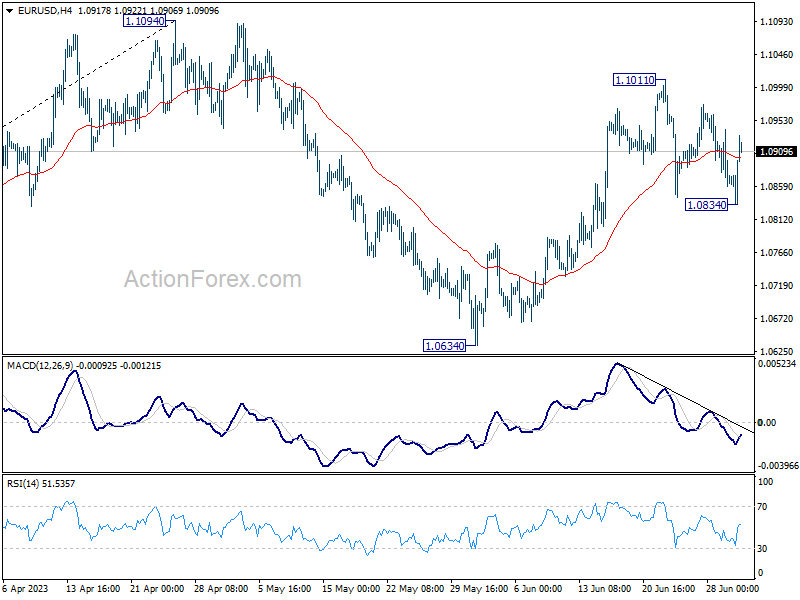
EUR/USD Weekly Outlook
EUR/USD's consolidation from 1.1011 short term top continued last week but drew strong support from 55 D EMA (now at 1.0805) again. Initial bias stays neutral this week first. On the upside, break of 1.1011 will resume the rise from 1.0634 and target 1.1094 resistance. Decisive break there will resume larger up trend from 0.9534 to 1.1273 fibonacci level. However, firm break of 1.0834 will turn bias to the downside for 1.0634 support instead.
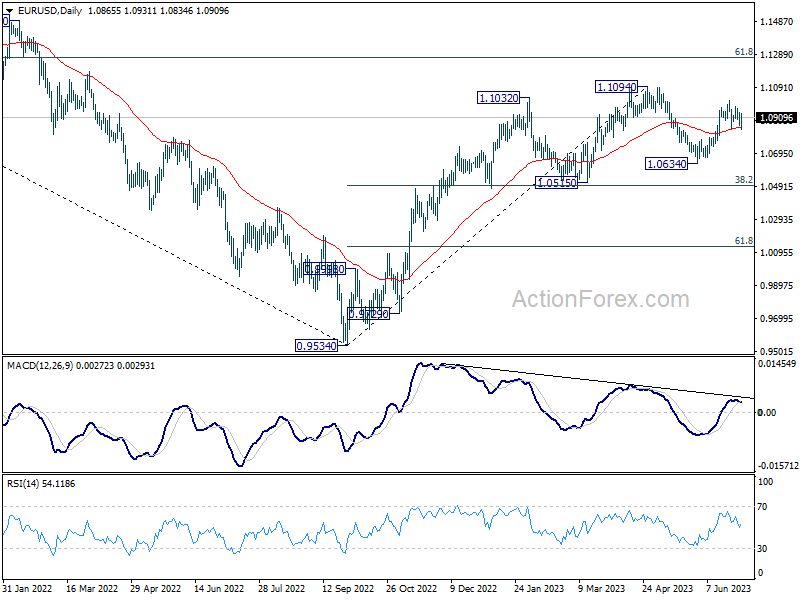
In the bigger picture, as long as 1.0515 support holds, rise from 0.9534 (2022 low) would still extend higher. Sustained break of 61.8% retracement of 1.2348 (2021 high) to 0.9534 at 1.1273 will solidify the case of bullish trend reversal and target 1.2348 resistance next (2021 high).
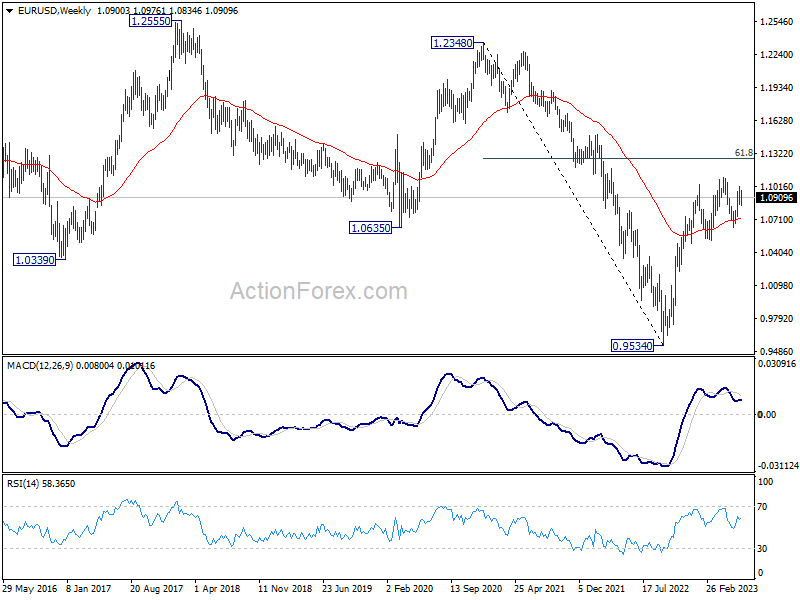
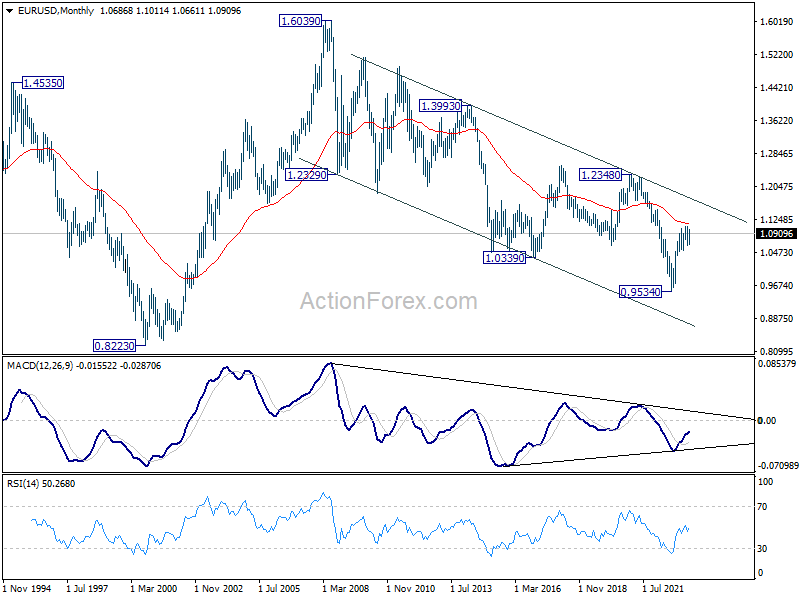
In the long term picture, focus stays on 55 M EMA (now at 1.1131). Rejection by this EMA will revive long term bearishness. However, sustained break above here will be affirm the case of long term bullish reversal and target 1.2348 resistance for confirmation.
EUR/USD Weekly Outlook
EUR/USD's consolidation from 1.1011 short term top continued last week but drew strong support from 55 D EMA (now at 1.0805) again. Initial bias stays neutral this week first. On the upside, break of 1.1011 will resume the rise from 1.0634 and target 1.1094 resistance. Decisive break there will resume larger up trend from 0.9534 to 1.1273 fibonacci level. However, firm break of 1.0834 will turn bias to the downside for 1.0634 support instead.
In the bigger picture, as long as 1.0515 support holds, rise from 0.9534 (2022 low) would still extend higher. Sustained break of 61.8% retracement of 1.2348 (2021 high) to 0.9534 at 1.1273 will solidify the case of bullish trend reversal and target 1.2348 resistance next (2021 high).
In the long term picture, focus stays on 55 M EMA (now at 1.1131). Rejection by this EMA will revive long term bearishness. However, sustained break above here will be affirm the case of long term bullish reversal and target 1.2348 resistance for confirmation.
USD/JPY Weekly Outlook
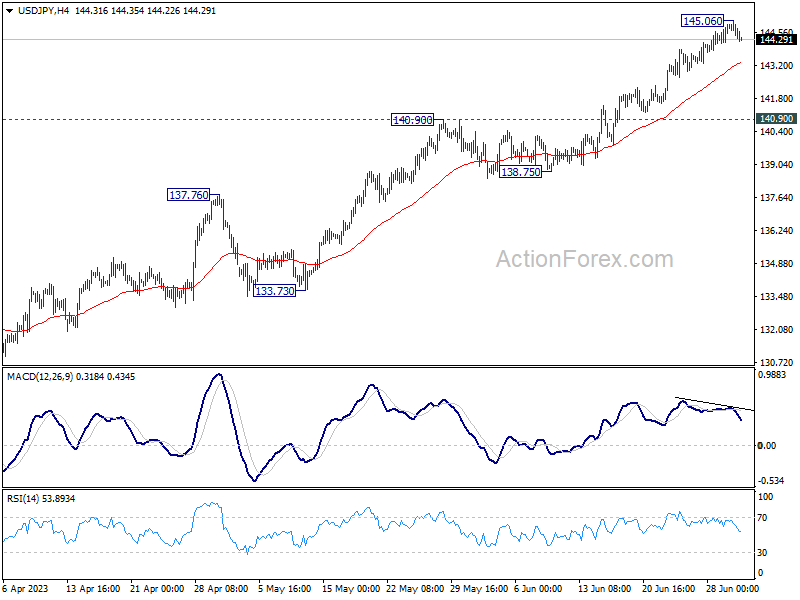
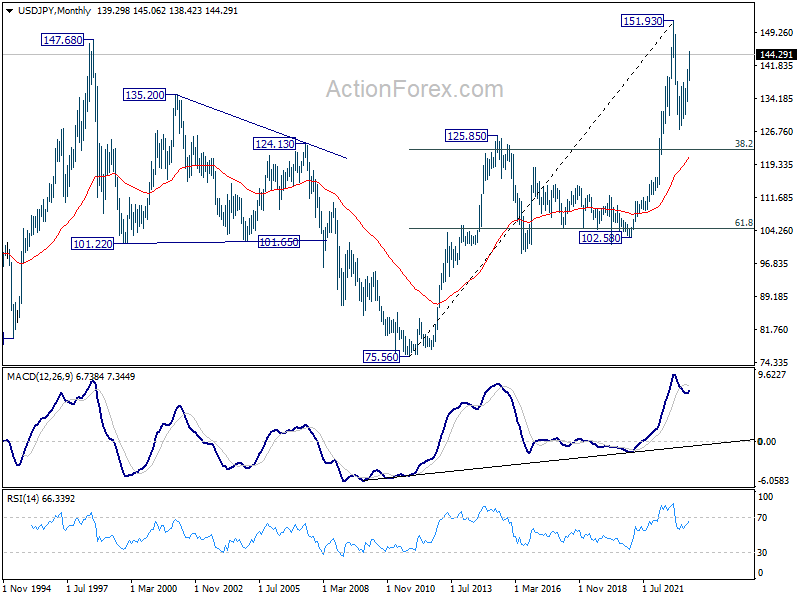
USD/JPY's rally from 127.20 continued last week but retreated after hitting 145.06. Upside momentum was also diminishing as seen in 4 H MACD. Initial bias remains neutral this week for consolidations first. Break of 55 4H EMA (now at 143.28) could trigger deeper correction. But further rally will remain in favor as long as 140.90 resistance turned support holds. On the upside, break of 145.06 will resume larger rise to 161.8% projection of 127.20 to 137.90 from 129.62 at 146.93.
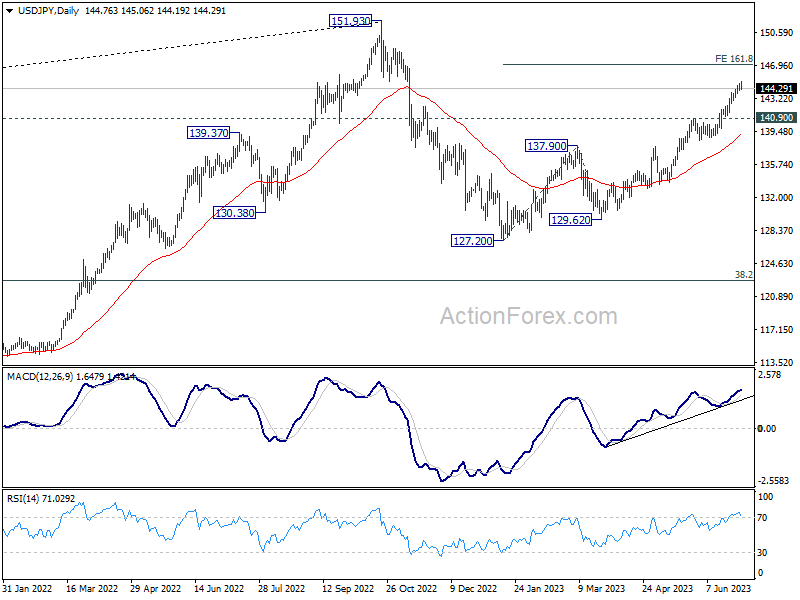
In the bigger picture, rise from 127.20 is currently seen as the second leg of the corrective pattern from 151.93 high. Further rally is expected as long as 138.75 support holds, to retest 151.93. But strong resistance could be seen there to limit upside. Break of 138.75 will indicate the the third leg has started back towards 127.20.
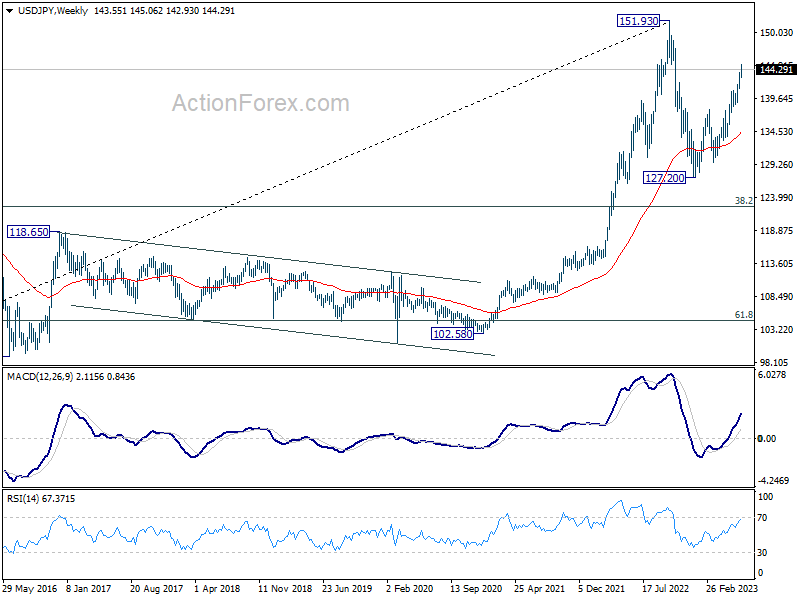
In the long term picture, price action from 151.93 is seen as developing into a corrective pattern to up trend from 75.56 (2011 low). While deeper decline cannot be ruled out, downside should be contained by 38.2% retracement of 75.56 to 151.93 at 122.75.
GBP/USD Weekly Outlook
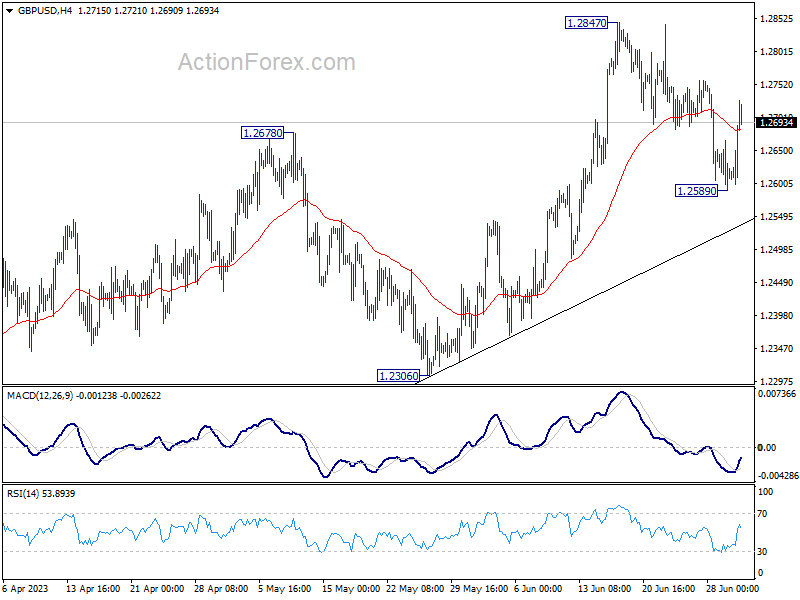
GBP/USD's pull back from 1.2847 could have completed after dipping to 1.2589 last week. Initial bias remains mildly on the upside this week for retesting 1.2847. Firm break there will resume larger up trend from 1.0351, to 61.8% projection of 1.0351 to 1.2445 from 1.1801 at 1.3095. On the downside, though, break of 1.2589 will extend the fall to 55 D EMA (now at 1.2535).
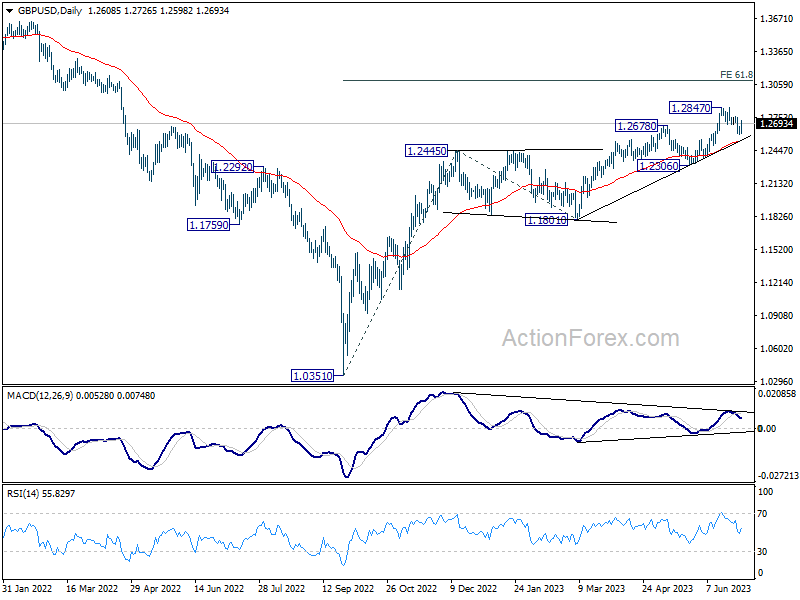
In the bigger picture, the strong support from 55 W EMA (now at 1.2341) is a medium term bullish sign. Outlook will stay bullish as long as 1.2306 support holds. Rise from 1.0351 medium term bottom (2022 low) is expected to extend further to retest 1.4248 key resistance (2021 high).
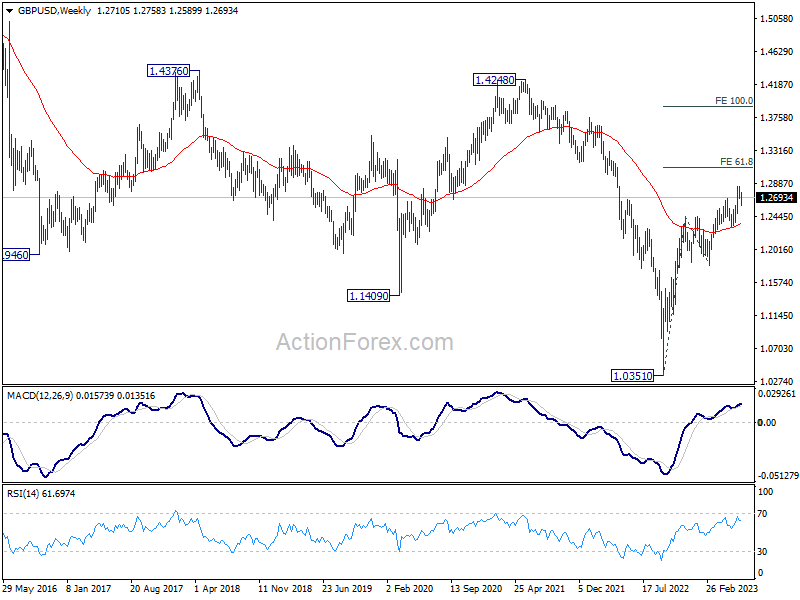
In the long term picture, immediate focus is on 55 M EMA (now at 1.2919). Sustained trading above there add to the case of long term bullish reversal. Nevertheless, break of 1.4248 resistance (2021 high), and 38.2% retracement of 2.1161 (2007 high) to 1.0351 at 1.4480 is needed to confirm. Otherwise, long term outlook is just neutral at best.
USD/CHF Weekly Outlook
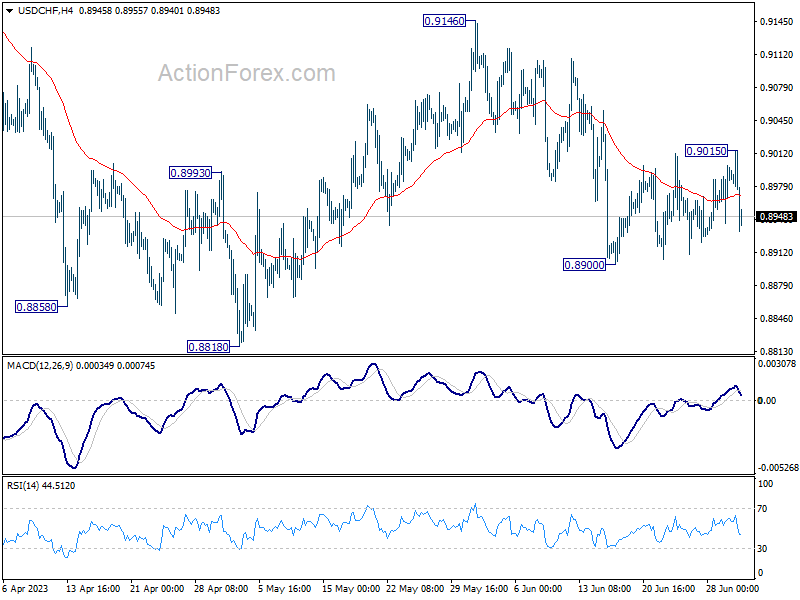
USD/CHF stayed in consolidation above 0.8900 last week, with recovery capped by falling 55 D EMA (now at 0.9013). Near term outlook stays bearish for now. On the downside, break of 0.8900 will resume the fall from 0.9146 to 0.8818 low or below. On the upside, above 0.9015 will bring stronger rise towards 0.9146 resistance instead.
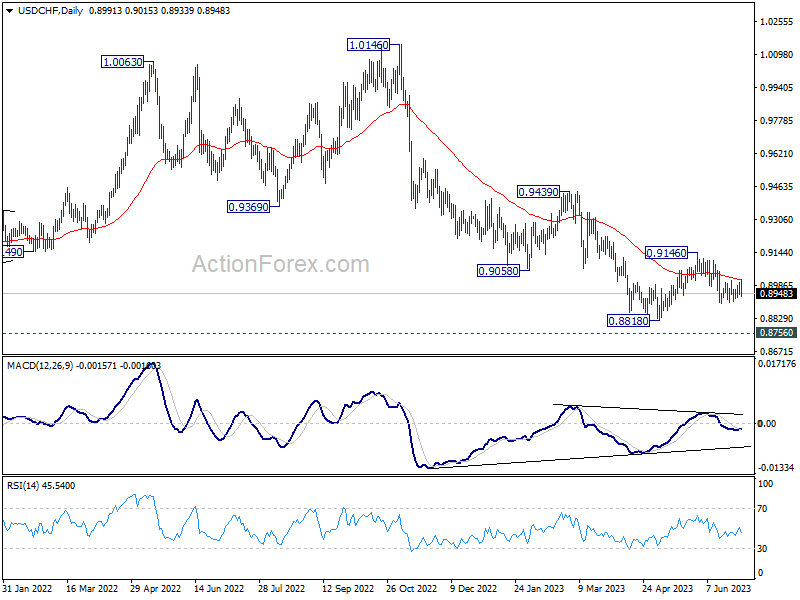
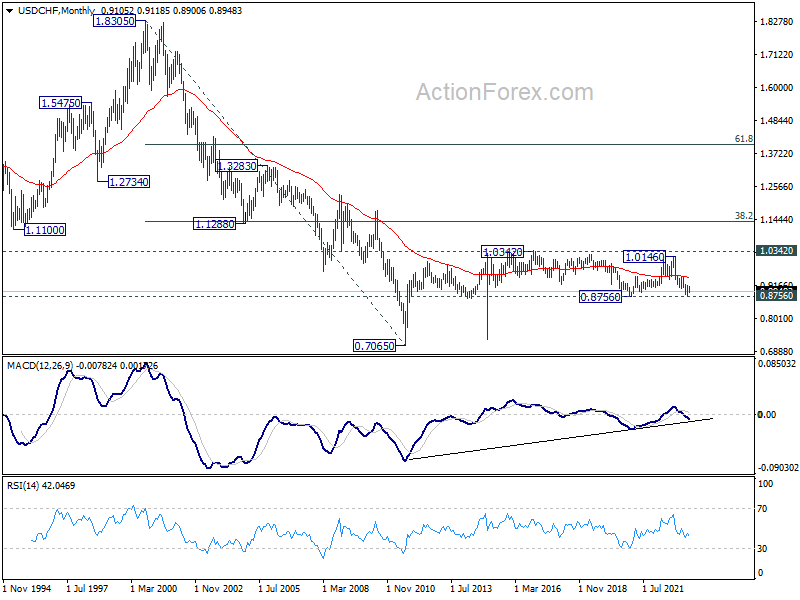
In the bigger picture, fall from 1.1046 (2022 high) is seen as a leg in the long term range pattern from 1.0342 (2016 high). While further decline cannot be ruled out, strong support is expected from 0.8756 long term support to bring reversal. Firm break of 0.9146 resistance should confirm medium term bottoming.
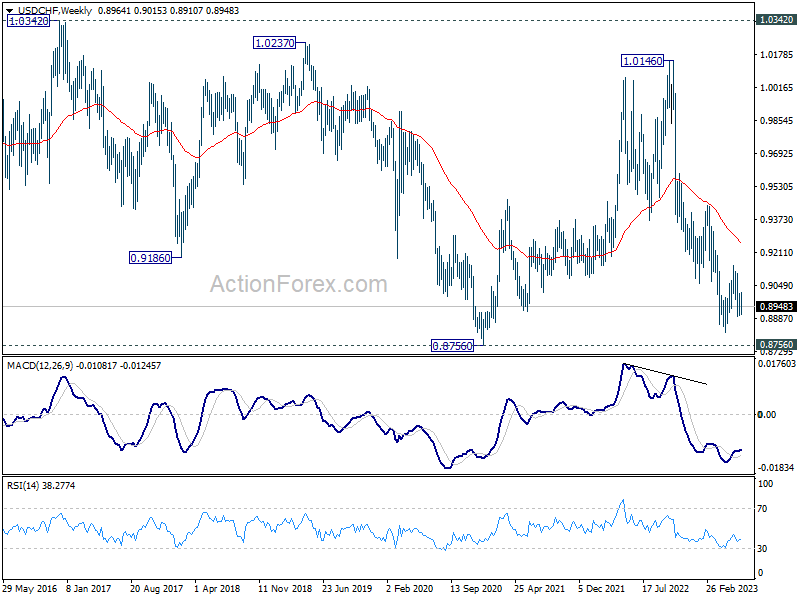
In the long term picture, long term sideway pattern from 1.0342 (2016 high) is expected to continue between 0.8756/1.0342. However, sustained break of 0.8756 will open up deeper fall back towards 0.7065 (2011 low).
AUD/USD Weekly Report
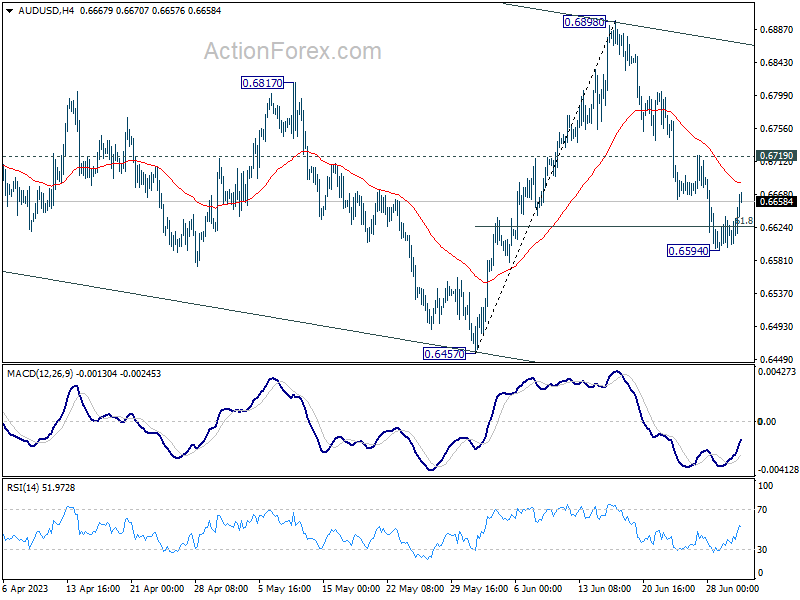
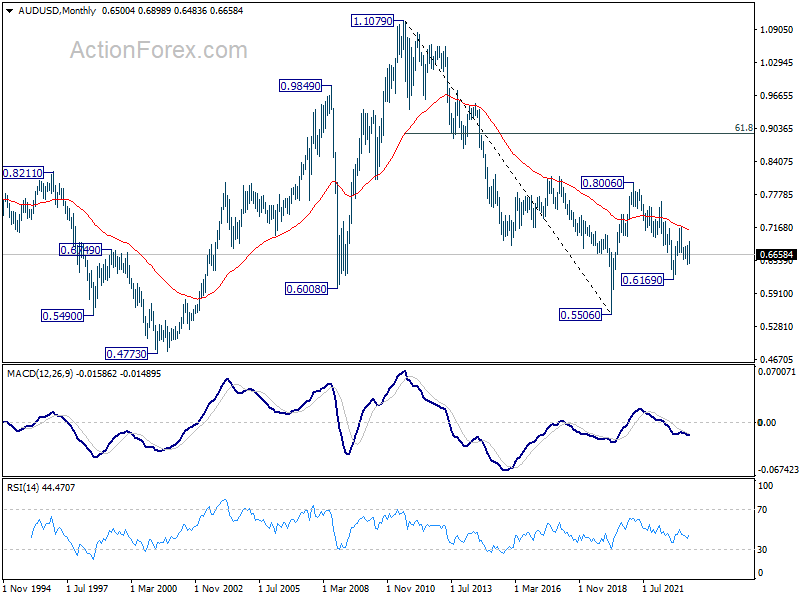
AUD/USD's decline from 0.6898 continued last week but recovered after hitting 0.6594. Initial bias remains neutral week for consolidations. Further decline is in favor as long as 0.6719 resistance holds. Break of 0.6594 will resume the decline to 0.6457 support next. Nevertheless, firm break of 0.6719 will turn bias back to the upside for stronger rebound.
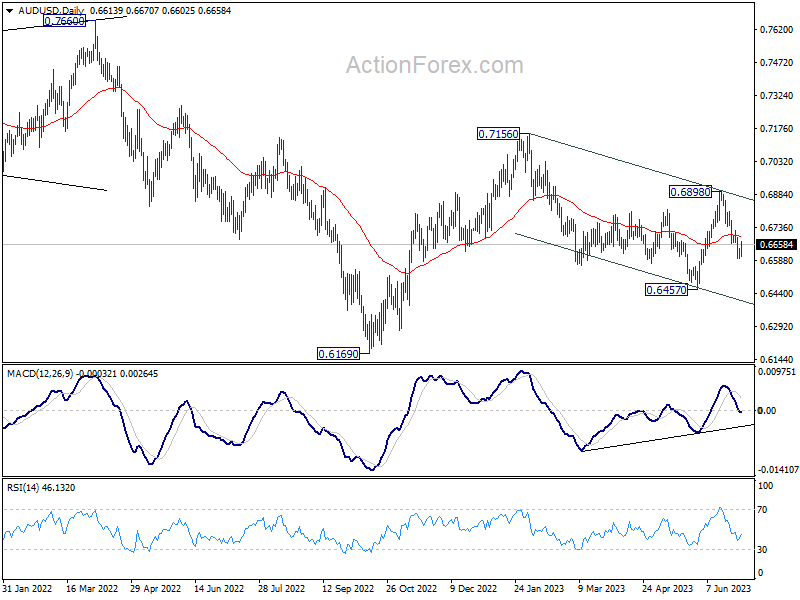
In the bigger picture, price actions from 0.7156 are seen as a correction to the rebound from 0.6169 only, rather than part of larger down trend from 0.8006 (2021 high). Break of 0.6457 could be seen but downside should be contained above 0.6169. This will now remain the favored case as high as 0.6898 resistance holds. Nevertheless, break of 0.6898 resistance will argue that rise form 0.6169 is ready to resume through 0.7156.
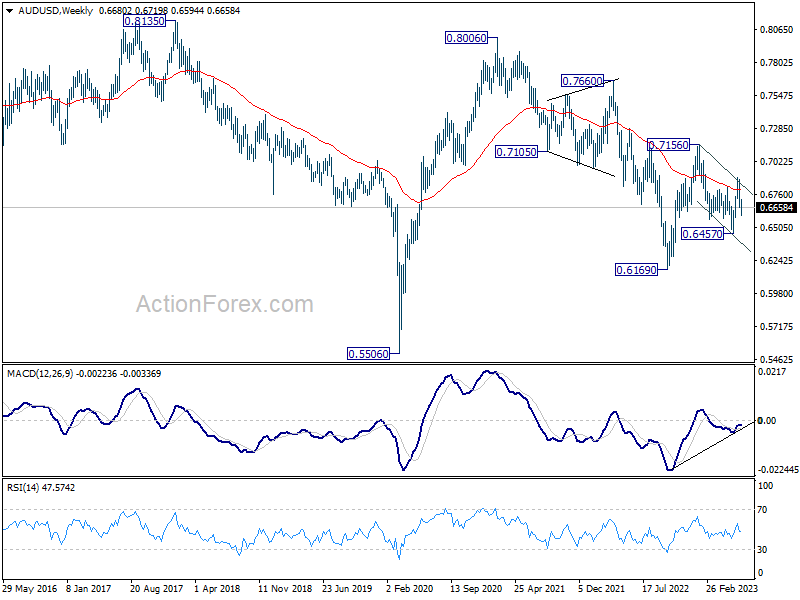
In the long term picture, fall from 0.8006 is seen as a corrective move to up rise from 0.5506 (2020 low). This correction could have completed at 0.6169. Sustained trading above 55 M EMA (now at 0.7102) will affirm this case, and indicate that rise from 0.5506 is ready to resume. However, firm break of 0.6169 will revive long term bearish ness and turn focus back to 0.5506 low.
USD/CAD Weekly Outlook
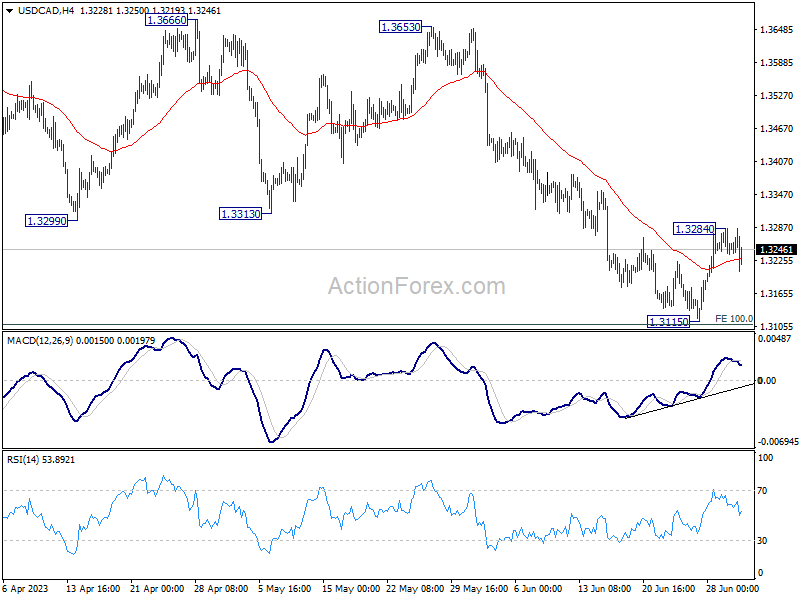
USD/CAD edged lower to 1.3115 but formed a short term bottom just ahead of 100% projection of 1.3976 to 1.3224 from 1.3860 at 1.3108. But subsequent recovery lost momentum after hitting 1.3284. Initial bias is turned neutral this week first. On the upside, break of 1.3284 will resume the rebound to 55 D EMA (now at 1.3384).
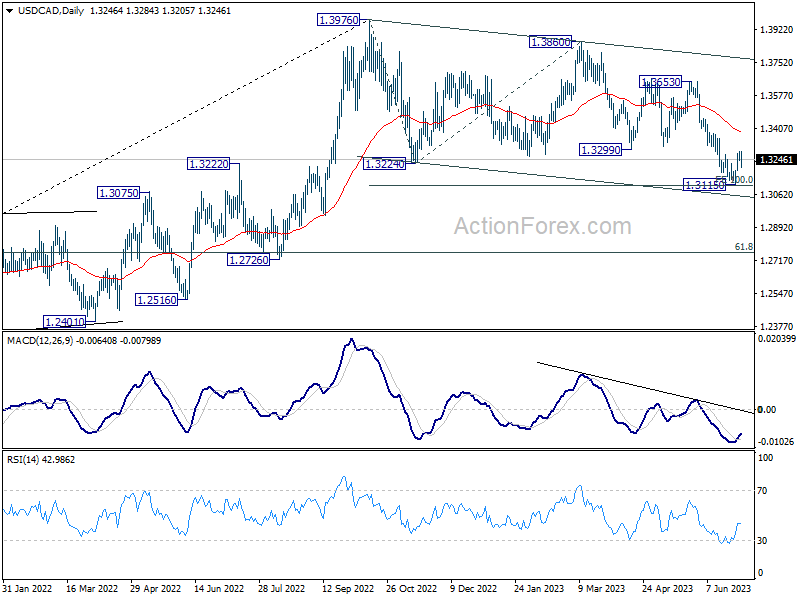
In the bigger picture, price actions from 1.3976 are still viewed as a correction to up trend from 1.2005 (2021 low). Risk will stay on the downside as long as 1.3299 support turned resistance holds. Next target is 61.8% retracement of 1.2005 to 1.3976 at 1.2758. However, sustained trading above 1.3229 will raise the chance that the correction has completed and turn focus back to 1.3653 resistance.
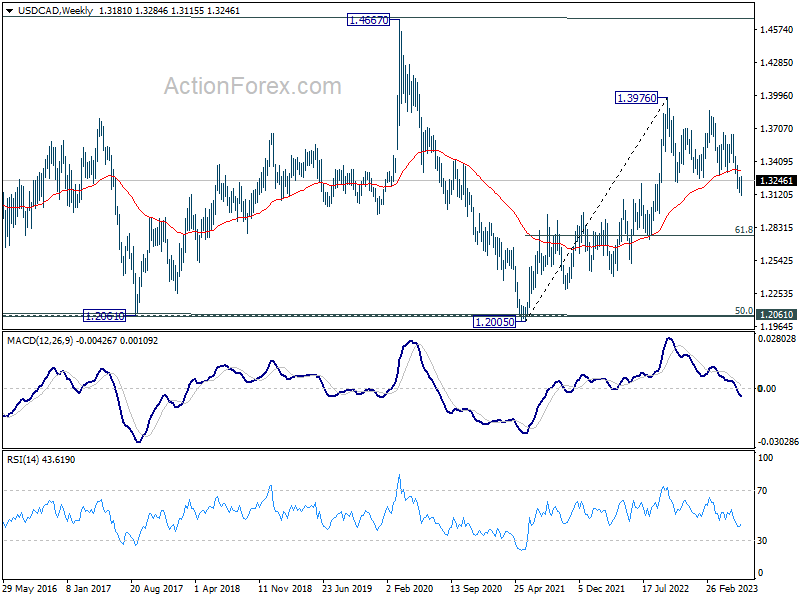
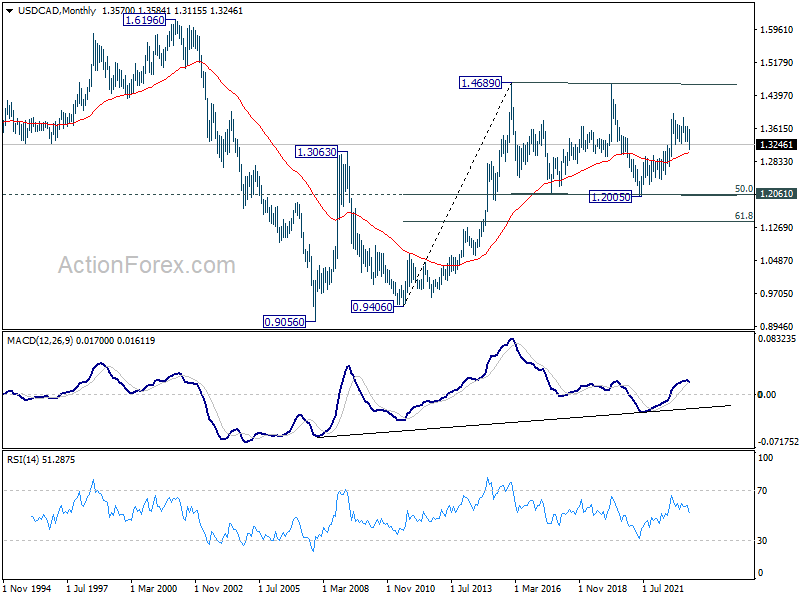
In the longer term picture, price actions from 1.4689 (2016 high) are seen as a consolidation pattern only, which might have completed at 1.2005. That is, up trend from 0.9506 (2007 low) is expected to resume at a later stage. This will remain the favored case as 55 M EMA (now at 1.3039) holds.
GBP/JPY Weekly Outlook
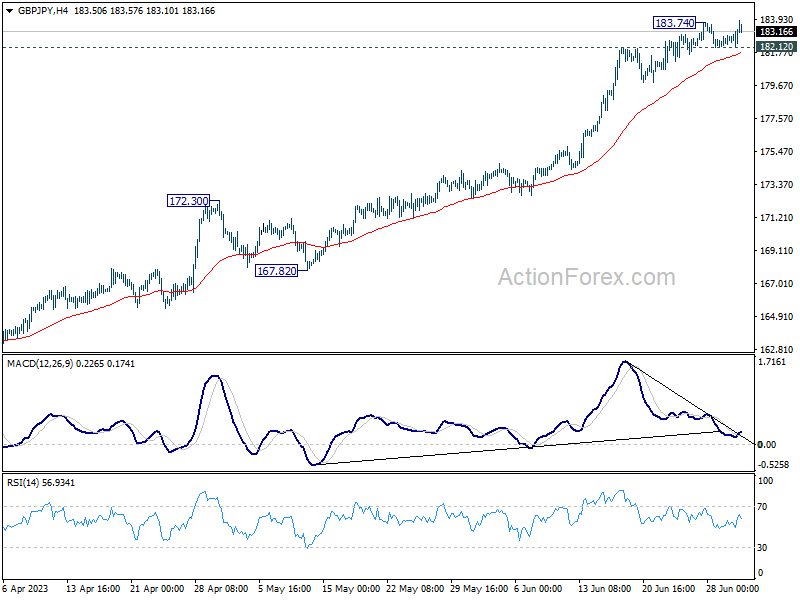
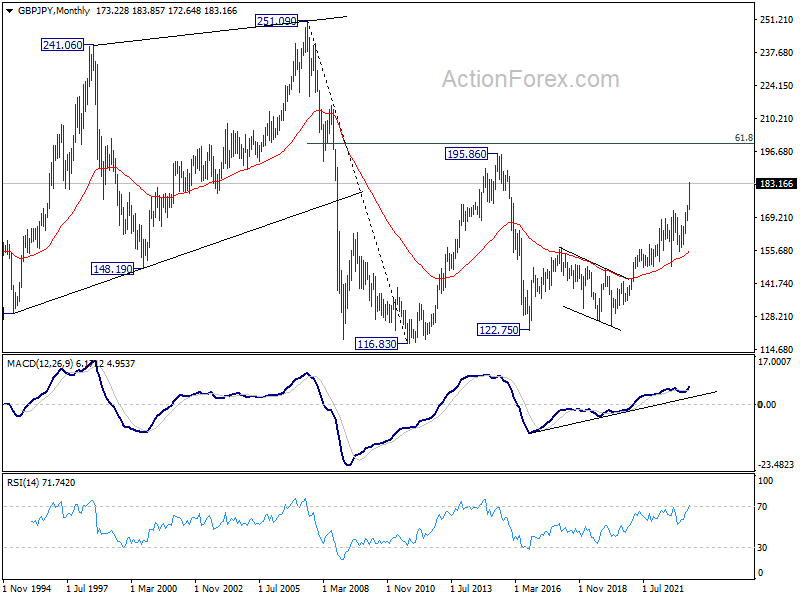
GBP/JPY's up trend extended higher last week despite loss of upside momentum. Late break of 138.74 temporary top suggests that it's trying to resume the rally. Initial bias is back on the upside this week. Next target is 138.2% projection of 148.93 to 172.11 from 155.33 at 187.36. On the downside, break of 182.12 minor support will turn bias back to the downside for deeper pull back first.
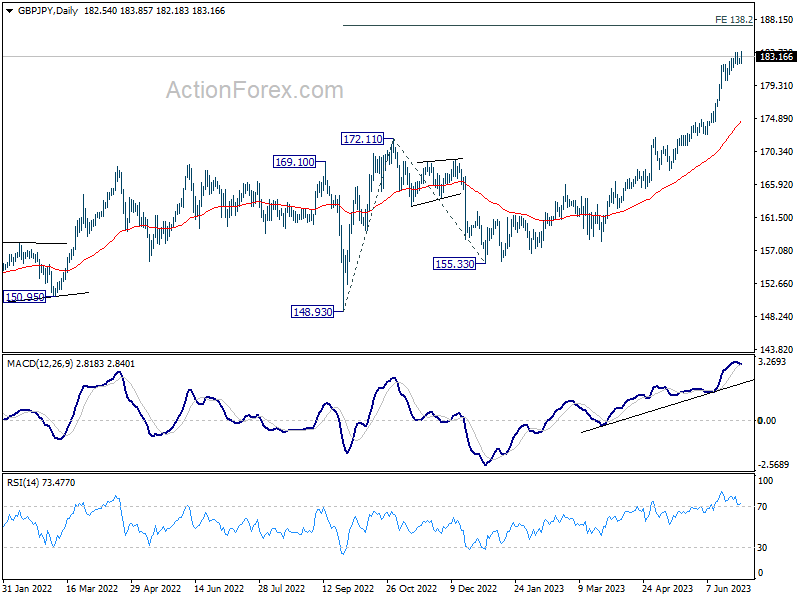
In the bigger picture, up trend from 123.94 (2020 low) is extending. Next target is 195.86 (2015 high). For now, medium term outlook will remain bullish as long as 172.11 resistance turned support holds, even in case of deep pull back.
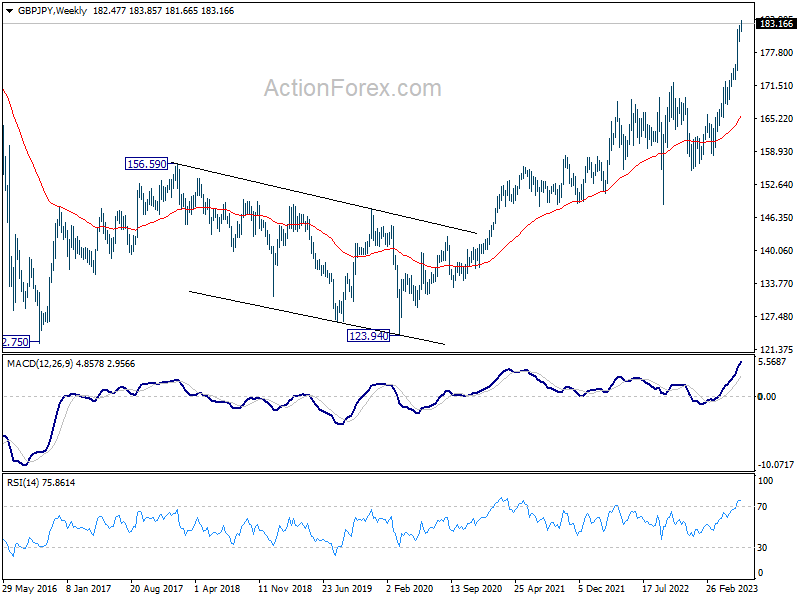
In the longer term picture, rise from 122.75 (2016 low) in still in progress to retest 195.86 (2015 high). Based on current momentum, break of 195.86 is in favor. But strong resistance could still be seen from 61.8% retracement of 251.09 (2007 high) to 116.83 (2011 low) at 199.80 to limit upside on first attempt.
EUR/JPY Weekly Outlook
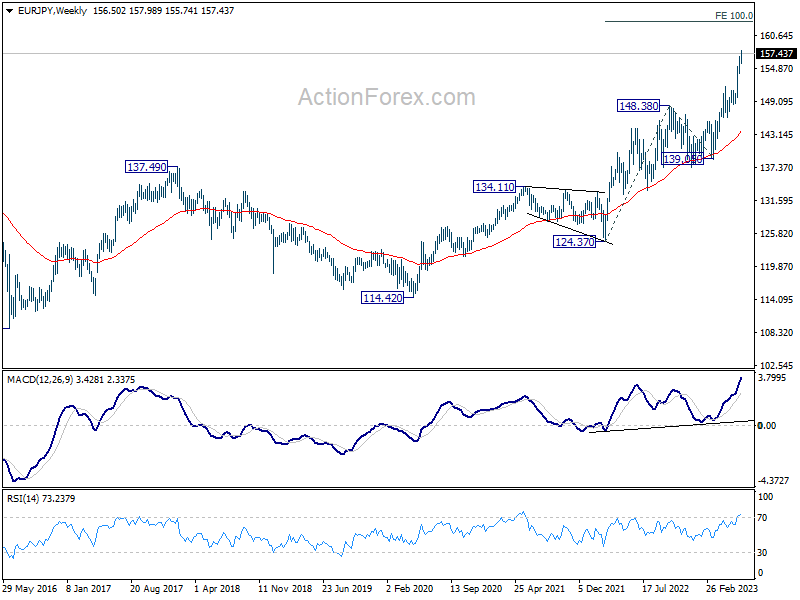
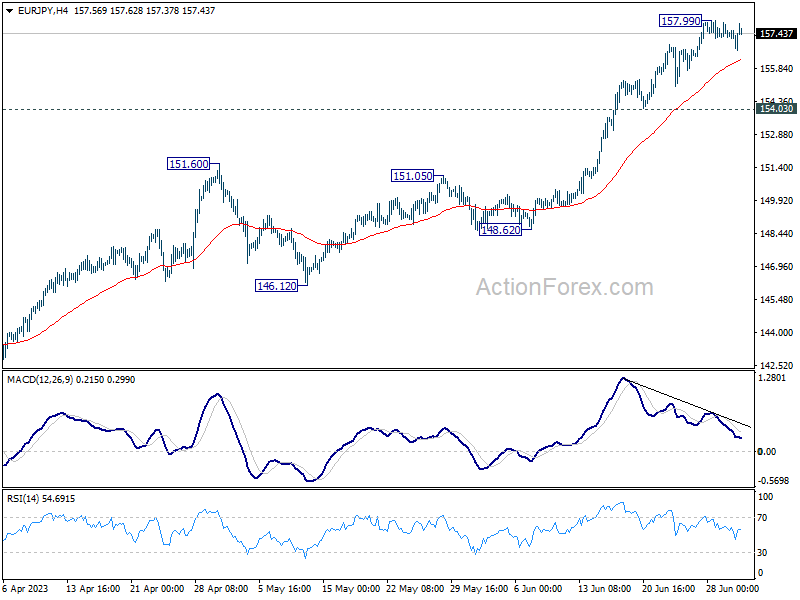
EUR/JPY's up trend continued last week but turned sideway after hitting 157.99. Initial bias is neutral this week for consolidations. But further rally is expected as long as 154.03 support holds. On the upside, break of 157.99 will resume larger up trend to 162.82 projection level. However, break of 154.03 will argue that larger correction is under way back to 151.60 resistance turned support.
In the bigger picture, rise from 114.42 (2020 low) is in progress. Next target is 100% projection of 124.37 to 148.38 from 138.81 at 162.82. For now, medium term outlook will remain bullish as long as 151.60 resistance turned support holds, even in case of deep pull back.
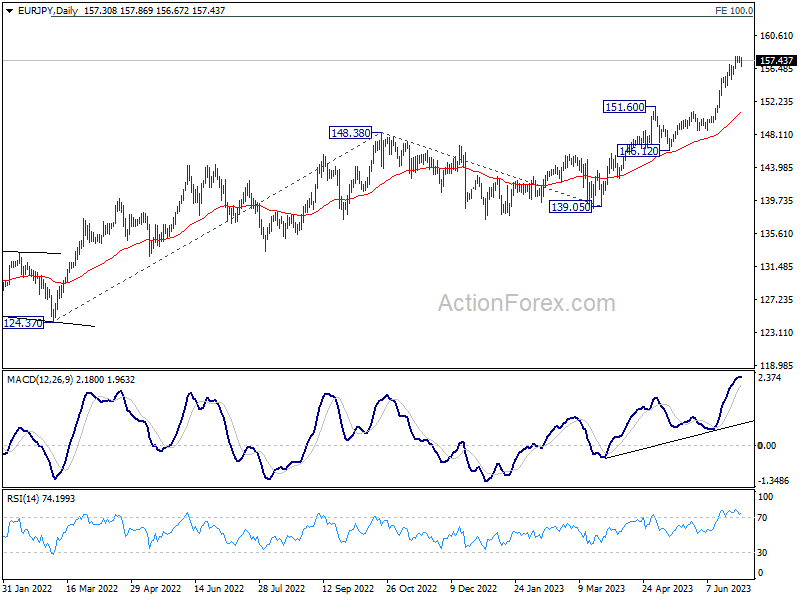
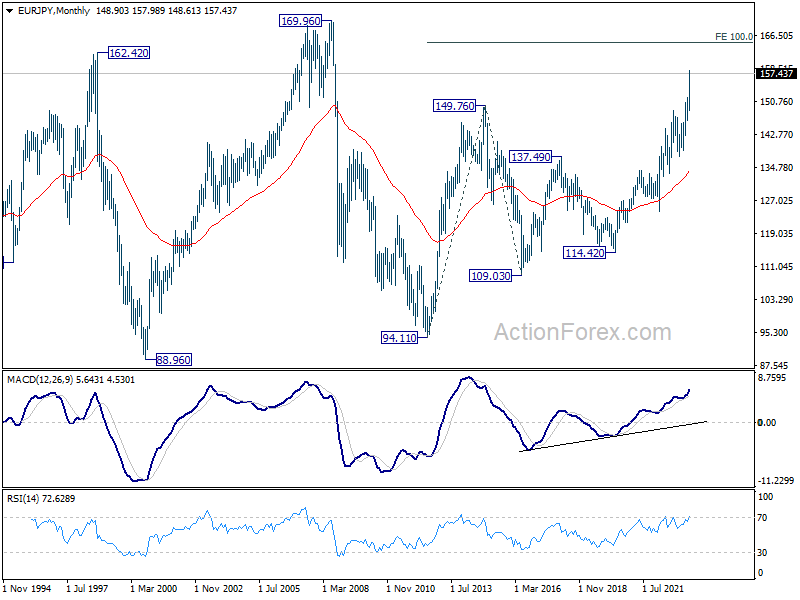
In the long term picture, rise from 109.03 (2016 low) is seen as the third leg of the whole up trend from 94.11 (2012 low). Next target is 100% projection of 94.11 to 149.76 from 109.03 at 164.68, and possibly further to 169.96 (2008 high).