

Sample Category Title
EUR/JPY Daily Outlook
Daily Pivots: (S1) 156.81; (P) 157.35; (R1) 158.00; More....
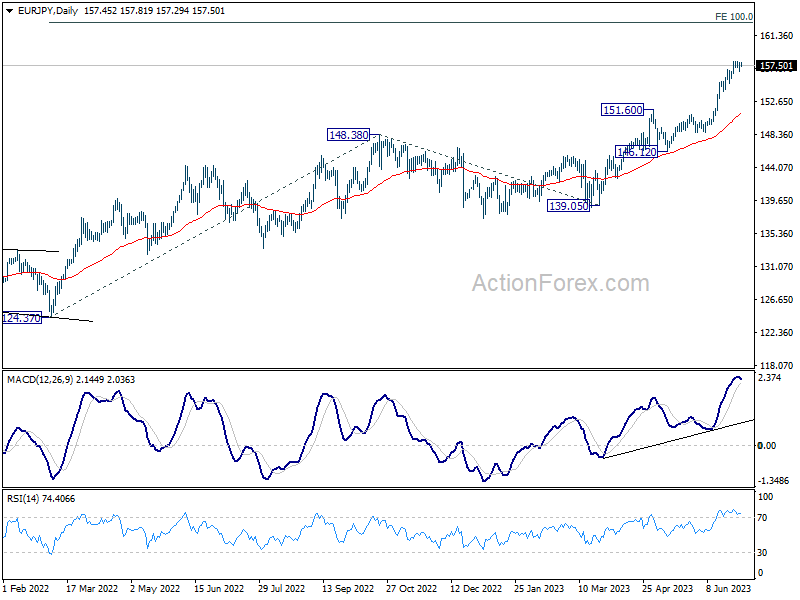
Intraday bias in EUR/JPY stays neutral as consolidation from 157.99 might extend further. In case of another dip, further rally is still expected as long as 154.03 support holds. On the upside, break of 157.99 will resume larger up trend to 162.82 projection level. However, break of 154.03 will argue that larger correction is under way back to 151.60 resistance turned support.
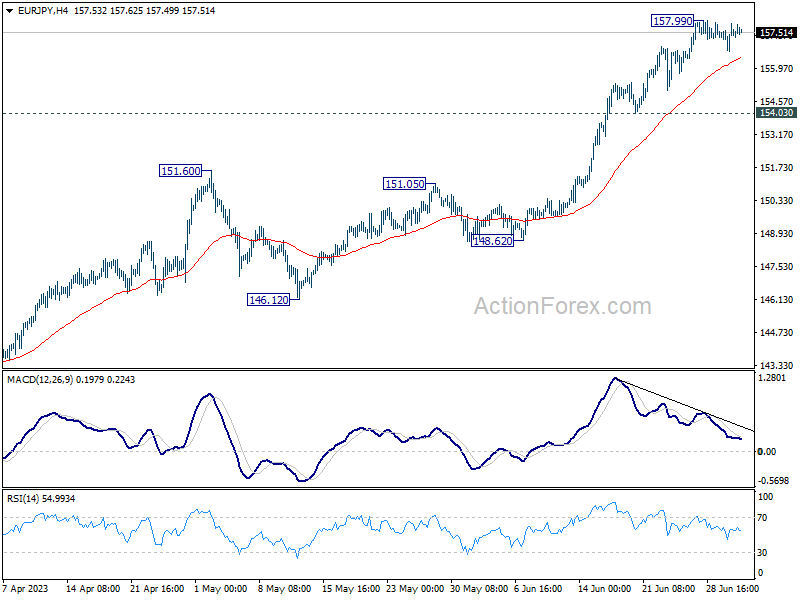
In the bigger picture, rise from 114.42 (2020 low) is in progress. Next target is 100% projection of 124.37 to 148.38 from 138.81 at 162.82. For now, medium term outlook will remain bullish as long as 151.60 resistance turned support holds, even in case of deep pull back.
EUR/GBP Daily Outlook
Daily Pivots: (S1) 0.8573; (P) 0.8596; (R1) 0.8616; More...
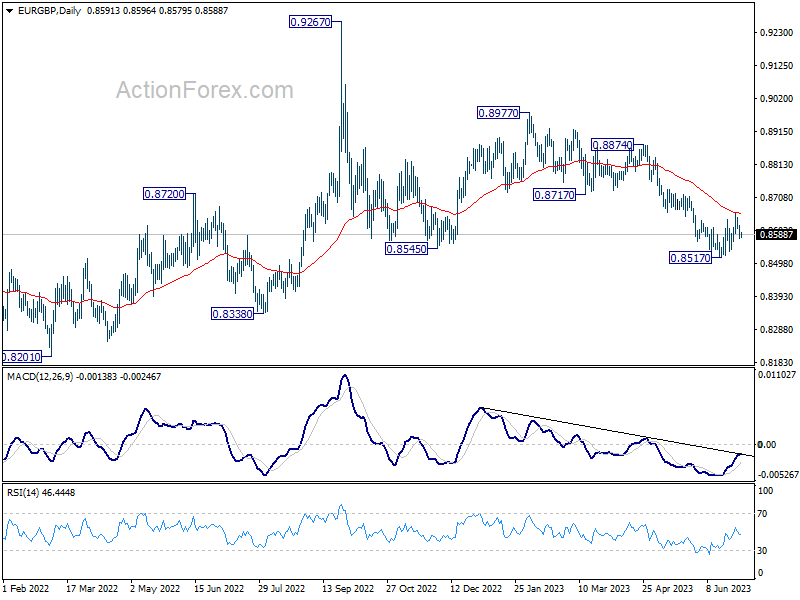
Intraday bias in EUR/GBP remains neutral and further decline remains in favor. On the downside, break of 0.8517 will resume the whole fall from 0.8977. On the upside, above 0.8657 resistance will resume the rebound from 0.8517 towards 0.8717 support turned resistance.
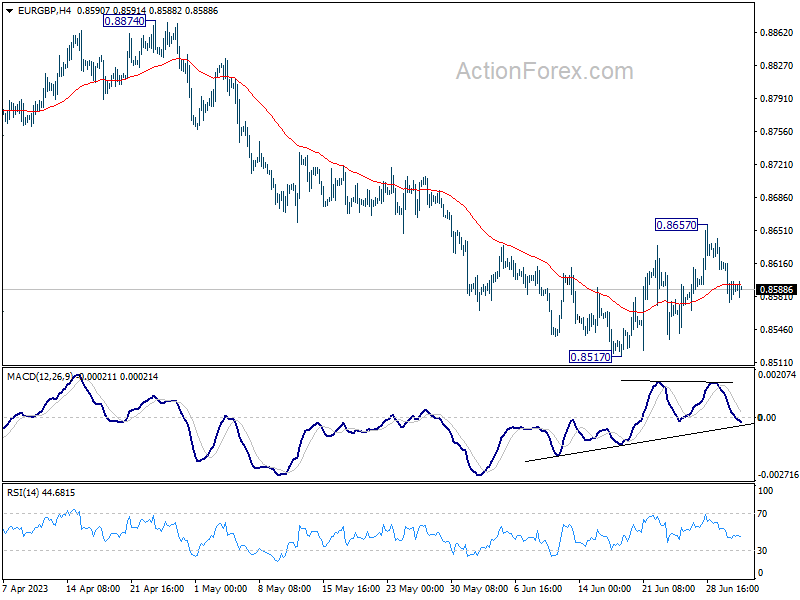
In the bigger picture, the down trend from 0.9267 (2022 high) is still in progress. It's seen as part of the long term range pattern from 0.9499 (2020 high). Deeper fall could be seen towards 0.8201 (2022 low). But strong support should be seen from there to bring reversal. This will now remain the favored case as long as 0.8717 support turned resistance holds.
EUR/AUD Daily Outlook
Daily Pivots: (S1) 1.6365; (P) 1.6454; (R1) 1.6509; More...
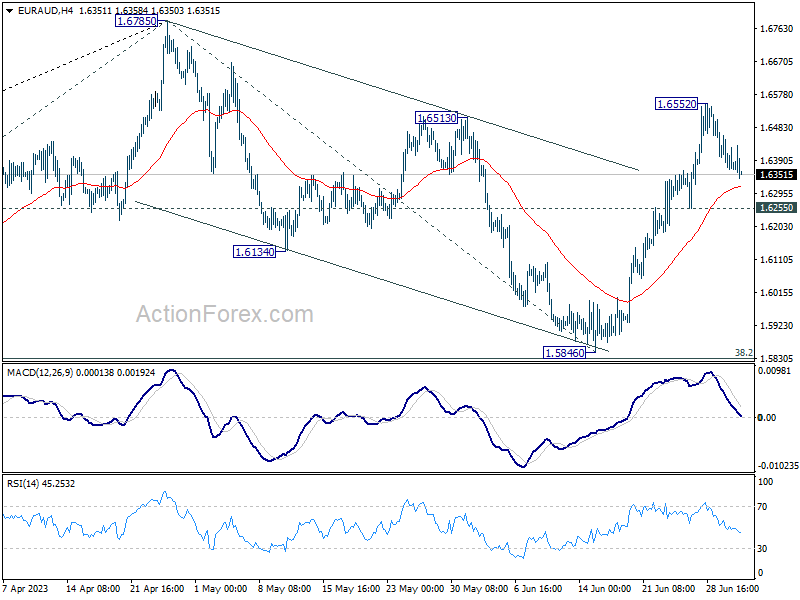
Intraday bias in EUR/AUD stays neutral for the moment. Further rally is expected with 1.6255 support intact. As noted before, correction from 1.6785 should have completed with three waves down to 1.5846. Above 1.6552 will target a retest on 1.6785 high next. Nevertheless, on the downside, break of 1.6255 will dampen this view and turn bias to the downside for 1.5846 support.
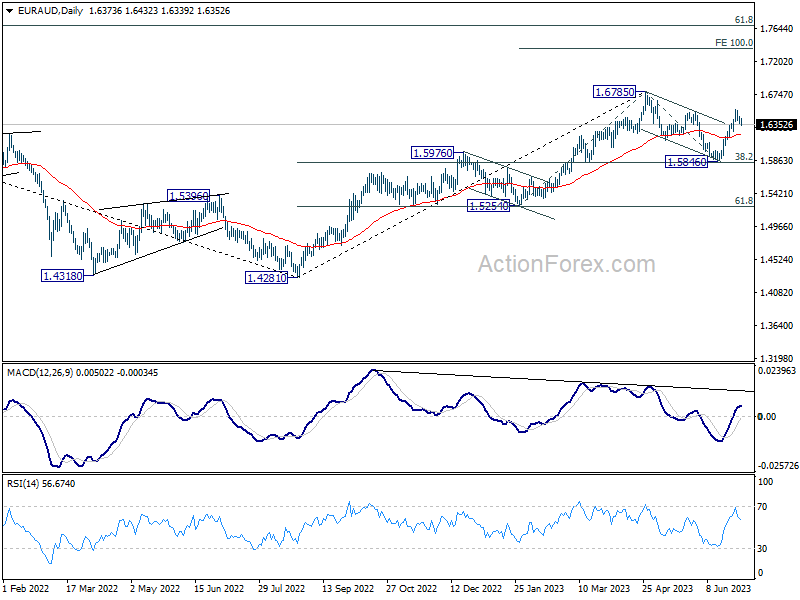
In the bigger picture, with 38.2% retracement of 1.4281 to 1.6785 at 1.5828 intact, rally from 1.4281 is still in progress. Firm break of 1.6785 will confirm rise resumption. Next target is 100% projection of 1.5254 to 1.6785 from 1.5846 at 1.7377. On the other hand, rejection by 1.6785 will extend the corrective pattern with another fall leg. But outlook will stay bullish as long as 1.5828 holds.
EUR/CHF Daily Outlook
Daily Pivots: (S1) 0.9753; (P) 0.9772; (R1) 0.9787; More...
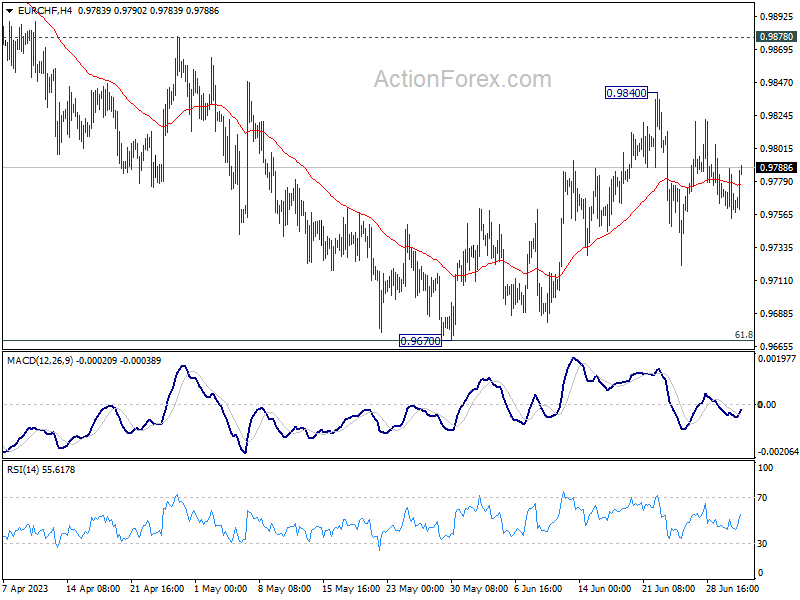
Range trading continues in EUR/CHF and intraday bias stays neutral for the moment. On the upside break of 0.9840 will resume the choppy rebound from 0.9670. That will also revive the case that whole corrective decline form 1.0095 has completed at 0.9670. Further rally should be seen to 0.9878 resistance next. However, sustained trading below 0.9670 will resume the whole fall from 1.0095.
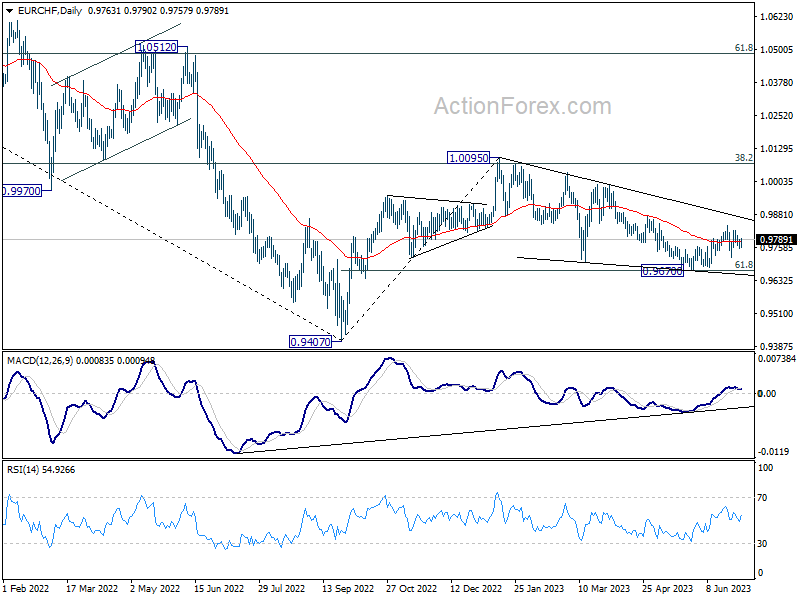
In the bigger picture, medium term outlook is staying bearish as the pair is capped below falling 55 W EMA (now at 0.9913). Down trend form 1.2004 (2018 high) is in favor to extend through 0.9407 at a later stage. Nevertheless, decisive break of 38.2% retracement of 1.1149 to 0.9407 will raise the chance of bullish trend reversal.
The Great Divergence Between the Real Economy and Global Equities
- Global manufacturing hubs; South Korea, Singapore & China continued to indicate a weaker external demand environment.
- Several key stock markets; US & Japan are on bullish footing, ignoring global recession risk.
- Higher US consumer confidence & more positive earnings guidance are required to maintain the bullish animal spirits.
- Higher cost of funding & a deeply inverted US Treasury yield curve are key hurdles for the bulls.
The great divergence continues between the state of the real global economy and risk assets such as equities.
Latest data from key global manufacturing hubs in Asia have indicated more potential weakness ahead in the external demand environment for the second half of 2023. South Korea, a key provider of semiconductors and smartphones for the global economy saw its latest full monthly exports figure decline to -6% year-on-year in June, a lower magnitude of -15.2% recorded in May but lower than expectations of a 3% drop. Overall, it’s nine consecutive months of contraction for South Korea’s exports.
In addition, soft data from South Korea’s Manufacturing PMI which tends to have a lead time over exports figures has remained in contraction mode for twelve consecutive months; it fell to 47.8 in June from 48.4 in May.
Data from China’s Caixin Manufacturing PMI which provides coverage for small and medium enterprises fared slightly better than the official NBS Manufacturing PMI for June but remained lackluster; it dipped to a neutral level of 50.5 from 50.9 recorded in May and came in slightly above expectations of 50.2.
Singapore’s non-oil domestic exports (NODX) slumped by 14.7% year-on-year in May, worse than forecasts of an 8.1% decline after a 9.8% reading in April; so far it has marked its eighth consecutive month of contraction.
US Nasdaq 100 and Japan Nikkei 225 were star performers in H1 2023
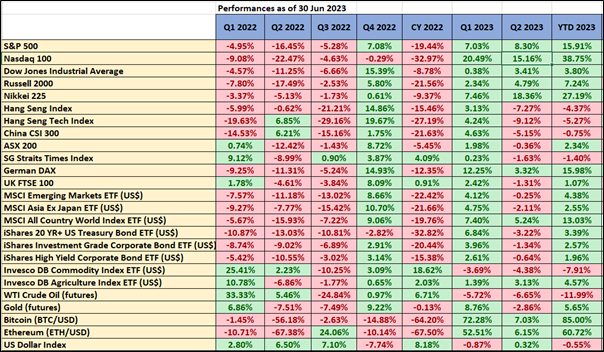
Fig 1: Key cross-assets performances as of 30 Jun 2023 (Source: TradingView, click to enlarge chart)
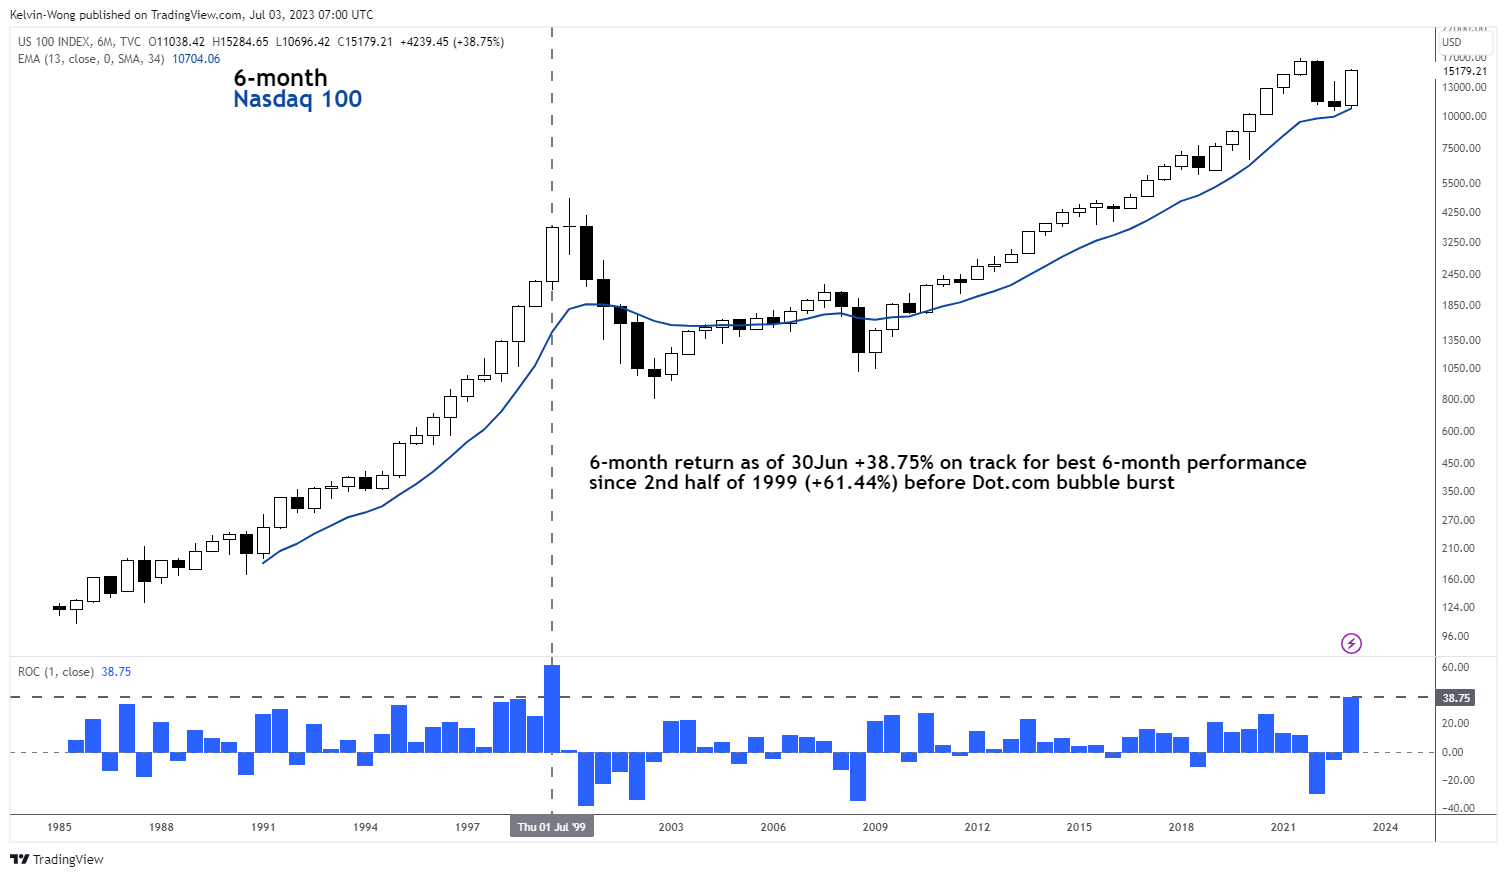
Fig 2: Nasdaq 100 long-term secular trend as of 30 Jun 2023 (Source: TradingView, click to enlarge chart)
In contrast, several major benchmark stock indices have continued to shrug off these “real negative growth backdrop”, entered bull market territories, and staged stellar performances. The top performer was the US Nasdaq 100 assisted by the Artificial Intelligence (AI) equity theme play rocketed to a gain of 38.75% in the first half of 2023 and outperformed the MSCI All-Country World Index which recorded a positive return of 13.03% over the same period.
Japanese equities also performed well in the first half; the Nikkei 225 rallied by 27.19%, and the bulk of H1 2023 gains came from Q2 (+18.36). Thanks to a change in corporate governance that favoured shareholders’ activism, lower valuation over the US stock market, and rosy foreign funds’ inflows reinforced by prominent value investor, Warren Buffet’s increased stakes in several major Japanese trading firms made over the first six months.
In contrast, other Asian stock markets in general have been trapped in a muted tone due to a slowing China economy after a diminished growth spurt from the removal of stringent Covid-19 lockdown measures and rather lukewarm monetary and fiscal stimulus measures being implemented at this juncture. The MSCI All Country Asia ex-Japan has managed to score only a meagre gain of 2.55% in the first half, which still has a significant gap to cover to recoup its annual loss of -21.66% posted in the prior year.
Over in Europe, Germany’s DAX managed to squeeze an H1 2023 return of 15.98% but do take note the bulk of its gain came in Q1 as the lackluster external growth environment has triggered a negative ripple effect where the DAX’s Q2 performance only stood at 3.32% that’s a huge gap of around 1,180 basis points over Nasdaq’s Q2 return of 15.16%.
Markets are always forward-looking, around the end of Q1 2023, the bullish camp for equities had a “Fed Pivot” narrative where there were significantly high odds being priced into the Fed funds futures market that advocated rate cuts of 75 bps to 100 bps in the second half of 2023.
Right now, given the Fed’s latest monetary policy guidance is to have “higher interest rates for longer periods”, rate cuts pricing in the futures market for H2 has evaporated, and even though further hikes may not be implemented in 2024 after two more hikes on the Fed funds rate that are being priced in before 2023 ends to bring its likely terminal rate to 5.50% to 5.75%, the start of an easing cycle may only kick in during the second half of 2024 based on latest data from CME FedWatch tool at this time of the writing.
Thus, with the liquidity punch bowl being taken away for now. What are the possible catalysts that can continue to drive the positive animal spirits in the US stock market that can increase the odds of spreading to the rest of the world?
Higher consumer confidence and better-than-expected earnings guidance
So far, US consumer confidence has been trending up modestly since July 2022. The final June reading of the University of Michigan Consumer Sentiment Index has been revised higher to 64.4, its highest level in four months. Higher consumer confidence tends to lead to higher consumer spending in the US where the US consumers may take on a similar pre-pandemic role of the “global consumer” for goods and services.
Q2 2023 earnings reporting season in the US will go full fledge in around two weeks. Based on FactSet data as of 30 June 2023, its estimated earnings decline compiled from analysts for the S&P 500 is at -6.8% year-on-year, a further drop from Q1’s -2% y/y.
The key will be the number of positive earnings forward guidance from the cyclical sectors such as Industrials and Consumer Discretionary to take over the baton from Information Technology. So far, there is more positive earnings guidance for FY 2023/2024 in Industrials as the mix is 65% positive and 35% negative whereas else Consumer Discretionary share of positive guidance is only 48% (52% negative).
Higher cost of funding and a deeply inverted US Treasury yield curve are key hurdles for the bulls
The bond market seems to be not “buying” into the H1 2023 bullish narrative seen in the stock market. On the last trading day of H1, the US Treasury yield curve spread (10-year minus 2-year) continued to invert deeply to -1.06%, its lowest level since March during the onset of the US regional banking turmoil which indicates an increase odd of a hard landing in the US economy coupled with a higher level of interest rates environment for a longer period that can drive up the cost of leverage and borrowings for corporates and depress profit margins.
If such a scenario materializes, current lofty bullish expectations in the US stock market may see a swift downward adjustment that is at risk of spreading to the rest of the world, and to prevent such occurrences, perhaps China needs to implement more aggressive expansionary monetary and fiscal policies to fill up the liquidity punchbowl given that inflationary pressures are benign in China.
USD/JPY: Bulls Hold Grip for Renewed Probe Through 145 Barrier
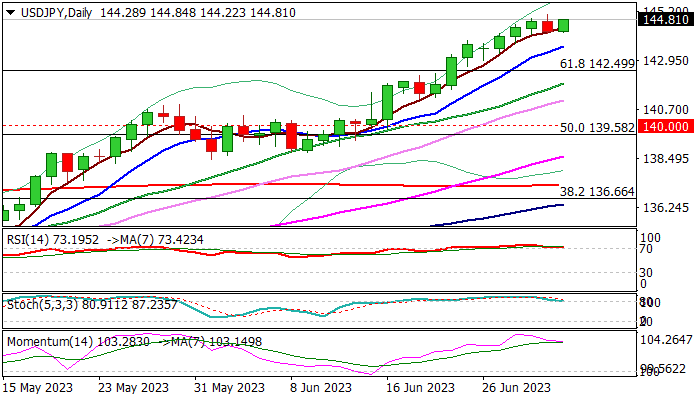
USDJPY regained traction early Monday, after bulls cracked 145 barrier on Friday, with subsequent shallow dip being contained by rising 5DMA (144.20).
Technical picture remains firmly bullish on daily chart (strong positive momentum / MA’s in full bullish setup) and support the action for renewed probe through 145 pivot, with overbought conditions being so far ignored.
However, traders remain cautious following a number of signals from Japan’s authorities about possible intervention above 145, which may produce further headwinds at this zone.
Bullish bias intact above rising 10DMA (143.60) for attacks at 145, break of which to expose next target at 146.10 (Fibo 76.4% of 151.94/127.22).
Conversely, break of 10DMA would weaken near-term structure and risk test of key support at 142.50 (broken Fibo 61.8%).
Expect lower volumes today and tomorrow due to US Independence Day holiday.
Res: 145.10; 146.10; 147.00; 147.56.
Sup: 144.22; 143.60; 142.50; 141.90.
EURUSD Pulls Back But 50-day SMA Curbs Decline
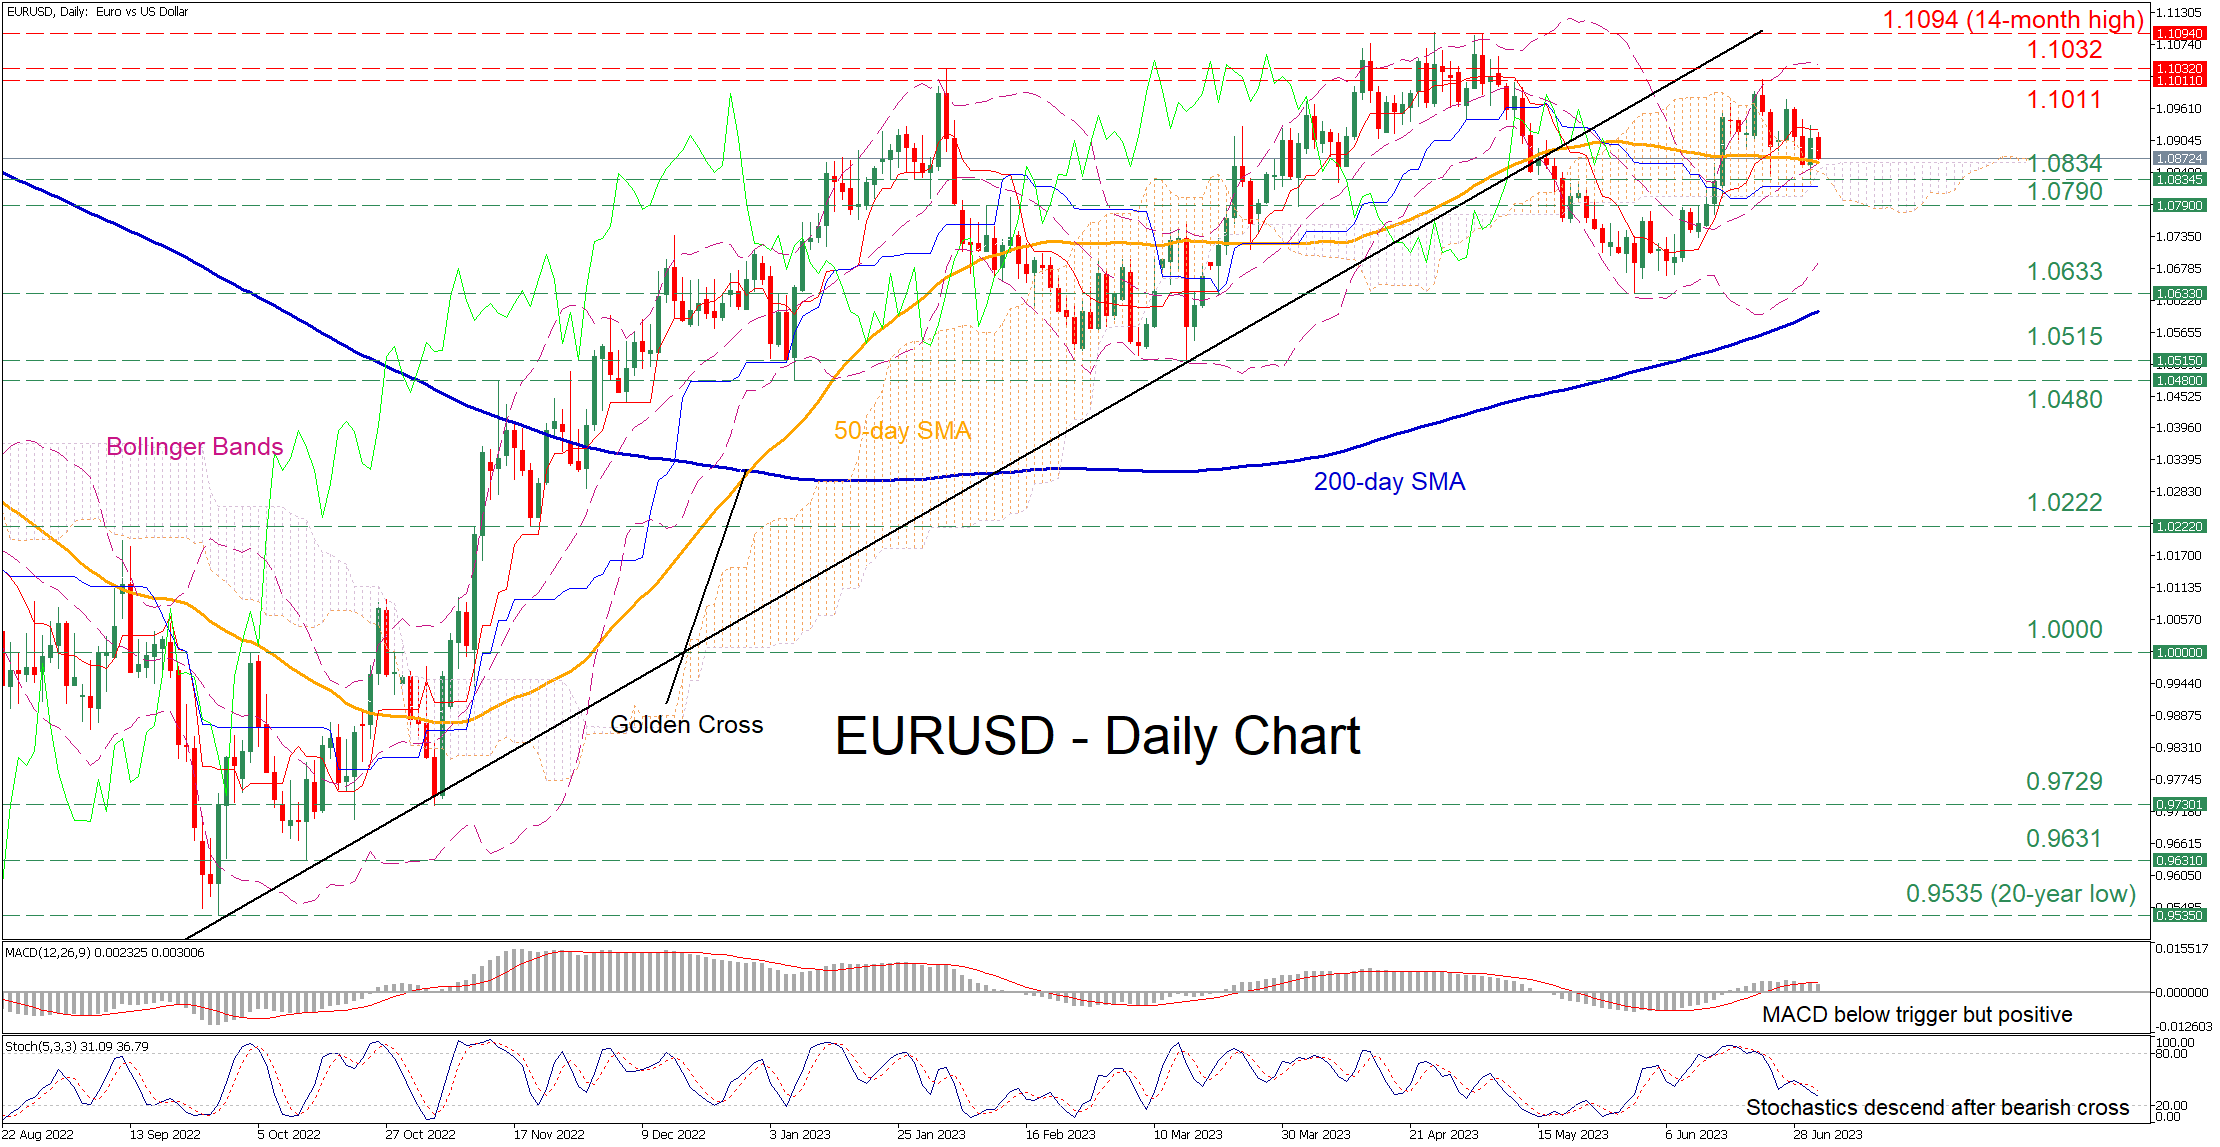
EURUSD has experienced a downside correction after its latest advance got rejected at the 1.1011 territory on June 22. Even though the pair temporarily bounced off the congested region that includes its 50-day simple moving average (SMA) and the upper boundary of the Ichimoku cloud, the bears continue to apply downside pressure.
The momentum indicators currently suggest that the positive momentum is waning. Specifically, the MACD has dropped below its red signal line but remains positive, while the stochastic oscillator is descending after posting a bearish cross.
Should the price pierce through its 50-day SMA, the recent support of 1.0834 could act as the first line of defense. A violation of that zone could turn the attention to 1.0790 before the May low of 1.0633 gets tested. Failing to halt there, the pair may retreat towards the March double-bottom region of 1.0515.
On the flipside, if the bulls manage to regain control, the price could initially face the recent rejection region of 1.1011. Clearing this level, the pair could advance towards the February peak of 1.1032. A break above that zone could open the door for the 14-month high of 1.1094.
In brief, EURUSD’s latest pullback came to a halt at the 50-day SMA, but the momentum indicators are currently tilted to the bearish side. Therefore, a potential break below this crucial technical zone could trigger a significant decline.
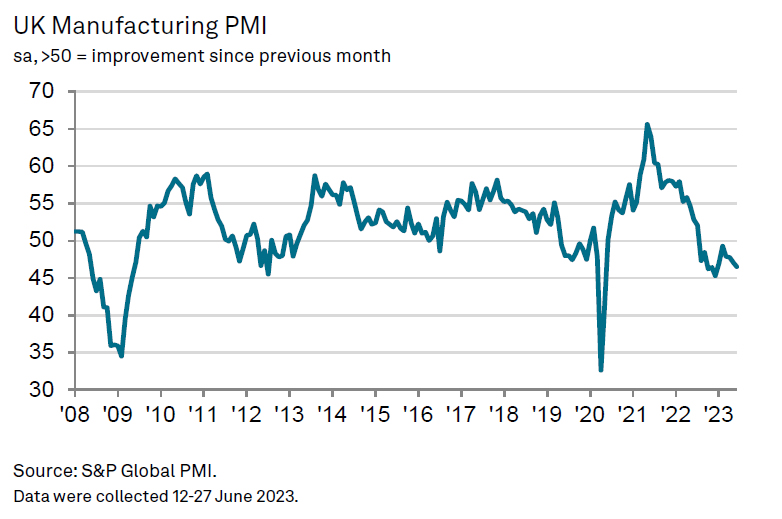
UK PMI manufacturing finalized at 46.5, continued to report recessionary conditions
UK PMI Manufacturing was finalized at 46.5 in June, down from May's 47.1, a six-month low. S&P Global noted that output fell in intermediate and investment goods sectors. Input prices and output charges both fell.
Rob Dobson, Director at S&P Global Market Intelligence, said:
"The UK manufacturing sector continued to report recessionary conditions in June. The headline PMI dropped to a six-month low as output, new orders and employment all suffered further declines. Producers are being hit by weak domestic and export market conditions with clients showing a greater reluctance to commit to spending due to market uncertainty, increased competition and elevated costs. This is also impacting business optimism and stoking fears among some manufacturers that client spending may shift to lower cost rivals and markets.
"Although some respite is being offered in the short-term by reduced pressures on supply chains and costs, these remain a symptom of the current weakness of demand faced by the sector and are therefore unlikely to play a role in boosting production moving forward. Manufacturers therefore remain in defence mode, looking to cut back spending on purchasing and employment wherever possible and release capital tied up in stocks."
Eurozone PMI manufacturing finalized at 43.4, reacting negatively to ECB hikes
The final Eurozone PMI Manufacturing reading for June marked a further descent to 43.4, compared to May's 44.8 - a slump to a low not seen in 37 months. The PMI Manufacturing Output Index also ended lower at 44.2, an 8-month low from May's 46.4.
The decline wasn't restricted to a single nation, but spread across several member states, demonstrating widespread economic pressure. Greece was a rare positive outlier, reaching a two-month high at 51.8. In contrast, Spain slid to a 6-month low at 48.0, while Ireland plummeted to a 37-month low at 47.3. France achieved a slight uptick to a 3-month high of 46.0, while Netherlands, Italy, and Germany dipped to 37- and 38-month lows. Austria reached the lowest level, falling to a 38-month low at 39.0.
Cyrus de la Rubia, Chief Economist at Hamburg Commercial Bank, articulated the stark economic picture: "Eurozone manufacturing production contracted for the third month in a row in June...with the rate of decline accelerating, pointing to a worsening of factory conditions."
He also pointed to the negative reaction of the capital-intensive industrial sector to the ECB's interest rate hikes. For the first time since January 2021, surveyed companies reported a reduction in their headcount. Additionally, purchasing activity declined at one of the most severe rates on record. As demand weakened and costs deflated rapidly, companies cut their sales prices for the second consecutive month.
On a slightly brighter note, de la Rubia noted the continued normalization of delivery times since February, but cautioned that material shortages remain a persisting issue.
EURGBP Sell Setup From Blue Box Works As Expected
In our service, we provide members trade setup in Live Trading Room. However, our setup is based on certain conditions. To trade, we need these conditions:
- There’s a bullish sequence (for buying) and bearish sequence (for selling)
- We can see clear correction in 3 swing or 7 swing. In addition, we can measure with higher degree of certainty the extreme area based on 100% – 161.8% Fibonacci extension.
In the charts below, we show how we gave a call to sell $EURGBP by first identifying the bearish sequence then the 3 waves corrective rally to sell.
EURGBP Daily Chart
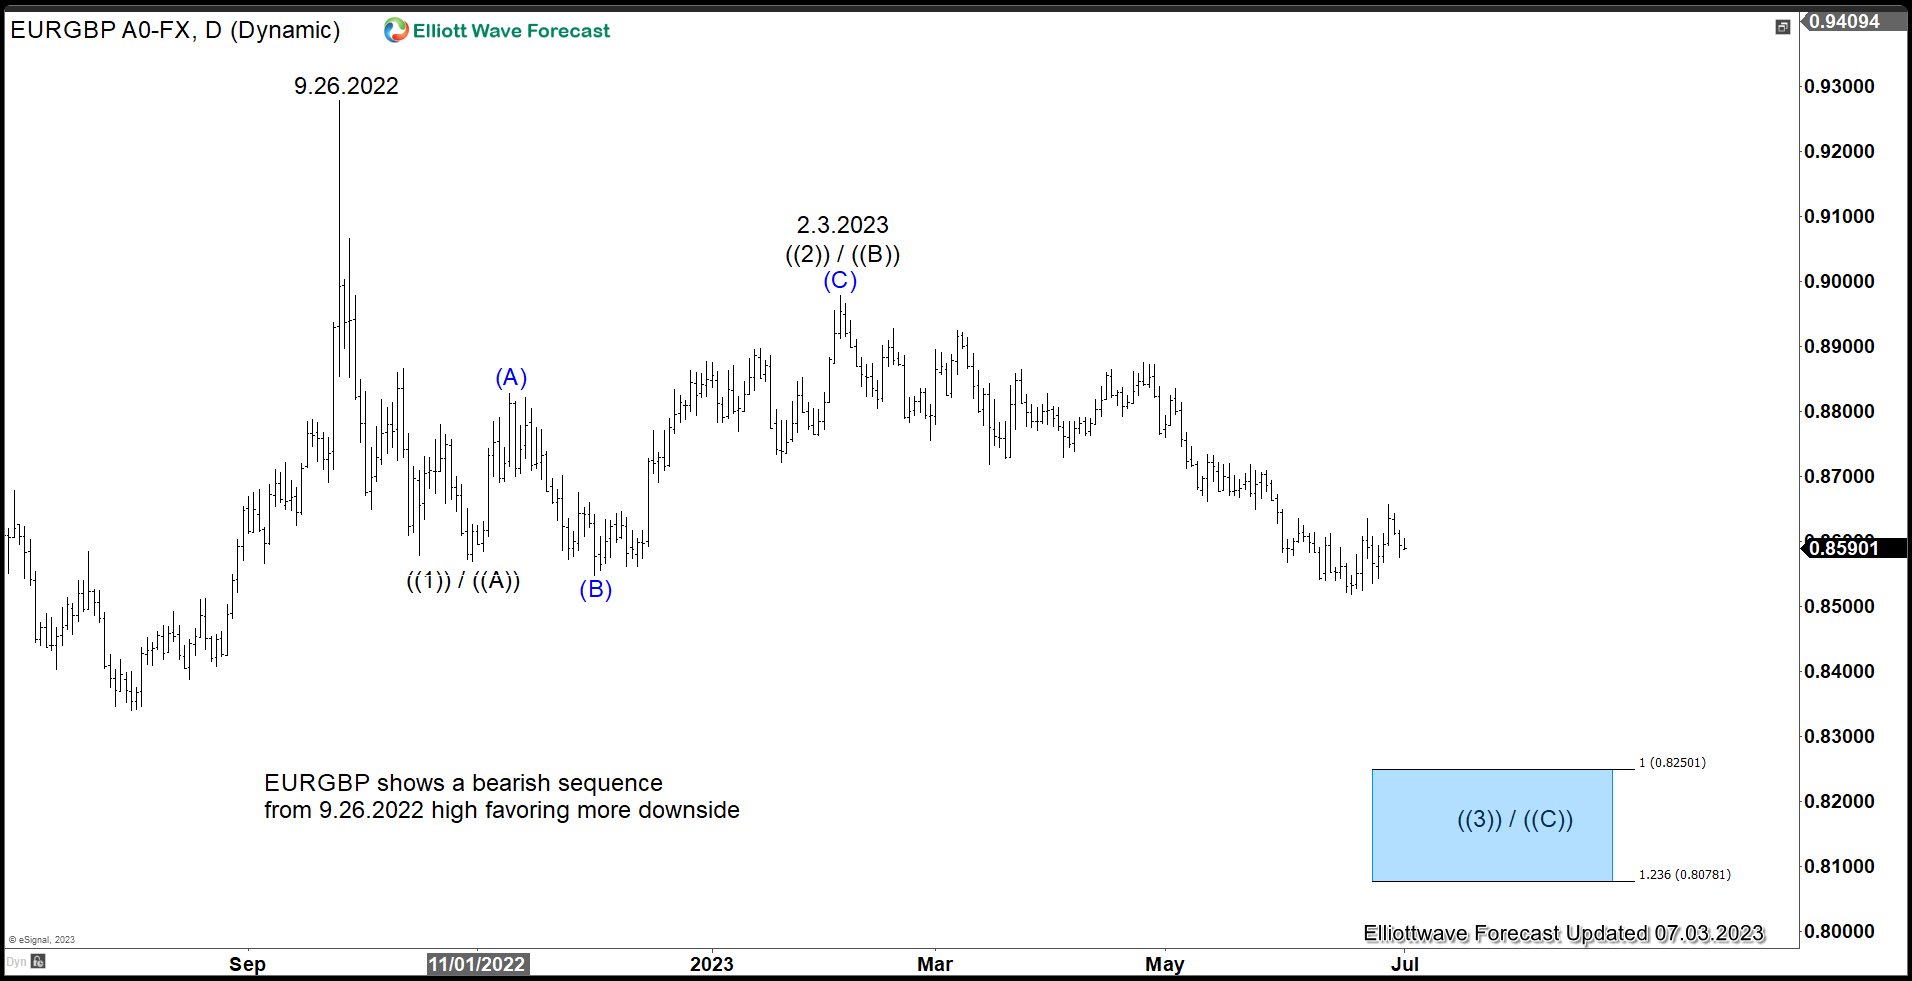
EURGBP Daily Chart above shows a lower low (bearish) sequence from 9.26.2022 high favoring further downside. We can label the lower low sequence either as a 5 waves impulse or 3 waves zigzag. In 5 waves impulse, pair is currently within wave ((3)). It can go to as low as 161.8% Fibonacci extension of wave ((1)). In a 3 waves zigzag, pair is currently in wave ((C)). Typically in a zigzag it can go to at least 100% of wave ((A)). Either way, further downside is likely and rally therefore should continue to fail in 3, 7, or 11 swing for further downside.
EURGBP 4 Hour Elliott Wave Chart 28 June
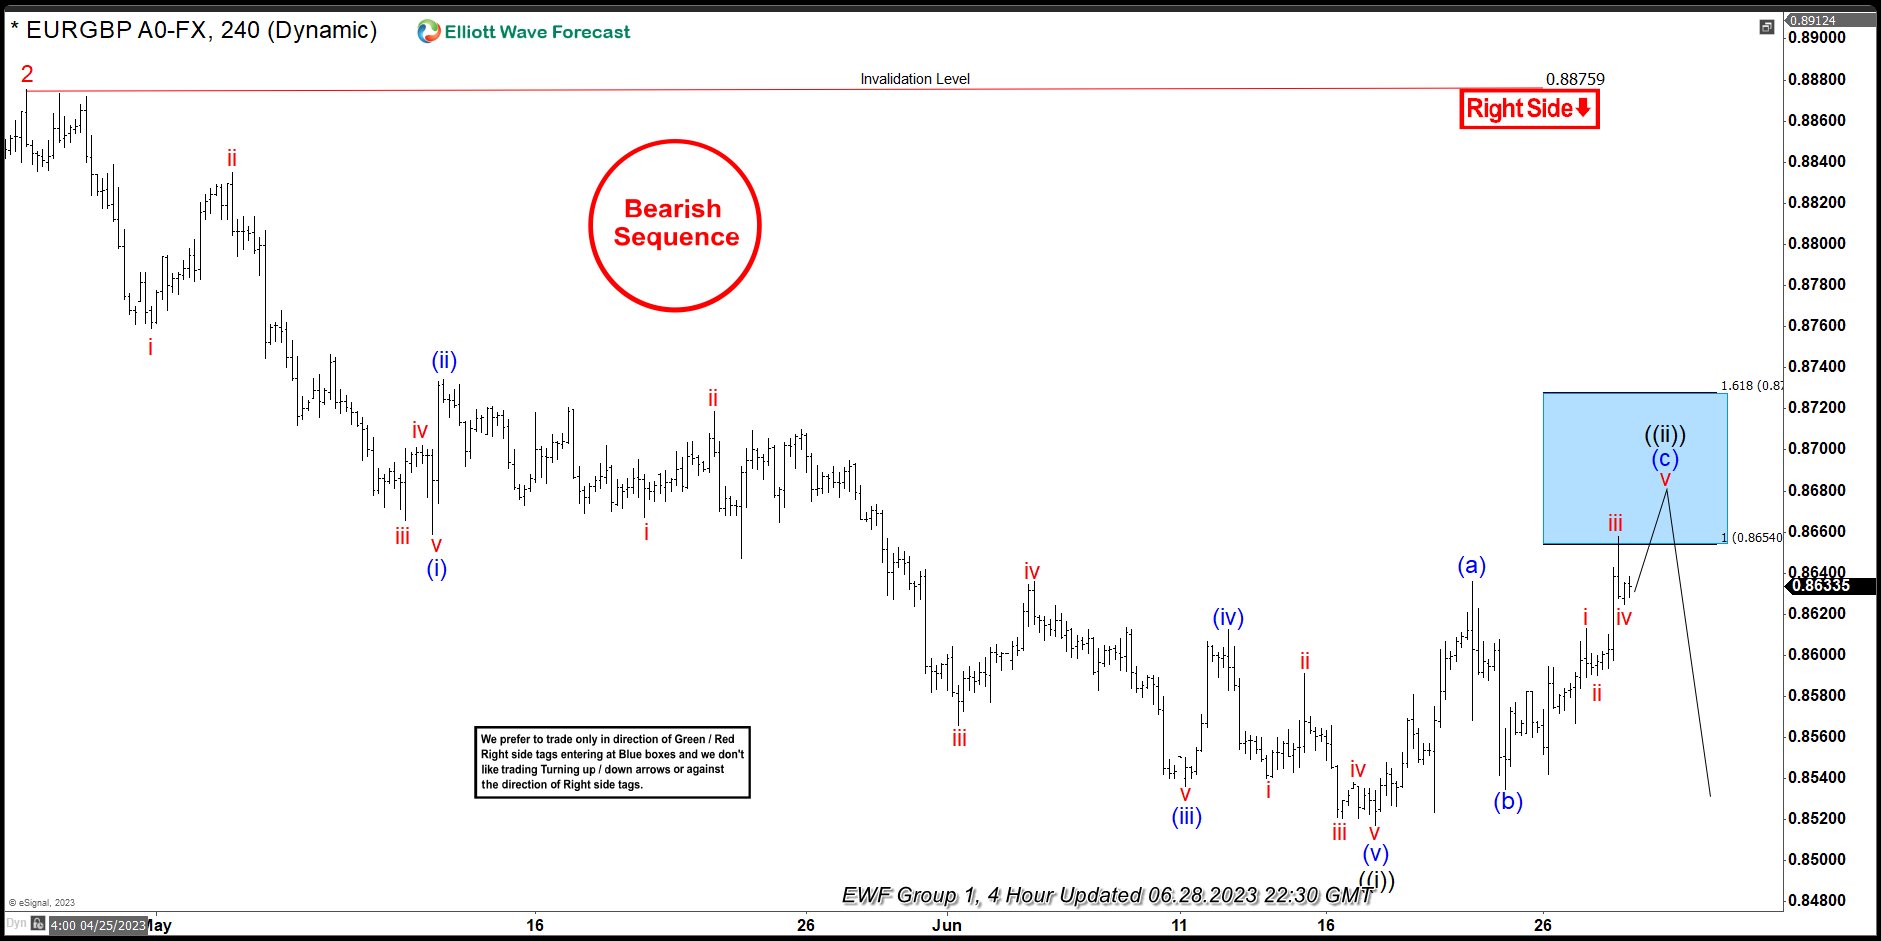
As the Daily chart suggests, EURGBP sequence is bearish and thus rally should fail in 3 or 7 swing. In the 4 hour chart from 28 June last month, EURGBP saw a rally in 3 waves. We informed our members that the rally should fail in 3 swing at the blue box area of 0.8654 – 0.872. We told members that pair should extend lower after reaching the blue box area or at least pullback in 3 waves. Our advice to members is to sell in Live Trading Room as the sequence is bearish and pair shows a clear 3 waves rally. We turn out to be right as the latest weekend chart below shows
EURGBP 4 Hour Elliott Wave Chart from 1 July
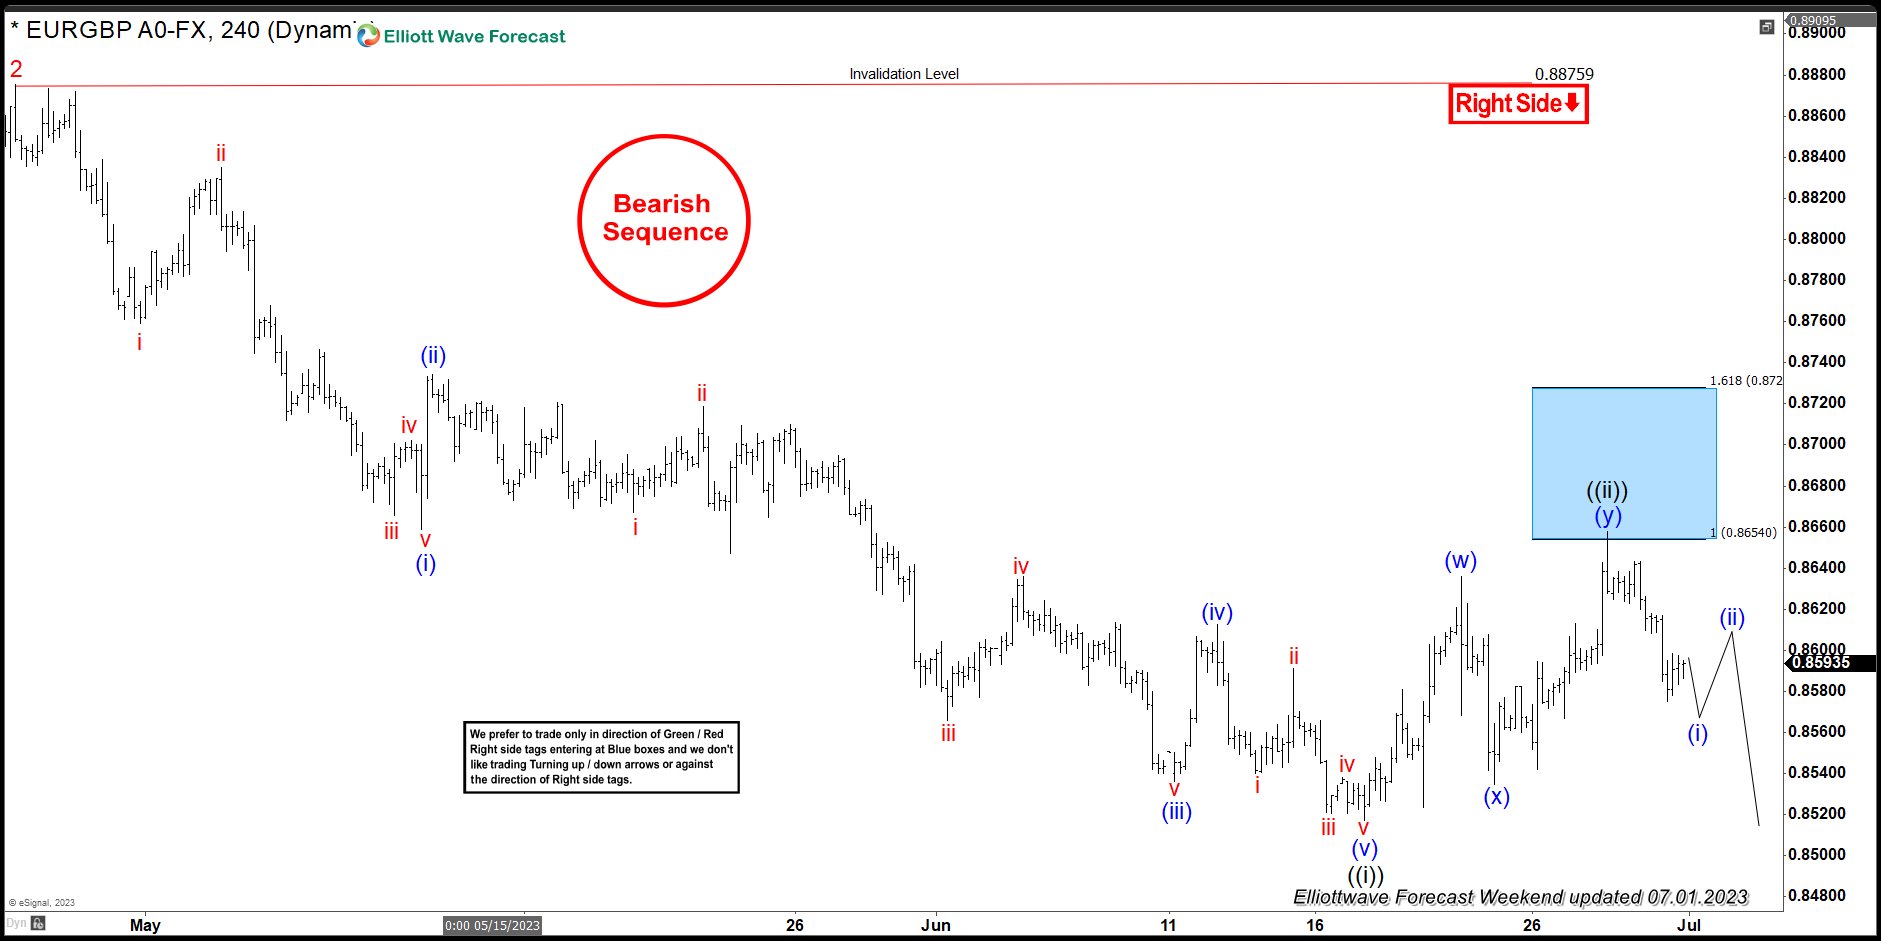
Latest 4 hour weekend update above shows pair turning lower as expected from the blue box area. Our members who sold at the blue box as we advised in Live Trading Room has already taken partial profit on the move down. Stop loss for the remaining position has also been moved to the entry level, thus the position is completely risk free. Now we just wait to see if pair can extend to new low or do a double correction higher. If pair does a double correction higher, it should find another sellers at the next 100% – 161.8% extension in 7 swing.
EURGBP Elliott Wave Video
https://www.youtube.com/watch?v=EgfO1h48h3U