Sample Category Title
Bank of Japan Leaves Policy Unchanged While ECB Delivers More Tightening
Market movers today
Today, we get the Michigan consumer confidence survey in the US, which includes an inflation expectations component which the Fed is paying attention to. Year-ahead inflation expectations spiked to 4.6% in April but declined to 4.2% in May.
Fed Board Member Christopher Waller speaks in Oslo 13.45 on "financial stability and macroeconomic policy".
Final euro area inflation data for May is unlikely to be significantly different from the preliminary version, but will add more details.
The 60 second overview
ECB: The ECB meeting yesterday was according to expectations with its 25bp rate hike and a formal decision to end the APP reinvestments from July. The staff projections were revised higher for both underlying and headline inflation across the horizon with importantly the 2025 projection at 2.2%, above the ECB's target. Lagarde said that it's 'very likely' to hike again in July. Lagarde did not provide guidance for the rate path beyond that but reconfirmed the mantra of a known destination, but unknown journey. We continue to expect ECB to hike to 4% by September, and we reiterate our view that the burden of proof will reverse after July when we get two new inflation prints and new staff projections ahead of a September meeting, see more in Flash: ECB Review - 'Very likely' to hike again in July, 16 June.
Danmarks Nationalbank: Danmarks Nationalbank (DN) also announced a raise in its key policy rate 25bp to 3.10% and hence mirroring the ECB rate hike. DN thereby keeps the spread to ECB's policy rate unchanged at -40bp. EUR/DKK has traded towards the mid-point of the historical trading range in recent months with no need for DN to make interventions in the FX market. We expect this situation to prevail over the coming months and for DN to track future interest increases from ECB 1:1. Hence, we look for DN to hike 25bp again in July and September, which would bring its key policy rate to 3.60%.
Bank of Japan: Bank of Japan (BoJ) kept its yield curve control policy unchanged this morning as widely expected. The yen weakened further on the decision, with USD/JPY trading up around 140.7 levels. The BoJ continues to expect inflation to slow later this year. They pledge to "patiently continue with monetary easing while nimbly responding to developments in economic activity and prices as well as financial conditions". Markets will now turn focus to the press conference, not least for clues on what BoJ makes of the recent yen decline and what that means for inflation.
The economic recovery in Japan has been picking up speed recently, adding to the likelihood of a tightening move from the BoJ. May wage figures in three weeks will be key to watch ahead of the next BoJ meeting at the end of next month, in order to gauge broad wage pressures. We expect an increase in the tolerance band around the 0% 10-year yield target at that meeting or the one in September.
Energy prices. The European natural gas price has risen around 50% since the start of the month to around EUR40/Mwh - the highest level since the beginning of April. The price increase likely owes to a multitude of factors include weather-related drop in renewable power production, higher energy demand due to the dry and warm weather, the decision to close the Groningen gas field already this year, very low nuclear power production in France and finally, increased geopolitical risk to natural gas production in Europe following recent comments from Russia. Regardless of the reason, it serves as a reminder that the European energy situation is fragile and sensitive to many different factors that are hard to predict - most notably the weather. We do not think there is a big risk of sharp price increases. In particular, because European natural gas storages are 20% larger now compared to last year. Nevertheless, the increase in natural gas prices has spill-over to European power prices and coal prices.
Equities: Global equities higher again yesterday but with massive differences underneath. ECB's hawkish 25 bp hike, led yields massively higher with a stronger Euro. European equites were already lower going into the meeting but fell immediately after before recovering somewhat up to the close. Still at defensive rotation in Europe. In US it was a very different story where equities gained steadily during the session and closing around day high. S&P moved firmly above the 4400 level and on rack for a fifth straight week of gains, something that has not happened since November 2021. In US yesterday, Dow +1.3%, S&P 500 +1.2%, Nasdaq +1.2%, Russell 2000 +0.8%. Asian market grinding higher this morning while futures in Europe and US are more mixed.
FI: Yesterday's trading session was rather volatile as initially the FOMC's hawkish communication from Wednesday night took yields higher. The ECB meeting which saw an upward revision of the inflation projections across the forecast horizon initially sent rates higher as guidance for further tightening needed was given. The 10y point sold off by 5bp across most jurisdictions. The front-end led sell-off took the ECB policy peak rate 5bp higher to 3.91%, with markets bringing the September meeting into play. Bank of Japan kept its yield curve control policy unchanged this morning as widely expected.
FX: The last 24 hours in FX markets have been characterised by not least JPY weakness - on higher global yields and this morning's Bank of Japan 'unchanged' announcement - alongside the EUR gaining on a fairly hawkish ECB message yesterday. EUR/USD is back above the 1.09 level, while EUR/SEK and EUR/NOK trades around 11.60 and 11.50, respectively. EUR/GBP continues to trade around year-lows.
Credit: Credit markets continued to digest the implications of the Fed meeting as well as the rate hike from the ECB. This left credit markets with slow trading in secondary markets and relatively limited new issue supply. Overall, iTraxx Main was unchanged at 77bp while iTraxx Xover was 1bp wider at 405bp.
Euro Rallies after ECB Raises Rates and Inflation Forecasts
It was mostly a good day for the global markets, except for Europe, which saw the European Central Bank (ECB) expectedly raise interest rates by 25bp, but unexpectedly raised inflation forecast, as well.
European policymakers now expect core inflation to average past the 5% mark, while in March projection this forecast was only at around 4.6%. This could sound a bit counterintuitive, because we have been seeing slower inflation and slower activity across the Eurozone countries, with the latest growth numbers even pointing at a mild recession. Yet the strength of the jobs market, and the stickiness of services and housing prices keep ECB officials alert and prepared for a further rate hike in July… and maybe another one in September.
Euro rallies
At the wake of the ECB meeting, the implied probability of a July hike jumped from 50% to 80%, sending the EURUSD rallying. The pair rallied well past its 50-DMA and hit 1.0950, and is up by more than 3% since the beginning of this month. The medium-term outlook remains bullish for the EURUSD due to divergence between a decidedly hawkish ECB, and exhausting Federal Reserve (Fed). The next bullish target stands at 1.12.
The US dollar sank below its 50-DMA, impacted by softening retail sales, rising jobless claims, slowing industrial production and perhaps by a broadly stronger euro following the ECB’s higher inflation forecasts, as well.
Elsewhere, rally in EURJPY gained momentum above the 150 mark, as the Bank of Japan (BoJ) decided to do nothing about its abnormally low interest rates today, which seem even more anomalous when you think that the rest of the major central banks are either hiking, or say they will hike. The dollar yen is back above the 140 mark, as traders see little reason to buy the yen when the BoJ outlook remains blurred. Note that some investors expected at least a wider YCC policy to 1% mark, but the BoJ didn’t even bother to make a change on that front.
Japanese stocks overbought near 33-year highs
Good news is, Japanese stocks benefit from softer yen and ample BoJ policy, and consolidate gains near 33-year highs. The overbought market conditions, and the idea that Japan will, one day in our lifetime, normalize rates could lead to some profit taking, but it’s also true that companies in geopolitically sensitive sectors like defense and semiconductors have been major drivers of the rally this year, and there is no reason for that appetite to change when the geopolitical landscape remains this tense. The former US Secretary of State just said he believes that a conflict between China and Taiwan is likely if tensions continue their current course.
Technical Outlook and Review
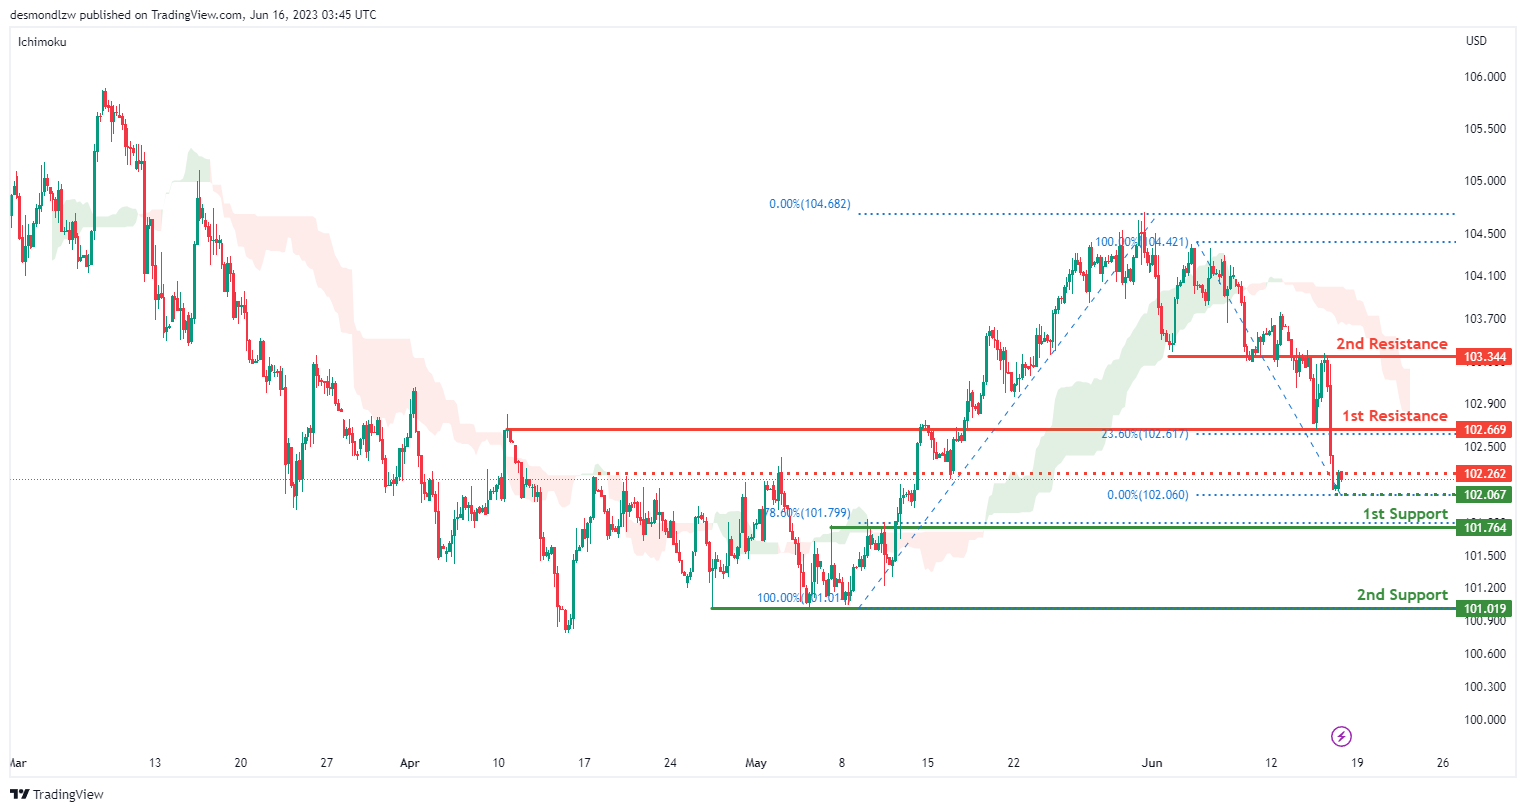
DXY:
The DXY chart indicates a bearish momentum as the price is below the bearish Ichimoku cloud.
There is a potential for the price to rise towards the first resistance at 102.66 in the short term before reversing and dropping towards the first support at 102.06.
Key support levels include the first support at 102.06, identified as an overlap support and aligned with the 78.60% Fibonacci Retracement. The second support at 101.01 serves as a multi-swing low support and coincides with the 38.20% Fibonacci Retracement.
On the upside, the first resistance at 102.66 acts as a pullback resistance and aligns with the 23.60% Fibonacci Retracement. Additionally, the second resistance at 103.34 is an area of overlap resistance.
There is also an intermediate resistance at 192.26, which serves as a pullback resistance.
EUR/USD:
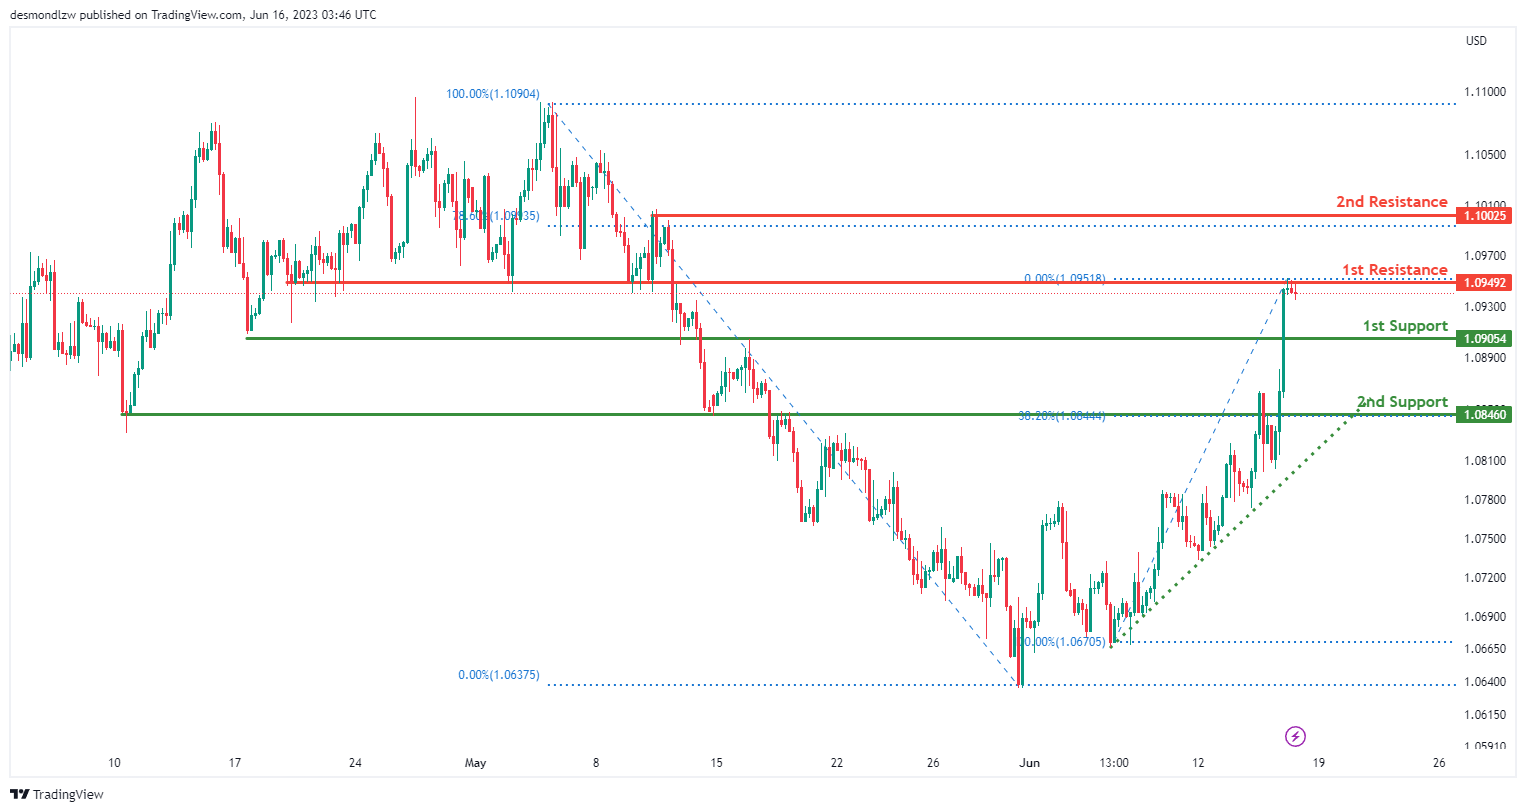
The EUR/USD chart exhibits a bullish momentum, indicating an upward trend in the market.
The momentum is supported by the price being above a major ascending trend line, suggesting the potential for further bullish movement.
There is a possibility of the price dropping further towards the first support level at 1.0905 in the short term before bouncing back and rising towards the first resistance level at 1.0949.
Key support levels include the first support at 1.0905, identified as a pullback support, and the second support at 1.0846, which serves as a pullback support and aligns with the 38.20% Fibonacci Retracement.
On the upside, the first resistance at 1.0949 is an overlap resistance, indicating a potential barrier to upward price movements. Additionally, the second resistance at 1.1002 represents a swing high resistance and coincides with the 78.60% Fibonacci Retracement.
GBP/USD:
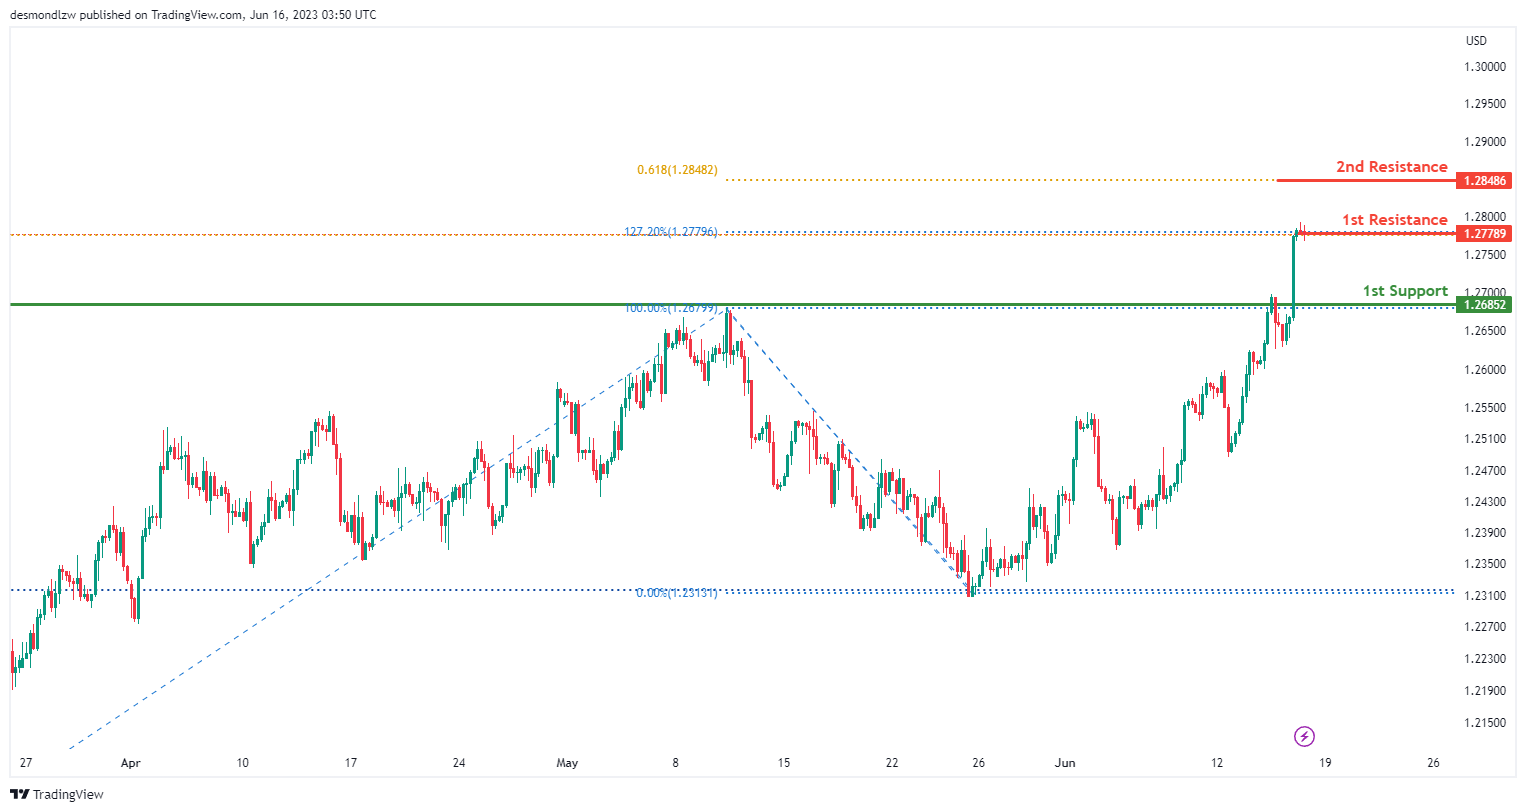
The GBP/USD chart currently exhibits a prevailing bearish momentum, indicating a downward trend in the market. Traders and investors should take note of the potential for a bearish reaction from the first resistance level at 1.3778, which could result in a subsequent decline towards the first support level at 1.2685.
The first support level at 1.2685 is of particular significance as it represents a pullback support, potentially attracting buyers and providing a level of price stabilization.
Conversely, on the upside, the first resistance level at 1.3778 holds notable importance as a swing high resistance, suggesting a potential barrier to upward price movements. Additionally, the second resistance level at 1.2848 is reinforced by the presence of the 61.80% Fibonacci Projection, further highlighting its significance as a potential resistance area.
USD/CHF:
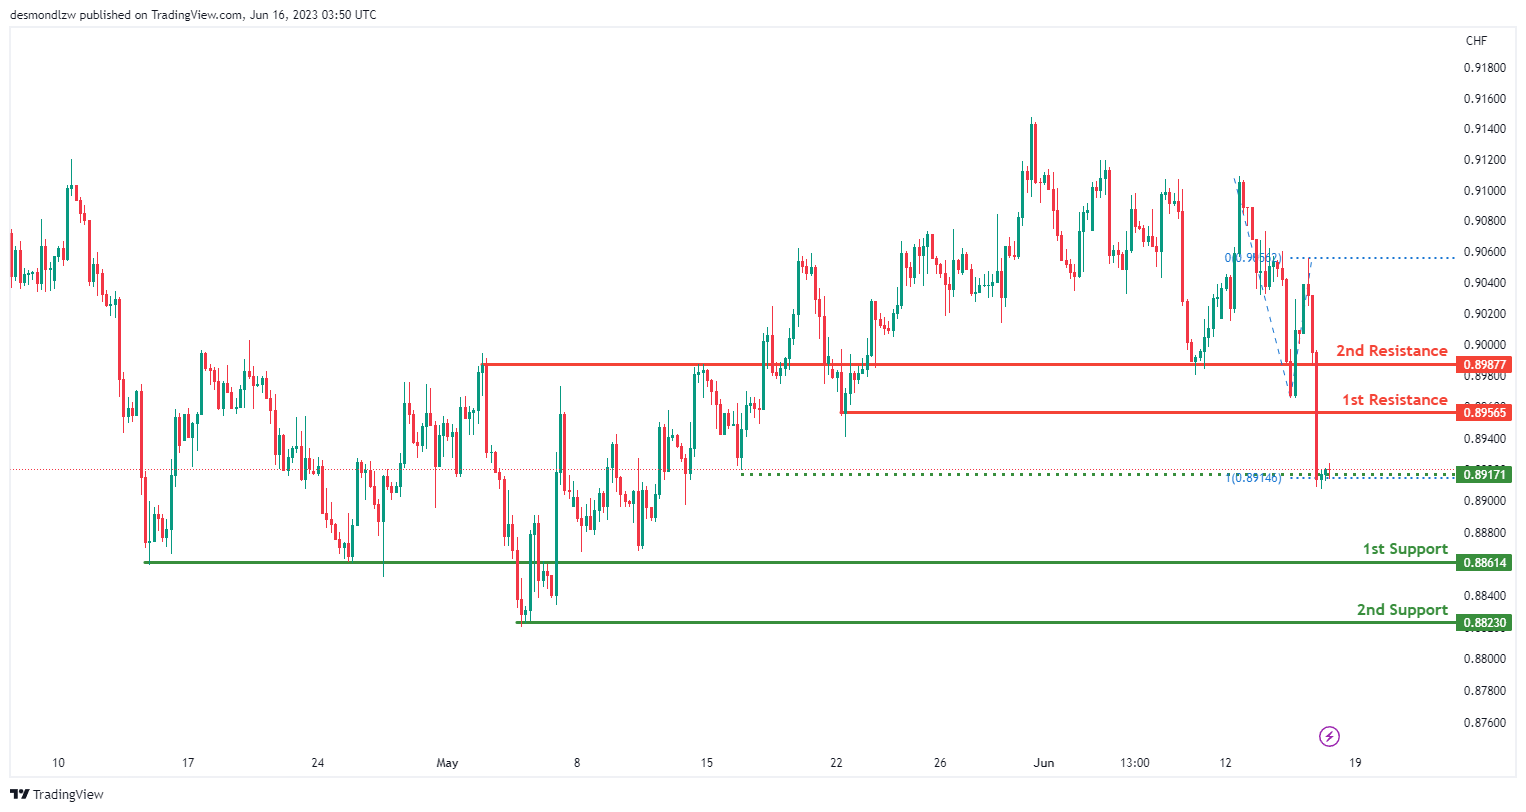
The USD/CHF chart currently exhibits a bearish momentum, indicating a downward trend in the market. Traders and investors should consider the potential for a bearish continuation towards the first support level at 0.8861.
The first support level at 0.8861 is significant as it represents a pullback support, potentially attracting buyers and providing a level of price stabilization. Additionally, the second support level at 0.8823 serves as swing low support, further reinforcing its importance.
On the upside, the first resistance level at 0.8956 acts as a pullback resistance, potentially limiting upward price movements. Similarly, the second resistance level at 0.8987 also functions as a pullback resistance.
Furthermore, an intermediate support level at 0.8972 holds significance as it coincides with a swing high resistance and the 100% Fibonacci Projection, further validating its importance as a potential support area.
USD/JPY:
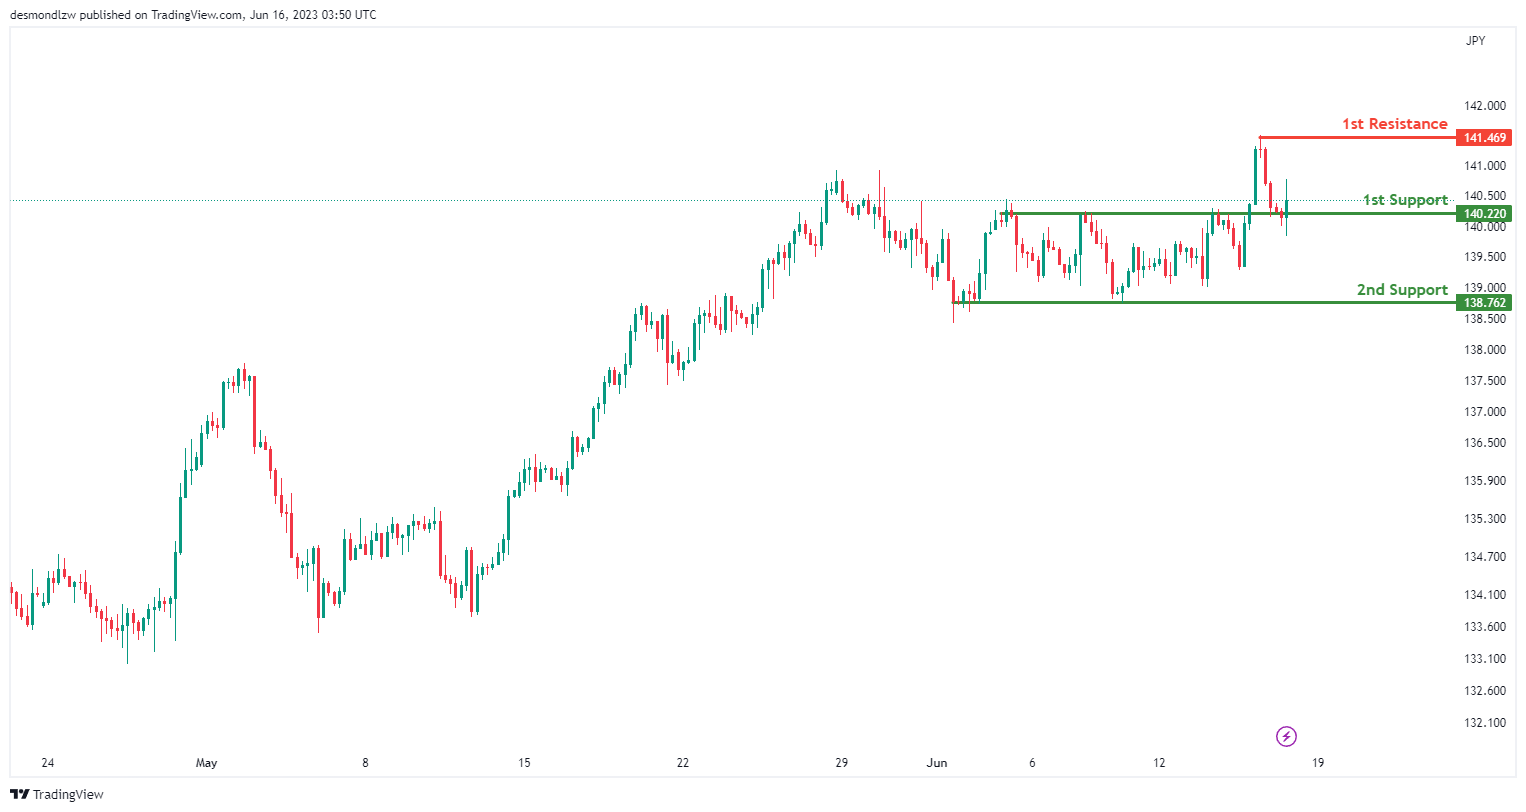
The USD/JPY chart currently demonstrates a bullish momentum, indicating an upward trend in the market. Traders and investors should consider the potential for a bullish continuation towards the first resistance level at 141.66.
The first support level at 140.22 is identified as an overlap support, suggesting its significance as a potential area where buyers may enter the market. Additionally, the second support level at 138.76 serves as a multi-swing low support, further reinforcing its importance.
On the upside, the first resistance level at 141.66 represents a swing high resistance, potentially acting as a barrier to further upward price movements.
USD/CAD:
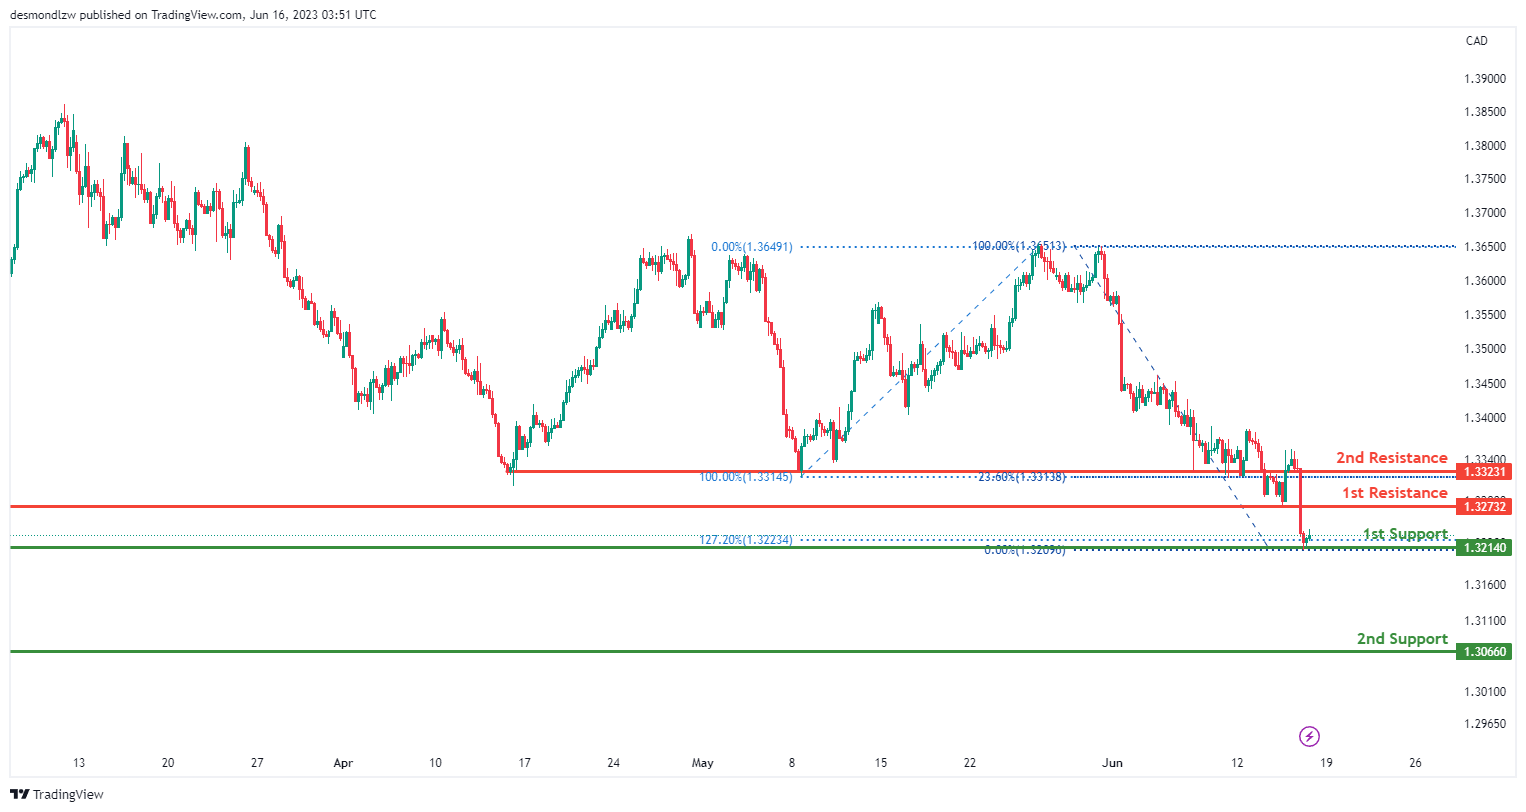
The USD/CAD chart currently exhibits a bullish momentum, indicating an upward trend in the market. Traders and investors should consider the potential for a bullish bounce off the first support level at 1.3215, leading the price towards the first resistance level at 1.3273.
The first support level at 1.3215 is recognized as a swing low support and aligns with the 127.20% Fibonacci Extension, highlighting its significance as a potential level where buyers may enter the market. Additionally, the second support level at 1.3066 serves as an overlap support, further reinforcing its importance.
On the upside, the first resistance level at 1.3273 represents a pullback resistance, coinciding with the 23.60% Fibonacci Retracement, potentially acting as a barrier to further upward price movements. Furthermore, the second resistance level at 1.3323 also acts as a pullback resistance.
AUD/USD:
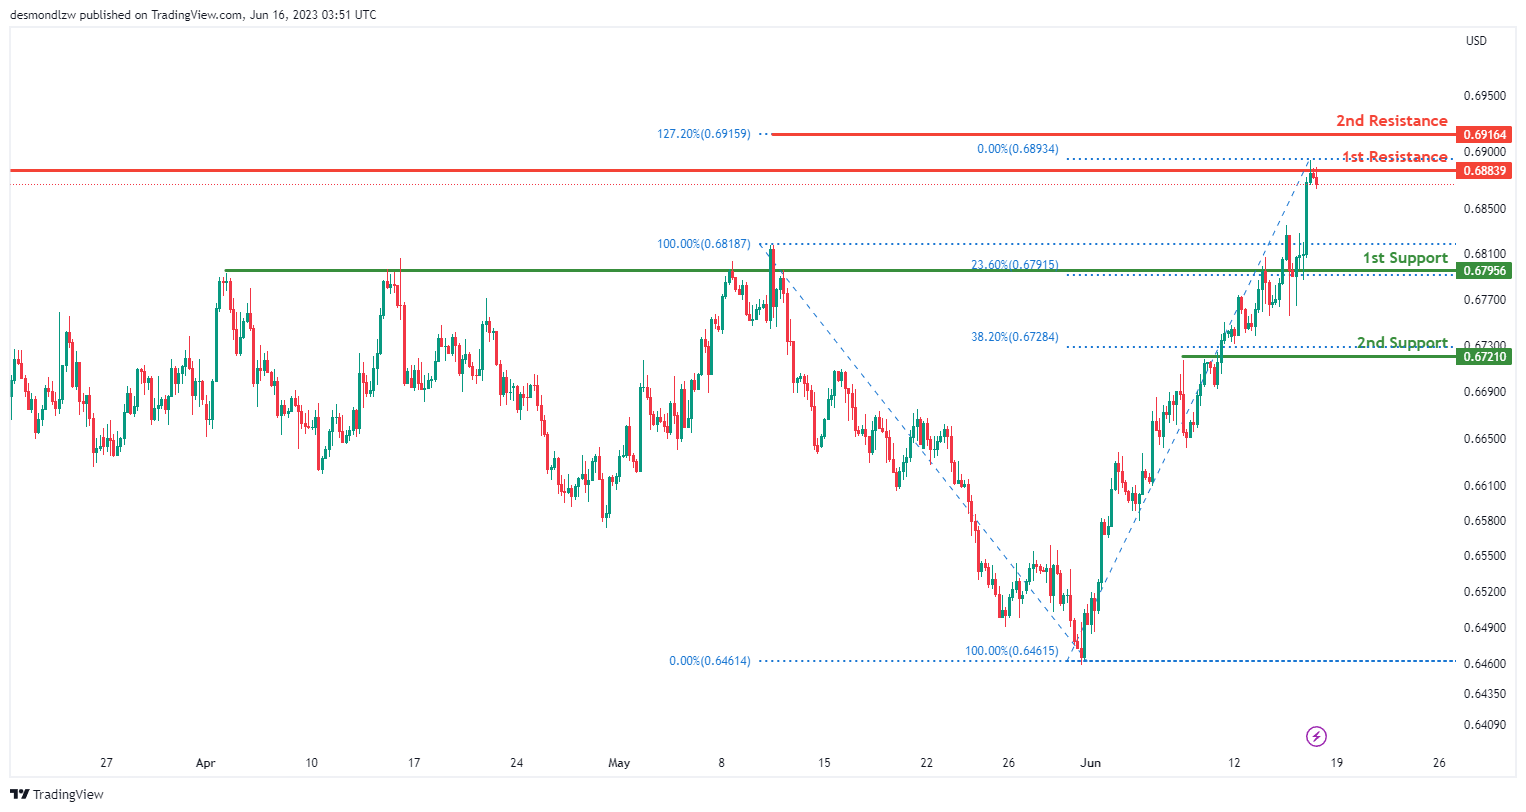
The AUD/USD chart currently shows a bearish momentum, indicating a downward trend in the market. Traders should consider the potential for a bearish reaction at the first resistance level of 0.6883, leading to a drop towards the first support level at 0.6795.
The first support level at 0.6795 is recognized as an overlap support, further reinforced by the presence of the 23.60% Fibonacci Retracement level. Additionally, the second support level at 0.6721 also serves as an overlap support, aligned with the 38.20% Fibonacci Retracement level.
On the upside, the first resistance level at 0.6883 represents a swing high resistance. Furthermore, the second resistance level at 0.6916 coincides with the 127.20% Fibonacci Extension.
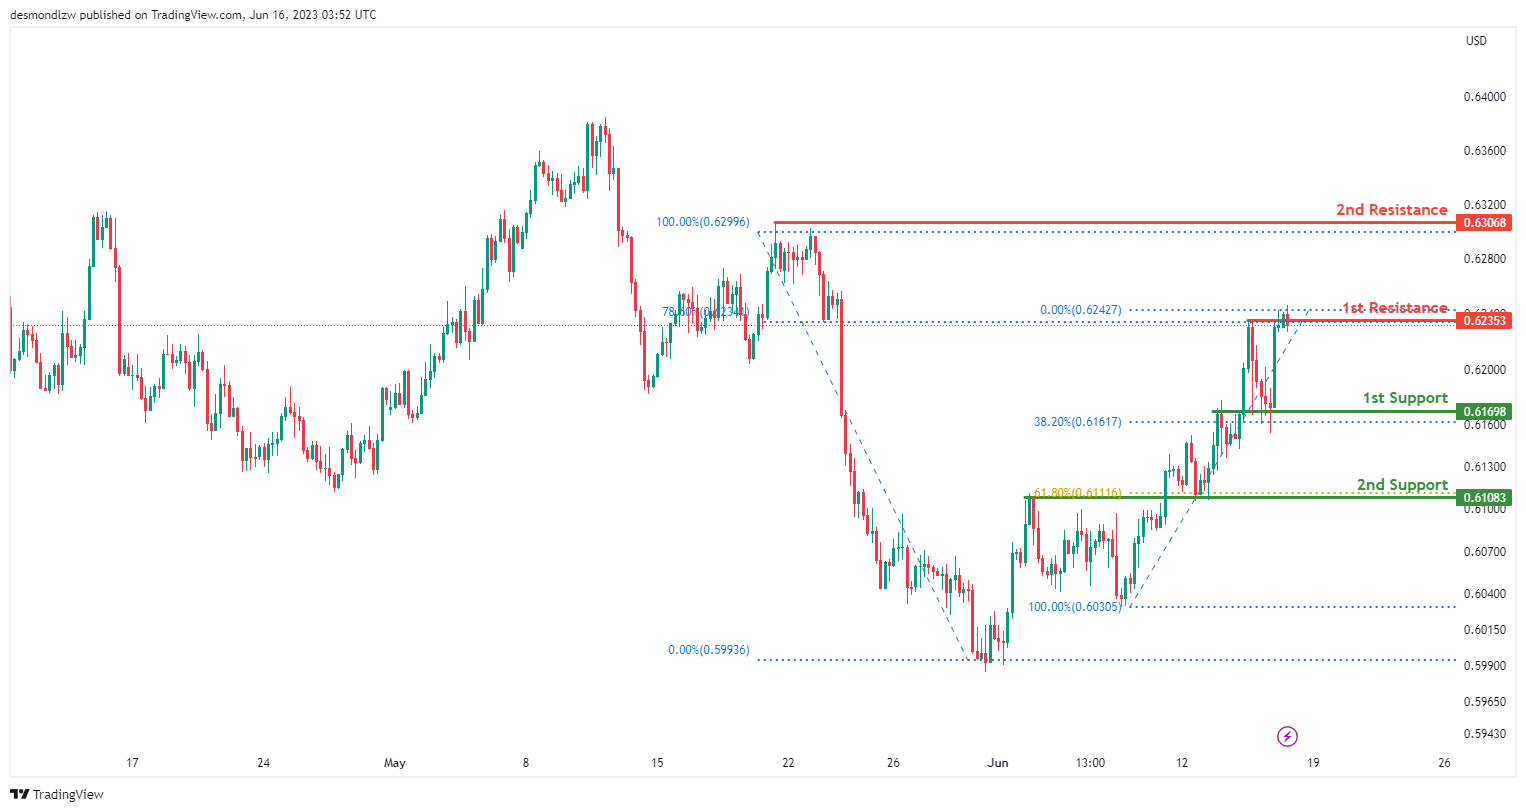
NZD/USD
The NZD/USD chart currently demonstrates a bearish momentum, indicating a downward trend in the market. Traders should consider the potential for a bearish reaction at the first resistance level of 0.6235, leading to a drop towards the first support level at 0.6169.
The first support level at 0.6169 is recognized as an overlap support and is further supported by the presence of the 38.20% Fibonacci Retracement level. Additionally, the second support level at 0.6108 also serves as an overlap support, aligned with the 61.80% Fibonacci Retracement level.
On the upside, the first resistance level at 0.6235 represents a swing high resistance. Furthermore, the second resistance level at 0.6306 also acts as a swing high resistance
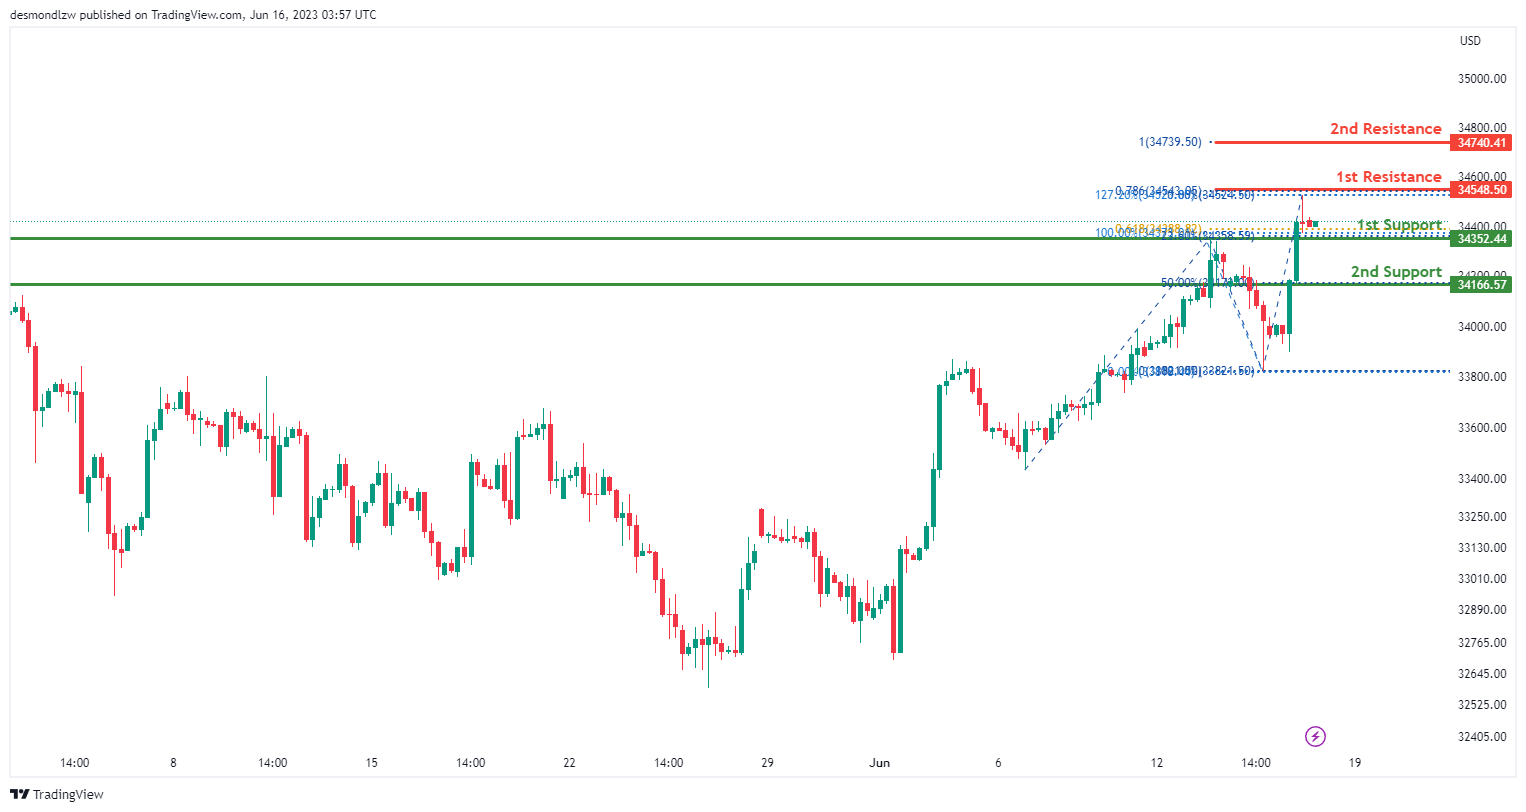
DJ30:
The DJ30 chart currently demonstrates a bullish momentum, indicating an upward trend in the market. Traders should consider the potential for a bullish bounce at the first support level of 34357.44, leading to a potential upward movement towards the first resistance level at 34548.50.
The first support level at 34357.44 is recognized as a pullback support and coincides with the 61.80% Fibonacci Projection level. Additionally, the second support level at 34166.57 serves as a pullback support.
On the upside, the first resistance level at 34548.50 represents a swing high resistance. It is further supported by the presence of the 127.20% Fibonacci Extension and 78.60% Fibonacci Projection, indicating Fibonacci confluence. Furthermore, the second resistance level at 23740.41 acts as a 100% Fibonacci Projection.
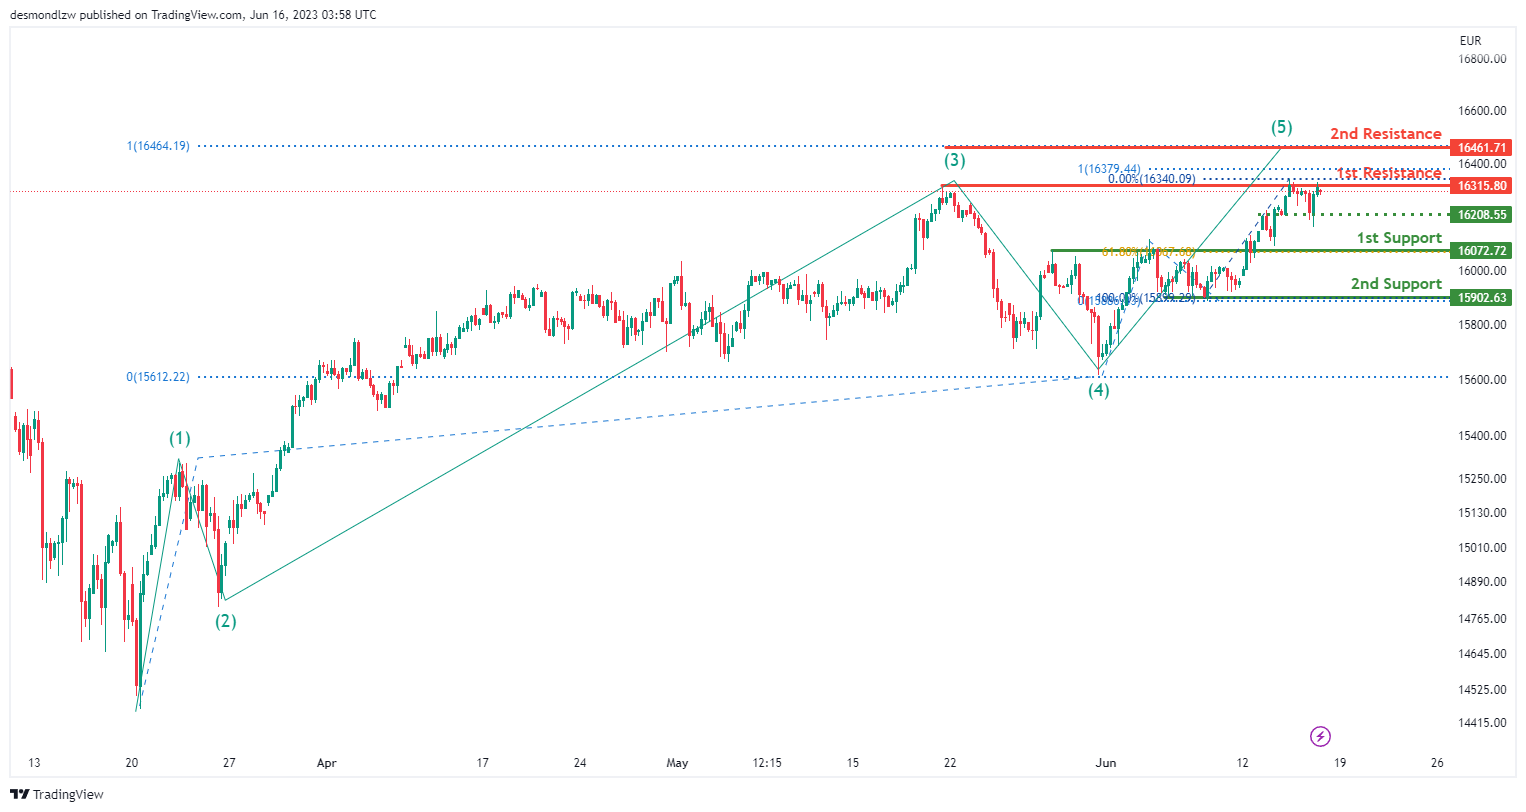
GER30:
The GER30 chart currently exhibits a bullish momentum, indicating an upward trend in the market. Traders should consider the potential for a bullish breakout at the first resistance level of 16315.80, with the price potentially rising towards the second resistance level at 16461.71.
The first support level at 16072.72 is identified as an area of overlap support, aligning with the 61.80% Fibonacci Retracement level. Additionally, the second support level at 15902.63 serves as another area of overlap support.
On the upside, the first resistance level at 16315.80 represents a significant multi-swing high resistance.
To continue towards the second resistance and complete Elliott Wave 5, it is necessary for the price to break above the first resistance level.
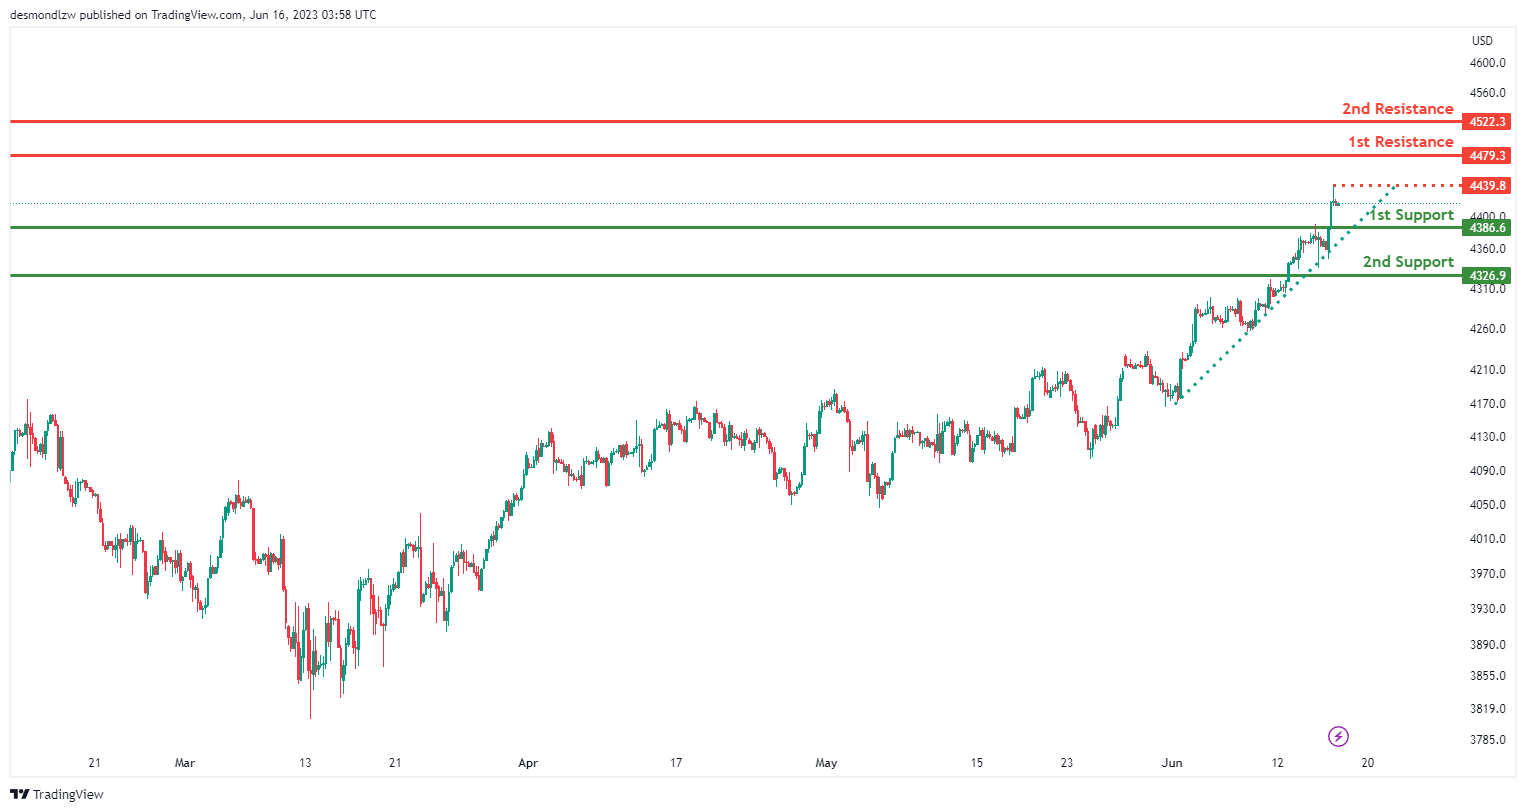
US500
he US500 chart currently demonstrates a bullish momentum, suggesting an upward trend in the market. The price’s position above a major ascending trend line further supports the potential for continued bullish momentum.
There is a possibility of a bullish continuation towards the first resistance level at 4479.3.
Key support levels include the first support at 4386.6, which serves as a pullback support, and the second support at 4326.9, identified as an overlap support.
On the upside, the first resistance level at 4479.3 acts as a pullback resistance, while the second resistance at 4522.3 represents an area of overlap resistance.
Additionally, the intermediate resistance at 4439.8 is recognized as a swing high resistance, contributing to its significance.
BTC/USD:
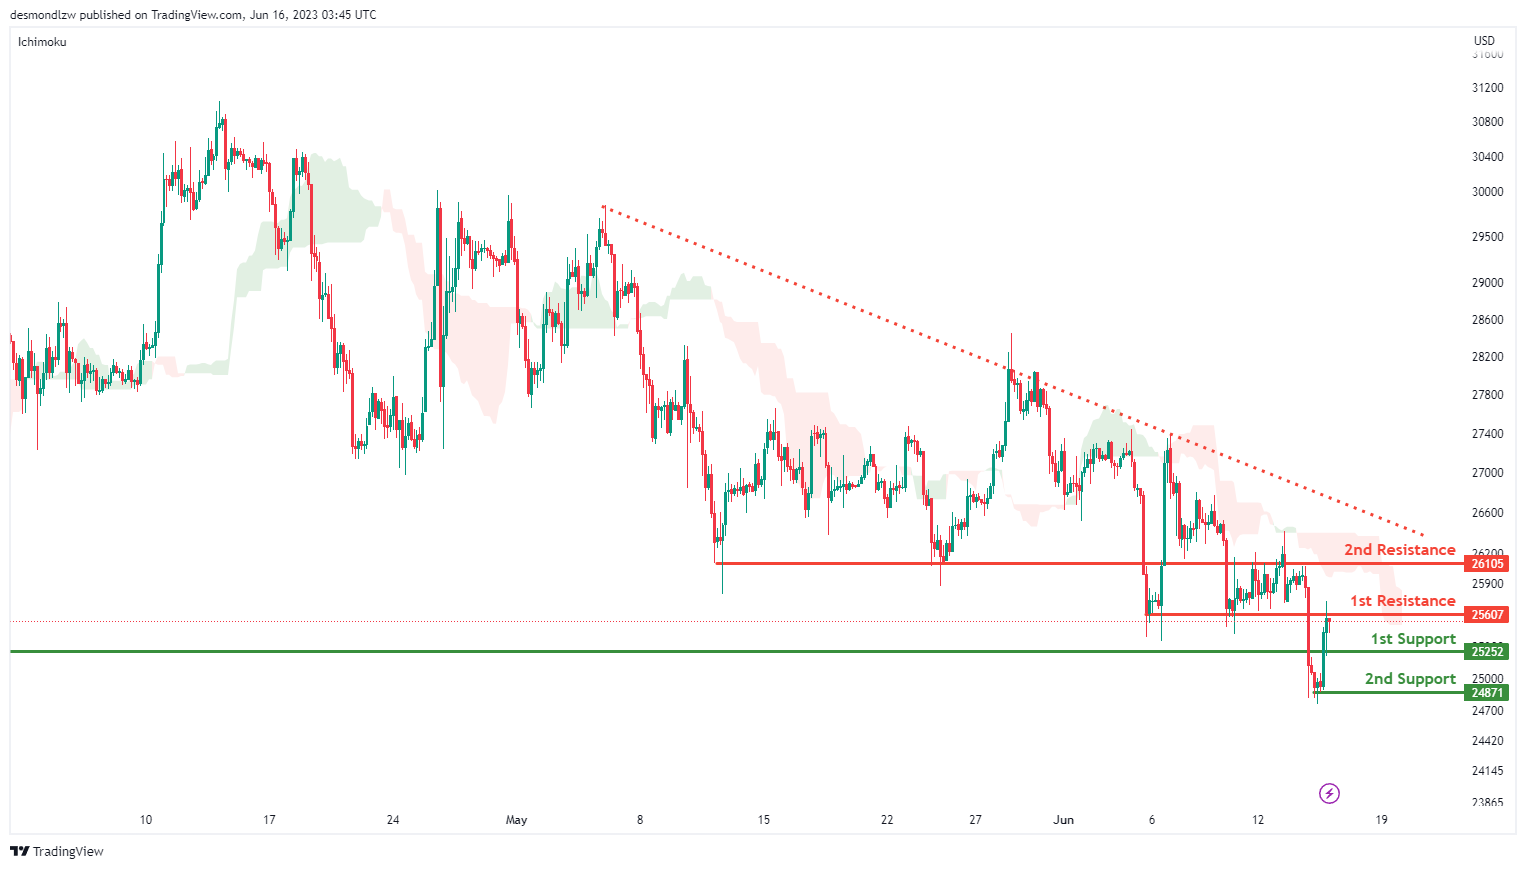
The BTC/USD chart currently exhibits a bearish momentum, indicating a downward trend in the market. This is supported by the price being below a major descending trend line and also below the bearish Ichimoku cloud.
There is a potential for a bearish reaction at the first resistance level of 25607, with a possible drop towards the first support level at 25252.
Key support levels include the first support at 25252, identified as an overlap support, and the second support at 24871, recognized as a swing low support.
On the upside, the first resistance level at 25607 acts as an area of overlap resistance, while the second resistance at 26105 also represents an overlap resistance.
ETH/USD:
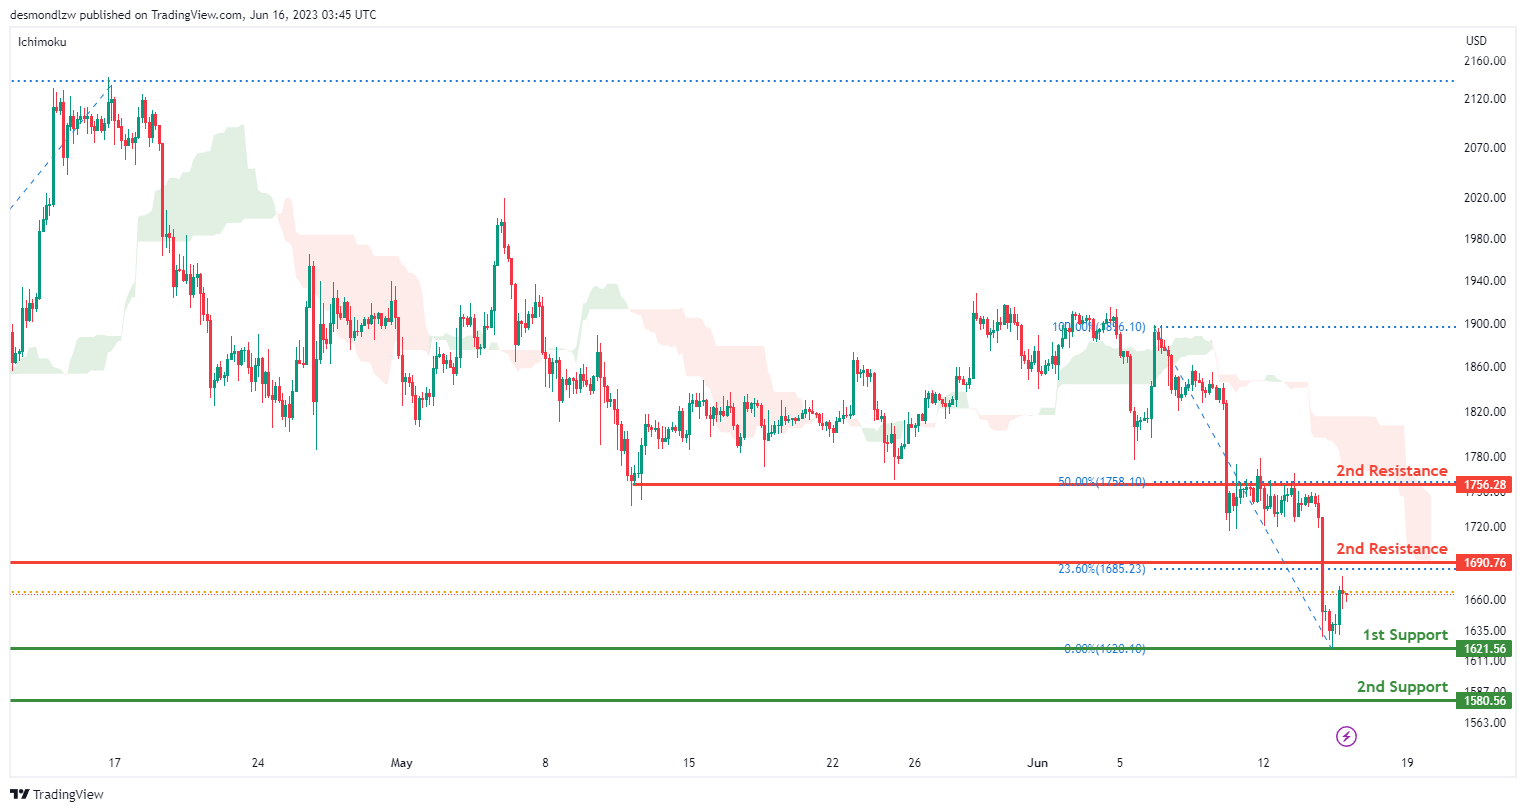
The ETH/USD chart currently demonstrates a bearish momentum, indicating a downward trend in the market. This is supported by the price being below the bearish Ichimoku cloud.
There is a potential for a bearish reaction at the first resistance level of 1690.76, with a possible drop towards the first support level at 1621.56.
Key support levels include the first support at 1621.56, recognized as a swing low support, and the second support at 1580.56, identified as an overlap support.
On the upside, the first resistance level at 1690.76 acts as a pullback resistance, and the second resistance at 1756.28 represents an area of overlap resistance coinciding with the 50% Fibonacci Retracement level.
WTI/USD:
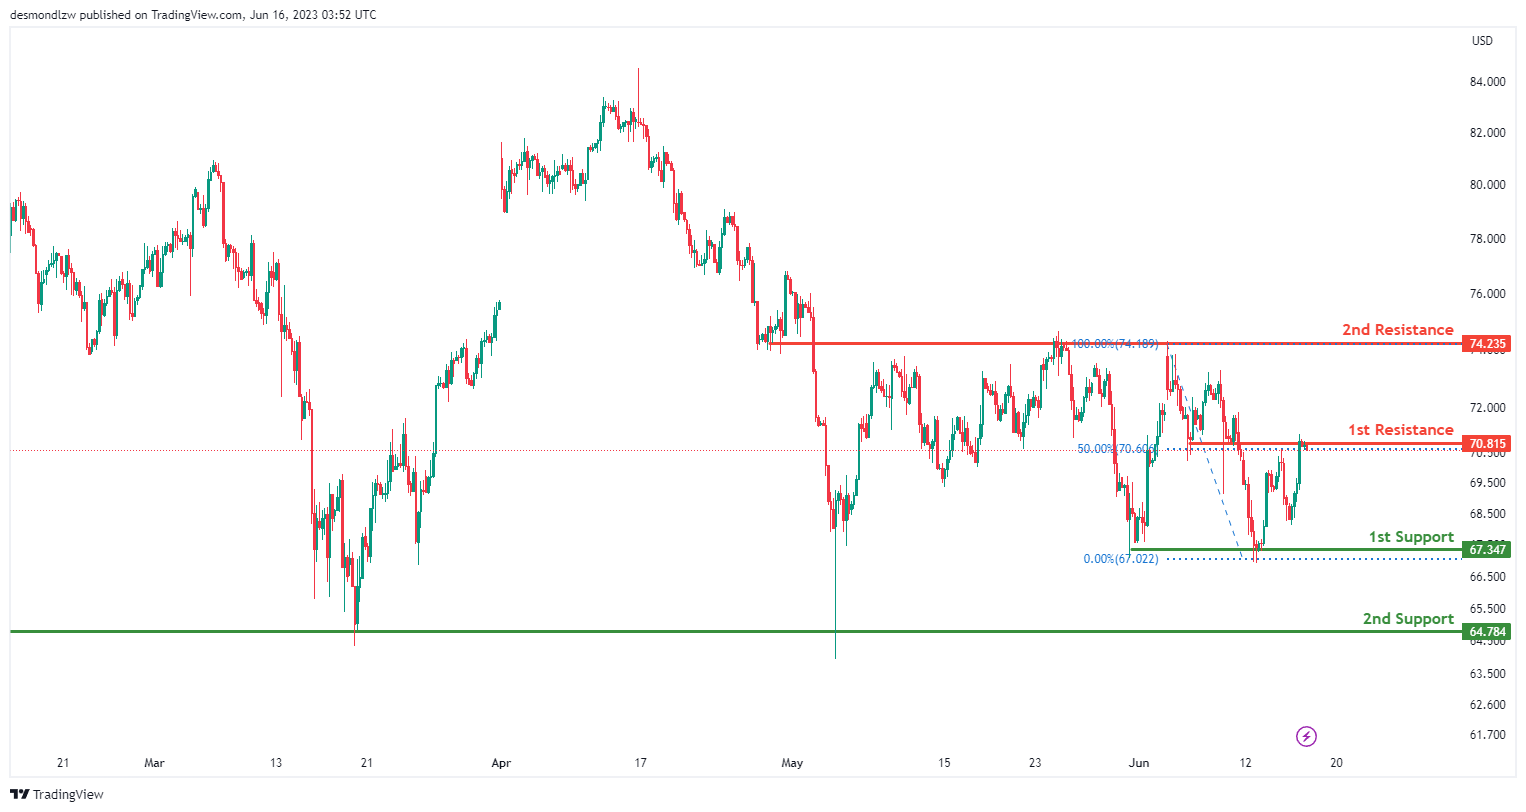
The WTI chart currently exhibits a bearish momentum, indicating a downward trend in the market. Factors contributing to this momentum are not provided.
There is a potential for a bearish reaction at the first resistance level of 70.81, with a possible drop towards the first support level at 67.34. Additional support can be found at the second support level of 64.78, both of which are identified as multi-swing low supports.
On the upside, the first resistance level at 70.81 represents an area of overlap resistance, and the second resistance level at 74.23 also serves as an overlap resistance.
XAU/USD (GOLD):
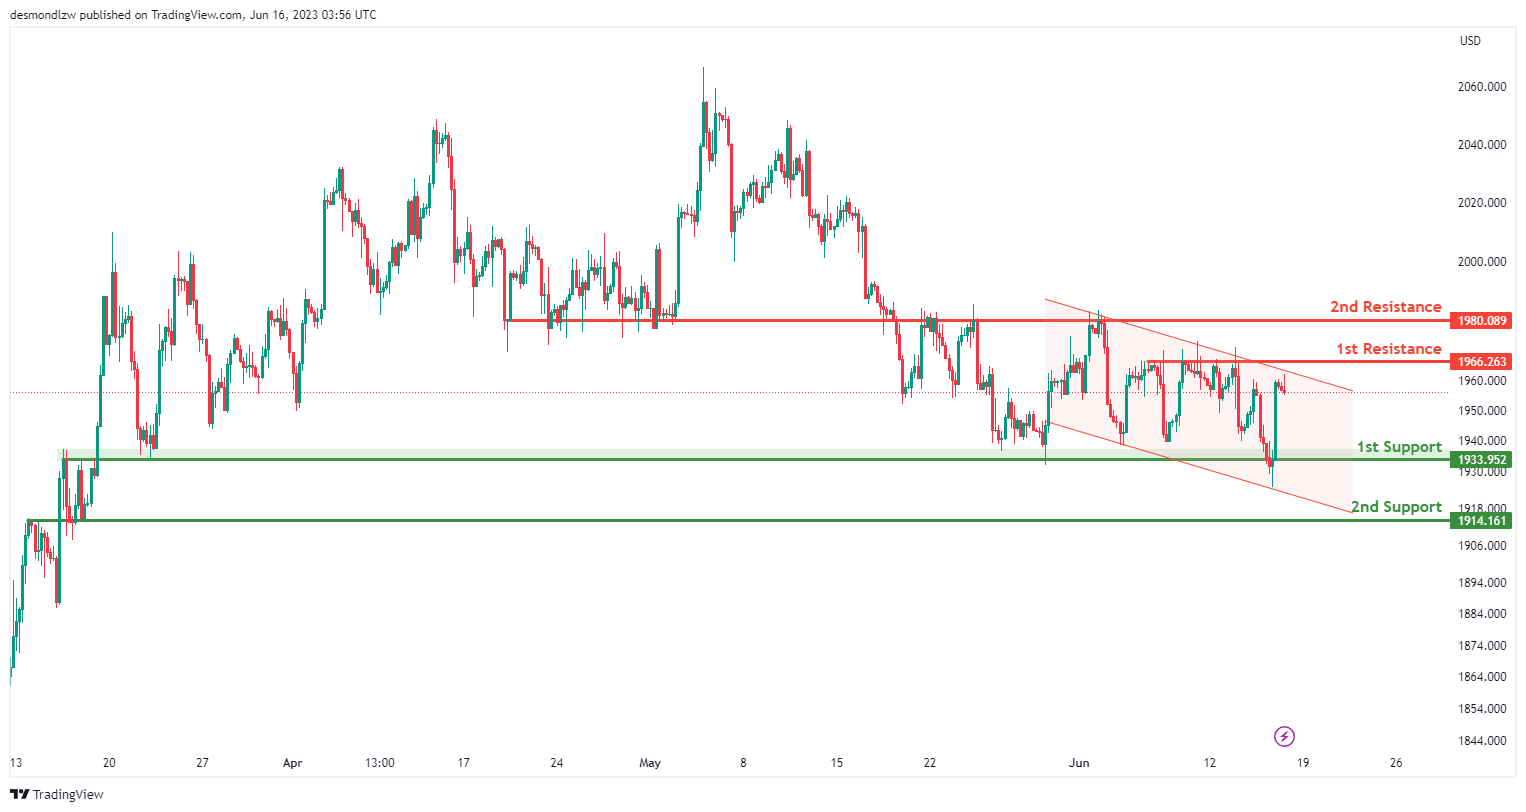
The XAU/USD chart currently demonstrates a bearish momentum, characterized by its movement within a descending channel. This suggests a prevailing downward trend in the market.
There is a potential for a bearish reaction at the first resistance level of 1966.26, indicating a likelihood of price reversal and a subsequent decline towards the first support level at 1933.95. Further support can be observed at the second support level of 1914.16. These levels are considered significant as they coincide with previous price levels, indicating areas where buyers may enter the market.
Conversely, the first resistance level at 1966.26 serves as a notable hurdle for upward price movement. It represents a multi-swing high resistance, suggesting a strong selling pressure at that level. The second resistance level at 1980.08 also acts as an overlap resistance, reinforcing its significance.
Cliff Notes: Central Banks Seek a Delicate Balance
Key insights from the week that was.
Westpac-MI Consumer Sentiment was broadly unchanged in June, the modest rise from 79.0 to 79.2 reflecting a deeply pessimistic view of the outlook. The RBA’s decision to raise the cash rate by 25bps was a key factor in June, those surveyed before the decision clearly more confident (+10pts to 89.0) than those surveyed afterwards (-6.4pts to 72.6). Another foreboding development in the month centred on the labour market, an area which broadly over this cycle has been a key support for confidence. Unemployment expectations increased 6.6% to an above-average read for the first time in the cycle. With 78% of respondents after the RBA decision anticipating further rate rises, a sustained rebound in confidence faces considerable headwinds, even if household’s perceptions of job prospects don’t weaken materially from here.
The labour market certainly remains in robust health for now. Indeed, the May labour force survey delivered an upside surprise, the +75.9k surge in employment surpassing even Westpac’s near top-of-the-market forecast. It was also encouraging to see ongoing strength in the supply side of the labour market, as both the participation rate and employment-to-population ratio printed fresh record highs alongside a fall in the unemployment rate to 3.6%. This strength can, in part, be explained as a bounce-back from an unusual seasonal ‘anomaly’ in April; though, with strength across multiple indicators, if the labour market is softening, it is only doing so at the margin.
Data on Australia’s overseas arrivals and departures was also constructive for the outlook. With permanent and long-term net arrivals still tracking at an appreciable +35k/mth average pace, ongoing strength in net arrivals from students and temporary workers as well as scope for further gains from China’s reopening, the recovery in net migration remains in full swing. These gains also follow historic strength last year, the ABS’ updated population estimate confirming net migration was +387k in 2022, consistent with our long-standing view.
Before moving offshore, a quick note on businesses. The latest NAB business survey provided further evidence of an economic slowdown and a fragile, pessimistic mood amongst businesses. The business conditions index fell by 7pts to +8 in May, well down from earlier highs and reflective of the loss of momentum within the Australian economy due to high inflation and rapid interest rate rises. Against this gloomy backdrop, business confidence moderated 4pts to -4, a mildly pessimistic reading that highlights growing concern over the near-term outlook for activity.
Note, following this week’s developments for the labour market, we have revised up our peak for the RBA cash rate. We now expect a hike at the July and August meetings, taking the cash rate to 4.60%. The first rate cut is also now expected to be delayed until May 2024, previously February 2024. The implications for growth and the labour market are material, with GDP growth of just 0.6%yr and 1.0%yr forecast for 2023 and 2024, and consequently the unemployment rate seen at 5.3% by end-2024. For full detail on the forecast changes, see Chief Economist Bill Evan’s note.
There was no shortage of fanfare offshore this week, with central bank meetings, activity indicators and price data across the major regions.
In the US, the FOMC expectedly left the fed funds rate unchanged at 5.125%. The accompanying statement was broadly the same as May, but the updated member forecasts showed greater confidence in the economy and uncertainty regarding inflation. This followed the May CPI report which showed an 11th consecutive month of deceleration from June 2022’s 9.1%yr peak. Note though that annual CPI inflation is still twice the FOMC’s medium-term 2.0%yr target at 4%yr and core inflation is higher still at 5.3%yr, in large part due to shelter’s contribution.
The FOMC’s headline PCE inflation forecasts are unchanged from March at 3.2%yr, 2.5%yr and 2.1%yr 2023 through 2025; but the underlying strength of the economy saw core PCE inflation revised up 0.3ppts to 3.9%yr in 2023 and kept broadly unchanged at 2.6%yr and 2.2%yr for 2024 and 2025. That the end-2025 core PCE inflation forecast is above the 2.0%yr policy target is arguably as significant as the revision to 2023.
Consequently, FOMC members now project a year-end peak for the fed funds rate in 2023 of 5.6%, 50bps higher than March. The end-2024 and 2025 forecasts are also 30bps higher than the prior set, respectively 4.6% and 3.4%. Versus the ‘longer-run’ estimate of 2.5%, this implies Committee members believe it will prove necessary to keep policy restrictive for more than 2.5 years from today.
On balance, the FOMC’s June decision leads us to believe one more 25bp hike in July is the most likely course – come early-2024 we expect the case to have been made for rate cuts.
Elsewhere in the US, retail sales surprised to the upside rising 0.3%mth in May supported by an uptick in building materials and gardening equipment. Stripping away volatile components, retail sales rose 0.2%mth versus 0.5%mth in April, indicating discretionary spending is being tempered. Initial jobless claims held up at their highest level since 2021 last week; however, claims are still near their historic low.
Over in Europe, the ECB lifted rates by 25bps as underlying inflation remained strong. While the statement acknowledged inflation has decelerated, updated projections point to inflation remaining sticky. Underlying inflation is expected to reach 5.1%yr in 2023 (previously 4.6%yr), 3%yr in 2024 (previously 2.9%yr) and then come down to 2.3%yr by 2025 (previously 2.1%yr). These forecast compare to May’s 5.3%yr read. Given the upgraded inflation outlook, it was no surprise that President Lagarde characterised a July rate hike as ‘very likely’ at the press conference. Views on the meetings beyond were relatively non-committal, with the Governing Council intent on remaining data dependent.
Coming back to Asia, China’s May data came in weaker than April, which also was a downside surprise. Fixed asset investment nudged down to 4.0%yr year-to-date as a result of slower growth in state-owned projects and a small decline in private investment. The slowdown in investment will be of concern to policymakers whose growth and social ambitions rely on capacity and income expansion into the medium term.
Unsurprisingly, the PBoC cut the 7-day reverse repo rate by 10 basis points, and followed up with a cut in the medium-term lending rate. But for firms and the consumer, there is need for additional support. On consumption, retail sales growth slowed in May to 12.7%yr from the 18.4%yr seen in April. Services spending continues to outpace goods coming out of lockdown. Highlighting the impact of decelerating developed-world demand, industrial production was lacklustre, growing 3.5%yr, or 3.6%yr year-to-date. Out of the 16 categories, 13 reported increases in year-to-date terms. Of particular note, the production of electric vehicles has ramped up substantially compared to a year ago.
BoJ holds steady, core CPI to decelerate towards middle of fiscal 2023
In a widely expected move, BoJ today unanimously voted to maintain its existing ultra-loose monetary policy. The central bank kept short-term policy rate at -0.10% under its yield curve control. Yield target on 10-year JGB remains around 0%, with fluctuation band allowed also maintained at about plus and minus 0.50% from the target level. BoJ reiterated its commitment to carry on with its Quantitative and Qualitative Monetary Easing with Yield Curve Control "as long as it is necessary" and affirmed it "will not hesitate to take additional easing measures if necessary."
In its accompanying statement, BoJ noted that it anticipates Japan's economy to witness moderate recovery by around middle of the fiscal year 2023. "Thereafter, as a virtuous cycle from income to spending gradually intensifies, Japan's economy is projected to continue growing at a pace about its potential growth rate," the central bank said.
Discussing the inflation outlook, the bank stated: "The year-on-year rate of increase in the CPI (all items less fresh food) is likely to decelerate toward the middle of fiscal 2023, with a waning of the effects of the pass-through to consumer prices of cost increases led by the rise in import prices.
"Thereafter, the rate of increase is projected to accelerate again moderately, albeit with fluctuations, as the output gap improves and as medium- to long-term inflation expectations and wage growth rise, accompanied by changes in factors such as firms' price- and wage-setting behavior."
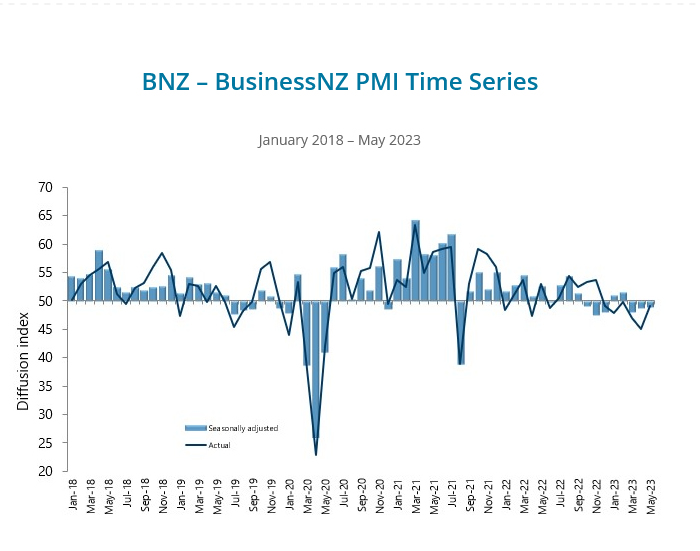
NZ BNZ PMI ticked up to 48.9, staying in relatively tight band of contraction
New Zealand BusinessNZ Performance of Manufacturing Index ticked up from 48.8 to 48.9 in May, staying well below long-term average activity rate of 53.0. Looking at some details, production dropped from 47.0 to 45.7. Employment rose from 47.7 to 49.5. New orders rose from 49.6 to 50.8. Finished stocks dropped from 52.5 to 51.5. Deliveries dropped from 50.7 to 46.0.
BusinessNZ's Director, Advocacy Catherine Beard said: "New Zealand's manufacturing sector has remained in a relatively tight band of contraction for the last three months. While the overall activity result has crept upwards over that time."
BNZ Senior Economist, Craig Ebert stated that "the range of results in the sub-components is mirrored in the breadth of issues manufacturers are now highlighting in the survey. Gone is the dominance of supply-side laments, especially regarding staff. But new negatives have arisen, for all of them to (still be) outnumbering the positive issues referenced".
Growth Forecasts Lower – RBA to Hike in Both July and August
In March, when we last revised our economic forecasts, we expected growth of 1% in 2023 to be followed by a tepid 1.5% in 2024.
That was based on an RBA cash rate peak of 4.1% in May with an easing in the cash rate beginning in February 2024.
Those growth forecasts were well below consensus at the time (the RBA had 1.6% growth for 2023) while the cash rate outlook was also above consensus.
Westpac has now lowered its growth forecasts to 0.6% in 2023 and 1.0% in 2024.
The key driver of this insipid growth outlook is household consumption which we now expect to grow by just 0.3% in 2023 and 0.6% in 2024 (the latter consisting of a -0.3% contraction in H1 and +0.9% lift in H2). This consumption profile is consistent with the very weak measures of Consumer Sentiment we have seen since the onset of high inflation and rising interest rates in 2022.
The forecasts mean per capita spending recessions in both 2023 and 2024 of -1.5% in 2023 followed by -1.0% in 2024. It also implies GDP per capita recessions of -1.2% in 2023 and -0.6% in 2024.
This consumption profile is decidedly weaker than consumption growth during the deep recession years of the early 1990s when annual growth remained positive (+1.2% in 1990 and +1.9% in 1991).
The main difference between the outlook for 2023 and 2024 and the deep recession of 1990 and 1991 is around business investment which contracted by 13.3% in 1990 and 16.7% in 1991 compared to our forecasts of +4.7% and -3.9% for 2023 and 2024 respectively.
The difference in the business investment profile is attributed mainly to forecasts of solid investment growth in infrastructure; renewables; and mining investment. However, we do expect businesses to respond to the weakening sales outlook with a 15% reduction in equipment investment in the year to June 2024.
Consumer spending prospects, in the face of high inflation and sharply higher interest rates, would be even weaker were it not for the substantial savings buffer that households accumulated during the pandemic and the strong starting point for jobs. The tightest labour market conditions in 50 years and still elevated job vacancies are providing clear support to household incomes and spending, but also give those households coming under more intense financial pressure more scope to make adjustments.
Following the RBA's decision to raise the cash rate to 4.1% in June we lifted our forecast for the cash rate peak to 4.35% on the expectation of a further immediate 0.25% increase in July while noting that there was "considerable risk" of a follow-on move in August.
The May Labour Force Survey tips the balance on our August call. It showed an increase in employment of 76,000, outstripping even our top-of-the range forecast for a 40,000 bounce from a small decrease in April that looked to be mainly due to an Easter-related seasonal anomaly. The stronger rebound means we now have average growth of 36,000 jobs over the two months – around the monthly pace we have seen over the past year, indicating no significant slowing of jobs growth despite the RBA's 400 basis points of tightening over the same period. The evidence of strong ongoing momentum in the labour market is sufficient to trigger the "considerable risk" of an August rate hike in our central forecast.
We now expect a further final increase in the cash rate of 0.25% to 4.6% at the August Board meeting, for a peak in the cycle of 4.6%.
This extension of the tightening cycle to August, with the ongoing evidence of a tight labour market, now indicates that the beginning of the easing cycle which we anticipated for February will be delayed to May.
Next year, with labour markets remaining tight for longer than we expected back in March, the RBA Board will require further convincing that the inflation path will land within the 2-3% target zone by June 2025. They will have little choice but to hold-off on the much-needed rate relief by three months. Accordingly, we now expect 25 basis point rate cuts in May; August and November 2024 prior to further cuts in 2025 eventually bringing the cash rate below 3%, our estimate of 'neutral', by year-end.
Given the higher interest rate path than we expected in March it is reasonable to have considered an even larger downside revision to our growth forecasts. But a number of offsetting factors are at play including: higher population growth than expected back in March; a much lower AUD (now forecast to be at USD0.69 by year's end compared to March forecast of USD0.74); stability in the housing market rather than a further year of house price falls; and upsides to household income growth as labour markets remain tighter for longer, wage setting arrangements are adjusted in favour of higher wage outcomes, and fiscal measures provide some additional support.
Consistent with our views in March, our forecasts are based on an additional gradual increase in average mortgage rates over the next year coming from 'fixed rate roll-offs' as up to 30% of fixed-rate loans transition to much higher floating rates (increases generally from 2% to 5.5-6.0%). With the RBA's rate increases from May, June, and (expected) July and August also being passed on, the average mortgage rate over the next year or so will rise by at least 150 basis points – nearly 40% of the current tightening cycle of 400 basis points.
This weaker growth profile has also seen us raise our target unemployment rate for end 2024 from 5% to 5.3%.
Do these growth adjustments constitute a recession?
The standard definition of a 'technical recession' is two consecutive negative quarters of GDP growth. Our forecasts now contain one negative quarter – the March quarter of 2024 (–0.2%) while our forecasts for the adjacent quarters – December quarter 2023 (+0.1%) and June quarter 2024 (+0.2%) – are still positive although well within the range of forecast error. Consequently, on this definition, we are not forecasting a technical recession but recognise the high degree of uncertainty.
There are a range of other ways to define a recession. An increase in the unemployment rate from 3.5% at the beginning of 2023 to 5.3% at the end of 2024 might fit an alternative definition of a recession although we are unaware of any formal definition.
Note that our forecasts also imply per capita spending and GDP recessions in 2023 and 2024, which is sometimes used as an alternative measure definition of recession (see above).
Risks
The significant change in the emphasis of priorities delivered by the Governor in his June decision statement – from staying on the 'narrow path' of protecting post pandemic employment gains to containing inflationary expectations and worrying about rising unit labour costs pointed to those further nearterm rate increases.
Our down-beat growth forecasts reflect that policy outlook.
Given the notable resilience of the labour market to date; the prospect of adjustments to industrial relations arrangements that will add pressure to wages growth; and the lift to wage expectations from recent award wage decisions we cannot dismiss prospects of even further increases in the cash rate.
For now, we will bow to the prospect of ongoing tepid growth eventually containing these inflation pressures, expecting rates to go on hold beyond August. But we cannot entirely dismiss these risks and the inevitable implications for the state of the economy in 2024.
USD/JPY Remains Supported For More Upsides
Key Highlights
- USD/JPY traded above the 140.00 and 140.50 resistance levels.
- A major bullish trend line is forming with support near 139.40 on the 4-hour chart.
- EUR/USD rallied above the 1.0850 and 1.0880 resistance levels.
- GBP/USD surged and broke the 1.2650 resistance zone.
USD/JPY Technical Analysis
The US Dollar remained in a positive zone above the 139.20 support against the Japanese Yen. USD/JPY climbed higher above the 139.50 and 140.00 resistance levels to move into a positive zone.
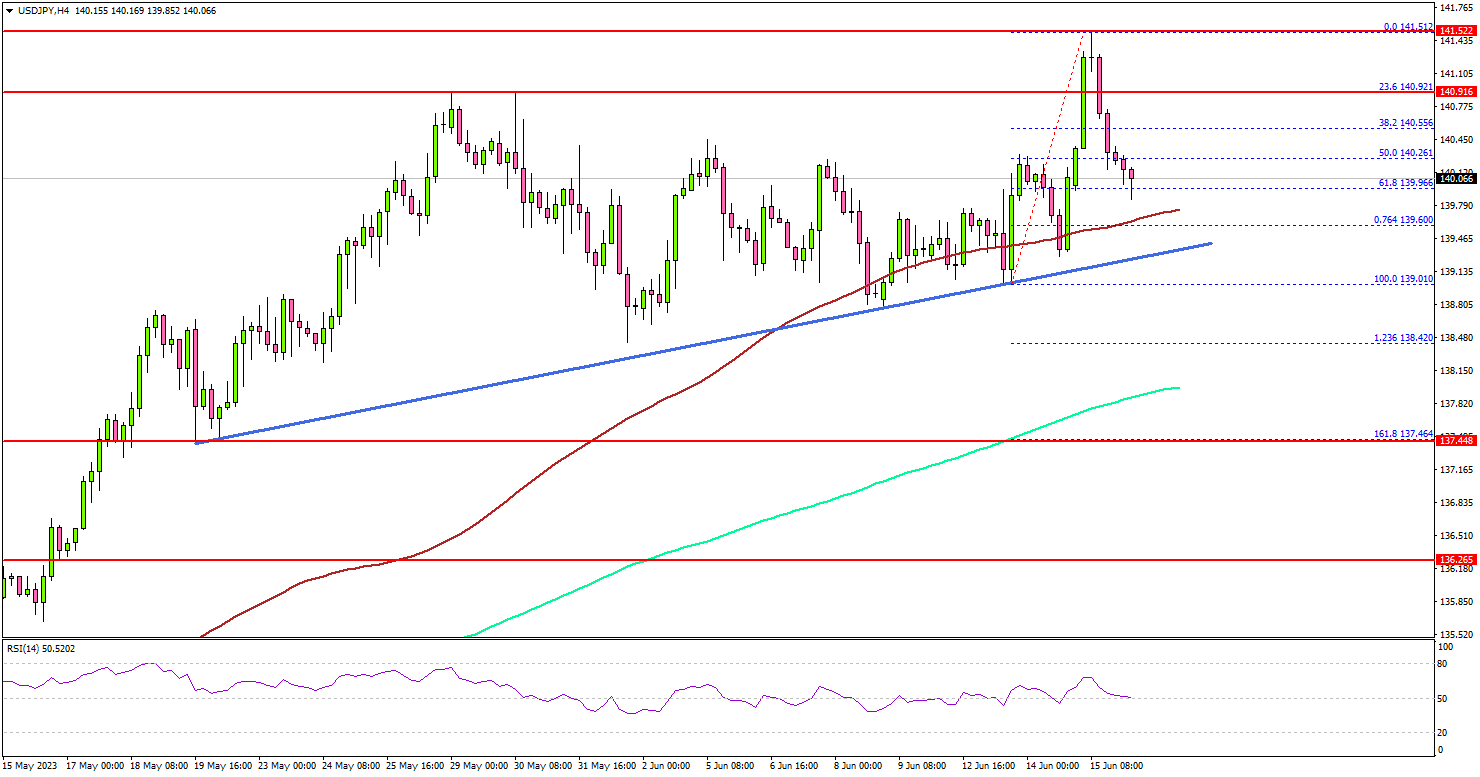
Looking at the 4-hour chart, the pair settled above the 140.00 level, the 100 simple moving average (red, 4 hours), and the 200 simple moving average (green, 4 hours).
Finally, there was a move above the 141.00 level. A high was formed near 141.51 before the pair started a downside correction. There was a move below the 140.80 level. The pair declined below the 50% Fib retracement level of the upward move from the 139.01 swing low to the 141.51 high.
Immediate support is near the 139.60 level or the 76.4% Fib retracement level of the upward move from the 139.01 swing low to the 141.51 high.
There is also a major bullish trend line forming with support near 139.40 on the same chart. The next major support is near the 139.20 level. If there is a downside break below the 139.20 support, the pair could decline toward the 138.50 support. Any more losses might send USD/JPY toward 138.00.
If there is a fresh increase, the pair could face resistance near 141.20. The first major resistance is near the 141.50 level. If there is a move above the 141.50 resistance, the pair could rise toward 142.20.
Looking at EUR/USD, the pair accelerated higher above the 1.0850 resistance zone and is showing a lot of positive signs on the 4-hour chart.
Economic Releases
- Euro Zone HCPI for May 2023 (YoY) - Forecast +6.1%, versus +6.1% previous.
- Euro Zone HCPI for May 2023 (MoM) - Forecast 0%, versus 0% previous.
GBPUSD Wave Analysis
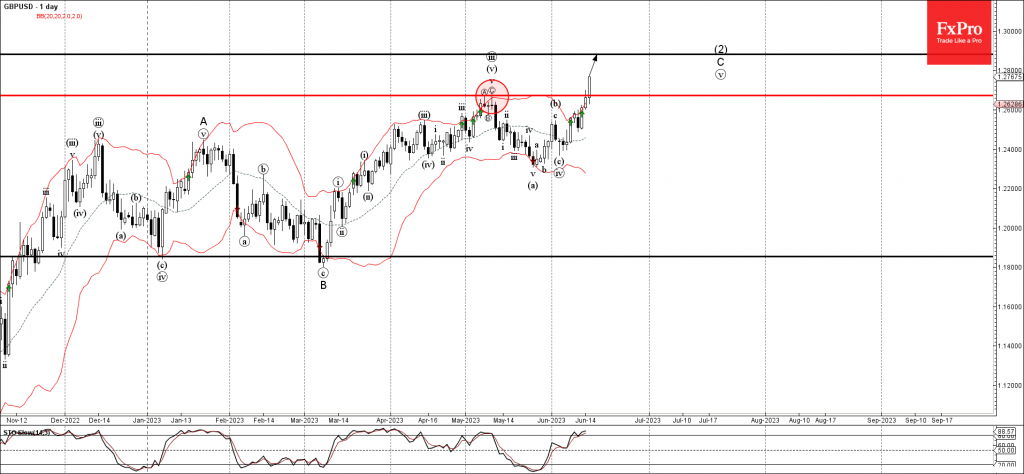
- GBPUSD broke key resistance level 1.2675
- Likely to rise to resistance level 1.2880
GBPUSD currency pair recently broke above the key resistance level 1.2675 (which stopped the previous sharp upward impulse wave (iii) at the start of May).
The breakout of the resistance level 1.2675 accelerated the C-wave of the active ABC correction (2) from the end of last year.
Given the strong daily uptrend and massive USD sales after Federal Reserve announced the rate hike pause, GBPUSD can be expected to rise further toward the next resistance level 1.2880 (target for the completion of the active impulse wave C).
Gold Wave Analysis
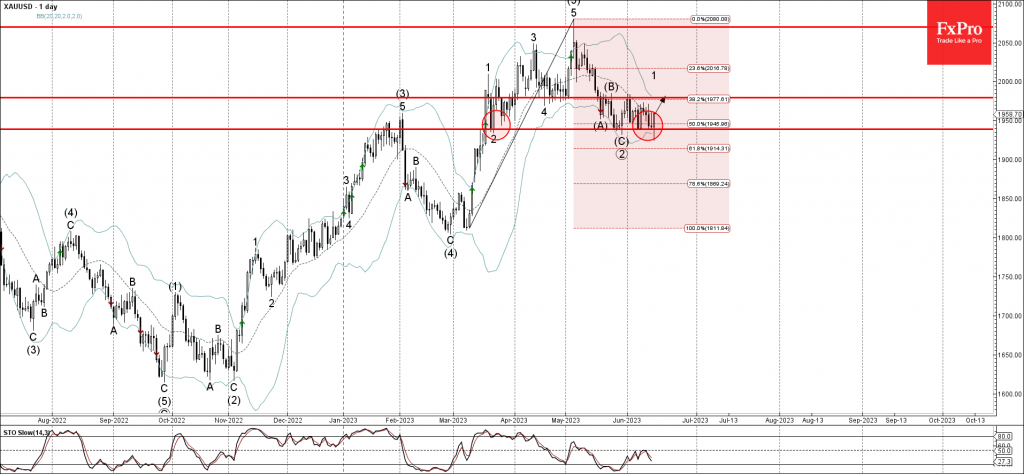
- Gold reversed from support level 1940.00
- Likely to rise to resistance level 1980.00
Gold recently reversed up from the pivotal support level 1940.00 (which has been reversing the price from the middle of March).
The support level 1940.00 was strengthened by the lower daily Bollinger Band and by the 50% Fibonacci correction of the sharp upward impulse from March.
Given the clear daily uptrend, Gold can be expected to rise further toward the next resistance level 1980.00 (top of wave B from the end of last month).