Sample Category Title
EUR/USD Analysis: +1.4% in 2 Days
The current high growth rate, which was last seen in November 2022, was the result of decisions by central banks:
→ on Wednesday, the US Federal Reserve kept the interest rate at 5.25%;
→ and on Thursday, the ECB raised the rate from 3.75% to 4%. Eurozone inflation will remain "too high for too long," Lagarde said. The possibility of a rate hike in July is "very likely".
If the Fed started to apply the tightening policy earlier and came to a pause in a series of rate hikes faster, in turn the ECB is taking similar actions, but with some lag in time.
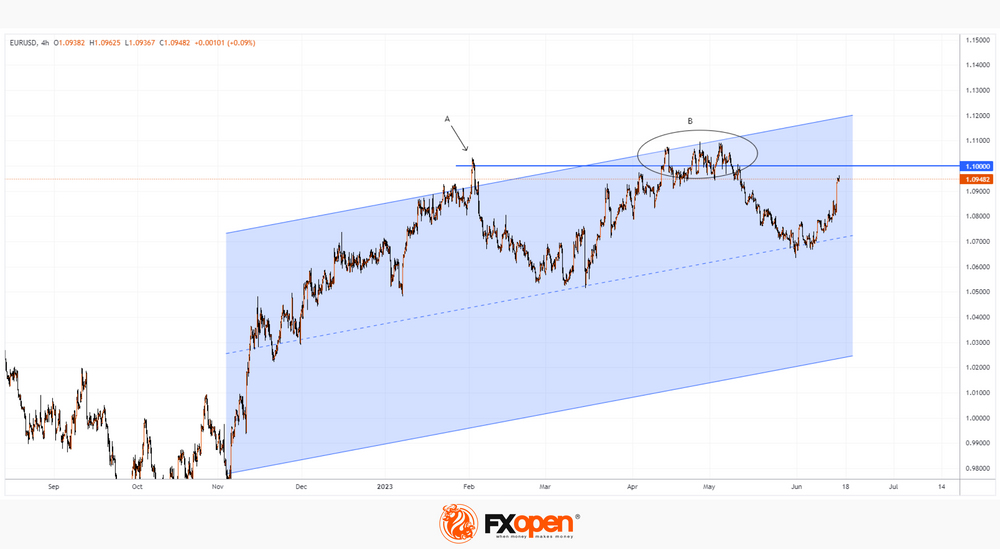
On Friday morning, the EUR/USD rate reached 1.096. The EUR/USD chart shows that:
→ price dynamics continues to develop an upward channel (shown in blue);
→ the EUR/USD rate is approaching the psychological mark of 1.1. If in February the bulls suffered a quick setback (A), and in April-May they managed to linger (B) around this mark, then the continuation of the current momentum can lead to a successful bullish breakout and fixing the rate above 1.1.
AUD/USD and NZD/USD Regain Strength
AUD/USD is gaining pace and might climb further higher above 0.6900. NZD/USD is also showing positive signs above the 0.6200 resistance zone.
Important Takeaways for AUD USD and NZD USD Analysis Today
- The Aussie Dollar started a fresh increase above the 0.6780 and 0.6830 levels against the US Dollar.
- There is a key bullish trend line forming with support near 0.6830 on the hourly chart of AUD/USD at FXOpen.
- NZD/USD is gaining bullish momentum above the 0.6200 support.
- There is a major bullish trend line forming with support near 0.6200 on the hourly chart of NZD/USD at FXOpen.
AUD/USD Technical Analysis
On the hourly chart of AUD/USD at FXOpen, the pair started a fresh increase from the 0.6740 support. The Aussie Dollar was able to clear the 0.6780 resistance to start a steady uptrend against the US Dollar.
There was a close above the 0.6830 resistance and the 50-hour simple moving average. Finally, the pair tested the 0.6890 zone. A high is formed near 0.6892 and the pair is now consolidating gains. The AUD USD chart indicates that the pair is now facing resistance near 0.6892.
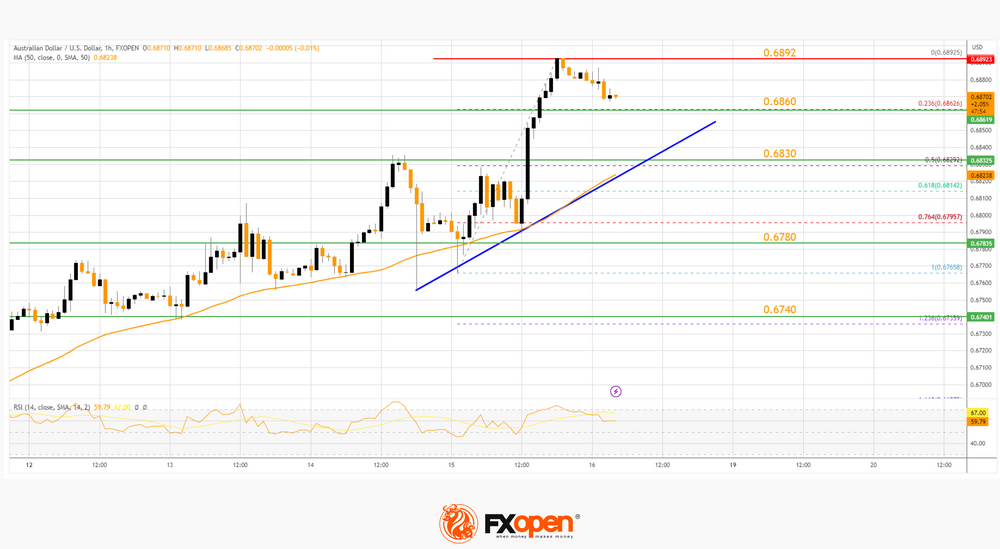
The first major resistance might be 0.6900. An upside break above the 0.6900 resistance might send the pair further higher. The next major resistance is near the 0.6950 level. Any more gains could open the doors for a move toward the 0.7000 resistance zone.
On the downside, initial support is near the 23.6% Fib retracement level of the upward move from the 0.6765 swing low to the 0.6892 high at 0.6860.
The next support could be a major bullish trend line at 0.6830 and the 50-hour simple moving average. It is close to the 50% Fib retracement level of the upward move from the 0.6765 swing low to the 0.6892 high.
If there is a downside break below the 0.6830 support, the pair could extend its decline toward the 0.6780 level. Any more losses might signal a move toward 0.6740.
NZD/USD Technical Analysis
On the hourly chart of AUD/USD on FXOpen, the pair formed a base above the 0.6100 level. The New Zealand Dollar started a steady increase above the 0.6150 resistance against the US Dollar.
The pair settled above 0.6200 and the 50-hour simple moving average. It tested the 0.6245 zone and is currently consolidating gains above the 23.6% Fib retracement level of the recent increase from the 0.6153 swing low to the 0.6246 high.
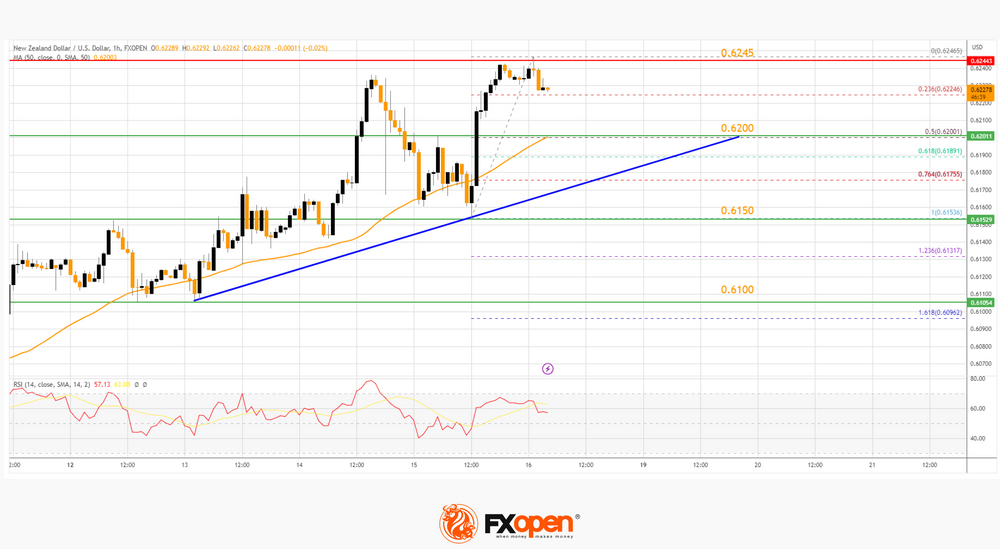
The NZD USD chart suggests that the RSI is declining and the pair might correct lower. On the downside, there is key support forming near a bullish trend line at 0.6200 and the 50-hour simple moving average.
The trend line is near the 50% Fib retracement level of the recent increase from the 0.6153 swing low to the 0.6246 high. The next major support is near 0.6150.
If there is a downside break below the 0.6150 support, the pair might slide toward the 0.6100 support. Any more losses could send NZD/USD toward 0.6050.
On the upside, the pair might struggle near 0.6245. The next major resistance is near the 0.6260 level. A clear move above the 0.6260 level might even push the pair toward the 0.6300 level. Any more gains might open the doors for a move toward the 0.6350 resistance zone in the coming days.
EUR/USD Technical Analysis
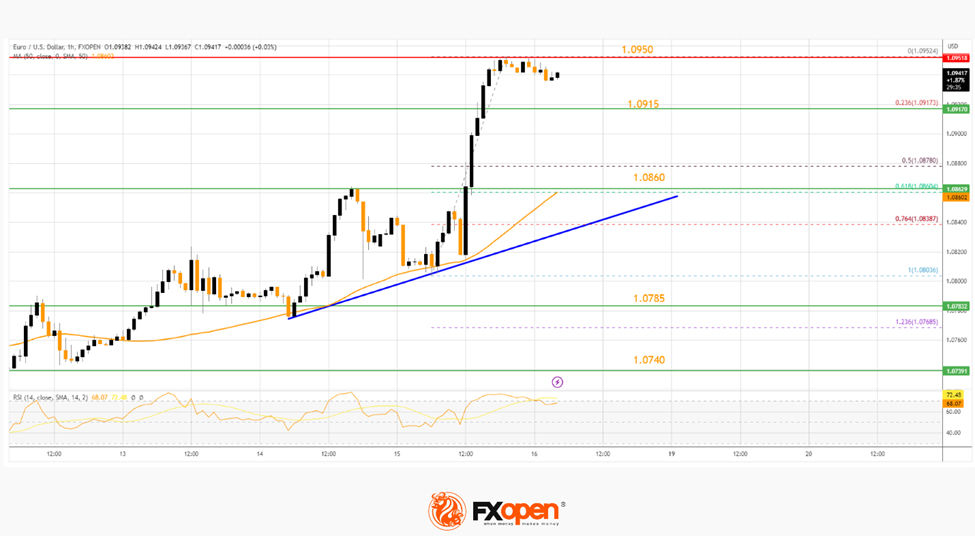
On the hourly chart of EUR/USD at FXOpen, the pair started a strong increase from the 1.0785 level. The Euro was able to clear the 1.0860 resistance against the US Dollar.
The bulls were able to push the pair above the 50-hour simple moving average and 1.0900. It is now consolidating gains below the 1.0950 resistance zone. The next major resistance is near the 1.0965 zone.
A break above the 1.0965 resistance zone could send EUR/USD toward the 1.1000 zone. A close above the 1.1000 level might send the pair further higher toward the 1.1050 resistance.
Conversely, the pair might start a downside correction toward 1.0915. The next major support is near a connecting bullish trend line at 1.0860, below which EUR/USD could test the 1.0785 support. Any more losses could send the pair to 1.0740.
USD/CAD Daily Outlook
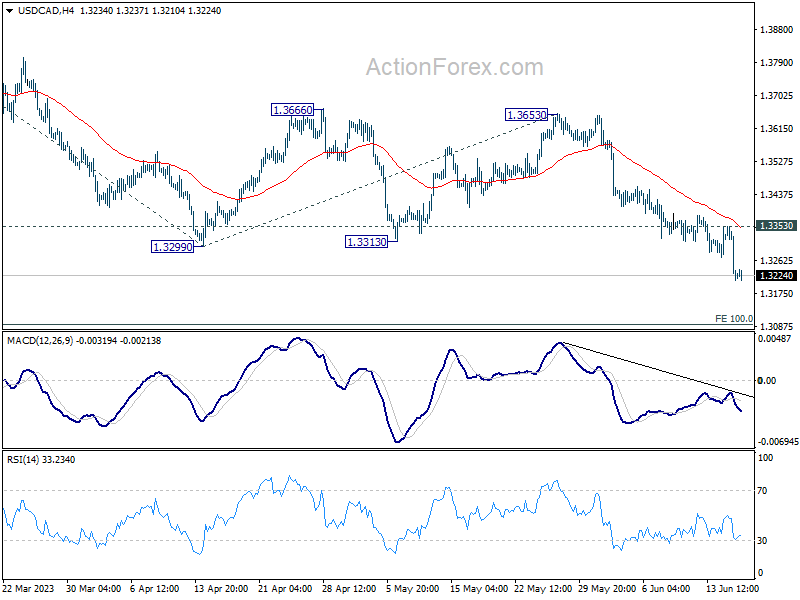
Daily Pivots: (S1) 1.3169; (P) 1.3262; (R1) 1.3314; More....
USD/CAD's decline extends further and the development suggests that it's in a deeper corrective decline. Intraday bias stays on the downside for 100% projection of 1.3860 to 1.3299 from 1.3653 at 1.3092 next. On the upside, above 1.3353 minor resistance will turn intraday bias neutral and bring consolidations first, before staging another fall.
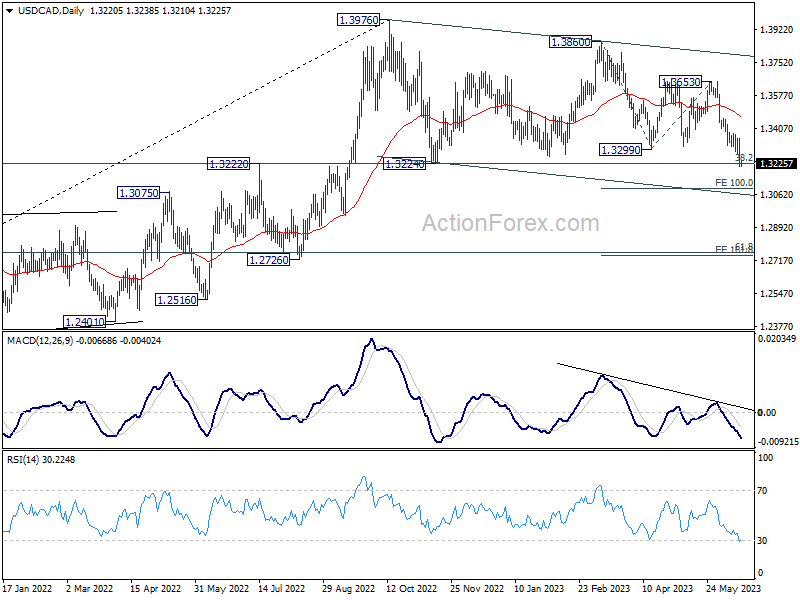
In the bigger picture, price actions from 1.3976 are still viewed as a correction to up trend from 1.2005 (2021 low), but chance of trend reversal is increasing with current decline. But in either case, sustained trading below 38.2% retracement of 1.2005 to 1.3976 at 1.3233 will pave the way to 61.8% retracement at 1.2758. Risk will stay on the downside as long as 1.3653 resistance holds, even in case of strong rebound.
AUD/USD Daily Report
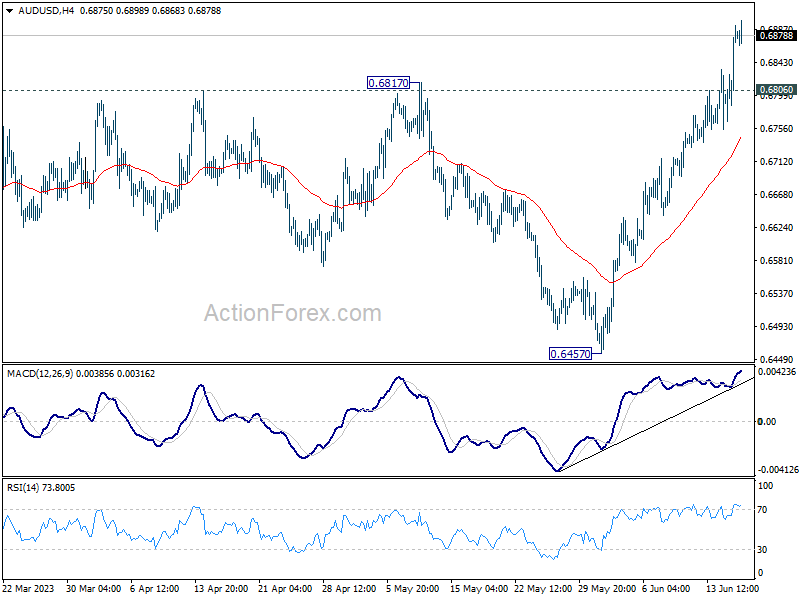
Daily Pivots: (S1) 0.6802; (P) 0.6848; (R1) 0.6928; More...
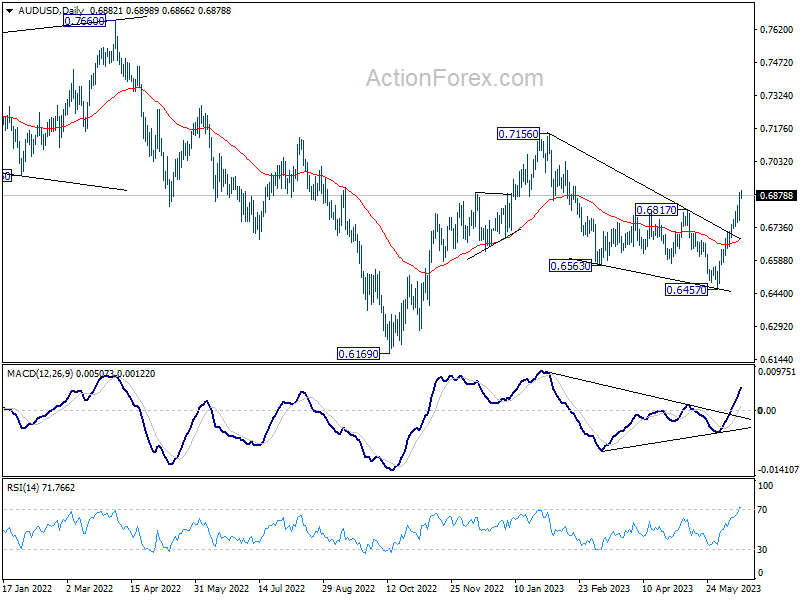
AUD/USD's rally accelerates to as high as 0.6898 so far today. The strong break of 0.6817 resistance should confirm that corrective fall from 0.7156 has completed with three waves down to 0.6457. Intraday bias remains on the upside for retesting 0.7156 high next. On the downside, below 0.6806 minor support will turn intraday bias neutral and bring consolidations first, before staging another rally.
In the bigger picture,decline from 0.7156 could have completed in a three wave corrective structure at 0.6457. The development argues that rise from 0.6169 (2022 low) is still in progress. Firm break of 0.7156 will also add to the case that whole down trend from 0.8006 (2021 high) has finished and turn medium term outlook bullish. For now this will be the favored case as long as 0.6457 support holds, even in case of deep pull back.
EUR/USD Daily Outlook
Daily Pivots: (S1) 1.0849; (P) 1.0901; (R1) 1.0998; More...
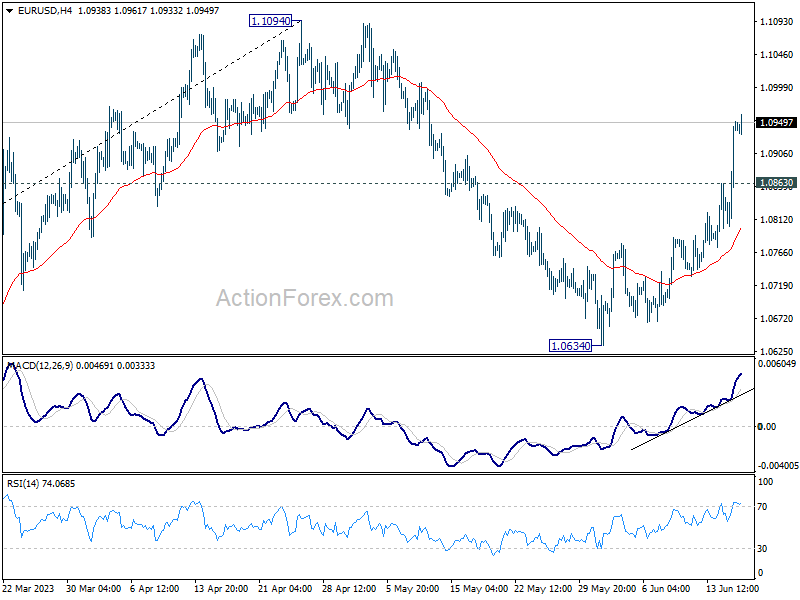
Intraday bias in EUR/USD remains on the upside at this point. Rise from 1.0634 is in progress to retest 1.1094 high. Decisive break there will confirm resumption of whole up trend from 0.9534. On the downside, below 1.0863 minor support will turn intraday bias neutral first.
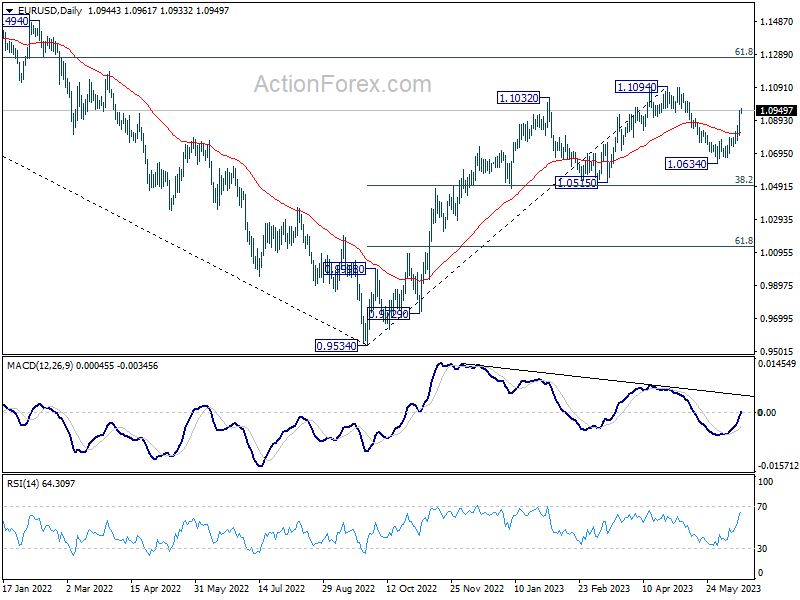
In the bigger picture, as long as 1.0515 support holds, rise from 0.9534 (2022 low) would still extend higher. Sustained break of 61.8% retracement of 1.2348 (2021 high) to 0.9534 at 1.1273 will solidify the case of bullish trend reversal and target 1.2348 resistance next (2021 high).
GBP/USD Daily Outlook
Daily Pivots: (S1) 1.2681; (P) 1.2734; (R1) 1.2837; More...
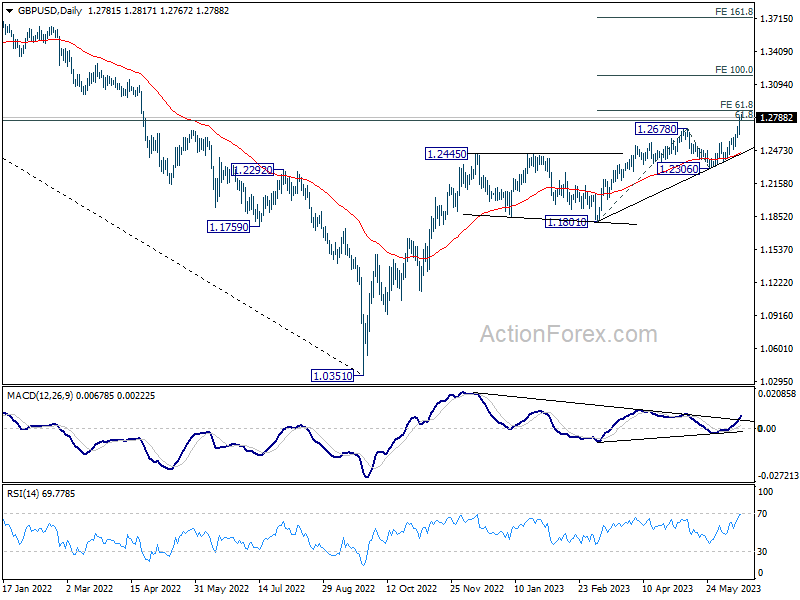
GBP/USD's accelerates to as high as 1.2817 so far today. Intraday bias stays on the upside for 61.8% projection of 1.1801 to 1.2678 from 1.2306 at 1.2848. Decisive break there will target 100% projection at 1.3183 next. On the downside, below 1.2697 minor support will turn intraday bias neutral and bring consolidations first, before staging another rally.
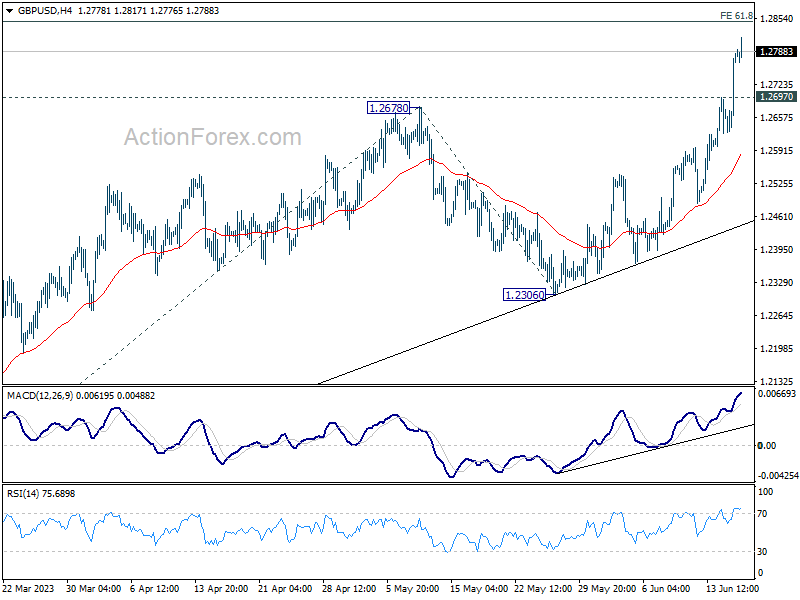
In the bigger picture, as long as 1.2306 support holds, rise from 1.0351 medium term bottom (2022 low) is expected to extend further. Sustained break of 61.8% retracement of 1.4248 (2021 high) to 1.0351 at 1.2759 will add to the case of long term bullish trend reversal. Next medium term target will then be 1.4248 key resistance.
USD/CHF Daily Outlook
Daily Pivots: (S1) 0.8864; (P) 0.8960; (R1) 0.9013; More...
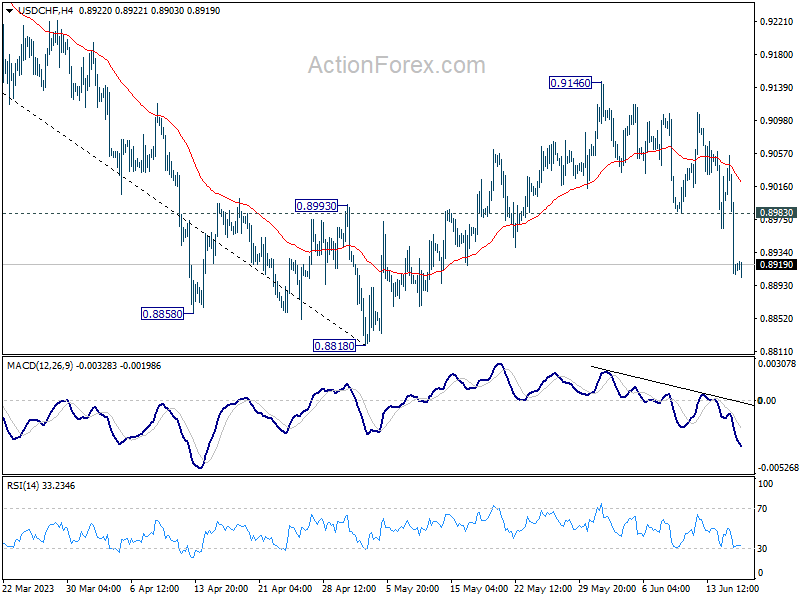
Intraday bias in USD/CHF remains on the downside for the moment. Fall from 0.9146 would extend to 0.8818 support and possibly below. Still, strong support is still expected from 0.8756 to bring reversal. On the upside, above 0.8983 minor resistance will turn intraday bias neutral first.
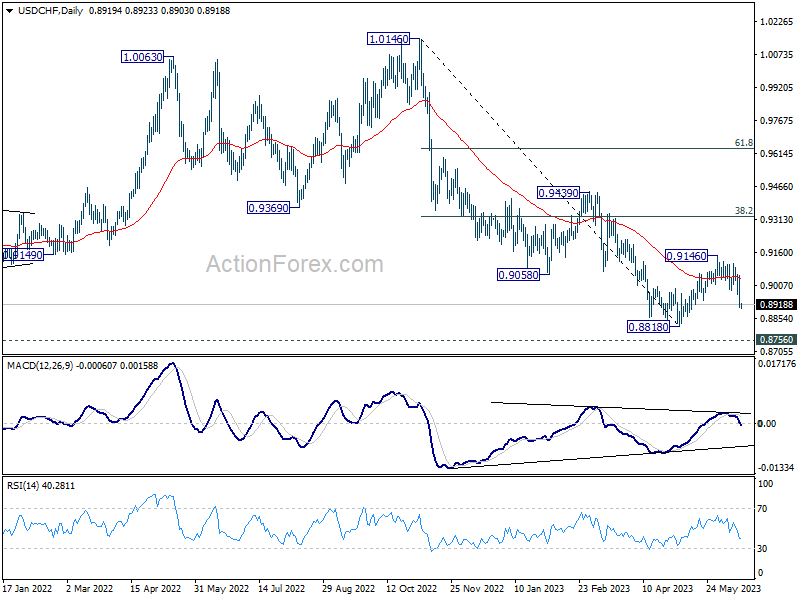
In the bigger picture, fall from 1.1046 (2022 high) is seen as a leg in the long term range pattern from 1.0342 (2016 high), which might have completed at 0.8818 already, just ahead of 0.8756 long term support. Sustained trading above 0.9058 support turned resistance should confirm medium term bottoming. Further break of 0.9439 resistance will confirm bullish trend reversal.
USD/JPY Daily Outlook
Daily Pivots: (S1) 139.65; (P) 140.57; (R1) 141.21; More...
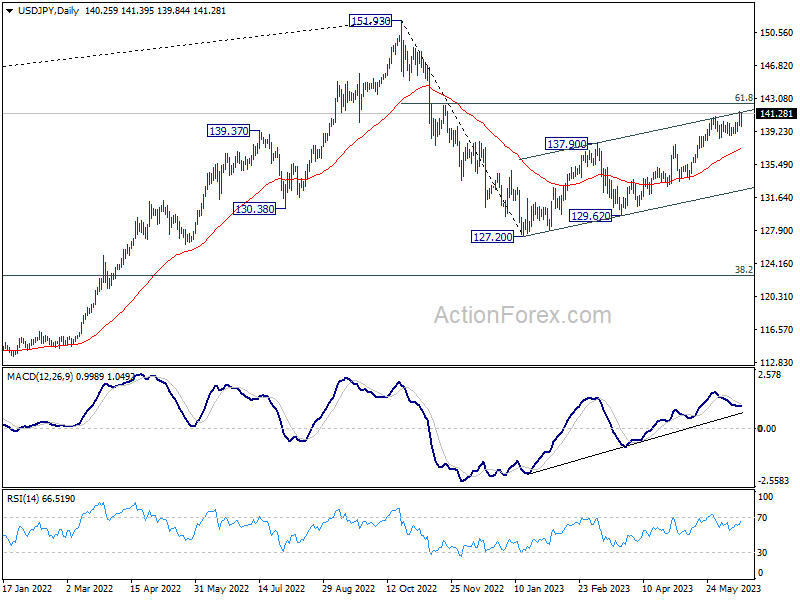
No change in USD/JPY's outlook and further rise expected with 139.27 support intact. Current rise from 127.20 should now target 142.48 fibonacci level next. Nevertheless, break of 139.27 will now indicate short term topping and turn bias back to the downside.
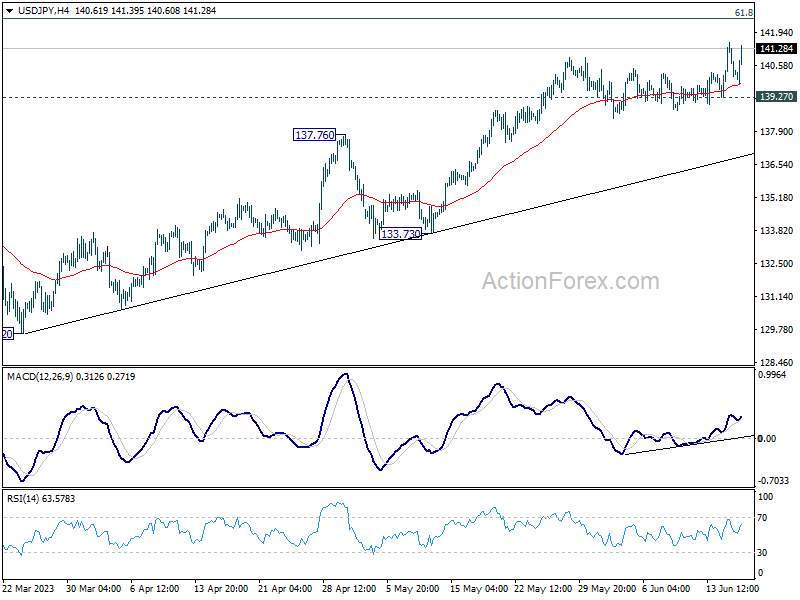
In the bigger picture, rise from 127.20 is seen as the second leg of the corrective pattern from 151.93 high. Stronger rally would be seen to 61.8% retracement of 151.93 to 127.20 at 142.48. Sustained break there will pave the way back to retest 151.93. On the downside, however, decisive break of 137.90 resistance turned support will now be the first indicate that this rebound from 127.20 has completed already.
EUR/GBP Daily Outlook
Daily Pivots: (S1) 0.8540; (P) 0.8566; (R1) 0.8588; More...
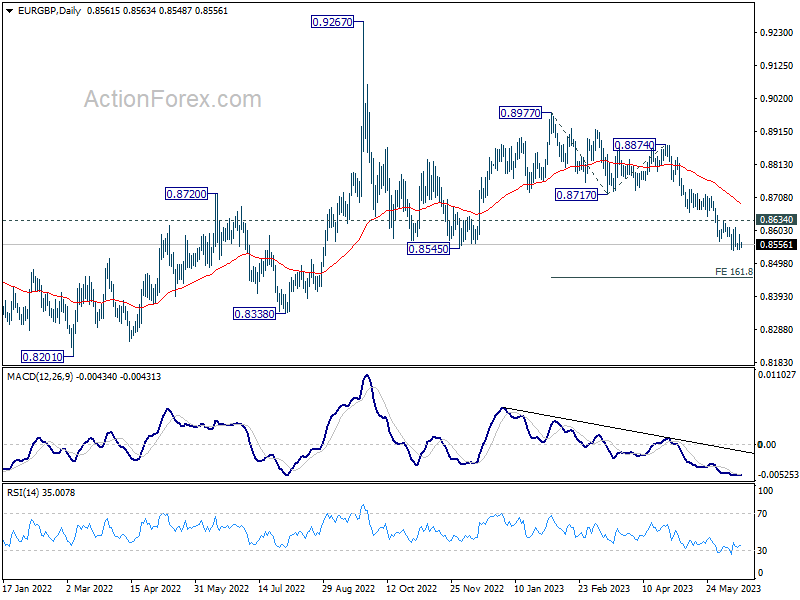
Intraday bias in EUR/GBP remains neutral and outlook stays bearish with 0.8634 resistance intact. Break of 0.8538 will resume larger decline from 0.8977 to 161.8% projection of 0.8977 to 0.8717 from 0.8874 at 0.8453. However, considering bullish convergence condition in 4H MACD, firm break of 0.8634 will indicate short term bottoming and turn bias to the upside for stronger rebound.
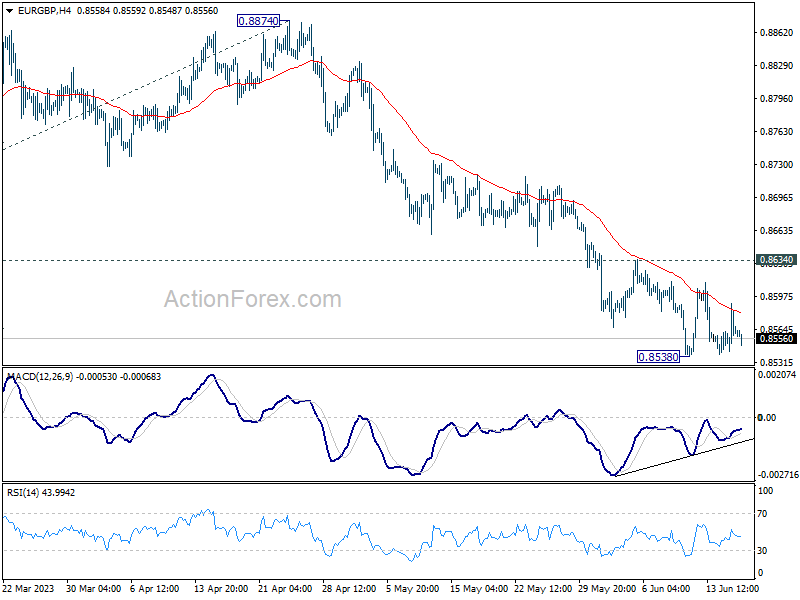
In the bigger picture, the down trend from 0.9267 (2022 high) is still in progress. It's seen as part of the long term range pattern from 0.9499 (2020 high). Deeper fall would be seen towards 0.8201 (2022 low). But strong support should be seen from there to bring reversal. This will now remain the favored case as long as 0.8717 support turned resistance holds.