Sample Category Title
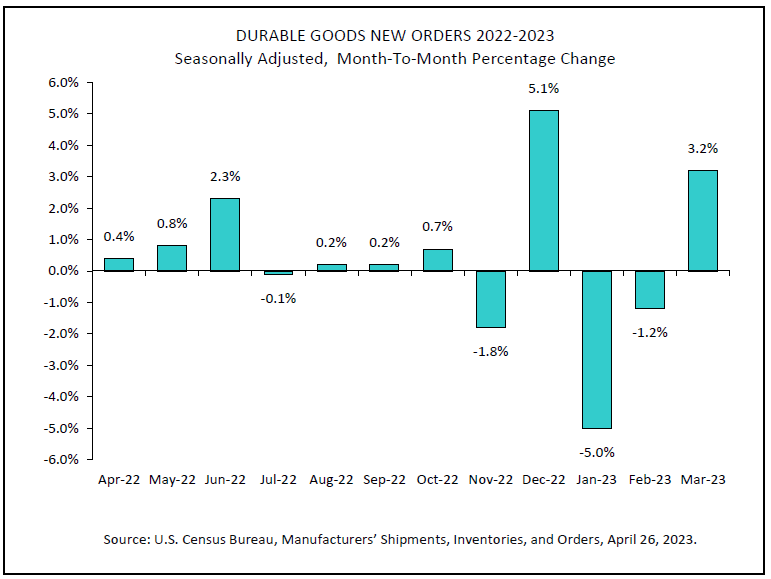
US durable goods orders rose 3.2% mom in Mar, ex-transport orders up 0.3% mom
US durable goods orders rose 3.2% mom to USD 276.4B in March, well above expectation of 0.8% mom. Ex-transport orders rose 0.3% mom to USD 179.0B, above expectation of -0.2% mom. Ex-defense orders rose 3.5% mom to USD 259.3B. Transportation equipment rose 9.1% mom to USD 97.4B.
AUDUSD Analysis: Breakout of Important Support
Yesterday's report showed that inflation in Australia in the first quarter of 2023 fell from a 33-year high. The consumer price index rose only by 1.4% in annual terms, although analysts had expected +1.9%.
Now market participants are focusing on the meeting of the Reserve Bank of Australia on May 2; it is expected that it will resume raising rates and thereby complete the pause made after a series of 10 increases.
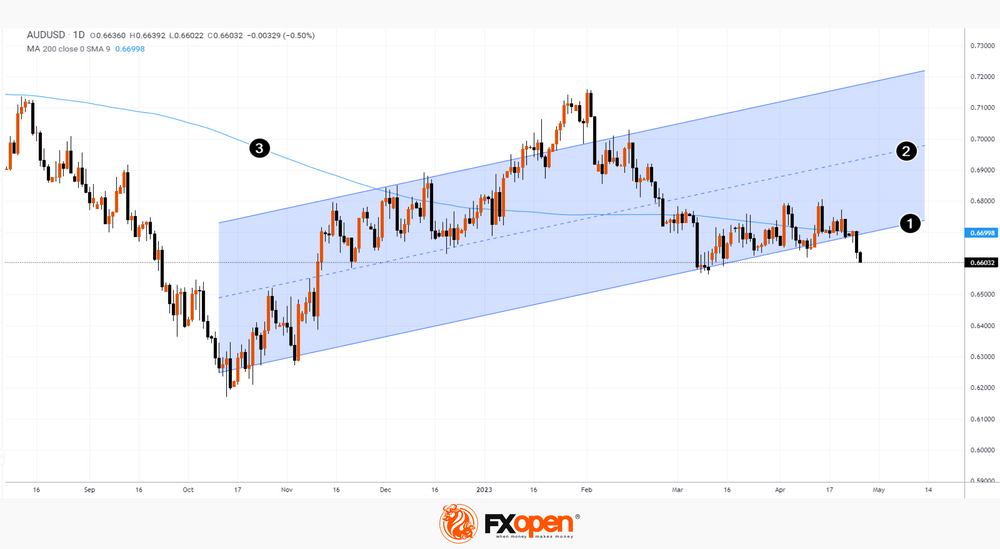
Reacting to the news, the Australian dollar broke through the low of April, while the daily AUDUSD chart shows that the market as a whole looks weak, because:
→ important support (1), which has been in effect since autumn 2022, has been breached;
→ rebounds from this line were weak, the price did not reach the median line (2);
→ MA (200) points down.
The bears may make even more progress today, as at 15:30 (GMT+3) the US GDP and unemployment news will be published, which may strengthen the USD.
Gold Stuck in Rangebound Pattern, Capped by 50-SMA
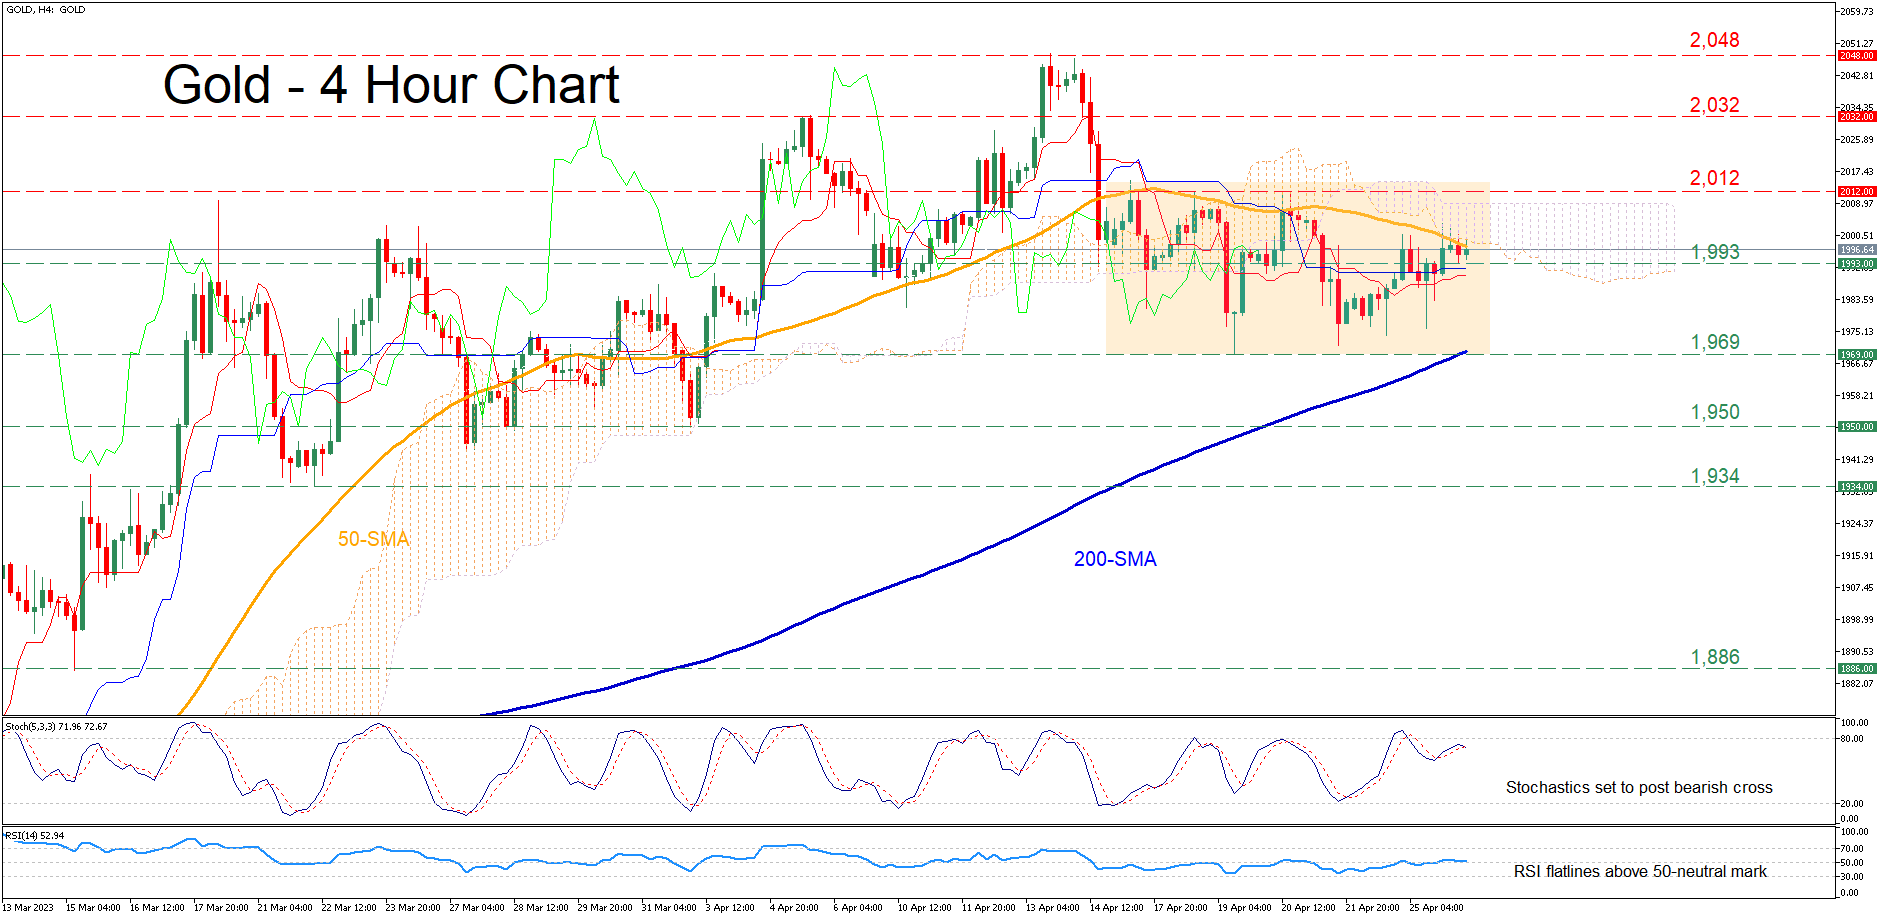
Gold experienced a moderate pullback after peaking at the 13-month high of 2,048 in mid-April. Since then, the price has been trading without a clear direction within a rectangle pattern, while the congested region that includes the 50-period simple moving average (SMA) and the lower bound of the Ichimoku cloud has repeatedly curbed upside efforts.
The momentum indicators currently suggest that the bullish forces are subsiding. Specifically, the stochastic oscillator is set to post a bearish cross, while the RSI is losing ground but remains above its 50-neutral mark.
Should the fortified zone hold, the price could reverse lower to test the 1,993 hurdle. If that barricade fails, the bears may target the April low of 1,969, which is also the lower end of the recent sideways move. Failing to halt there, bullion could descend towards the crucial support zone of 1,950.
On the flipside, if the price manages to jump above its 50-period SMA, 2,012 could prove to be the first obstacle for buyers to clear. Further advances might then stall at the April resistance of 2,032. A jump above that region could set the stage for the 13-month peak of 2,048.
In brief, gold seems to be in a consolidation phase, with its latest advance faltering around a crucial technical region. Therefore, it could be argued that a break above or below the recent range is required for the price to adopt a clear directional impetus.
Aussie Dollar Falls to Multi-Week Low as Softer than Expected Inflation Adds to Negative sentiment
Australian dollar remains under increased pressure from risk aversion and holding firmly in red for the fourth consecutive day, with softer than expected inflation data for the first quarter, adding to negative sentiment.
Australian inflation eased further from the highest in over three decades, with stronger than forecasted drop in core inflation, contributing to expectations that inflation has peaked and fading bets for RBA’s 25 basis points rate hike next week.
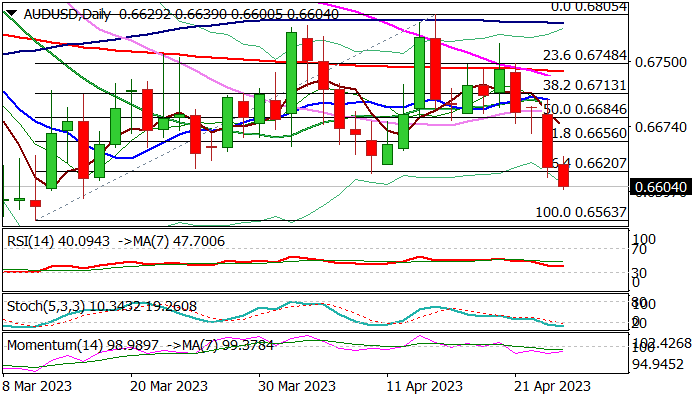
Fresh weakness in Wednesday’s Asian / European trading hit the lowest in six weeks, in extension of nearly 1% drop on Tuesday.
Break of 0.6620 zone former higher base (also Fibo 76.4% retracement of 0.6563/0.6805) generated strong bearish signal, reinforced by confirmation of a double-top (0.6793/0.6805), opening way for attack at key supports at 0.6563/47 (2023 low of Mar 10 / Fibo 61.8% of larger 0.6170/0.7157 uptrend), with daily close below 0.6620 needed to confirm.
Daily studies in full bearish setup support the action, though oversold stochastic suggests that bears are likely to face headwinds on approach to 0.6563 target.
Corrective upticks should be ideally capped by solid barriers at 0.6620/44 (broken Fibo 76.4% / base of thick weekly cloud) to keep bears intact and offer better selling opportunities.
Res: 0.6620; 0.6644; 0.6656; 0.6697.
Sup: 0.6589; 0.6563; 0.6547; 0.6500.
AUD/USD Falls Below 0.66 on Lower Inflation, Banking Jitters
- AUD/USD drops to 6-week low
- Australian inflation falls in Q4
- First Republic shares slide by 50%
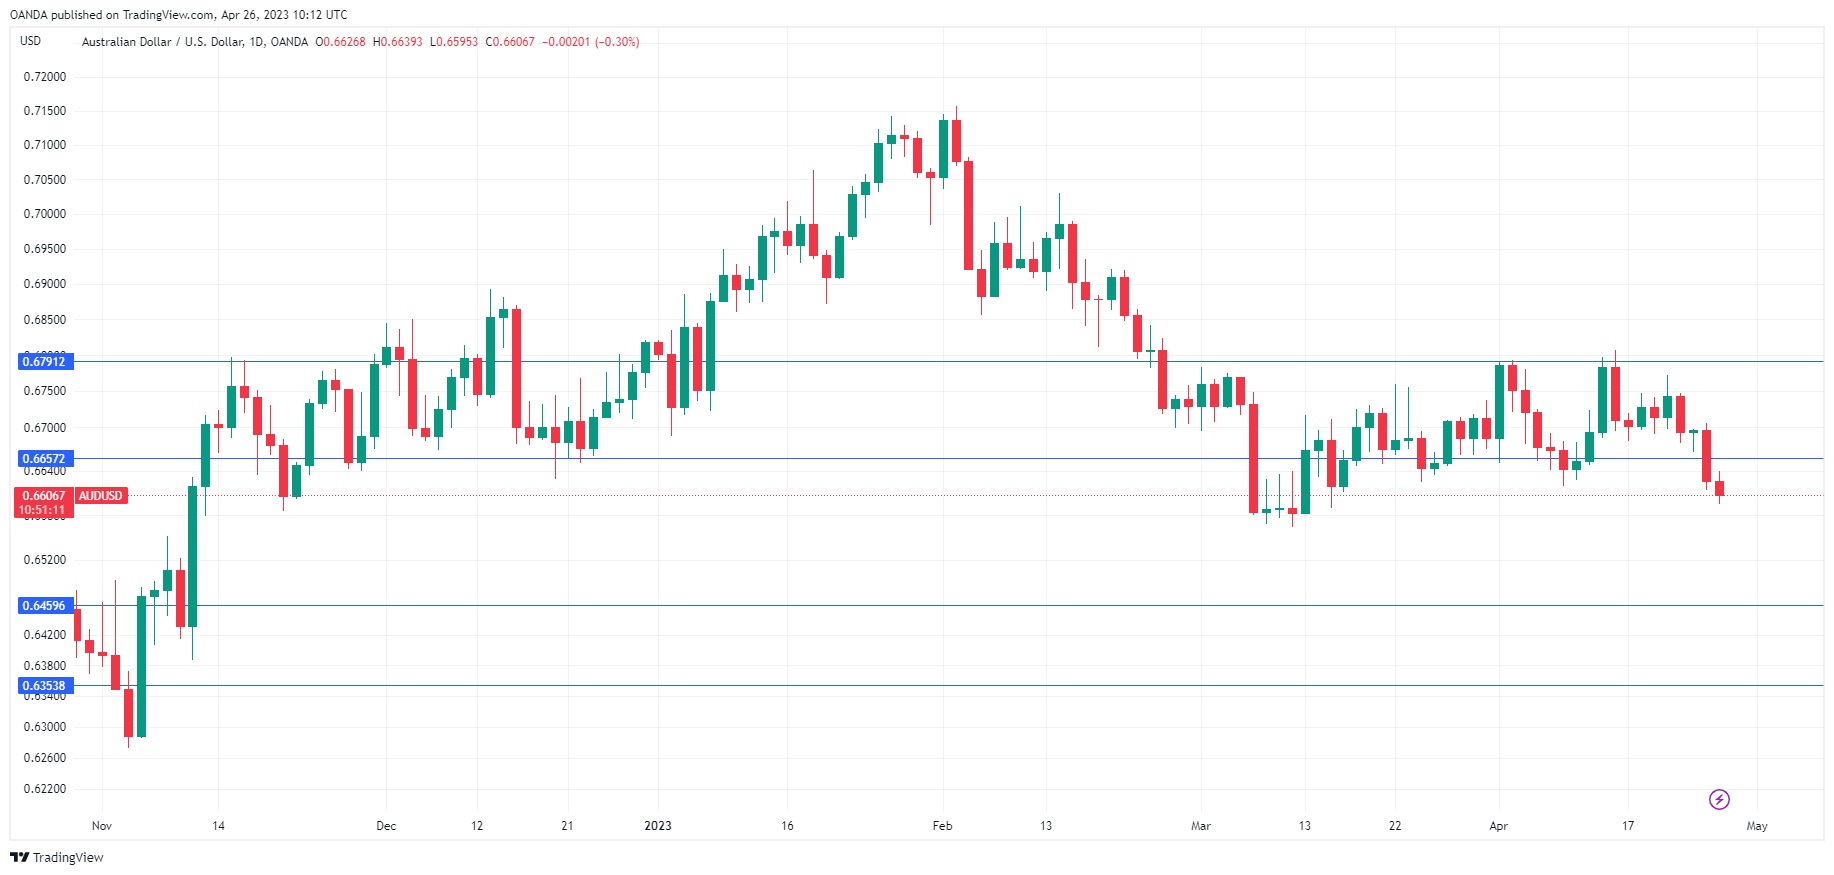
AUD/USD is trading at 0.6606, down 0.31%. Earlier, AUD/USD fell to a low of 0.6595, its lowest level since March 15th.
Australian inflation heads south
Australia’s inflation levels have been falling and the downward trend continued in the first quarter. The headline figure slowed to 7.0%, down from 7.8% in Q4 and a notch above the market consensus of 6.9%. On a quarterly basis, headline CPI from 1.9% to 1.3%, versus the market consensus of 1.4%. The monthly CPI for March fell from 6.8% to 6.1%, below the estimate of 6.6%.
Core CPI, which is considered a more reliable gauge of inflation trends, headed lower and beat the estimates, falling from 6.9% to 6.6% y/y (7.2% est.). On a quarterly basis, core CPI dropped to 1.2%, down from 1.7% and below the estimate of 1.4%.
The key takeaway from these positive numbers is that they appear to have cemented another rate pause at the May 2nd meeting. The odds of a pause have risen from 83% prior to the inflation report to 100% at present. It looks safe to say that inflation has peaked, although the cautious RBA is unlikely to use the “P” word just yet. At the same time, it is premature to declare victory in the inflation battle, with headline inflation and the core rate running more than three times the RBA’s target band of 2-3%. Despite the market’s confidence in another pause, some economists feel that the RBA remains concerned that the high core rate could fuel a price wage spiral if it doesn’t tighten further.
First Republic’s shares sink
AUD/USD is also under pressure as the banking crisis is back in the headlines. First Republic Bank shares fell by 50% after the Bank’s earnings report showed that deposits plunged by 40% in the first quarter. Risk sentiment has fallen as First Republic’s future very survival is at stake, and if banking jitters worsen, the US dollar could continue to climb higher.
AUD/USD Technical
- There is resistance at 0.6657 and 0.6791
- 0.6459 and 0.6353 are providing support
EUR/USD Corrects Gains While USD/CHF Signals Upside Break
EUR/USD started a downside correction from the 1.1070 resistance. USD/CHF is rising and might aim for more gains above the 0.8930 resistance.
Important Takeaways for EUR/USD and USD/CHF
- The Euro started a fresh decline from the 1.1070 resistance against the US Dollar.
- There is a key bullish trend line forming with support near 1.0970 on the hourly chart of EUR/USD at FXOpen.
- USD/CHF started a fresh increase above the 0.8900 resistance zone.
- There was a break above a major bearish trend line with resistance near 0.8895 on the hourly chart at FXOpen.
EUR/USD Technical Analysis
On the hourly chart of EUR/USD at FXOpen, the pair faced rejection near the 1.1070 level. The Euro started a downside correction from the 1.1072 resistance against the US Dollar.
There was a move below the 50-hour simple moving average at 1.1015. The pair dipped below the 1.1000 support before the bulls appeared near 1.0970 when the RSI reached oversold conditions. There is also a key bullish trend line forming with support near 1.0970.
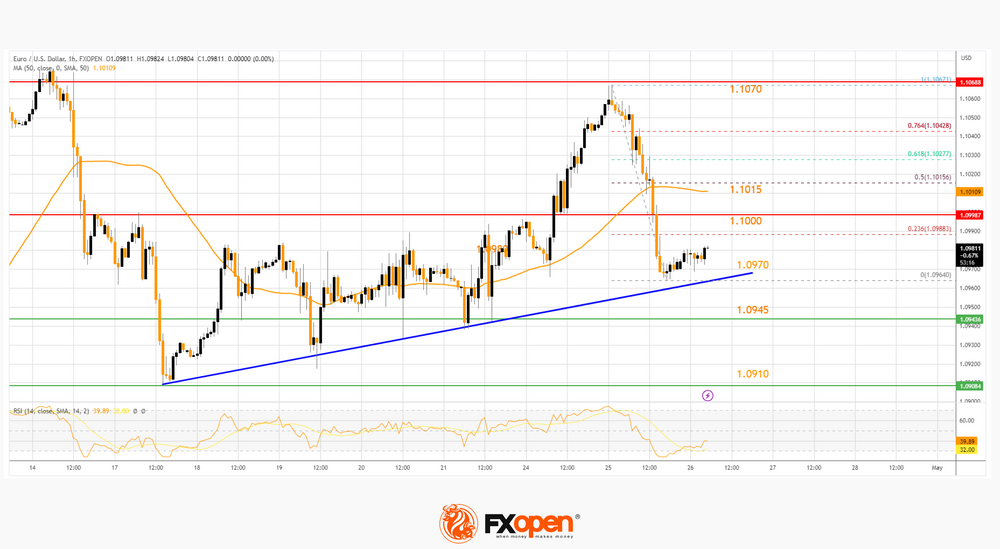
The pair is now consolidating and facing resistance near the 1.1000 level. The first major resistance is near the 50-hour simple moving average at 1.1015. It coincides with the 50% Fib retracement level of the downward move from the 1.1067 swing high to the 1.0964 low.
An upside break above the 1.1015 level might send the pair toward the 76.4% Fib retracement level of the downward move from the 1.1067 swing high to the 1.0964 low.
The next major resistance is near the 1.1070 level. Any more gains might open the doors for a move toward the 1.1120 level. If there is no move above 1.1015, the pair might start a fresh decline. On the downside, immediate support is near the trend line at 1.0970.
The next major support is near the 1.0945 level. A downside break below the 1.0945 support could start a steady decline toward the 1.0910 level.
USD/CHF Technical Analysis
On the hourly chart of USD/CHF at FXOpen, the pair declined heavily below the 0.8960 support. The US Dollar gained bearish momentum below the 0.8930 level.
Finally, it tested the 0.8860 support. The pair is now attempting a recovery wave from 0.8860. There was a break above a major bearish trend line with resistance near 0.8895, the 23.6% Fib retracement level of the downward move from the 0.9003 swing high to the 0.8860 low, and the 50-hour simple moving average.
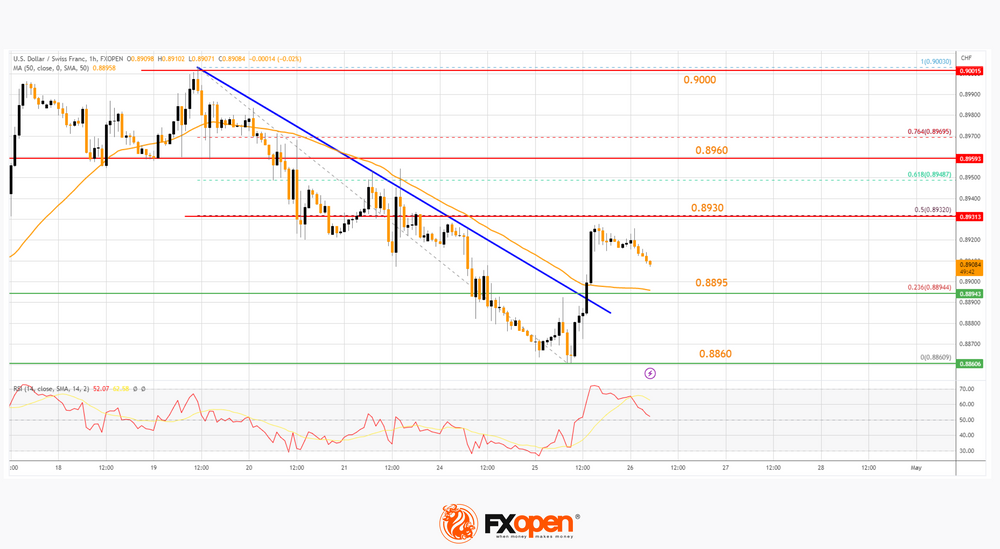
The pair is now facing resistance near the 50% Fib retracement level of the downward move from the 0.9003 swing high to the 0.8860 low at 0.8930.
The next major resistance is near the 0.8960 level. If there is a clear break above the 0.8960 resistance zone, the pair could start another increase. In the stated case, it could test 0.9000.
On the downside, immediate support is near the 50-hour simple moving average at 0.8895. The next major support is near the 0.8860 level. Any more losses may possibly open the doors for a move toward the 0.8825 level or even 0.8800 in the coming days.
NZDUSD Fails to Jump Above the 200-day SMA
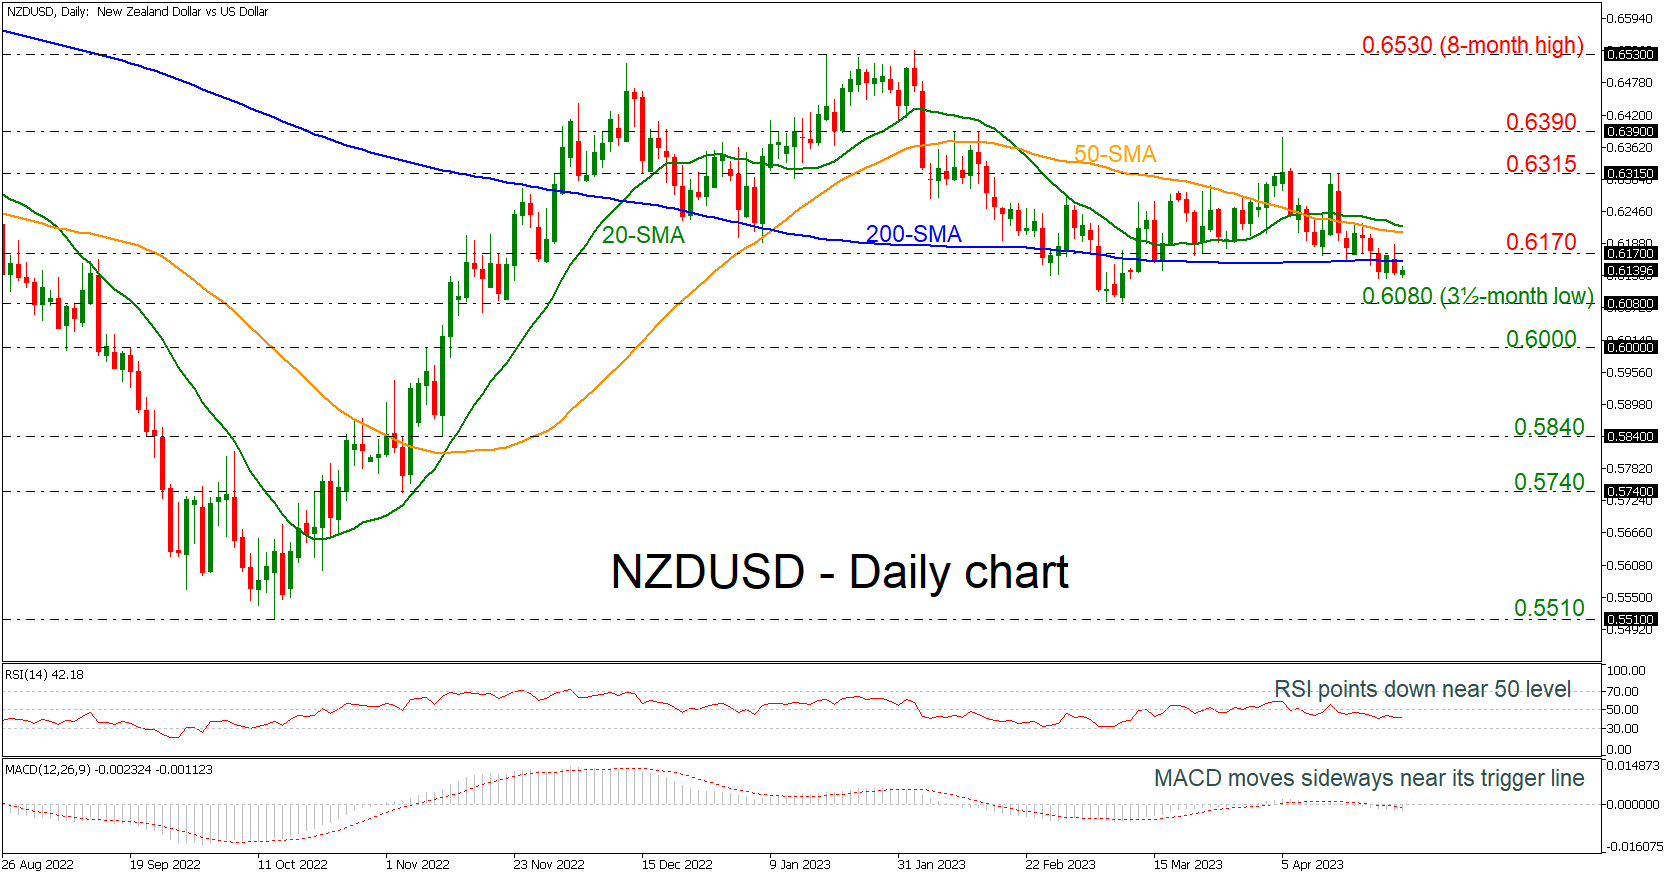
NZDUSD is still developing beneath the strong flat 200-day simple moving average (SMA) around the 0.6155 barrier. The RSI indicator is standing beneath its trigger and zero lines with weak momentum, while the MACD is losing ground beneath its trigger and zero lines.
An extension of the bearish movement may find immediate support at the three-and-half-month low of 0.6080. Even lower, the 0.6000 psychological mark may halt the negative actions but if not the 0.5840 obstacle may act as a turning point for traders.
Alternatively, any bullish attempts above the 200-day SMA and the 0.6170 resistance could meet the short-term SMAs around 0.6215. If the bulls hold the control could open the way for a rest near 0.6315 and the 0.6390 barrier, shifting the outlook to neutral. A climb above this line may switch the bias to positive, challenging the eight-month high of 0.6530.
All in all, NZDUSD is showing some negative signs as it is failing to jump above the 200-day SMA and the oscillators are endorsing this view.
USDJPY Challenges April’s Bullish Trend
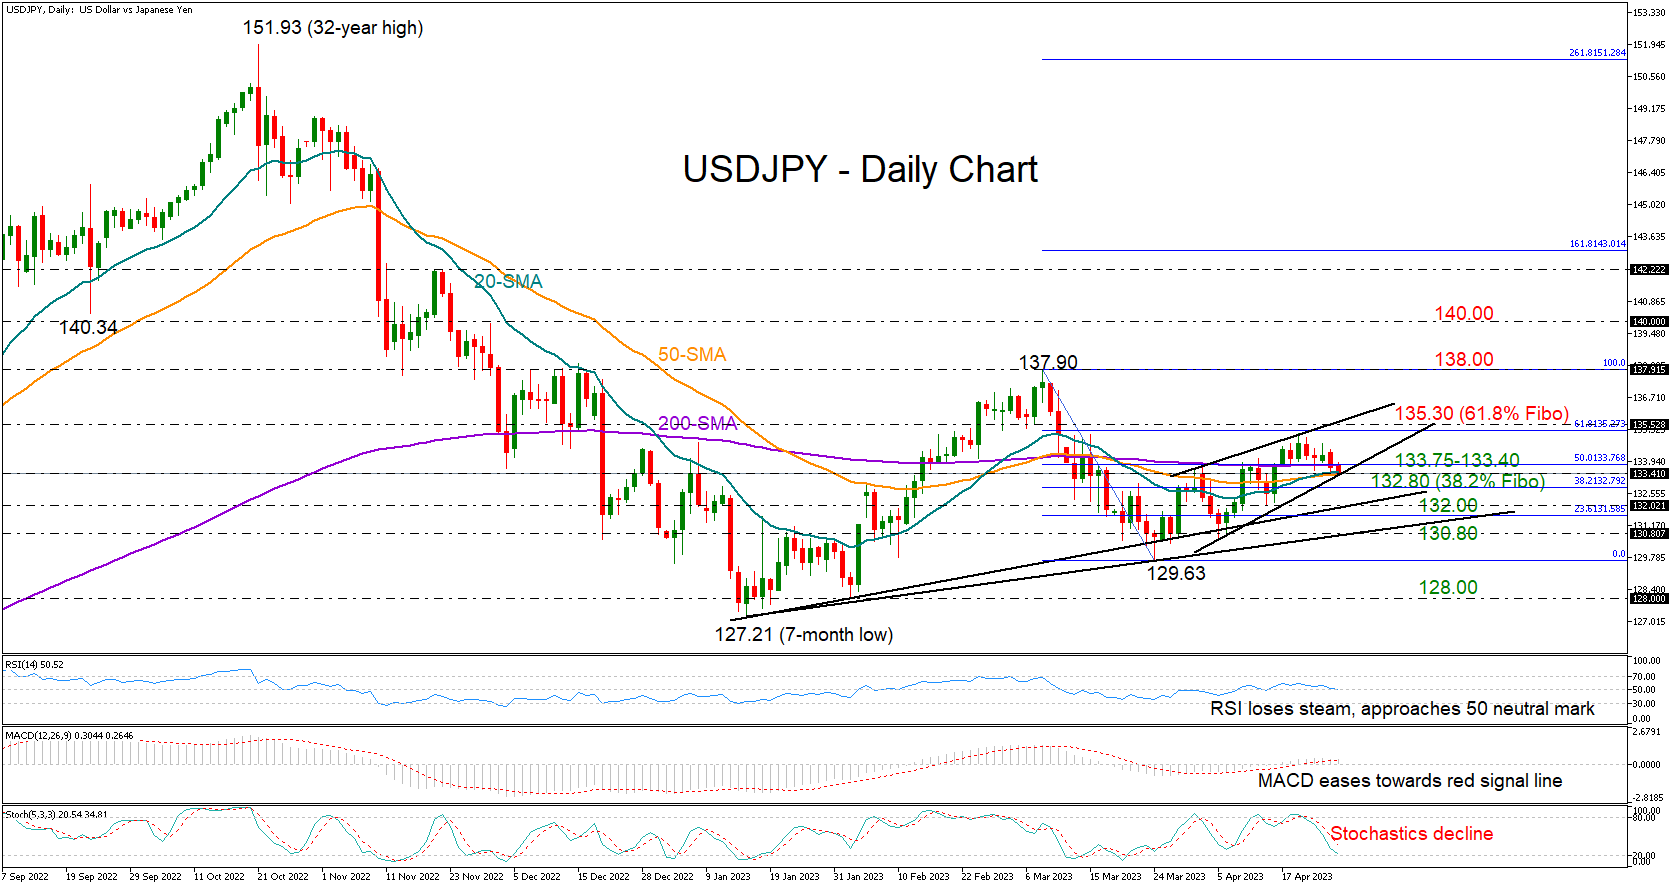
USDJPY has been in a slow corrective mode below the 135.00 area so far this week, making investors wonder whether this is another temporary bearish phase within the short-term uptrend.
Although the price is currently seeking new support from its simple moving averages (SMAs) within the 133.75-133.45 region and near its previous highs, the momentum indicators are not looking promising. The RSI has almost erased its latest bounce and is approaching its 50 neutral mark. Likewise, the MACD has lost some ground and is near its red signal line, with the stochastic oscillator pointing downwards as well.
In terms of market structure, a rising wedge seems to be developing. Technically, this is usually considered a bearish trend reversal signal.
If sellers persist, the 38.2% Fibonacci retracement of the previous downleg could immediately attempt to cool downside pressures around 132.80. If not, then the pair might have another opportunity for a rebound between the two ascending trendlines, which connect all the lows from January’s trough, seen between 132.00 and 131.80. A break below the trendlines would worsen the outlook, shifting the spotlight to the March low of 129.63, while a steeper decline could reach the 2023 floor of 128.00-127.21.
In case the bulls return, a decisive close above the 61.8% Fibonacci level of 135.30 and the upper resistance line will be needed for a quick rally up to the March high of 137.90. This was a tough resistance area in November and December too. Therefore, a violation at this point could be a prerequisite for a bounce towards the 140.00 mark.
All in all, USDJPY maintains a series of higher highs and higher lows in the short-term picture despite its latest pullback. A step below 132.45 would downgrade the short-term outlook to neutral. Yet only an aggressive downfall below 130.80 would question the 2023 upward trajectory.
USD/JPY: Intermediate Correction Come to an End, Waiting for Fall in Bearish Impulse
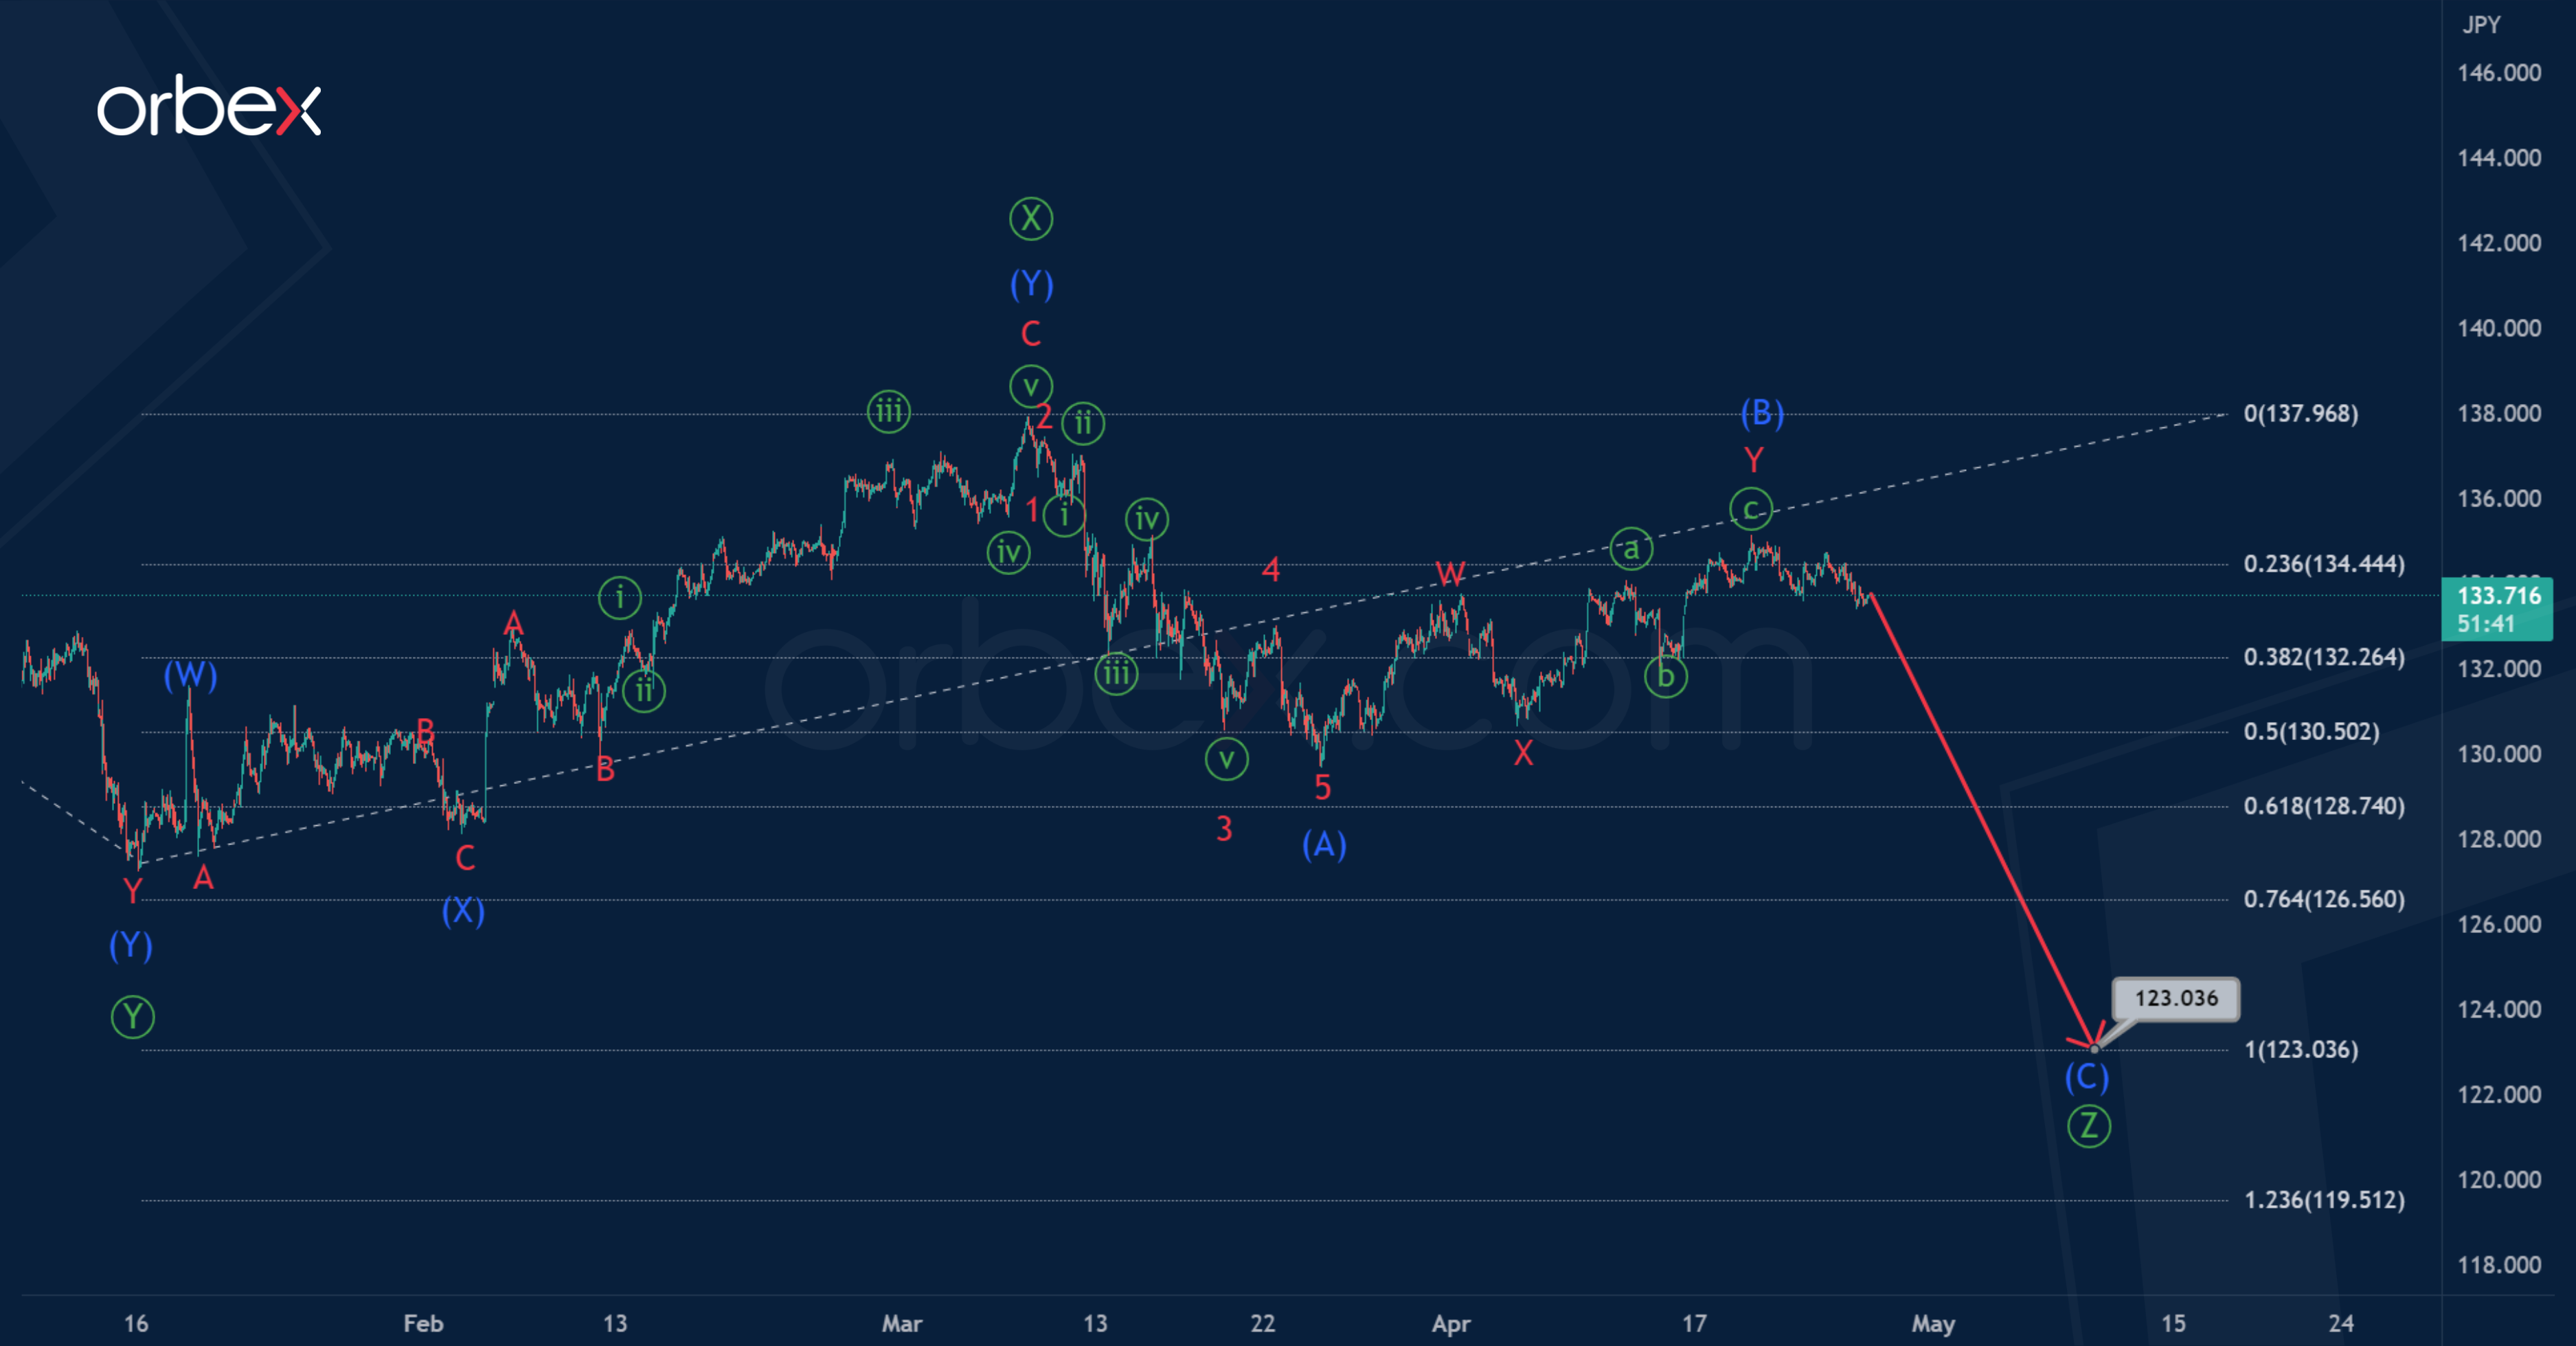
In the long term, the USDJPY pair may form a bearish trend. Most likely, the trend takes the form of a triple zigzag Ⓦ-Ⓧ-Ⓨ-Ⓧ-Ⓩ, within which the sub-waves Ⓦ-Ⓧ-Ⓨ-Ⓧ are completed.
The wave Ⓧ is a double zigzag consisting of intermediate sub-waves (W)-(X)-(Y).
At the time of writing, the market is in a wave Ⓩ. This wave, judging by its internal structure, takes the form of an intermediate zigzag (A)-(B)-(C). Since the correction (B) looks like a completed double zigzag, in the near future the pair may start moving in a bearish impulse wave (C) to 123.03.
At that level, primary waves Ⓩ and Ⓨ will be equal.
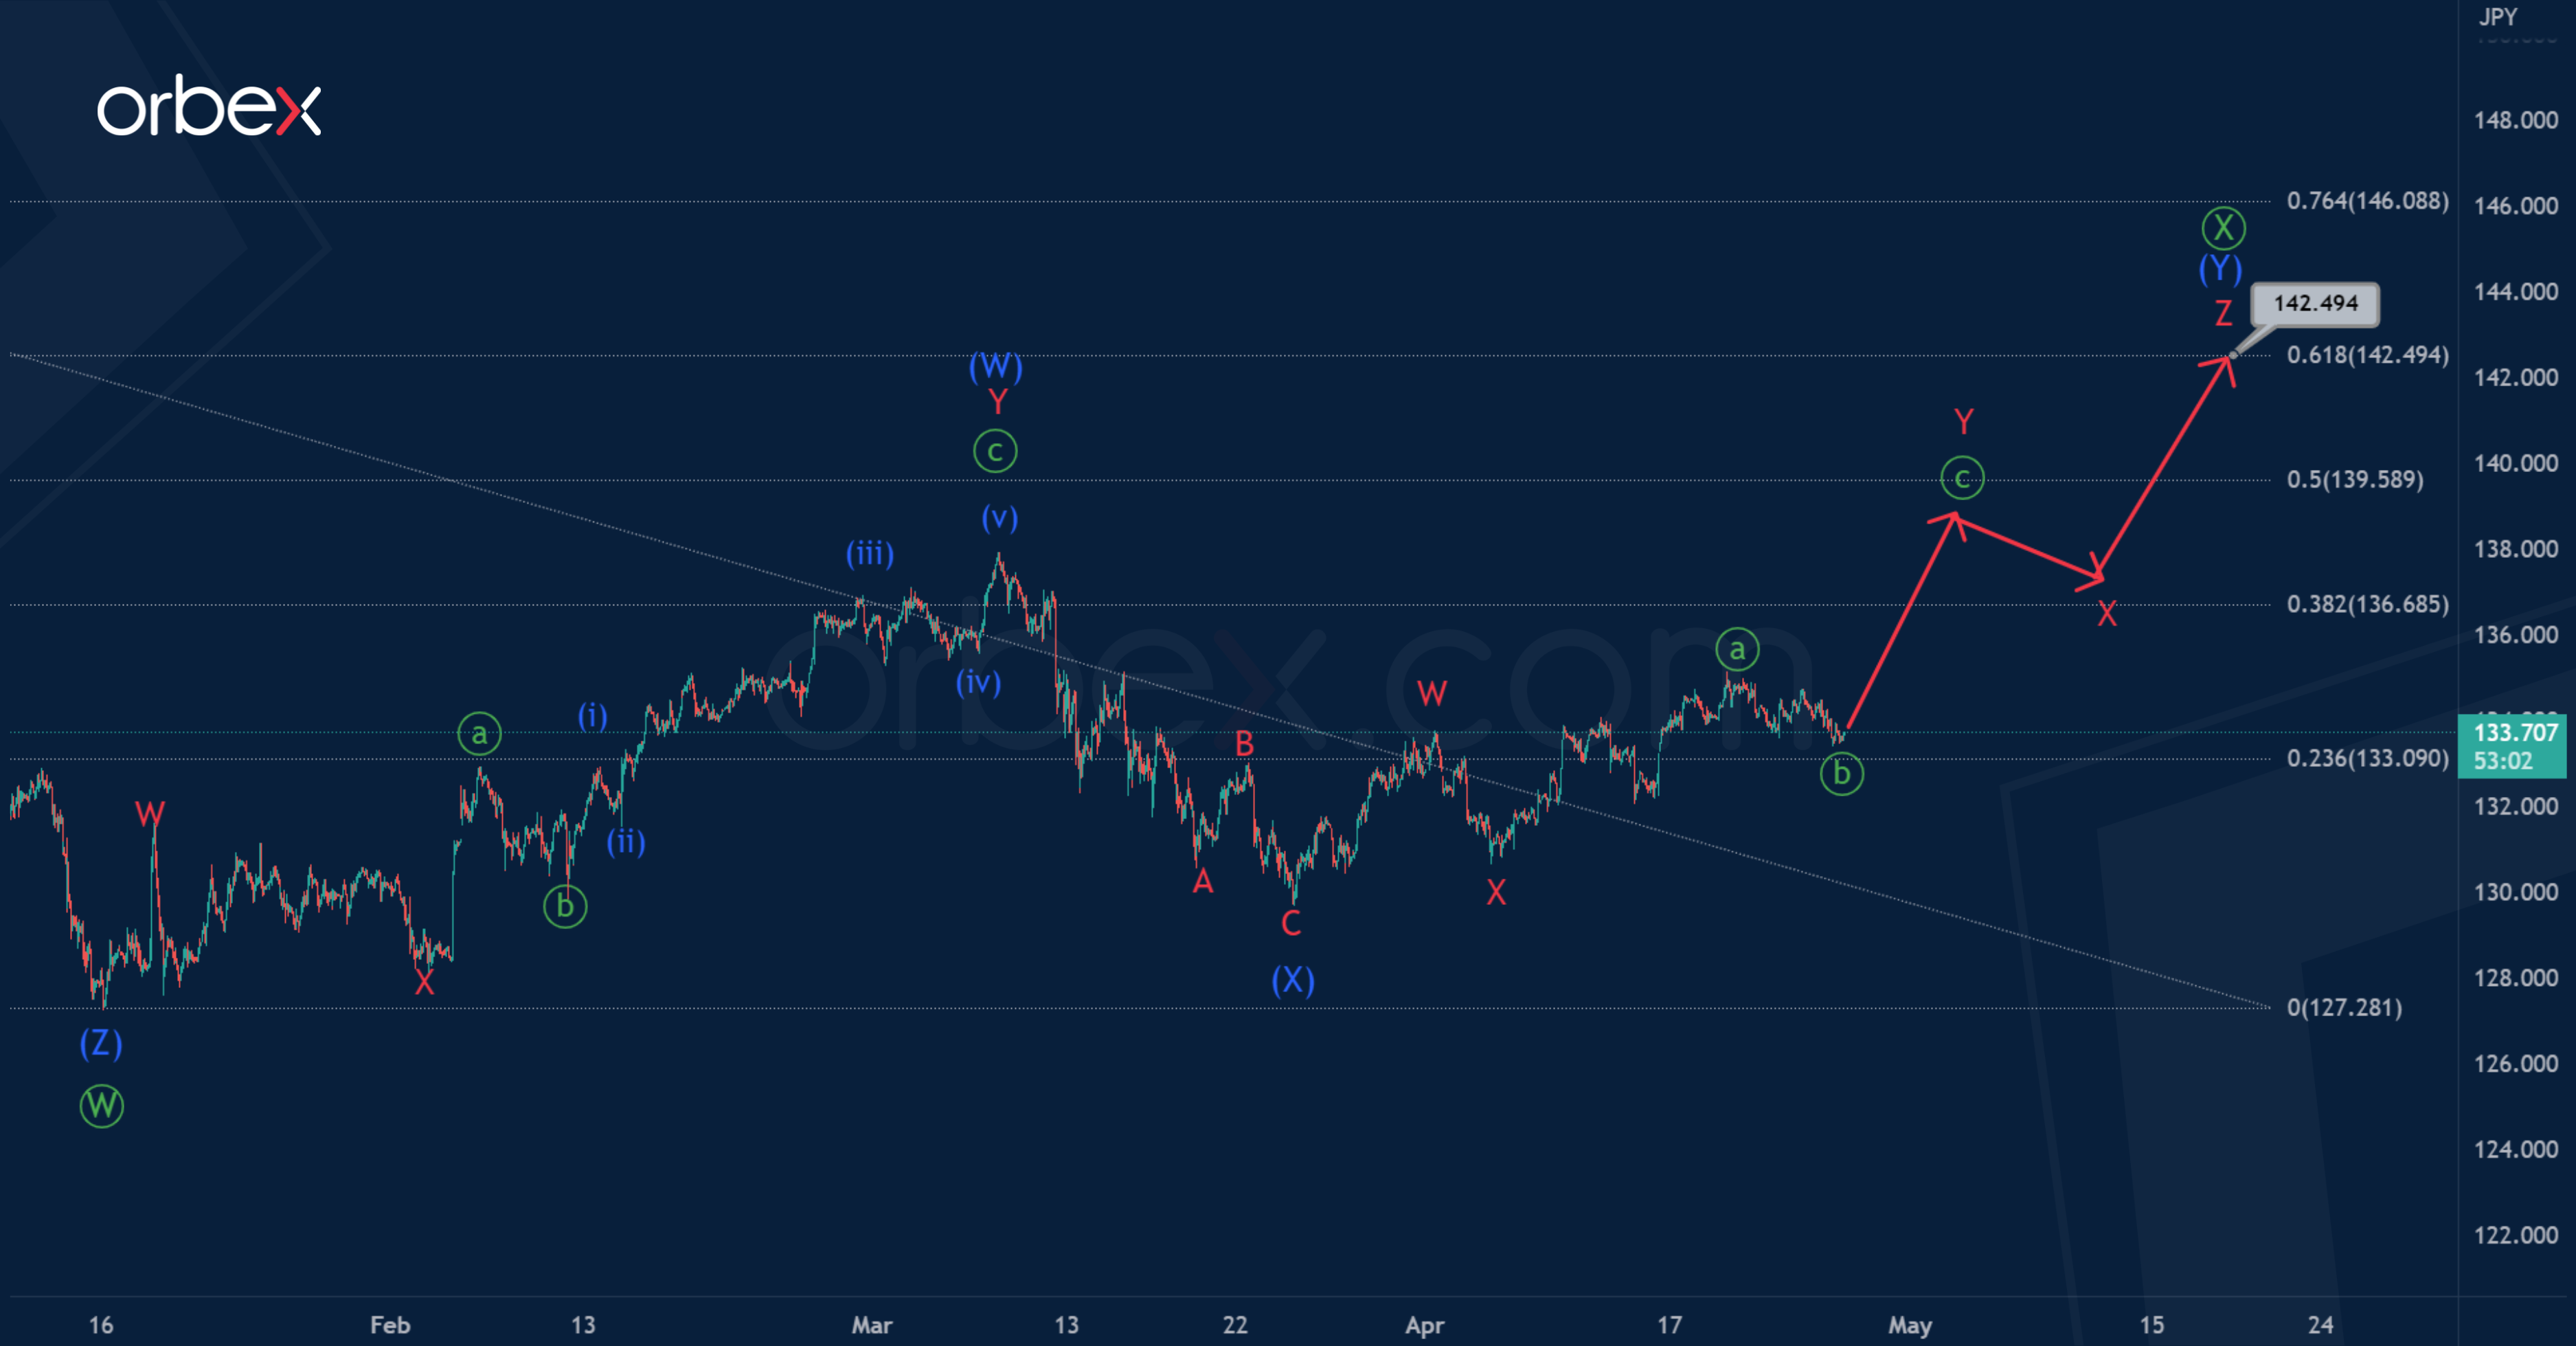
Unlike the main scenario, here, in an alternative scenario, wave Ⓧ is under development.
The primary wave Ⓧ can take the form of a double zigzag (W)-(X)-(Y). Within this pattern, we see completed intermediate sub-waves (W) and (X).
Most likely, in the last section of the chart we see the beginning of the construction of the final actionary wave (Y), the initial structure of which hints at a triple zigzag W-X-Y-X-Z.
It is expected to end at 142.49, where the primary wave Ⓧ will be at 61.8% of wave Ⓦ.
GBP/JPY Daily Outlook
Daily Pivots: (S1) 164.93; (P) 166.45; (R1) 167.46; More...
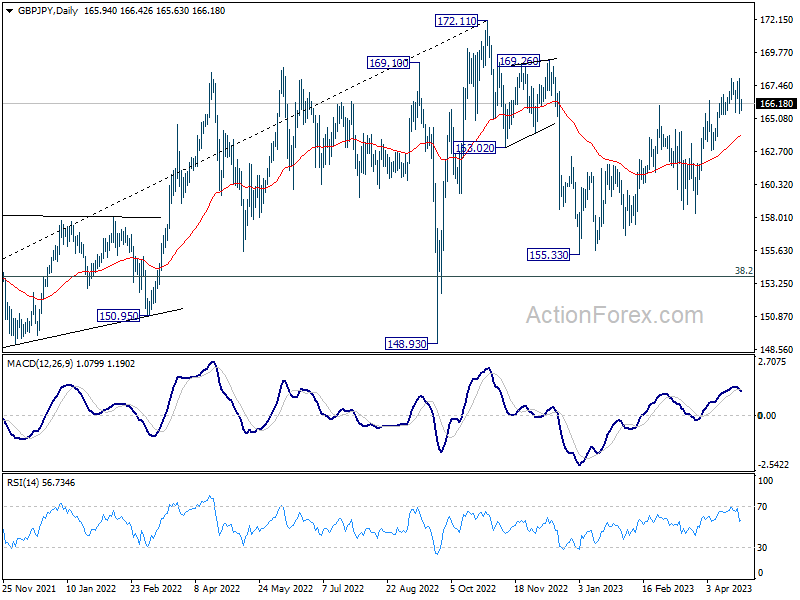
Intraday bias in GBP/JPY stays neutral and outlook is unchanged. Further rally is expected as long as 165.38 support holds. On the upside, break of 167.95 will resume the rebound from 155.33 to 169.26 resistance. However, firm break of 165.38 will argue that the corrective pattern from 172.11 is starting another falling leg. Intraday bias will be back on the downside for 162.75 support and below.
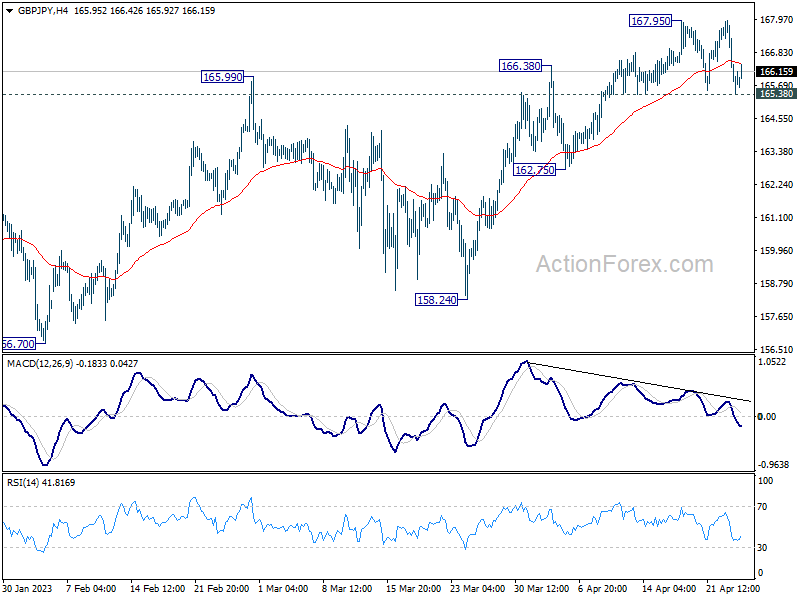
In the bigger picture, as long as 38.2% retracement of 123.94 (2020 low) to 172.11 (2022 high) at 153.70 holds, medium term bullishness is retained. That is, larger up trend from 123.94 (2020 low) is still in progress. Break of 172.11 high to resume such up trend is expected at a later stage.