Sample Category Title
A Dovish 50bp Rate Hike from the Riksbank
Market movers today
Preliminary Q1 GDP data will be released for Sweden and the US today. Consensus is looking for a small contraction for the former (-0.1% q/q), and moderating yet still fairly solid growth for the latter (+2.0% q/q AR).
Euro Area Economic Sentiment Indicators will be released for April, the flash consumer confidence index released earlier showed a modest uptick in sentiment.
Consensus expects the Central Bank of Turkey to maintain rates unchanged in its meeting today.
Overnight, we also expect the Bank of Japan to keep its monetary policy unchanged. See more details from our Bank of Japan Preview, 21 April.
The 60 second overview
Bank turmoil: Concerns over the regional banking sector and specifically First Republic Bank continued yesterday and sent global equities lower in a risk off mode which continued in the overnight Asian session.
Sweden: The Riksbank hiked rates as expected by 50bp to 3.50%, but the signals for future policy was dovish, signalling for less than another 25bp hike in either June or September, clearly lower than market pricing heading into the release. Anna Breman and Martin Flodén dissented against the decision, opting for a 25bp hike instead and a rate path signalling for additional 25bp hikes in June and/or September. For now, we keep our 50bp call for June, but given yesterday's release there is downside risk to our call. Given the signals, we would not rule out a scenario with 25bp in June followed by 25bp in Sep, see more in Flash comment Riksbank - Dovish hike, 26 April.
Geopolitics: Chinese leader Xi spoke with Ukrainian Prime Minister Zelensky yesterday for the first time since the Russian invasion. While it is too early to trade as a market theme, it should be seen as a positive sign, all things equal.
EU fiscal policies: EU Commission yesterday published an updated proposal on EU rules reform where the 3% and 60% of GDP reference values for deficit and debt remain unchanged. Countries will have to set out their fiscal adjustment paths, and the key variable for fiscal surveillance are now multi-year expenditure targets. The new framework is also accompanied by a more stringent enforcement regime: For countries that face substantial public debt challenges, departures from the agreed fiscal adjustment path will by default lead to the opening of an excessive deficit procedure. In the next steps the EU Council (heads of state) and EU Parliament both need to agree, before any new EU fiscal framework could come into effect. The deadline by year-end looks increasingly ambitious.
Equities: No news is no longer good news for markets! Lower volatility in bonds and equities is no longer enough to drive equities higher. Thereby, equities are duller in the lack of drivers, like yesterday. Strong tech reports were not really enough to lift equities on Wednesday. Europe and Nordics slumped, along with the US session where S&P eventually closed down -0.4%. Growth stocks outperformed, not due to yields but due to the turnaround in earnings. Otherwise, it was directionless trading with both cyclicals and defensives selling off. US futures are a notch higher today though.
FI: Yield curves steepened markedly yesterday with the front end 5bp lower while the longer end was 2-4bp higher across the jurisdictions. During the past two days, markets have taken 12bp out of the peak ECB policy pricing which has also led to a noteworthy inversion of the 2024 segment. After 10y Germany touched 2.5% on Monday, markets are now 10bp lower at 2.4%.
FX: The Riksbank hiked as expected yesterday, but left a dovish mark on SEK that lead to a rally in EUR/SEK above 11.40. It dragged EUR/NOK higher as well with the pair reaching a new high above 11.70. Broad USD sell-off sent EUR/USD briefly to the high end of the the range close to 1.11.
Credit: Overall a slightly negative tone in the corporate bond market fuelled by a negative tone in the overall equity market. iTraxx Main was 3bp wider while ITraxx Xover was 5bp wider. The Finnish nuclear power company TVO was upgraded to BBB-/Stable from BB+/Positive by S&P following the start-up of the commercial nuclear reactor OL3 which has been delayed for several years. We believe the upgrade was largely priced into spreads already. That said, we see the upgrade as positive as portfolio managers are likely to increase their exposure to TVO following the upgrade with TVO being included in IG benchmarks. Furthermore we expect that the markets will, over time, start to price in a chance of a further upgrade to 'BBB' in the medium term.
Nordic macro
Today, we get the Q1 GDP indicator in Sweden, which likely will be somewhat stronger than our forecast of -1.0% QoQ from Nordic Outlook. Somewhere in the area of -0.3% to -0.5% seems more likely given recent data releases. More interesting than the backward looking GDP data will be the forward looking NIER survey on businesses and households. Sentiment is likely to improve, although consumer confidence is likely to remain at very low levels. Retailers' price plans will also be in focus as these remain elevated despite other indicators showing easing cost pressures.
Technical Outlook and Review
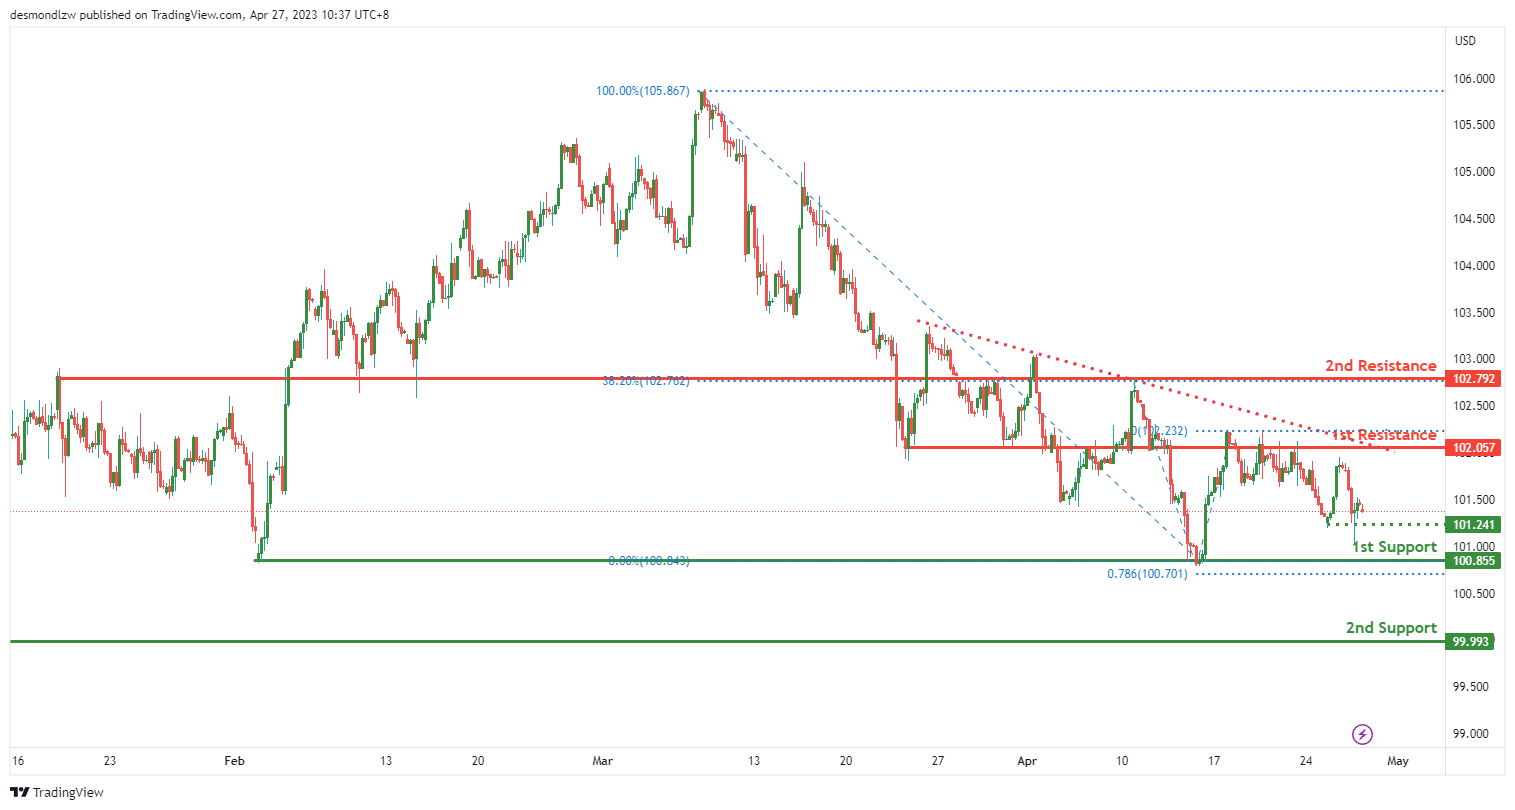
DXY:
The overall theme for DXY, as it is currently below a major descending trend line, signalling potential further drops in price. If the bearish trend continues, the first support level to watch out for is at 100.85, a multi-swing low support that has been previously tested. Below that, the second support level at 99.99 is also a swing low support that could provide additional support to price.
On the other hand, the first resistance level is at 102.05, an overlap resistance level that could potentially hinder the rise of prices. If price were to break through this level, the next resistance level to watch out for is at 102.79, another overlap resistance level, and coincides with the 38.20% Fibonacci retracement level.
There is also an intermediate support level at 101.24, which is a swing low support that could provide additional support in case the price falls further.
EUR/USD:
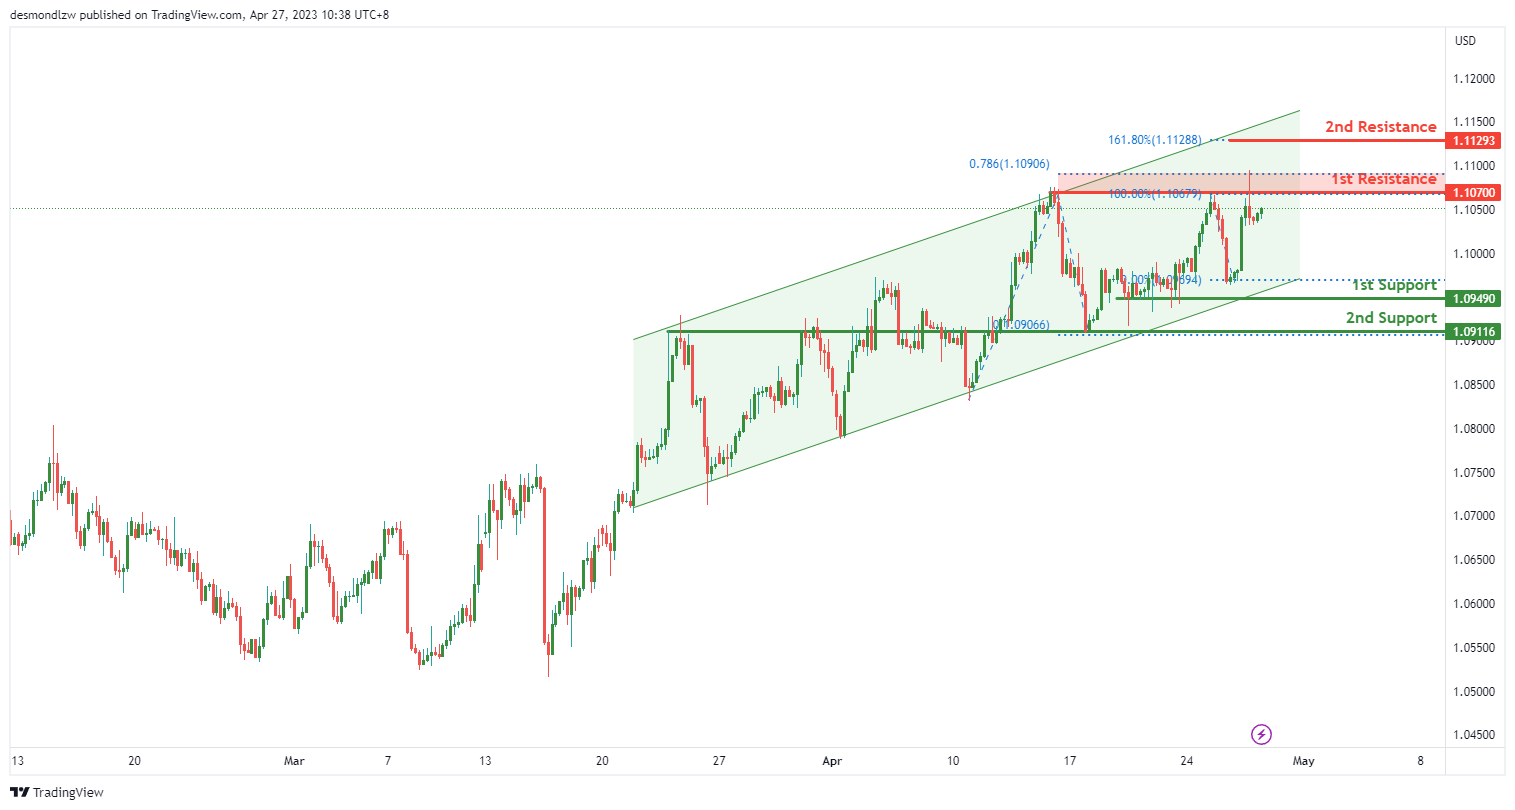
EUR/USD is showing bullish momentum as it is in a bullish ascending channel. This suggests that the price may continue to rise due to its bullish momentum. The current potential is a bullish break through of the 1st resistance and rise to the 2nd resistance.
The 1st support is at 1.0949, and it is a multi-swing low support. The 2nd support is at 1.0911, and it is an overlap support.
On the other hand, the 1st resistance is at 1.1070, and it is a swing high resistance with a 78.60% Fibonacci Projection. The 2nd resistance is at 1.1129, and it is at 161.80% Fibonacci Extension.
GBP/USD:
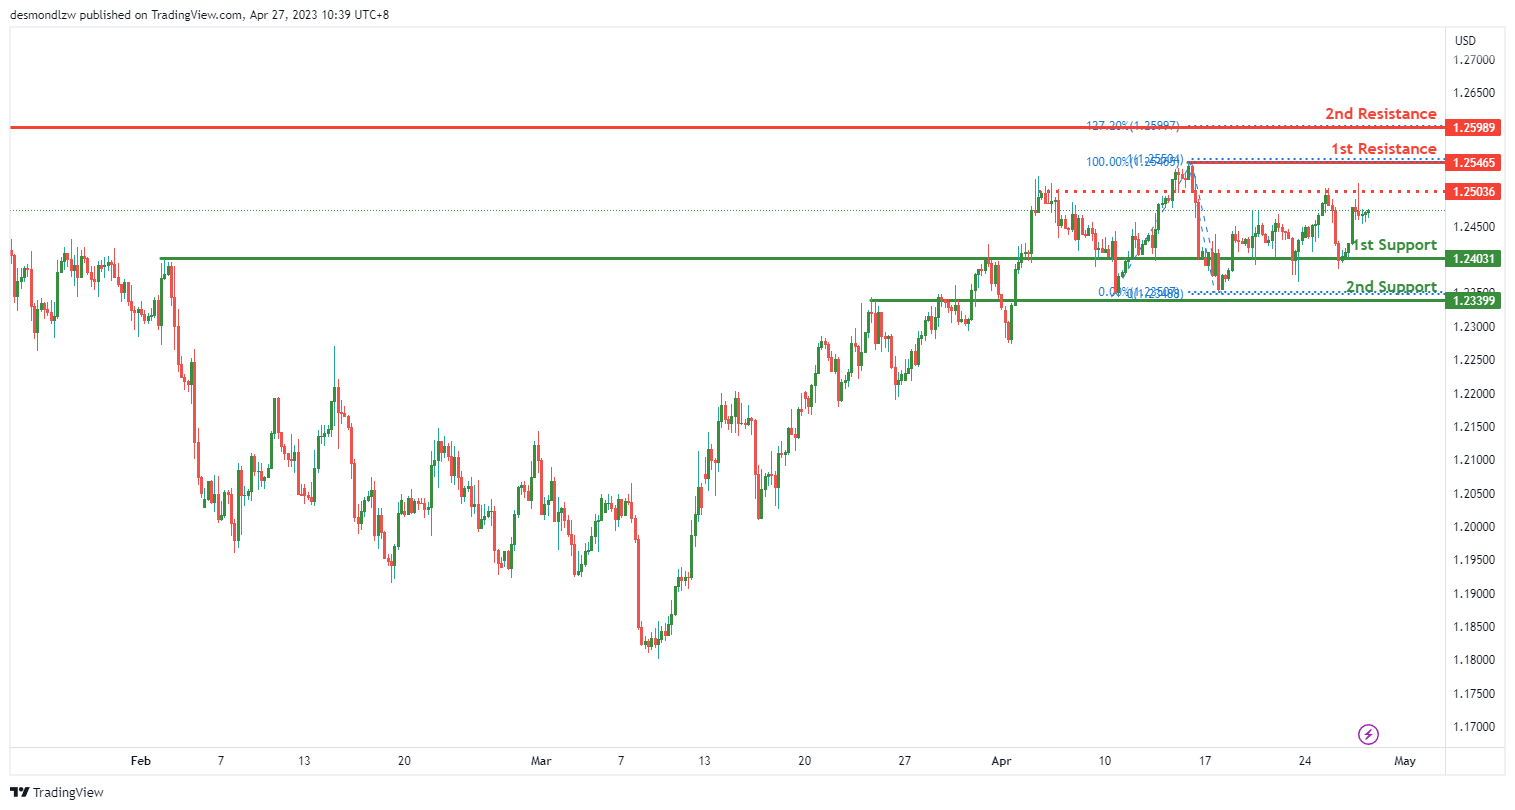
The GBP/USD chart currently exhibits a bullish momentum, with the price potentially continuing to rise towards the first resistance level. The first support level is at 1.2403 and it is an overlap support, meaning that it has been tested multiple times in the past and has held up well. The second support level at 1.2339 is also an overlap support, indicating a strong level of historical support.
The first resistance level is at 1.2546, which is a swing high resistance, and is also coinciding with a 100% Fibonacci projection. If the price manages to break through this resistance, it could rise towards the second resistance level at 1.2598. This level is also a swing high resistance and coincides with a 127.20% Fibonacci extension.
In between these two resistance levels, there is an intermediate resistance at 1.2503. This level has been tested multiple times in the past and has acted as a strong resistance level.
USD/CHF:
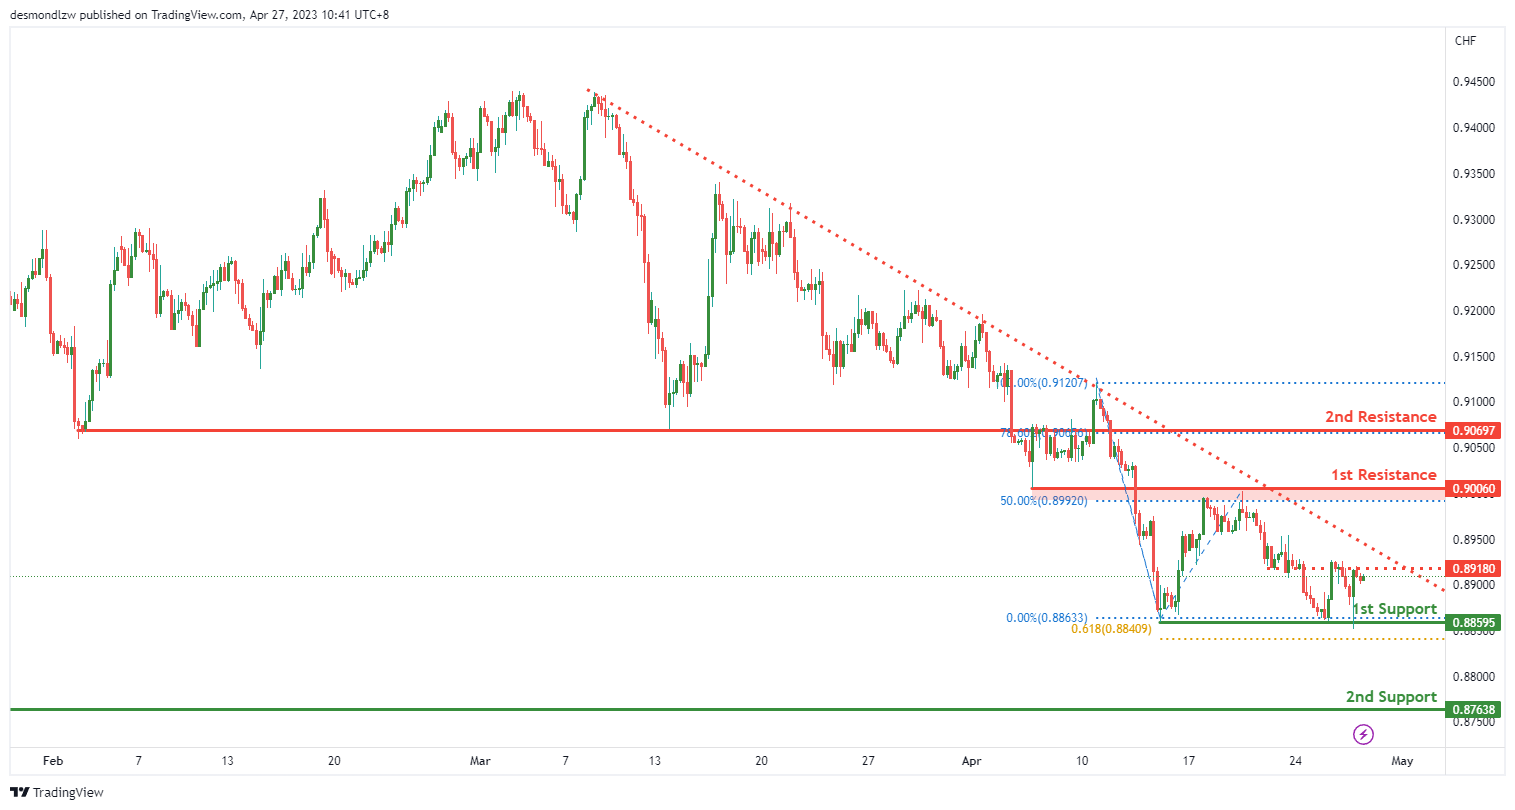
The USD/CHF chart is showing a bearish overall momentum, with price currently below a major descending trend line. This suggests that bearish momentum is on the cards, which suggests that price might continue to go lower due to its bearish momentum.
As for potential price action, there could be a bearish continuation towards the 1st support level at 0.8859. This level is a multi-swing low support and coincides with a 61.80% Fibonacci projection, making it a strong support level. If price breaks below this level, it could potentially drop to the 2nd support at 0.8763, which is a swing low support.
On the resistance side, there is a 1st resistance at 0.9006, which is an overlap resistance level that coincides with a 50% Fibonacci retracement. Additionally, there is a 2nd resistance at 0.9069, which is a pullback resistance level that coincides with a 78.60% Fibonacci retracement. Between the current price and the 1st resistance, there is an intermediate resistance at 0.8918, which is also an overlap resistance.
USD/JPY:
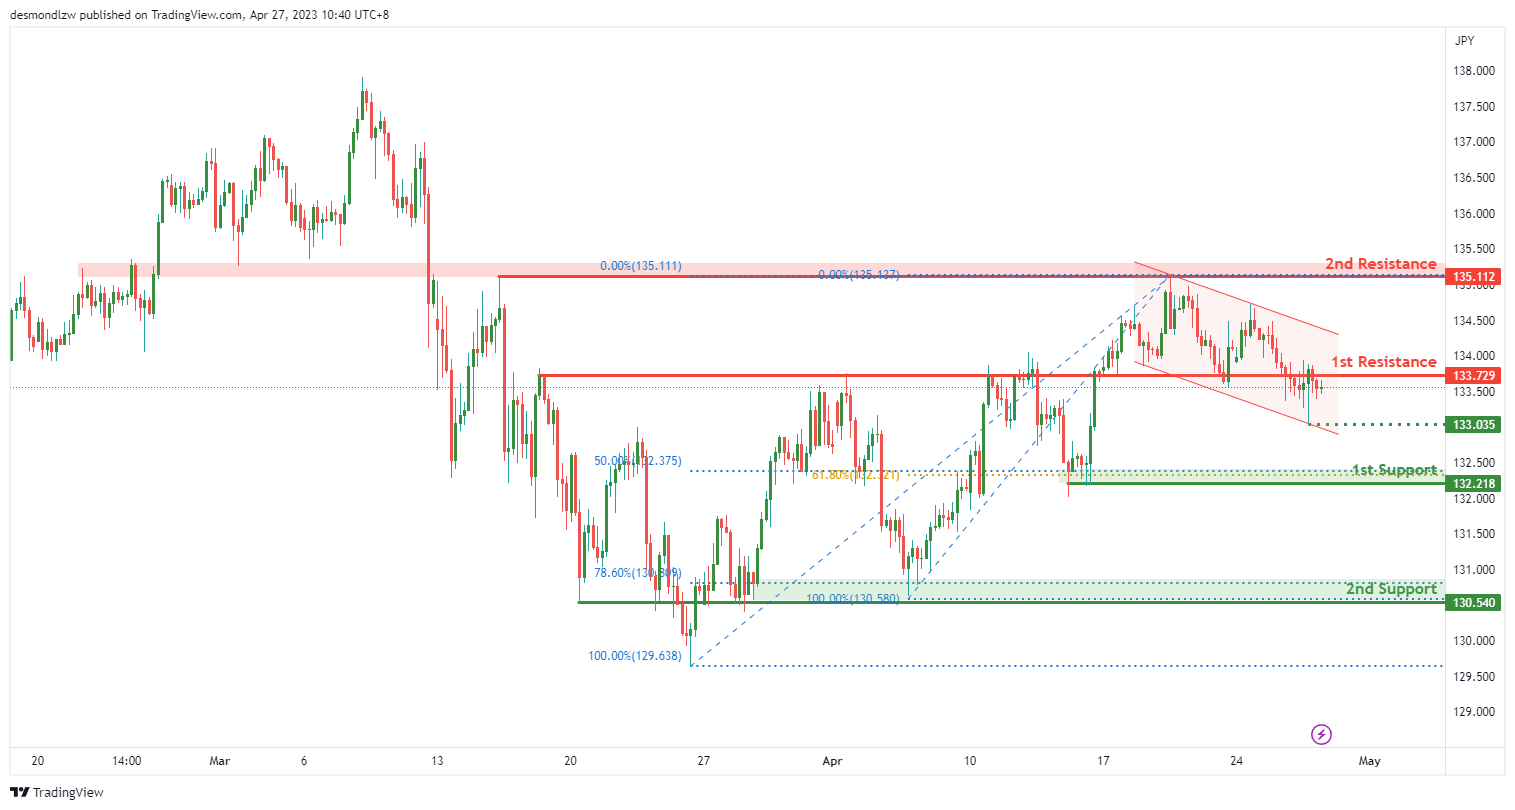
The USD/JPY pair is currently seeing a bearish momentum as it remains within a descending channel, suggesting that price might continue to go lower due to its bearish momentum. Additionally, price is below a major descending trend line, further indicating bearish momentum.
There is a potential for a bearish continuation towards the 1st support at 132.2100, which is a multi-swing low support and coincides with a 61.80% Fibonacci retracement. If price breaks below this level, it could potentially drop to the 2nd support at 130.5400, which is an overlap support and coincides with a 78.60% Fibonacci retracement.
On the other hand, the 1st resistance is at 133.7200, which is an overlap resistance. If price manages to break above this level, it could potentially rise to the 2nd resistance at 135.1100, which is a multi-swing high resistance.
AUD/USD:
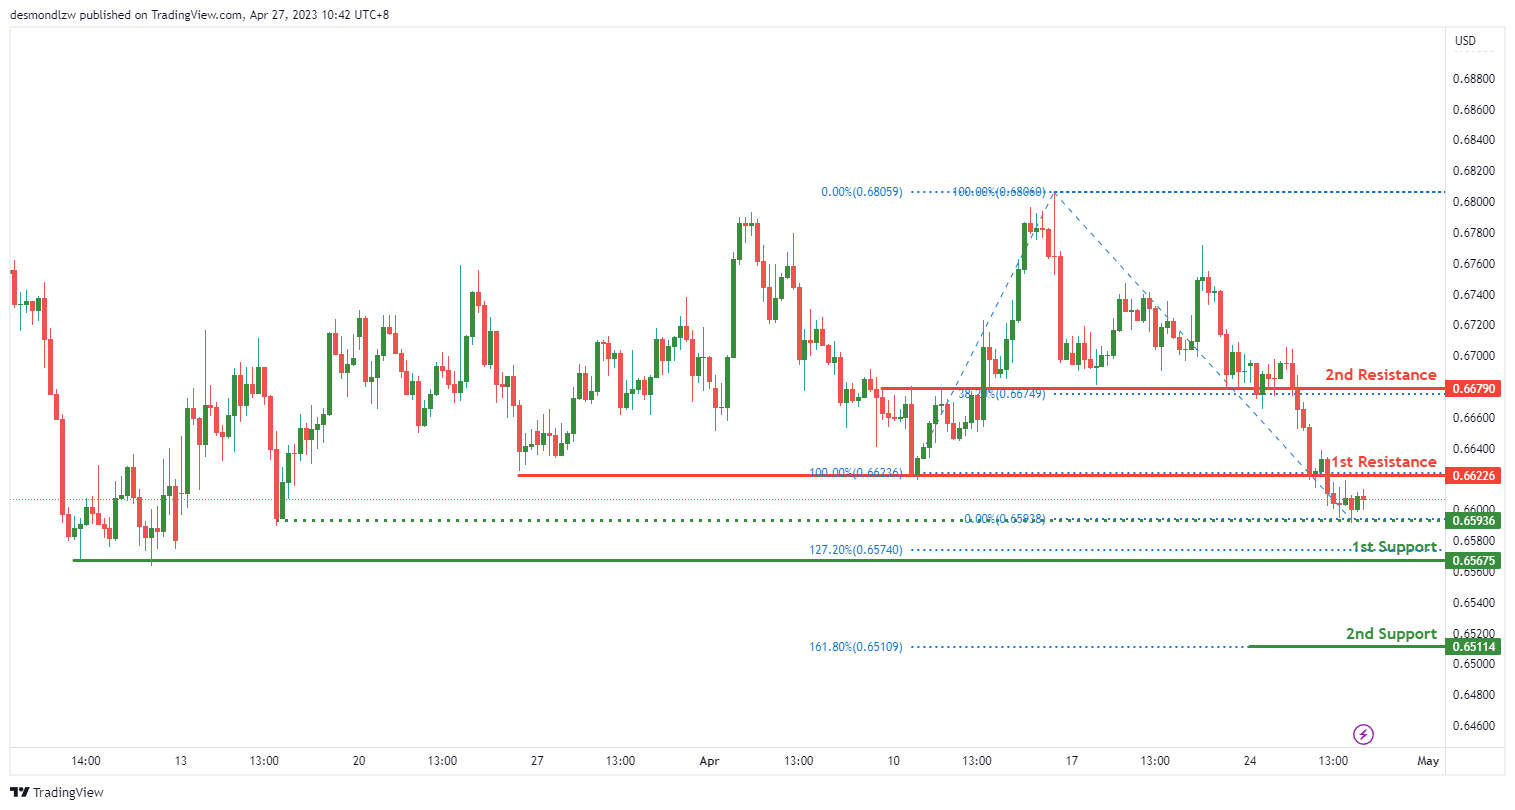
The overall momentum of the AUD/USD chart is bearish, with price potentially continuing its descent towards the 1st support level. The pair is currently facing a multi-swing low support at 0.6567, which is also supported by the 127.20% Fibonacci Extension, making it a strong level of support.
If the 1st support level is breached, the pair could drop to the 2nd support level at 0.6511, which is reinforced by the 161.80% Fibonacci Extension, adding further strength to this level of support.
On the other hand, if the pair manages to climb upwards, it could encounter its first resistance level at 0.6622, which is an overlap resistance. A break above this level could potentially lead to a pullback towards the 2nd resistance level at 0.6679, which is further reinforced by the 38.20% Fibonacci Retracement.
In the meantime, the intermediate support level of 0.6593, which is a multi-swing low support, may offer some temporary respite for the pair.
NZD/USD:
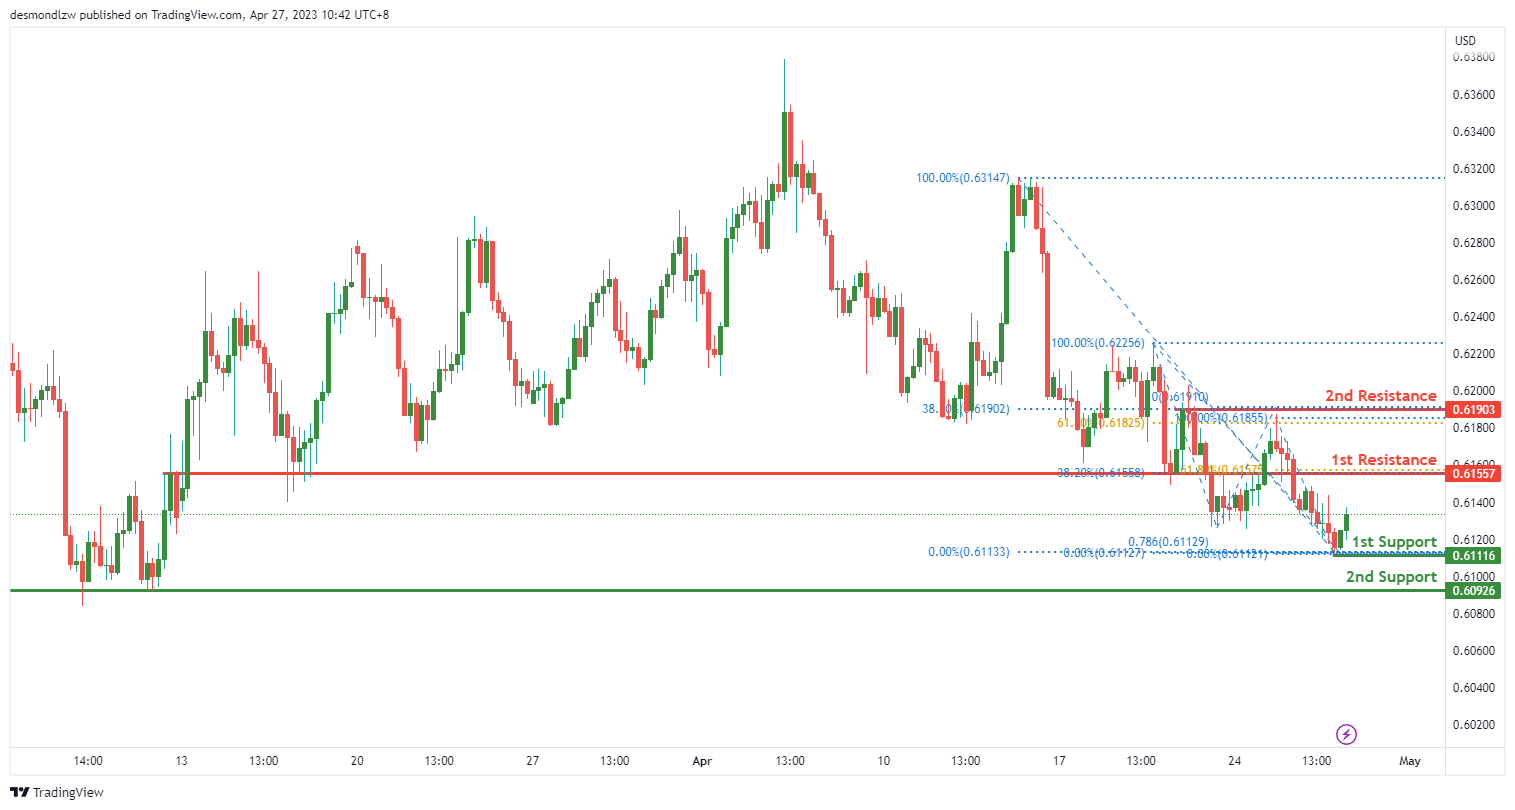
The overall momentum of the NZD/USD chart is currently bullish, with price potentially making a bullish continuation towards the first resistance level. The bullish momentum is indicated by price holding above a swing low support and with an overall trend that suggests further upward movement.
In terms of specific support and resistance levels, the first support level is at 0.6111, which is a swing low support and also coincides with the 78.60% Fibonacci projection. The second support level is at 0.6092, which is a multi-swing low support.
On the other hand, the first resistance level is at 0.6155, which is an overlap resistance and also lines up with the 38.20% Fibonacci retracement. The second resistance level is at 0.6190, which is a multi-swing high resistance and coincides with the 61.80% Fibonacci retracement.
USD/CAD:
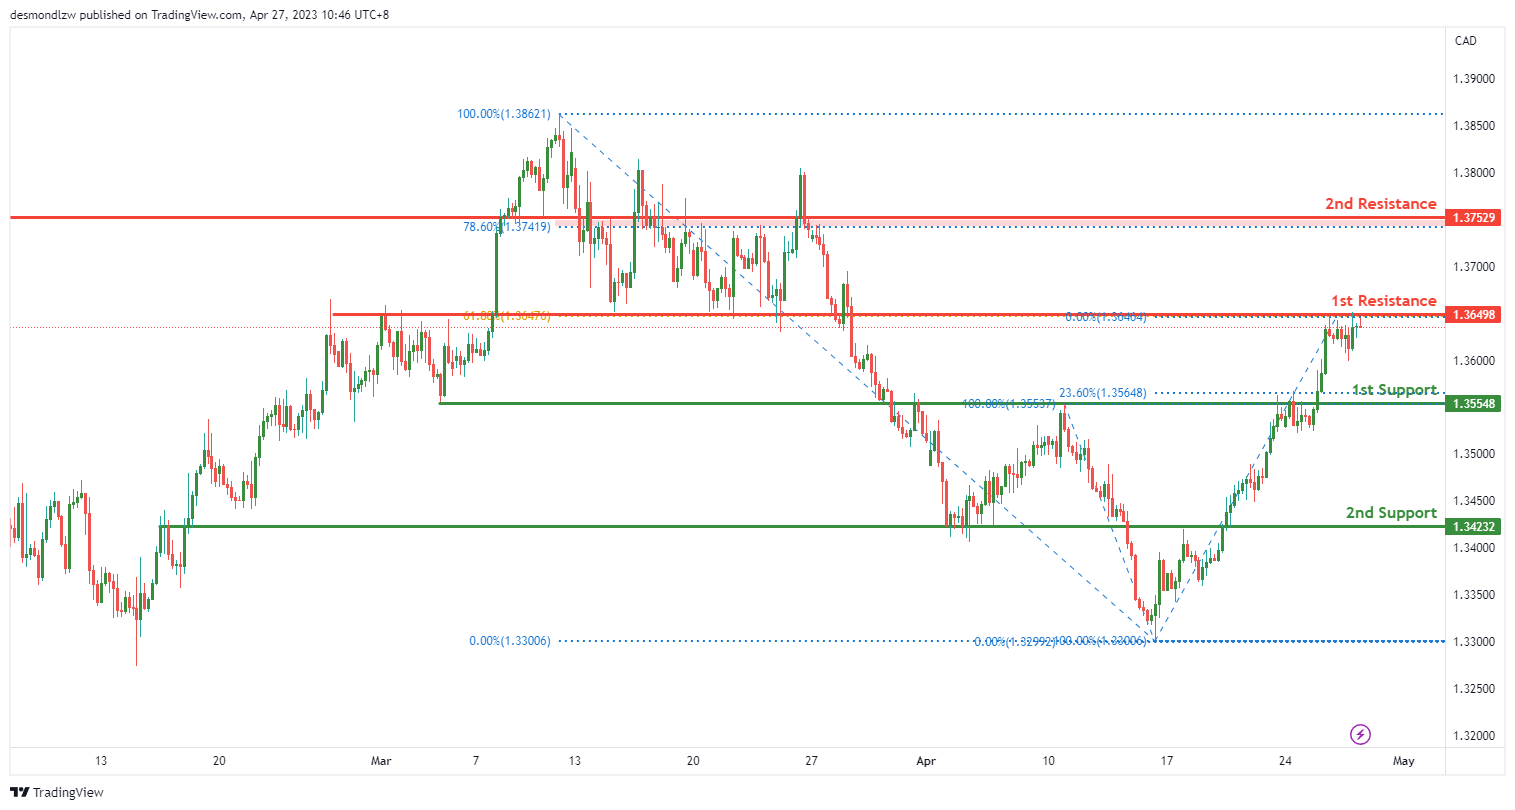
The USD/CAD chart currently shows bearish momentum, with price below a major descending trend line. Additionally, the chart is within a bearish channel, which suggests that price may continue to go lower due to its bearish momentum.
Price could potentially make a bearish reaction off the first resistance at 1.3649 and drop to the first support at 1.3554. This support level is a pullback support and is at a 23.60% Fibonacci retracement. If price were to break this level, the next support is at 1.3423, which is also a pullback support.
On the other hand, if price were to break the first resistance, it could rise towards the second resistance at 1.3752. This level is a pullback resistance and coincides with a 78.60% Fibonacci retracement.
DJ30:
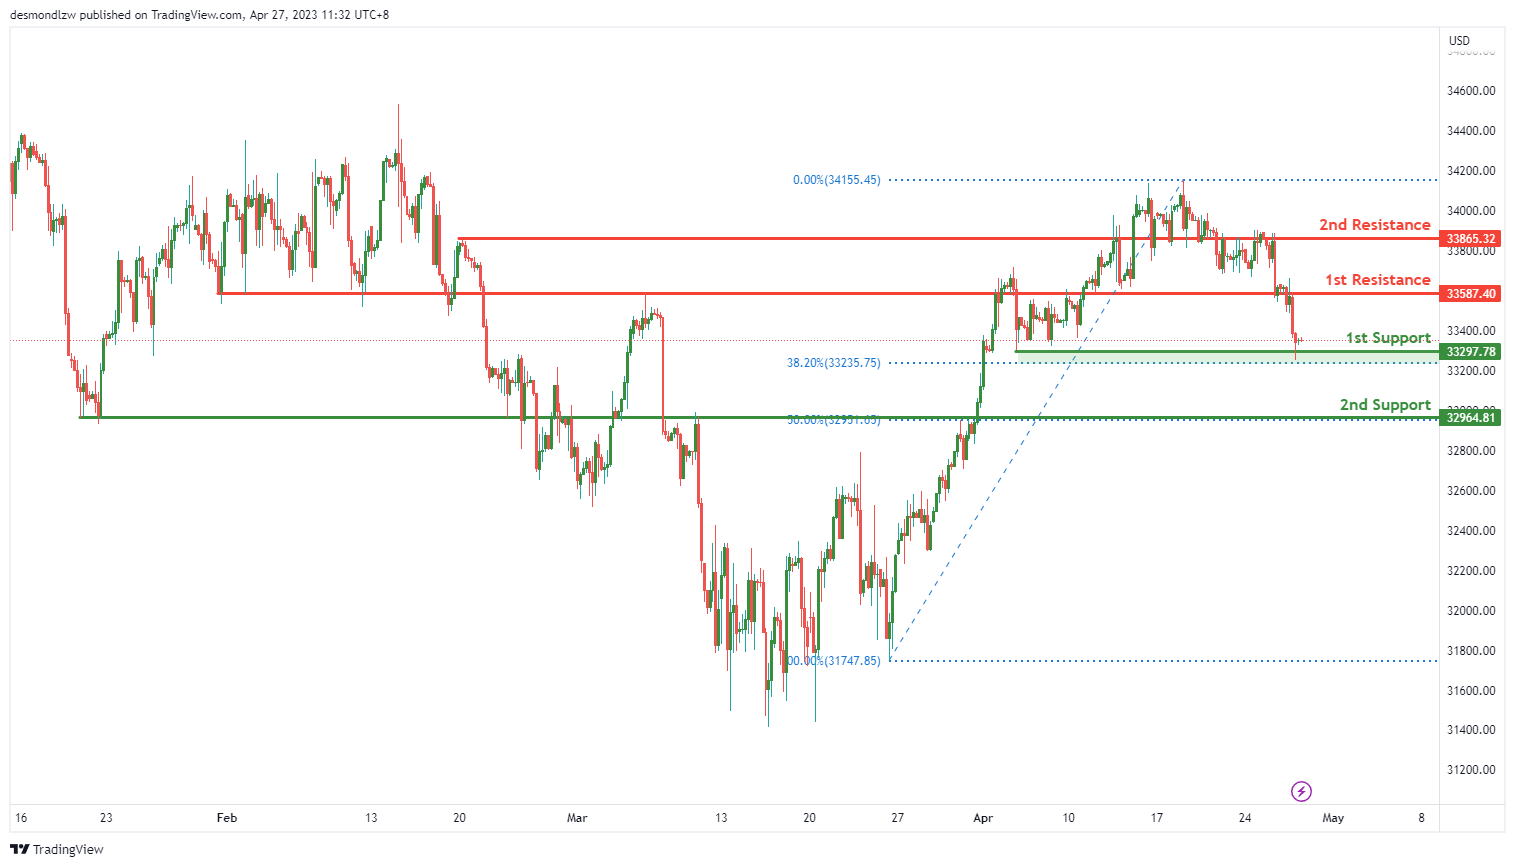
The Dow Jones Industrial Average (DJ30) has been showing bearish momentum with price potentially making a bearish break off the first support towards the second support. The overall momentum of the chart is bearish with the price being below a major descending trend line, indicating that bearish momentum is on the cards.
The first support for DJ30 is at 33297.78, which is a multi-swing low support level and also coincides with the 38.20% Fibonacci retracement level. This level has held as support in the past, making it a good level to watch for potential buying opportunities. If the price breaks below this support level, it could drop towards the second support at 32964.81, which is a pullback support level and also coincides with the 50% Fibonacci retracement level.
On the resistance side, the first resistance level is at 33587.40, which is an overlap resistance level. This level could potentially act as a barrier to the price moving higher. If the price manages to break above this level, it could rise towards the second resistance level at 33865.32, which is also an overlap resistance level.
GER30:
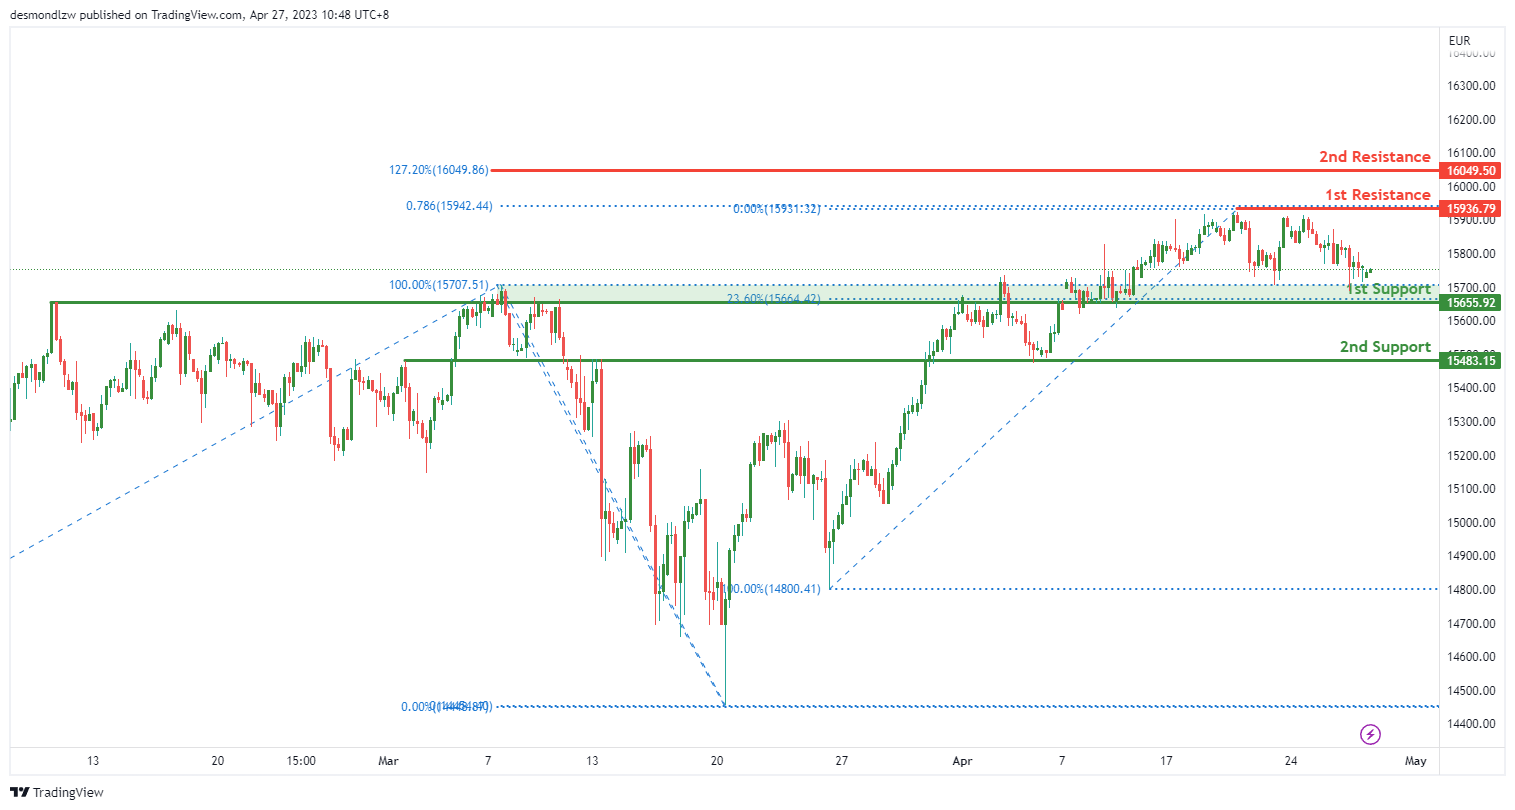
The GER30 chart is currently showing bullish momentum, with potential for a bounce off the first support towards the first resistance level. The overall momentum of the chart is bullish, which indicates that the price may continue to rise due to its bullish momentum.
The first support level is at 15655.92, which is an overlap support and is supported by the 23.60% Fibonacci retracement. This is a strong level of support that may provide a bounce for the price to move towards the first resistance level.
The second support level is at 15483.15, which is another overlap support level. If the price fails to hold above the first support level, this level could be the next target for bears.
The first resistance level is at 15936.79, which is a swing high resistance level. A breakout above this level could trigger a further rise towards the second resistance level.
The second resistance level is at 16049.50, which is supported by the 127.20% Fibonacci extension. This level may provide strong resistance to the price, but a break above it could signal further bullish momentum.
BTC/USD:
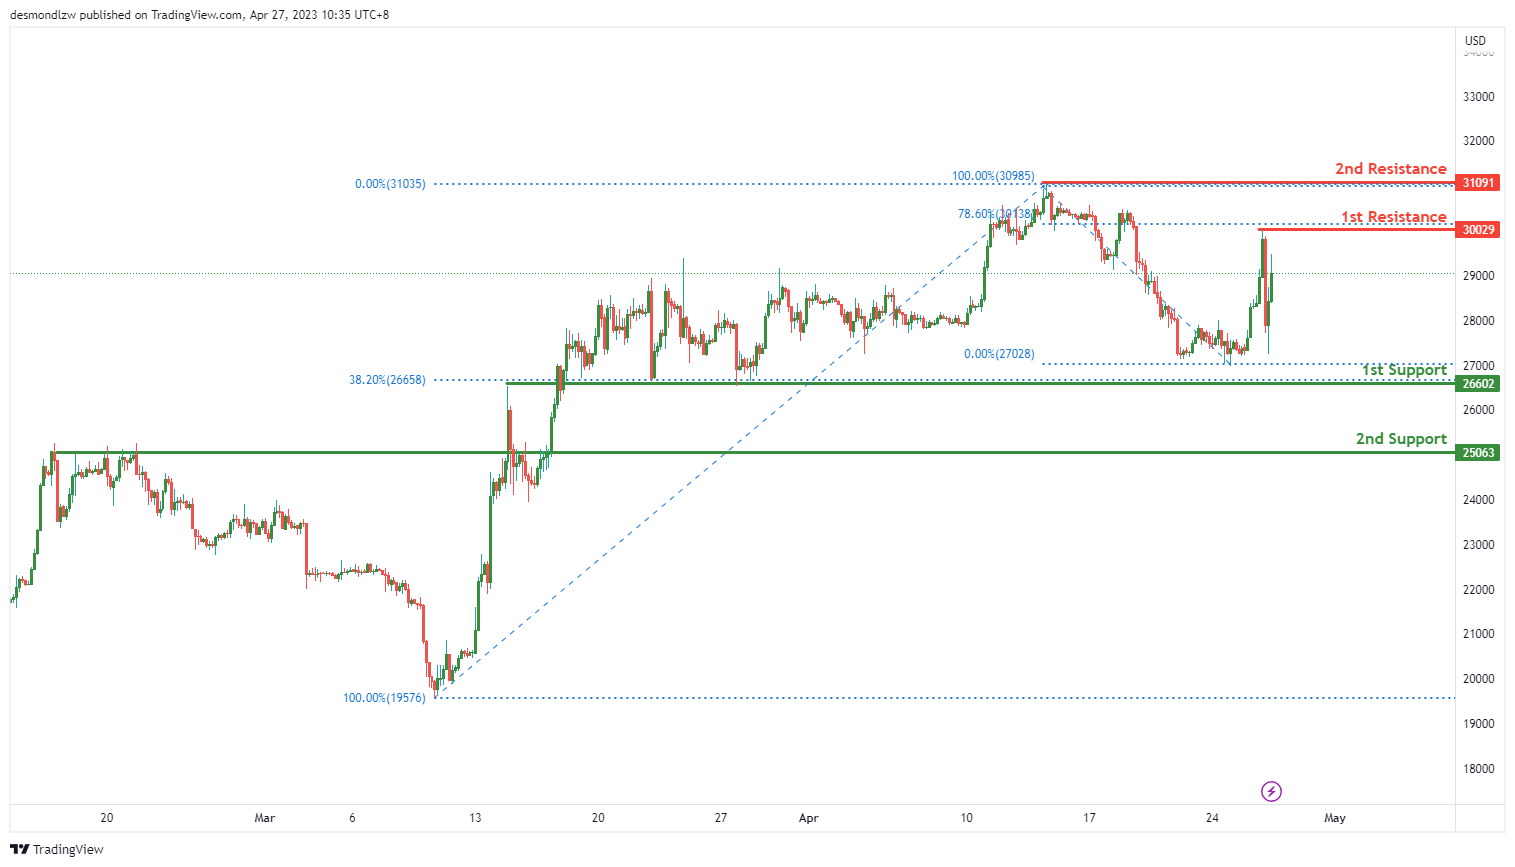
Bitcoin (BTC/USD) has been trading with a neutral bias recently, showing no clear direction on the chart. The price action of the world’s largest cryptocurrency by market capitalization has been oscillating between two key levels. On the one hand, the 1st support level is set at 26,602, which is a significant overlap support that the price has bounced off in the past. On the other hand, the 1st resistance level is placed at 30,029, which is a key swing high resistance and is also located at the 78.60% Fibonacci retracement level.
If the price of BTC/USD manages to break through the 1st resistance level, it could signal a potential bullish momentum and an increase in buying pressure. The next significant resistance level that traders might watch for is at 31,091, which is a key swing high resistance that has been in place for several weeks.
However, if the price of BTC/USD drops below the 1st support level, it could suggest a potential bearish trend and an increase in selling pressure. In this case, the next significant support level that traders may look at is 25,063, which is a pullback support level that has been tested several times in the past.
US500
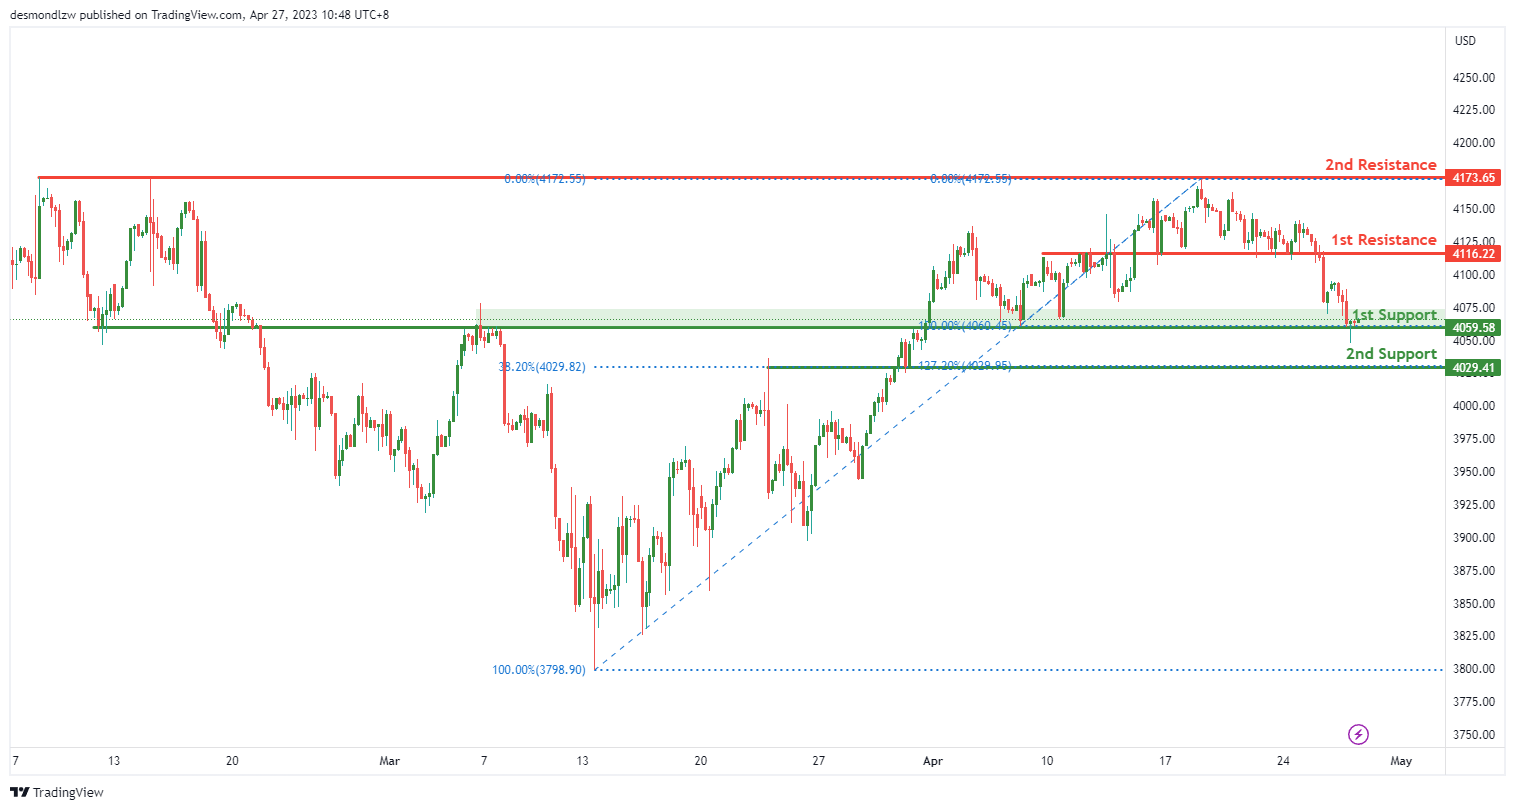
The US500 chart suggests a bullish bias with an overall bullish momentum. Price may potentially bounce off the 1st support at 4059.58, which is an overlap support level. If price rises from this level, it could head towards the 1st resistance at 4116.22, which is a pullback resistance level. A break above this level could push the price towards the 2nd resistance at 4173.65, which is a multi-swing high resistance level.
In case of a downward move, the 2nd support level at 4029.41 could provide pullback support as it lines up with the 38.20% Fibonacci retracement. The 1st support level at 4059.58 is also a potential level of support as it is an overlap support level. A break below this level could cause the price to drop towards the 2nd support level.
ETH/USD:
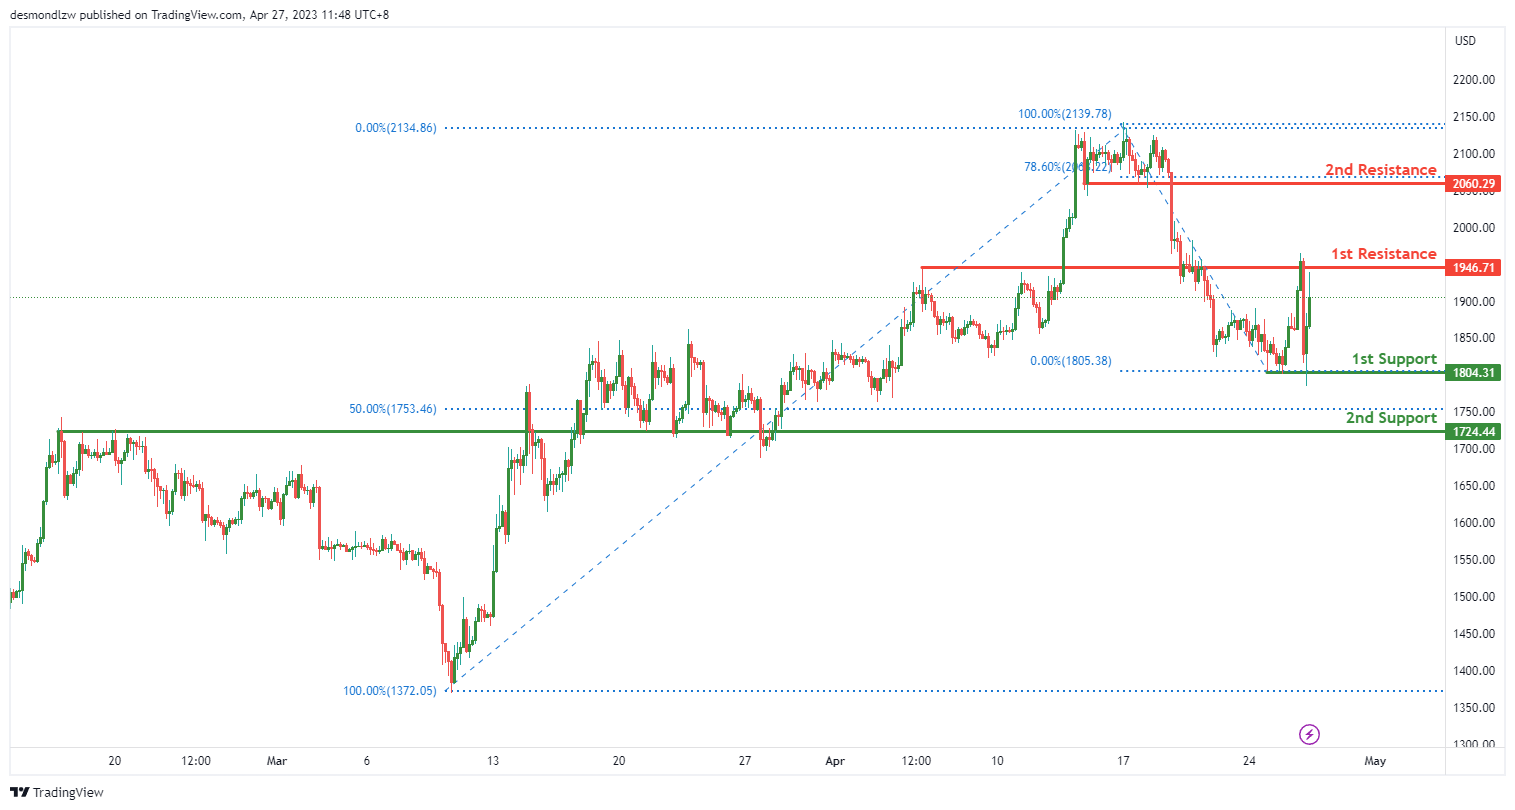
The overall momentum of the ETH/USD chart is currently neutral, suggesting that there is no clear trend direction. As a result, price could potentially fluctuate between key support and resistance levels in the short term.
The first support level is at 1804.31, which is a multi-swing low support. This level could provide some buying interest and push prices higher. If the first support level fails to hold, the next support level is at 1724.44, which is an overlap support and coincides with the 50% Fibonacci retracement level. This level has proven to be a strong support in the past and could attract buyers if price drops towards it.
On the other hand, the first resistance level is at 1946.71, which is an overlap resistance. If price manages to break above this level, it could potentially trigger a bullish move towards the second resistance level at 2060.29. This level is a pullback resistance and coincides with the 78.60% Fibonacci retracement level.
WTI/USD:
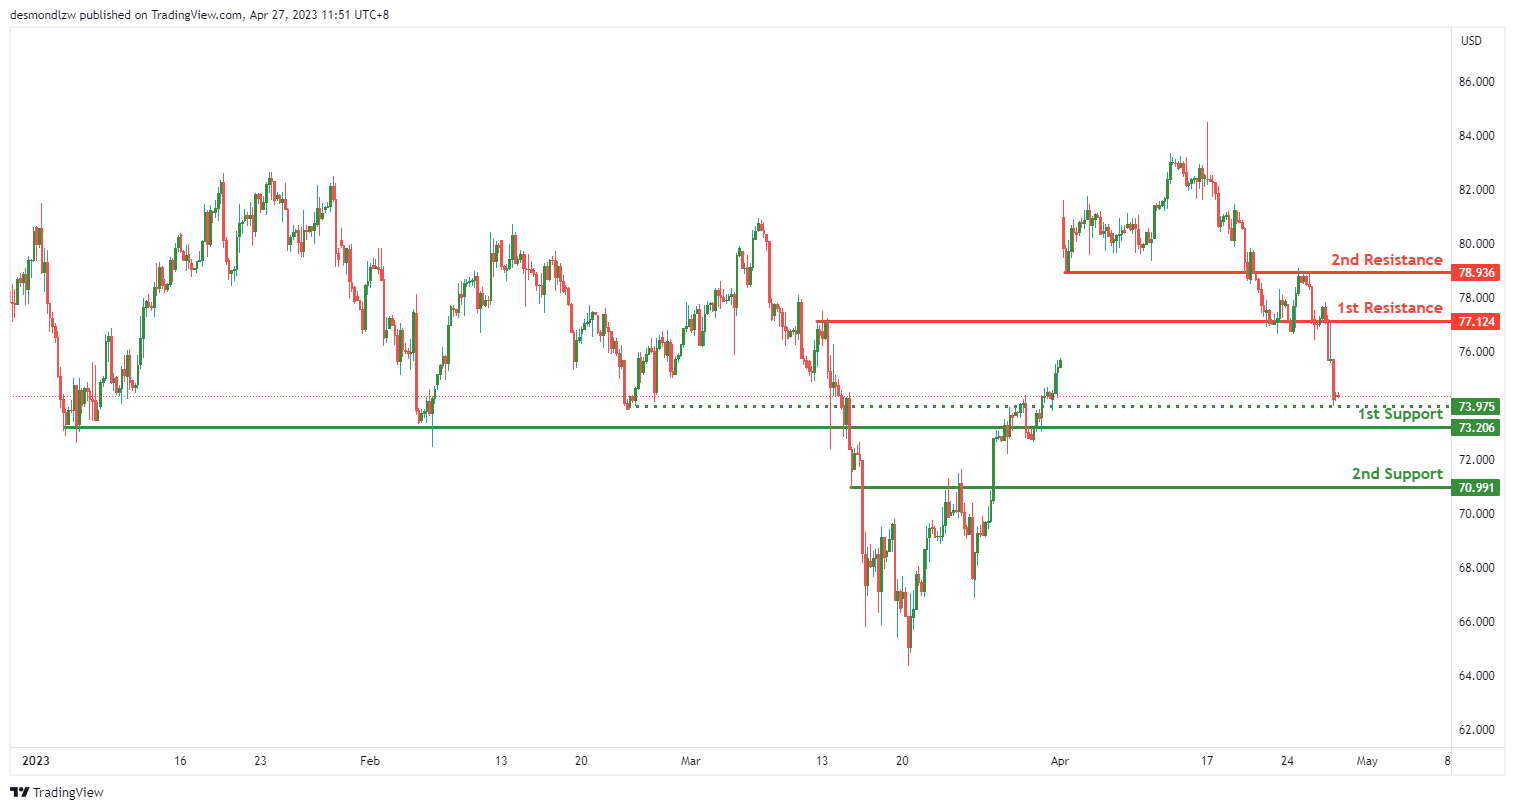
The WTI price is currently bearish, and it could potentially continue to drop towards the 1st support level.
The 1st support level is at 73.20, and it is a strong overlap support level. If the price breaks through this support level, the next support level is at 70.99, which is a pullback support level.
On the other hand, the 1st resistance level is at 77.12, and it is a strong overlap resistance level. If the price were to rise, it could face a resistance at 78.93, which is another overlap resistance level.
There is an intermediate support level at 73.97, which is a pullback support level. If the price were to break this intermediate support, it could potentially drop towards the 2nd support level at 70.99.
XAU/USD (GOLD):
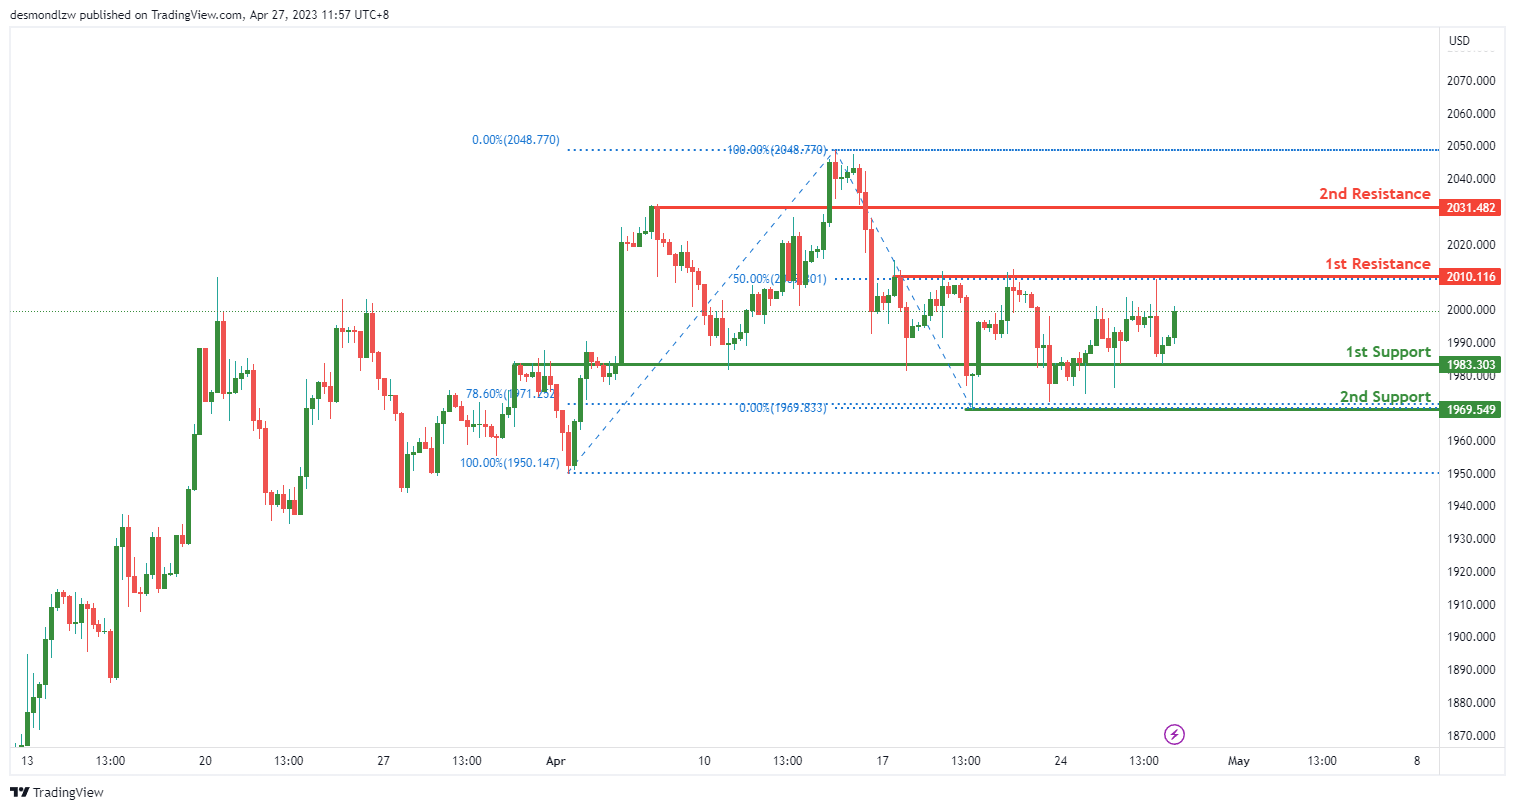
XAU/USD has been showing strong bullish momentum on the chart, suggesting that prices might continue to rise further. At present, the overall momentum of the chart is bullish. Price is currently fluctuating between the 1st support level at 1983.30 and the 1st resistance level at 2010.11. However, price could potentially make a bullish continuation towards the 1st resistance level.
The 1st support level at 1983.30 is a strong overlap support, indicating that this level has previously acted as both support and resistance. The 2nd support level at 1969.54 is a swing low support, and it has a 78.60% Fibonacci retracement lining up with it. This level is also a good pullback support.
The 1st resistance level at 2010.11 is a swing high resistance, which means it has acted as a resistance level in the past. The 2nd resistance level at 2031.48 is a pullback resistance, suggesting that it might potentially act as a resistance level as well.
EUR/CHF Daily Outlook
Daily Pivots: (S1) 0.9798; (P) 0.9821; (R1) 0.9864; More...
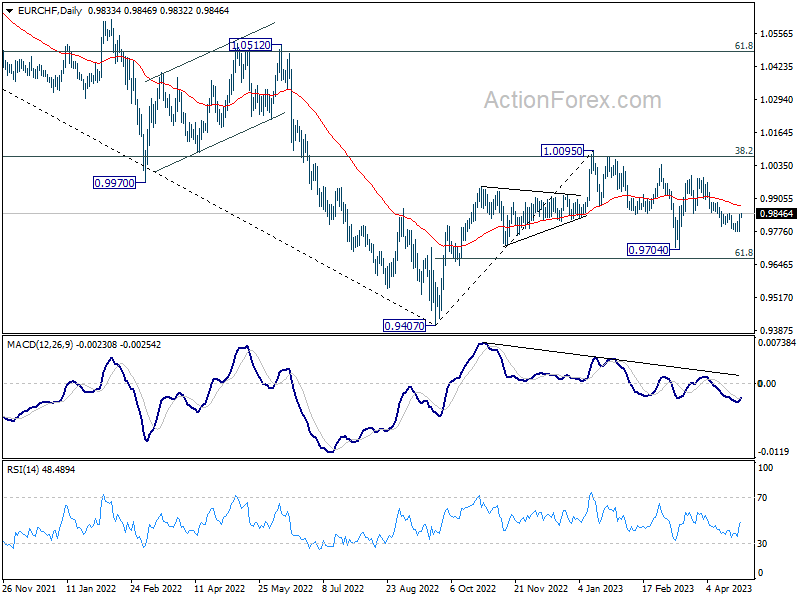
Immediate focus is now on 0.9846 in EUR/CHF as rebound from 0.9774 extends. Decisive break there will argue that pull back from 0.9995 has completed. More importantly, that would revive the case that whole correction from 1.0095 has completed at 0.9704. Intraday bias will be back on the upside for 55 D EMA (now at 0.9876). Sustained trading above there will pave the way back to 0.9995 resistance next. Nevertheless, break of 0.9774 will resume recent decline to 0.9704 support and below.
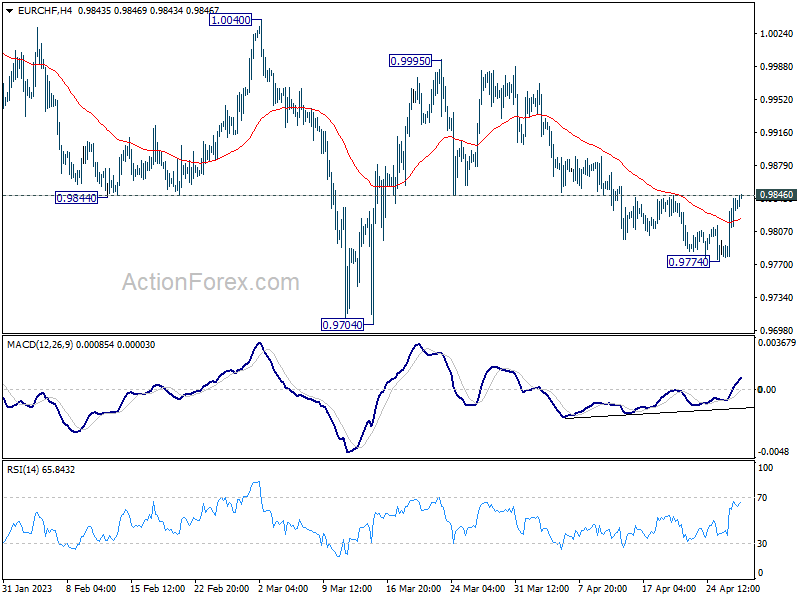
In the bigger picture, prior rejection by 55 W EMA (now at 0.9989) and 38.2% retracement of 1.1149 to 0.9407 at 1.0072 suggests that medium term outlook is staying bearish. That is, down trend from 1.2004 is not completed yet and is in favor to resume through 0.9407 at a later stage. However, decisive break of 1.0095 resistance will raise the chance of bullish trend reversal. Rise from 0.9407 should then target 1.0505 cluster resistance (2020 low at 1.0505, 61.8% retracement of 1.1149 to 0.9407 at 1.1484).
Forex Markets Steady in Asian Session, Aussie Continues to Struggle While Euro Leads
The forex markets appear stable in today's Asian session, with most major pairs and crosses remaining within yesterday's range. Stabilization of US stocks helped calm investors for now, but overall sentiment remains vulnerable. Australian Dollar continues to be the week's worst performer, facing a triple blow of risk aversion, declining copper prices, and RBA speculation. Canadian Dollar trails as the second-worst performer, while Dollar is the third weakest due to concerns over regional bank issues.
On the flip side, Euro leads this week on expectations of extended tightening by the ECB and optimism that the Eurozone economy is regaining momentum in Q2. Sterling and Swiss Franc are also performing well. Surprisingly, Yen is currently the second-best performer, partly due to falling yields and risk aversion. However, Yen's weekly gain is limited so far, and its next move will depend heavily on tomorrow's BoJ rate decision.
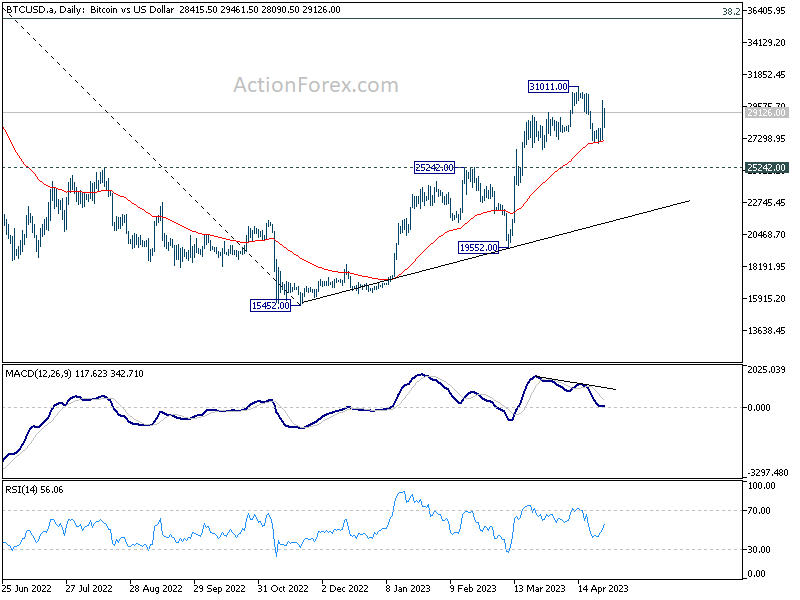
Technically, Bitcoin appears to have found support at 55 D EMA and rebounded notably yesterday. This development keeps near-term outlook bullish for another rise soon. Breaking 31,011 resistance level will resume the overall rally from 15,452 low. It's worth noting that the NASDAQ is also attempting to find support from 55 D EMA. If Bitcoin's rise resumes, it could signal a return to a risk-on sentiment, at least in the tech sector. This development could help NASDAQ rebound from its current level towards 12,695, bolstering overall market sentiment.
In Asia, at the time of writing, Nikkei is up 0.01%. Hong Kong HSI is down -0.15%. China Shanghai SSE is up 0.30%. Singapore Strait Times is down -0.49%. Japan 10-year JGB yield is up 0.006 at 0.464. Overnight, DOW dropped -0.68%. S&P 500 dropped -0.38%. NASDAQ rose 0.47%. 10-year yield rose 0.036 to 3.432.
AUD/JPY a top loser as Aussie suffers triple blow
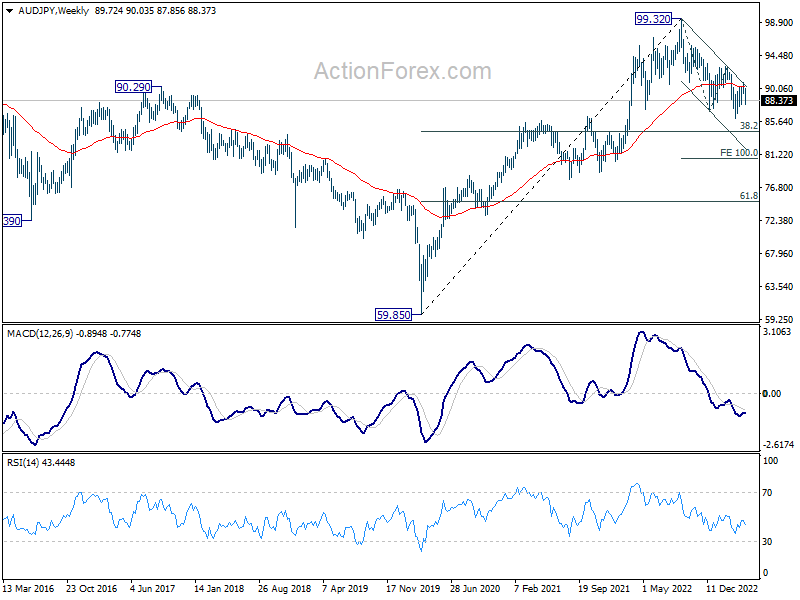
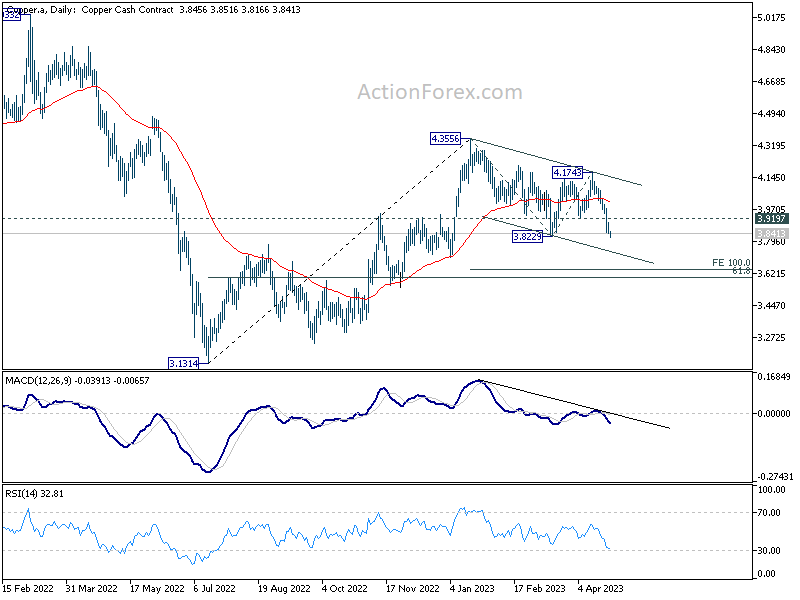
Australian Dollar continues to trade as the worst performer for the week, suffering triple blow including risk aversion, free fall in copper price and RBA speculations. Copper's selloff accelerated this week and broke to new low in 2023 today. There are increasing doubts on whether RBA will raise interest rate next week or opt for the second pause in a row after yesterday's CPI data.
AUD/JPY is currently the second biggest mover for the week, just next to EUR/AUD. Current development indicates that corrective recovery from 86.04 has concluded with three waves up to 80.76, after being rejected by channel resistance. This implies that the larger downtrend from 99.32 (2022 high) is ongoing and may be ready to resume.
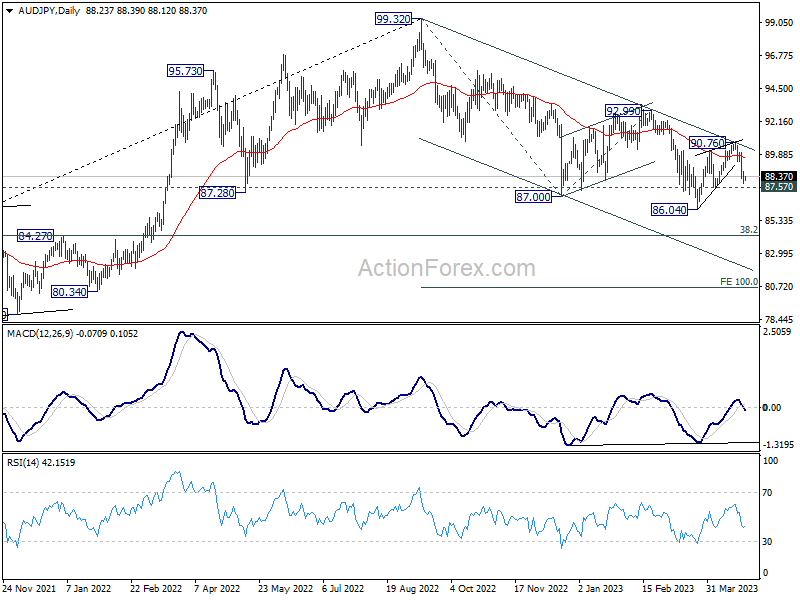
Immediate focus is now on 87.57 support. Firm break there will confirm this bearish case, and target 38.2% retracement of 59.85 to 99.32 at 84.24. Firm break there could prompt downside acceleration to 100% projection of 99.32 to 87.00 from 92.99 at 80.67. But of course, the whole development would also depend on any surprise from BoJ on Friday.
As for Copper, with breach of 3.8229 support, whole decline from 4.3556 is likely resuming. There is risk of more downside acceleration if it cannot recovery back above 3.9197 support turned resistance soon. Next target would be 100% projection of 4.3555 to 3.8229 from 4.1743 at 3.6416, which is close to 61.8% retracement of 3.1314 to 4.3556 at 3.5990, that is, around 3.6 handle. If this extended selloff in copper materializes, it could put additional pressure on Aussie.
NZ ANZ business confidence dropped slightly, inflation expectation lowest since Mar 2022
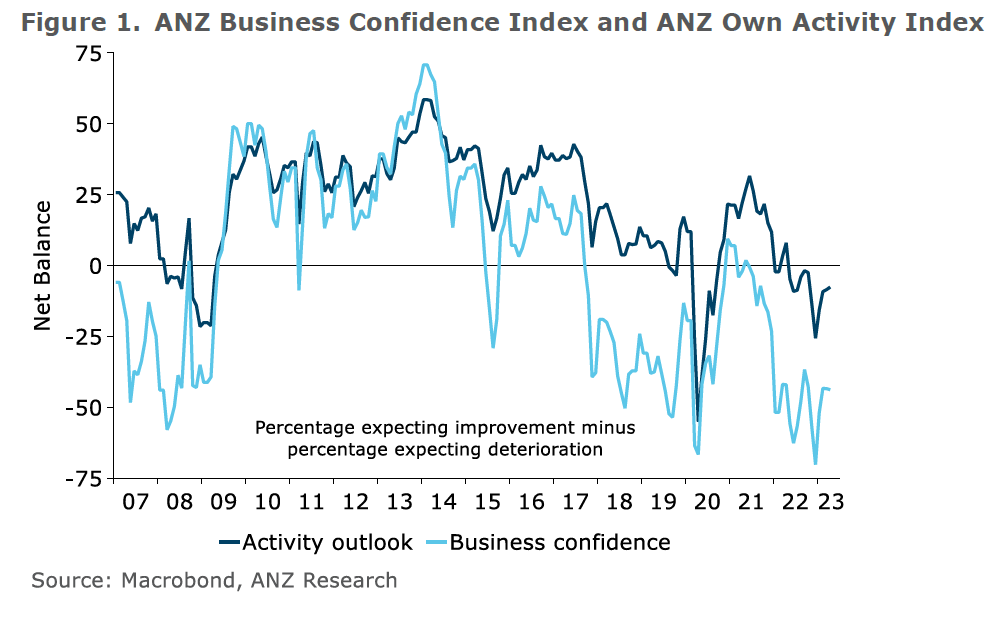
New Zealand ANZ Business Confidence index decrease slightly in April, dipping from -43.4 to -43.8. On the other hand, Own Activity Outlook improved from -8.5 to -7.6. A closer look at the details reveals that export intentions jumped from -8.9 to -1.5, while investment intentions remained unchanged at -6.8. Employment intentions rose from -4.6 to -2.4, and pricing intentions fell from 56.8 to 53.7. Cost expectations dropped from 86.4 to 84.2, and profit expectations declined from -33.9 to -37.7.
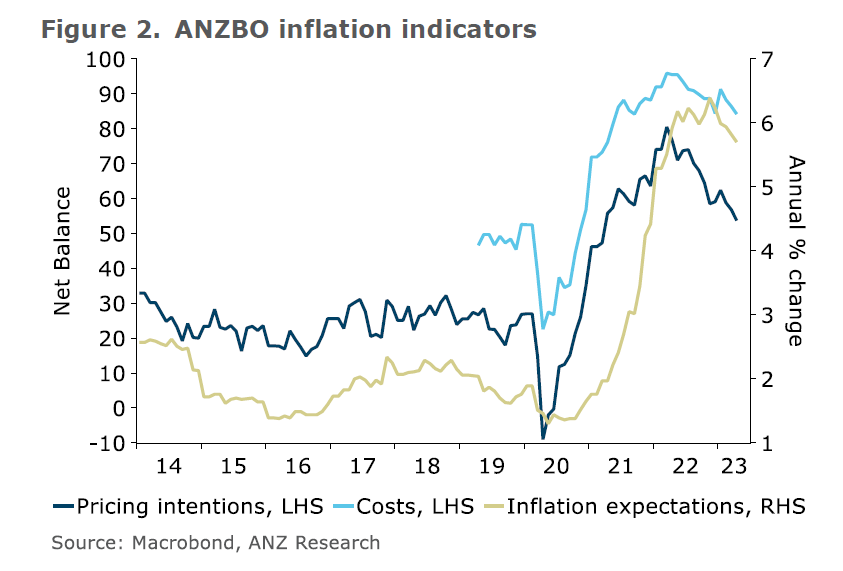
Inflation expectations decreased from 5.82 to 5.70, reaching the lowest level since March 2022. ANZ observed that the overall decline in inflation signals is consistent with RBNZ gradually gaining traction. However, the situation is far from resolved, as the proportion of firms experiencing high costs and intending to raise prices remains "problematically high".
ANZ added: "The RBNZ will be encouraged to see the ongoing fall in the inflation indicators in the survey. While there's still a way to go, inflation is set to continue easing over the year ahead, as they and we are forecasting.
"It's important to note that the data does not represent a 'surprise' for the RBNZ; rather, it's what they will be expecting to see if their forecasts are to come to fruition, with the OCR able to top out shortly.
"There are risks on both sides: inflation could get "stuck" north of the target band, or global markets could deliver a side-swipe, for example. But the overall message from this month's survey is "on track."
Looking ahead:
Eurozone economic sentiment indictor is the main feature in European session. US Q1 GDP advance will take center stage later in the day, with jobless claims and pending home sales scheduled too.
EUR/CHF Daily Outlook
Daily Pivots: (S1) 0.9798; (P) 0.9821; (R1) 0.9864; More...
Immediate focus is now on 0.9846 in EUR/CHF as rebound from 0.9774 extends. Decisive break there will argue that pull back from 0.9995 has completed. More importantly, that would revive the case that whole correction from 1.0095 has completed at 0.9704. Intraday bias will be back on the upside for 55 D EMA (now at 0.9876). Sustained trading above there will pave the way back to 0.9995 resistance next. Nevertheless, break of 0.9774 will resume recent decline to 0.9704 support and below.
In the bigger picture, prior rejection by 55 W EMA (now at 0.9989) and 38.2% retracement of 1.1149 to 0.9407 at 1.0072 suggests that medium term outlook is staying bearish. That is, down trend from 1.2004 is not completed yet and is in favor to resume through 0.9407 at a later stage. However, decisive break of 1.0095 resistance will raise the chance of bullish trend reversal. Rise from 0.9407 should then target 1.0505 cluster resistance (2020 low at 1.0505, 61.8% retracement of 1.1149 to 0.9407 at 1.1484).
Economic Indicators Update
| GMT | Ccy | Events | Actual | Forecast | Previous | Revised |
|---|---|---|---|---|---|---|
| 01:00 | NZD | ANZ Business Confidence Apr | -43.8 | -43.4 | ||
| 01:30 | AUD | Import Price Index Q/Q Q1 | -4.20% | 0.60% | 1.80% | |
| 09:00 | EUR | Eurozone Economic Sentiment Indicator Apr | 99.9 | 99.3 | ||
| 09:00 | EUR | Eurozone Services Sentiment Apr | 9.5 | 9.4 | ||
| 09:00 | EUR | Eurozone Industrial Confidence Apr | 0.2 | -0.2 | ||
| 09:00 | EUR | Eurozone Consumer Confidence Apr F | -17.5 | -17.5 | ||
| 12:30 | USD | Initial Jobless Claims (Apr 21) | 245K | 245K | ||
| 12:30 | USD | GDP Annualized Q1 P | 2.00% | 2.60% | ||
| 12:30 | USD | GDP Price Index Q1 P | 3.70% | 3.90% | ||
| 14:00 | USD | Pending Home Sales M/M Mar | 1.00% | 0.80% | ||
| 14:30 | USD | Natural Gas Storage | 76B | 75B |
AUD/JPY a top loser as Aussie suffers triple blow
Australian Dollar continues to trade as the worst performer for the week, suffering triple blow including risk aversion, free fall in copper price and RBA speculations. Copper's selloff accelerated this week and broke to new low in 2023 today. There are increasing doubts on whether RBA will raise interest rate next week or opt for the second pause in a row after yesterday's CPI data.
AUD/JPY is currently the second biggest mover for the week, just next to EUR/AUD. Current development indicates that corrective recovery from 86.04 has concluded with three waves up to 80.76, after being rejected by channel resistance. This implies that the larger downtrend from 99.32 (2022 high) is ongoing and may be ready to resume.
Immediate focus is now on 87.57 support. Firm break there will confirm this bearish case, and target 38.2% retracement of 59.85 to 99.32 at 84.24. Firm break there could prompt downside acceleration to 100% projection of 99.32 to 87.00 from 92.99 at 80.67. But of course, the whole development would also depend on any surprise from BoJ on Friday.
As for Copper, with breach of 3.8229 support, whole decline from 4.3556 is likely resuming. There is risk of more downside acceleration if it cannot recovery back above 3.9197 support turned resistance soon. Next target would be 100% projection of 4.3555 to 3.8229 from 4.1743 at 3.6416, which is close to 61.8% retracement of 3.1314 to 4.3556 at 3.5990, that is, around 3.6 handle. If this extended selloff in copper materializes, it could put additional pressure on Aussie.
NZ ANZ business confidence dropped slightly, inflation expectation lowest since Mar 2022
New Zealand ANZ Business Confidence index decrease slightly in April, dipping from -43.4 to -43.8. On the other hand, Own Activity Outlook improved from -8.5 to -7.6. A closer look at the details reveals that export intentions jumped from -8.9 to -1.5, while investment intentions remained unchanged at -6.8. Employment intentions rose from -4.6 to -2.4, and pricing intentions fell from 56.8 to 53.7. Cost expectations dropped from 86.4 to 84.2, and profit expectations declined from -33.9 to -37.7.
Inflation expectations decreased from 5.82 to 5.70, reaching the lowest level since March 2022. ANZ observed that the overall decline in inflation signals is consistent with RBNZ gradually gaining traction. However, the situation is far from resolved, as the proportion of firms experiencing high costs and intending to raise prices remains "problematically high".
ANZ added: "The RBNZ will be encouraged to see the ongoing fall in the inflation indicators in the survey. While there's still a way to go, inflation is set to continue easing over the year ahead, as they and we are forecasting.
"It's important to note that the data does not represent a 'surprise' for the RBNZ; rather, it's what they will be expecting to see if their forecasts are to come to fruition, with the OCR able to top out shortly.
"There are risks on both sides: inflation could get "stuck" north of the target band, or global markets could deliver a side-swipe, for example. But the overall message from this month's survey is "on track."
AUD/USD Turns Red Below 0.6650, US GDP Next
Key Highlights
- AUD/USD gained bearish momentum below 0.6700.
- It traded below a major contracting triangle with support near 0.6675 on the 4-hour chart.
- EUR/USD climbed higher and traded to a new monthly high.
- The US Gross Domestic Product could grow 2% in Q1 2023 (Preliminary).
AUD/USD Technical Analysis
The Aussie Dollar started a major decline from well above 0.6700 against the US Dollar. AUD/USD traded below the 0.6680 support to move into a bearish zone.
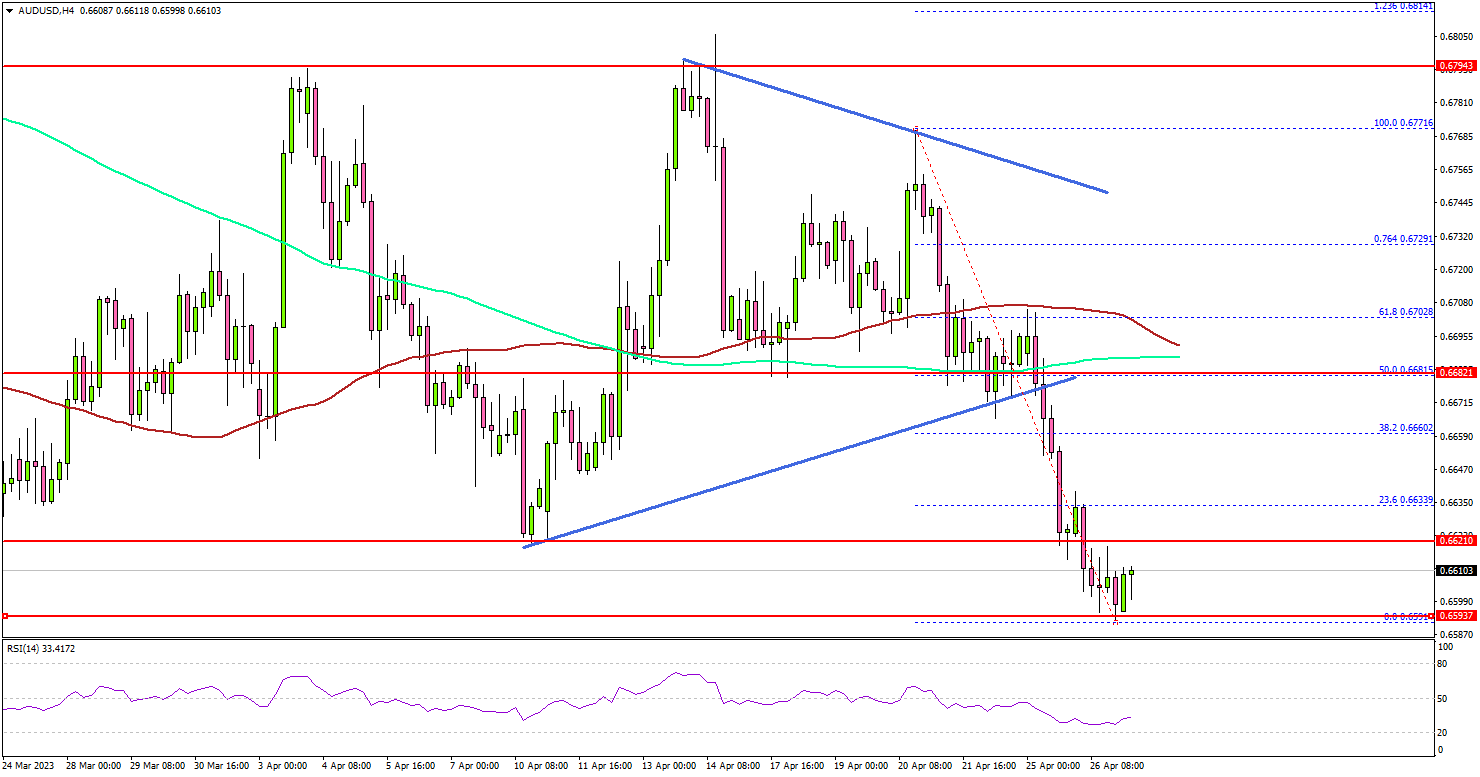
Looking at the 4-hour chart, the pair traded below a major contracting triangle with support near 0.6675. It opened the doors for more losses below 0.6660, the 100 simple moving average (red, 4 hours), and the 200 simple moving average (green, 4 hours).
It tested the 0.6600 support zone and started a consolidation phase. Immediate resistance on the upside is near the 0.6625 level.
The first major resistance is near the 0.6640 level. The main hurdle is now forming near the 0.6680 level and the 100 simple moving average (red, 4 hours). A clear upside break and close above the 0.6680 resistance might send the pair toward 0.6740.
The next key resistance is near the 0.6760 zone. Any more gains might send the pair toward 0.6800. On the downside, there is major support near 0.6580.
The next major support sits near the 0.6550 level, below which the pair might accelerate lower. In the stated case, AUD/USD could visit the 0.6500 support zone.
Looking at EUR/USD, the pair started a fresh increase above the 1.105 level and even spiked to a new monthly high.
Economic Releases
- US Gross Domestic Product Q1 2023 (Preliminary) – Forecast 2% versus previous 2.6%.
- US Initial Jobless Claims - Forecast 248K, versus 245K previous.
AUDJPY Resumes Lower in 7th Swing of Elliott Wave Double Three
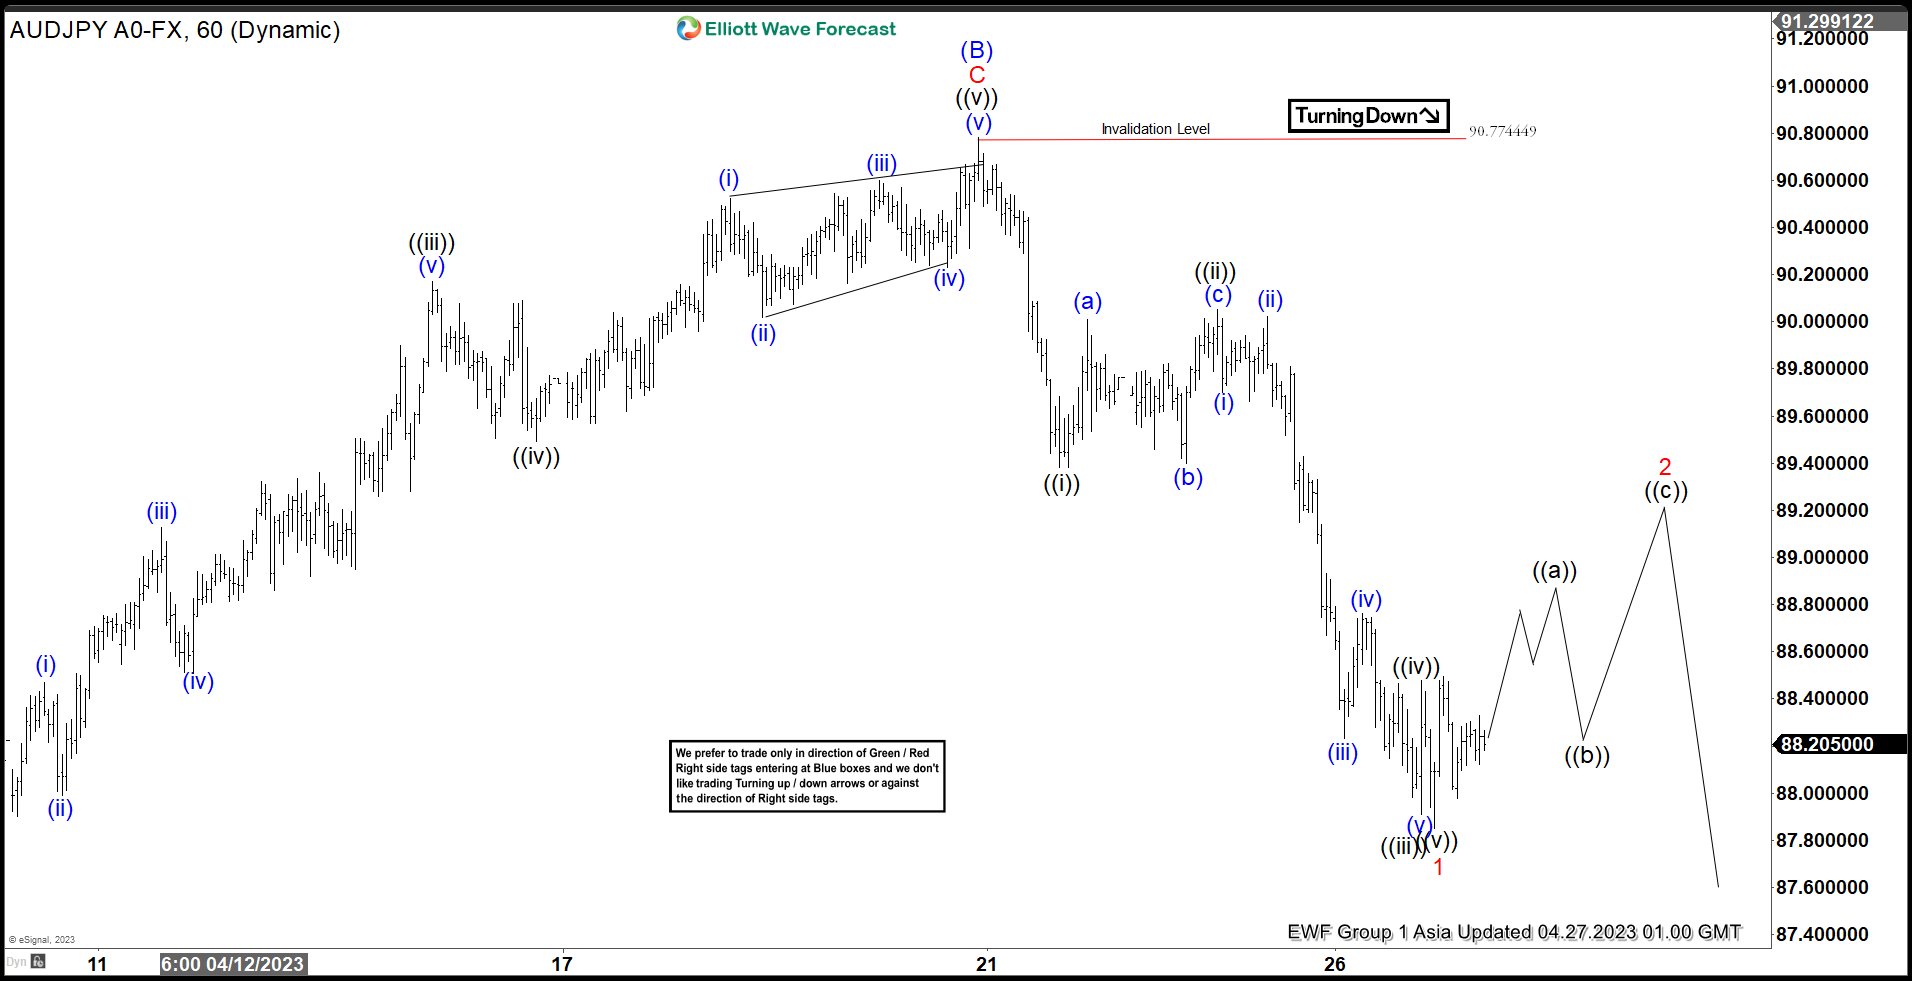
The decline from 9.13.2022 high in $AUDJPY shows a 5 swing Elliott wave sequence suggesting further downside is likely. Near term, rally from 3.24.2023 low ended in 3 swing at 90.77. We labelled the rally as wave (B) as 1 hour chart below shows. Internal subdivision of the rally from 3.24.2023 low unfolded as a zigzag. Up from there, wave A ended at 90.168 and pullback in wave B ended at 87.59. Wave C higher ended at 90.77 which completed wave (B).
Wave (C) lower is now in progress with internal subdivision as a 5 waves. Down from wave (B), wave ((i)) ended at 89.38 and rally in wave ((ii)) ended at 90.05. Down from there, wave (i) ended at 89.7 and rally in wave (ii) ended at 90.02. Pair resumes lower in wave (iii) towards 88.23, and rally in wave (iv) ended at 88.76. Final leg wave (v) ended at 87.91 which completed wave ((iii)). Wave ((iv)) rally ended at 88.478. Final leg wave ((v)) ended at 87.85 which completed wave 1. Wave 2 rally is now in progress to correct cycle from 4.20.2023 high in 3, 7, or 11 swing before the decline resumes. Near term, as far as pivot at 90.77 high stays intact, expect rally to fail in 3, 7, 11 swing for further downside.
AUDJPY 60 Minute Elliott Wave Chart
AUDJPY Elliott Wave Video
https://www.youtube.com/watch?v=QVF-MkIWgIE
EUR/USD: Bulls Return to Play and Hit New 2023 High
The Euro was sharply up on Wednesday, advancing over 1% until early US session, on weaker dollar and better than expected German economic data, which so far offset fragile risk sentiment on renewed concerns about the US banking sector, after shares of troubled First Republic Bank extended sharp fall into second consecutive day.
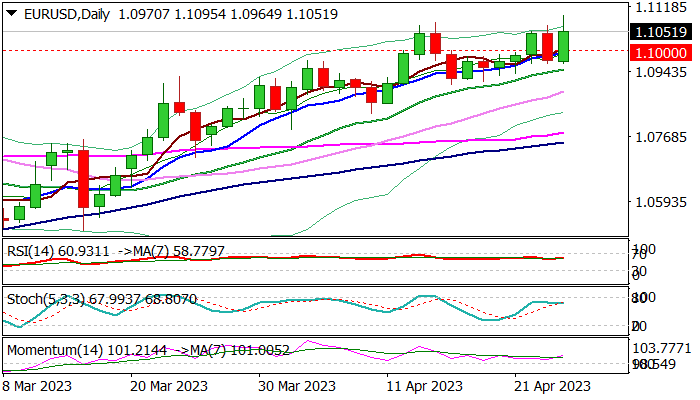
Fresh rally returned above 1.10 level and hit new 2023 high today (1.1095), reversing a negative signal from Tuesday’s bearish engulfing, into bullish signal, as bulls fully reversed previous day’s nearly 0.7% drop and on track to form bullish engulfing candlestick pattern today.
Bullish technical studies contribute to brightening near-term outlook, though sustained break above former top at 1.1075 (Apr 14) is needed to signal bullish continuation.
Dips on partial profit-taking after today’s strong bullish acceleration, should stay above psychological 1.10 support (reinforced by rising daily Tenkan-sen) to keep bulls in play.
Break of 1.1075/95 tops would open way for extension of the second leg of larger uptrend from 0.9535 (2022 low) and expose targets at 1.1184 (31 Mar 2022 top) and 1.1223 (Fibo 61.8% of 1.2266/0.9535 downtrend.
Res: 1.1075; 1.1095; 1.1184; 1.1223
Sup: 1.1000; 1.0964; 1.0950; 1.0909