Sample Category Title
USD/JPY Mid-Day Outlook
Daily Pivots: (S1) 133.13; (P) 133.55; (R1) 134.07; More...
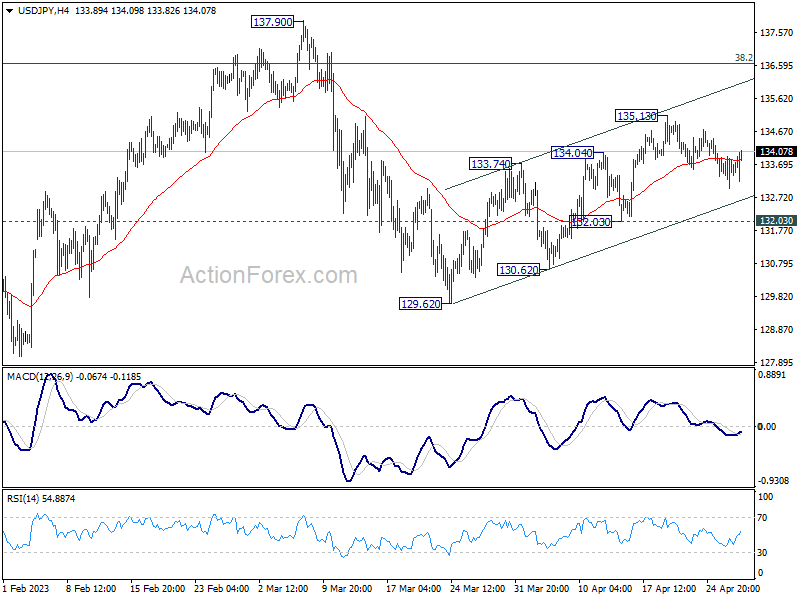
USD/JPY is still bounded in consolidation from 135.13 and intraday bias remains neutral for the moment. Further rally is expected as long as 132.03 support holds. On the upside, break of 135.13 will resume the choppy rebound from 129.62 towards 137.90 resistance next. However, break of 132.03 will argue that the rebound has completed already and turn bias back to the downside for 129.62 and below.
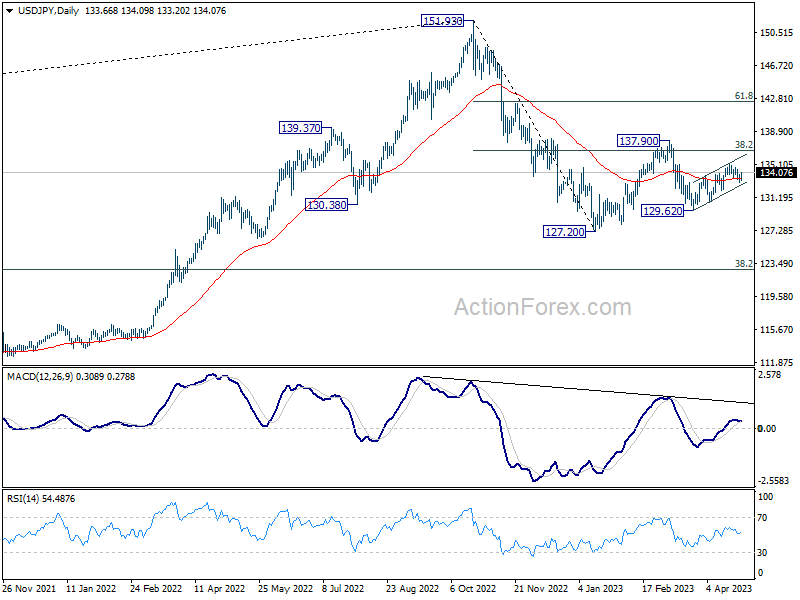
In the bigger picture, corrective pattern from 127.20 might be extending. But after all, down trend from 151.93 is expected to resume at a later stage. Break of 127.20 will resume this down trend and target 61.8% projection of 151.93 to 127.20 from 137.90 at 122.61. This will now be the favored case as long as 137.90 resistance holds.
USD/CHF Mid-Day Outlook
Daily Pivots: (S1) 0.8869; (P) 0.8897; (R1) 0.8943; More...
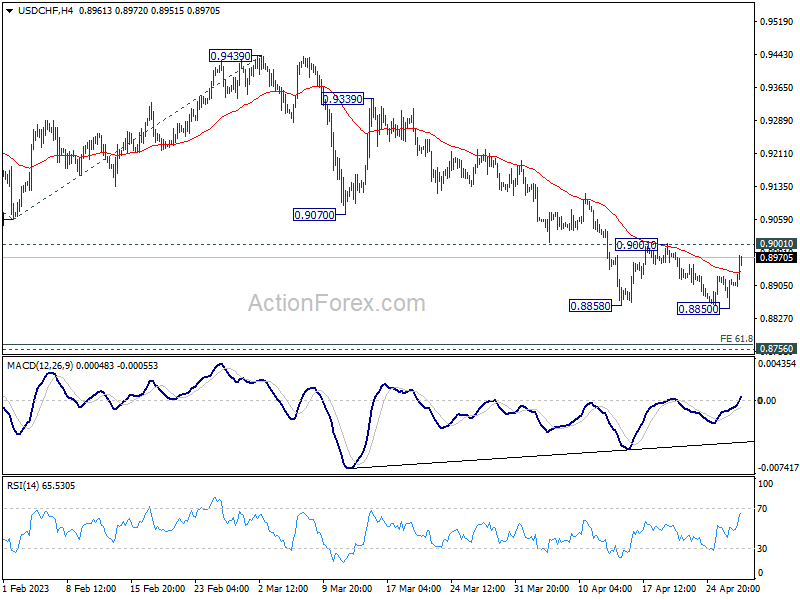
Intraday bias in USD/CHF remains neutral for the moment. On the upside, decisive break of 0.9001 resistance should confirm short term bottoming at 0.8850. Intraday bias will be back on the upside 55 D EMA (now at 0.9120). Sustained break there will be a strong sign of bullish reversal. On the downside, break of 0.8850 will resume larger fall from 1.0146, to 61.8% projection of 1.0146 to 0.9058 from 0.9439 at 0.8767, which is close to 0.8756 long term support. Strong support is expected there to bring rebound, at least on first attempt.
In the bigger picture, fall from 1.1046 (2022 high) is in progress for 0.8756 support (2021 low). But overall, this fall is still seen as a leg in the long term range pattern from 1.0342 (2016 high). So, downside should be contained by 0.8756 to bring reversal. Sustained break of 0.9058 support turned resistance will be the first sign of medium term bottoming. However, decisive break of 0.8756 will carry larger bearish implications.
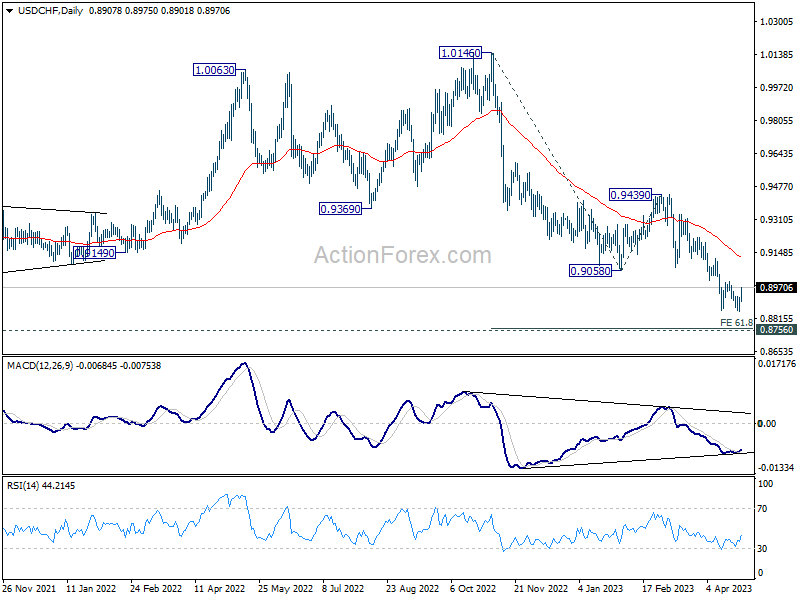
Dollar Recovers Shrugging GDP Miss, Swiss Franc Reversing
Dollar shrugs off worse than expected Q1 GDP data and recovers against European majors in early US session. But momentum is so far weak except versus Swiss Franc, which happens to be the worst performer for the day. Australian Dollar and other commodity currencies turned into consolidation, digesting this week's losses. Meanwhile, Euro and Sterling are losing much momentum for now, and turned mixed. Yen is also engaging in range trading, awaiting tomorrow's first BoJ announcement by new governor Kazuo Ueda.
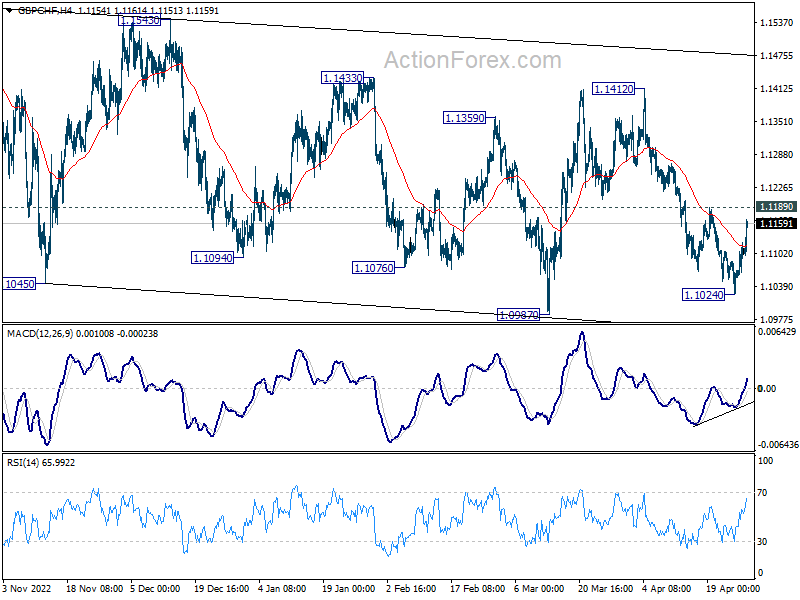
Technically, EUR/CHF's break of 0.9846 resistance argues that near term pull back form 0.9995 has completed at 0.9774 already. Stronger rally is now in favor back towards 0.9995. One focus is now on USD/CHF, as firm break of 0.9001 should confirm short term bottoming, and bring stronger rebound. Another focus is 1.1189 resistance in GBP/CHF. Firm break there will indicate that fall from 1.1412 has completed at 1.1412. The sideway pattern from 1.1574 (Oct high) should have then started another rising leg.
In Europe, at the time of writing, FTSE is up 0.04%. DAX is up 0.28%. CAC is up 0.45%. Germany 10-year yield is up 0.0288 at 2.430. Earlier in Asia, Nikkei rose 0.15%. Hong Kong HSI rose 0.42%. China Shanghai SSE rose 0.67%. Singapore Strait Times dropped -0.36%. Japan 10-year JGB yield dropped -0.0027 to 0.460.
US GDP grew only 1.1% annualized in Q1, well below expectations
US GDP growth for Q1 2023 came in at a mere 1.1% annualized, significantly below the expected 2.0%.
The increase in real GDP can be attributed to rises in consumer spending, exports, federal government spending, state and local government spending, and nonresidential fixed investment.
However, these increases were partially offset by declines in private inventory investment and residential fixed investment. Meanwhile, imports, which are subtracted when calculating GDP, also increased.
Price index for gross domestic purchases rose by 3.8% in Q1, compared to the 3.6% increase recorded in Q4. Personal Consumption Expenditures price index saw a 4.2% increase, up from the previous quarter's 3.7% increase. Excluding food and energy prices, PCE price index climbed by 4.9%, compared to 4.4% increase in the previous quarter.
US initial jobless claims down -16k to 230k
US initial jobless claims dropped -16k to 230k in the week ending April 22, better than expectation of 245k. Four-week moving average of initial claims dropped -4k to 236k.
Continuing claims dropped -3k to 1858k in the wee ending April 15. Four-week moving average of continuing claims rose 10k to 1837k, highest since December 18, 2021.
Eurozone economic sentiment up slightly to 99.3, third month of sideways movement
Eurozone Economic Sentiment Indicator ticked up from 99.2 to 99.3 in April, below expectation of 99.9. This is the third month of a general sideways movement of the indicator. Industry confidence dropped from -0.5 to -2.6. Services confidence rose from 9.6 to 10.5. Consumer confidence rose from -19.1 to -17.5. Retail trade confidence rose from -1.5 to -1.0. Construction confidence was unchanged at 1.0. Employment Expectation Indicator dropped from 108.9 to 107.4. Economic Uncertainty Indicator dropped from 22.4 to 22.2.
EU ESI was unchanged at 97.3. Employment Expectation Indicator dropped from 107.5 to 106.1. Economic Uncertainty Indicator dropped from 22.1 to 21.8. Amongst the largest EU economies, the ESI improved in Spain (+3.7) and, to a lesser extent, in Poland (+1.1) and Germany (+0.8). While sentiment edged up also in Italy (+0.3), it deteriorated in the Netherlands (-1.6) and, particularly, in France (-4.2).
NZ ANZ business confidence dropped slightly, inflation expectation lowest since Mar 2022
New Zealand ANZ Business Confidence index decrease slightly in April, dipping from -43.4 to -43.8. On the other hand, Own Activity Outlook improved from -8.5 to -7.6. A closer look at the details reveals that export intentions jumped from -8.9 to -1.5, while investment intentions remained unchanged at -6.8. Employment intentions rose from -4.6 to -2.4, and pricing intentions fell from 56.8 to 53.7. Cost expectations dropped from 86.4 to 84.2, and profit expectations declined from -33.9 to -37.7.
Inflation expectations decreased from 5.82 to 5.70, reaching the lowest level since March 2022. ANZ observed that the overall decline in inflation signals is consistent with RBNZ gradually gaining traction. However, the situation is far from resolved, as the proportion of firms experiencing high costs and intending to raise prices remains "problematically high".
ANZ added: "The RBNZ will be encouraged to see the ongoing fall in the inflation indicators in the survey. While there's still a way to go, inflation is set to continue easing over the year ahead, as they and we are forecasting.
"It's important to note that the data does not represent a 'surprise' for the RBNZ; rather, it's what they will be expecting to see if their forecasts are to come to fruition, with the OCR able to top out shortly.
"There are risks on both sides: inflation could get "stuck" north of the target band, or global markets could deliver a side-swipe, for example. But the overall message from this month's survey is "on track."
USD/CHF Mid-Day Outlook
Daily Pivots: (S1) 0.8869; (P) 0.8897; (R1) 0.8943; More...
Intraday bias in USD/CHF remains neutral for the moment. On the upside, decisive break of 0.9001 resistance should confirm short term bottoming at 0.8850. Intraday bias will be back on the upside 55 D EMA (now at 0.9120). Sustained break there will be a strong sign of bullish reversal. On the downside, break of 0.8850 will resume larger fall from 1.0146, to 61.8% projection of 1.0146 to 0.9058 from 0.9439 at 0.8767, which is close to 0.8756 long term support. Strong support is expected there to bring rebound, at least on first attempt.
In the bigger picture, fall from 1.1046 (2022 high) is in progress for 0.8756 support (2021 low). But overall, this fall is still seen as a leg in the long term range pattern from 1.0342 (2016 high). So, downside should be contained by 0.8756 to bring reversal. Sustained break of 0.9058 support turned resistance will be the first sign of medium term bottoming. However, decisive break of 0.8756 will carry larger bearish implications.
Economic Indicators Update
| GMT | Ccy | Events | Actual | Forecast | Previous | Revised |
|---|---|---|---|---|---|---|
| 01:00 | NZD | ANZ Business Confidence Apr | -43.8 | -43.4 | ||
| 01:30 | AUD | Import Price Index Q/Q Q1 | -4.20% | 0.60% | 1.80% | |
| 09:00 | EUR | Eurozone Economic Sentiment Indicator Apr | 99.3 | 99.9 | 99.3 | 99.2 |
| 09:00 | EUR | Eurozone Services Sentiment Apr | 10.5 | 9.5 | 9.4 | 9.6 |
| 09:00 | EUR | Eurozone Industrial Confidence Apr | -2.6 | 0.2 | -0.2 | -0.5 |
| 09:00 | EUR | Eurozone Consumer Confidence Apr F | -17.5 | -17.5 | -19.1 | |
| 12:30 | USD | Initial Jobless Claims (Apr 21) | 230K | 245K | 245K | 246K |
| 12:30 | USD | GDP Annualized Q1 P | 1.10% | 2.00% | 2.60% | |
| 12:30 | USD | GDP Price Index Q1 P | 4.00% | 3.70% | 3.90% | |
| 14:00 | USD | Pending Home Sales M/M Mar | 1.00% | 0.80% | ||
| 14:30 | USD | Natural Gas Storage | 76B | 75B |
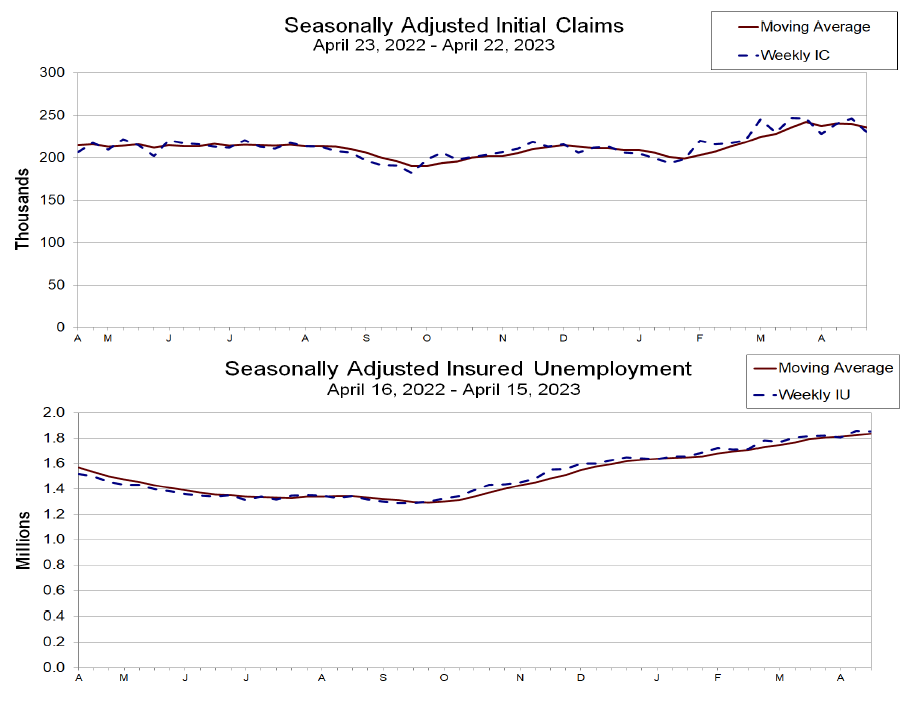
US initial jobless claims down -16k to 230k
US initial jobless claims dropped -16k to 230k in the week ending April 22, better than expectation of 245k. Four-week moving average of initial claims dropped -4k to 236k.
Continuing claims dropped -3k to 1858k in the wee ending April 15. Four-week moving average of continuing claims rose 10k to 1837k, highest since December 18, 2021.
US GDP grew only 1.1% annualized in Q1, well below expectations
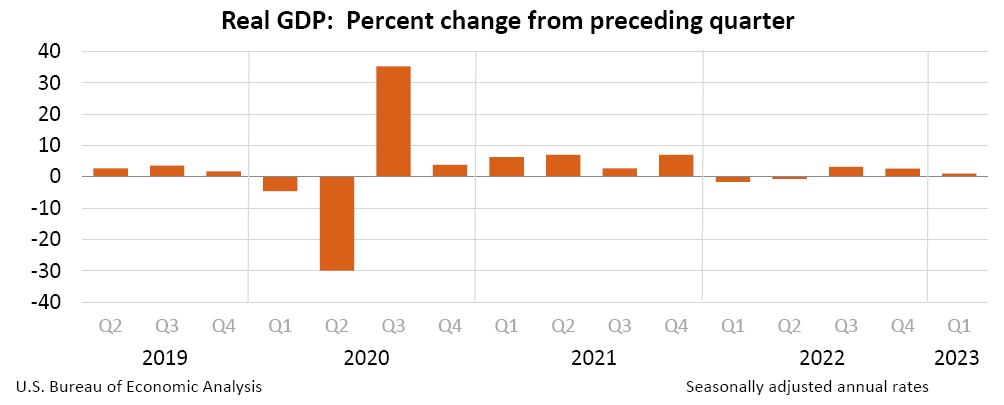
US GDP growth for Q1 2023 came in at a mere 1.1% annualized, significantly below the expected 2.0%.
The increase in real GDP can be attributed to rises in consumer spending, exports, federal government spending, state and local government spending, and nonresidential fixed investment.
However, these increases were partially offset by declines in private inventory investment and residential fixed investment. Meanwhile, imports, which are subtracted when calculating GDP, also increased.
Price index for gross domestic purchases rose by 3.8% in Q1, compared to the 3.6% increase recorded in Q4. Personal Consumption Expenditures price index saw a 4.2% increase, up from the previous quarter's 3.7% increase. Excluding food and energy prices, PCE price index climbed by 4.9%, compared to 4.4% increase in the previous quarter.
LTCUSD Analysis: Inverted Hammer Pattern Is above $84.29
Bulls were able to take control of the market last week, and after touching a low of $84.29 on 26 April, the price started to correct upwards against the US Dollar.
There is an inverted hammer pattern above the $84.29 handle on the H1 timeframe. It signifies the end of a bearish phase and the start of a bullish phase in the market.
The momentum indicator is back over zero in the H1 timeframe, indicating a bullish trend. There is also an upside gap located in the 15-minutes timeframe, which indicates the bullish nature of the market. We can see the formation of the Doji candle in the D1 timeframe, indicating the neutral tone of the market.
Also, Litecoin is trading below its 100-hour simple moving average, 200-hour exponential moving average, and pivot level of $91.57.
The relative strength index is at 53.164, indicating a neural demand for Litecoin and the shift towards the consolidation zone in the markets.
Litecoin remains above some of the moving averages, which is a bullish signal at the current market level of $88.33.
The CCI is signaling neutral market conditions, which means that the price is expected to move in a narrow range in the short term.
The short-term outlook for Litecoin has turned mildly bullish.
- Some of the technical indicators are bullish.
- Litecoin bullish reversal is seen above the $84.39 level.
- The RSI is neutral.
- The average true range indicates high market volatility.
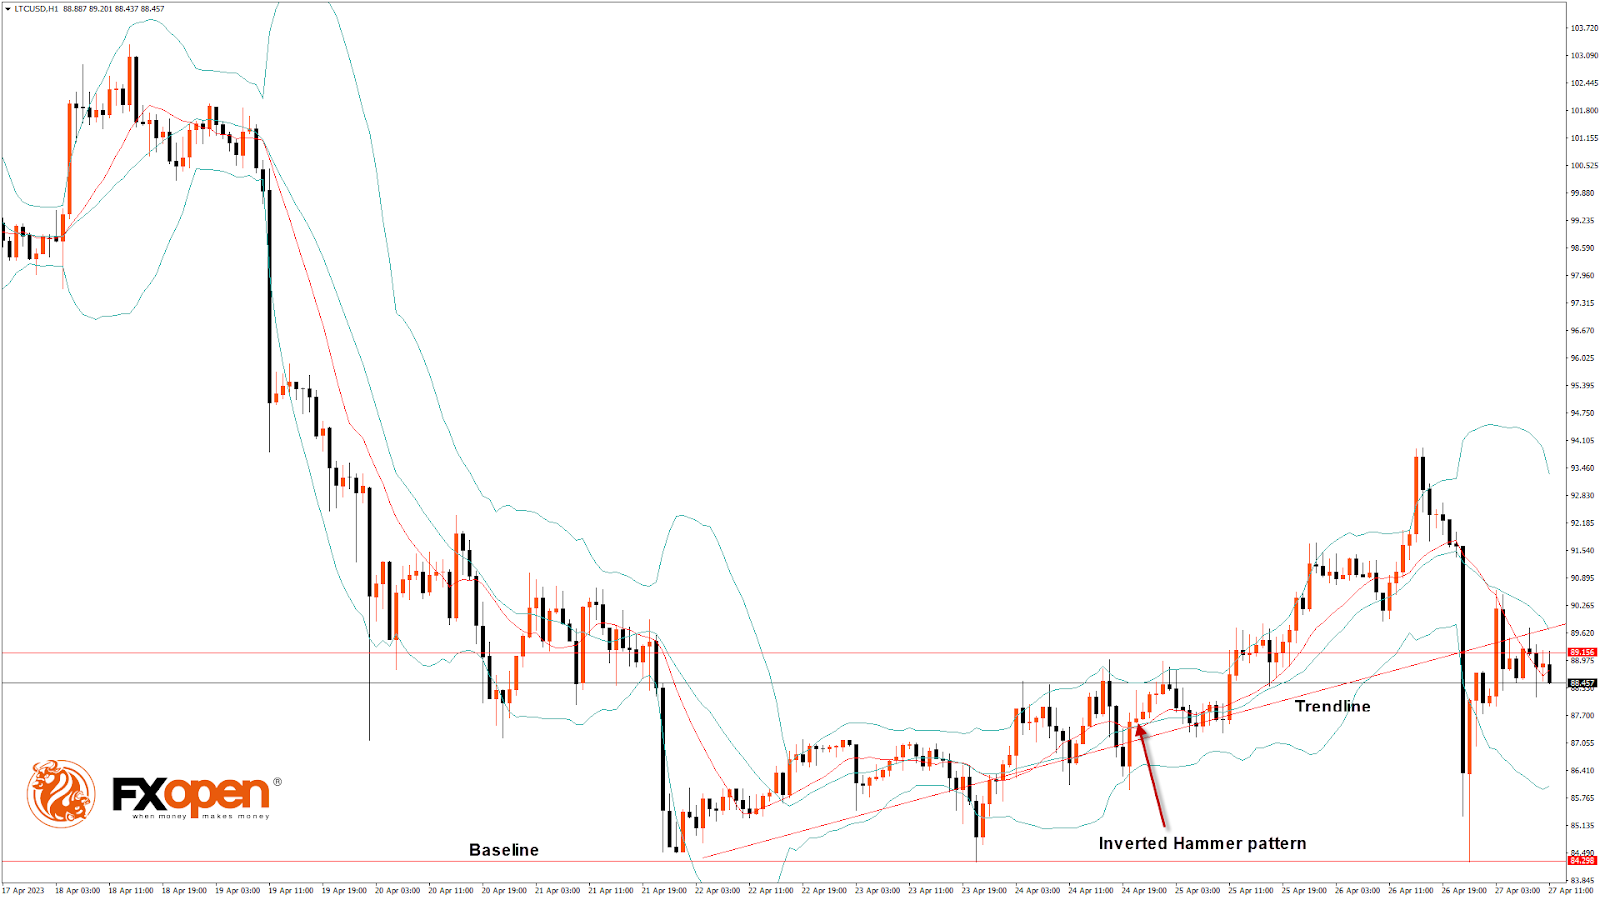
Litecoin Bullish Reversal is seen above $84.29
Litecoin continues to move in a mild bullish momentum after its recent decline below the $85.00 level.
As the prices are now moving into a narrow range, we can expect some bullish moves after the price crosses the $90.00 handle.
Some of the technical indicators are also giving a neutral tone present in the markets.
LTCUSD is about to break its classic resistance level of 89.41 and Fibonacci resistance level of 90.35, after which the path towards $95 will get cleared.
Litecoin faces resistance at $93.77, which is a 50% retracement from a 4-week High/Low, and at $96.43, at which the price crosses the 9-day moving average.
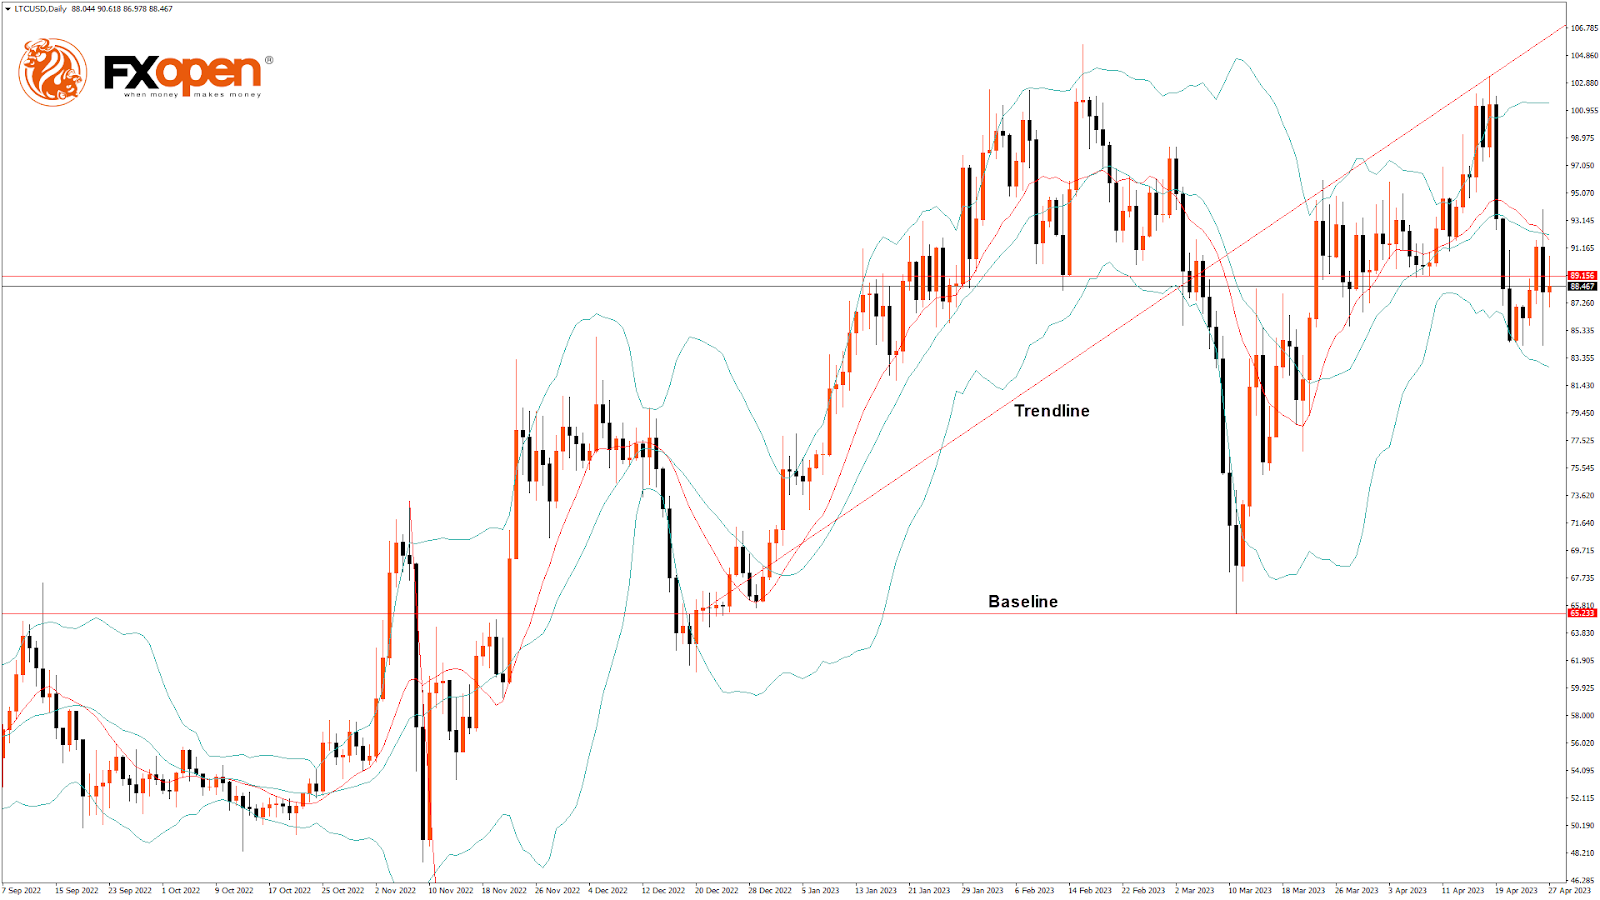
The Week Ahead
Litecoin has entered a consolidation zone, and further resistance levels are $90 and $95.
Most technical indicators are signaling bullish sentiment in the market.
Litecoin should stay above the important support level of $83.56, which is a 3-10 day MACD, and at $80.7, which is a 38.2% retracement from a 13-week low.
The short-term outlook for Litecoin has turned mildly bullish, the medium-term outlook is bullish, and the long-term outlook is neutral at present market conditions.
The weekly projection is $95, with a consolidation zone of $92.
ETHUSD Analysis: The Morning Star Pattern above $1,786
Bulls were able to take control of the market, and after touching a low of $1,786 on 26 April, the ETH/USD pair is showing bullish momentum, touching a high of $1,938 today in the early Asian trading session.
ETHUSD is under mild bullish pressure after its decline below the $1,800 handle due to improved investor sentiment and support seen at lower levels.
The morning star pattern is above the $1,786 handle on the H1 timeframe. It's a bullish pattern, which signifies the end of a bearish phase.
The price is above the Ichimoku cloud in the 15-minutes timeframe.
ETH is back above the pivot point, indicating the bullish pressure in the market.
The relative strength index is at 57.13, indicating a strong demand for Ether and a continuation of the buying pressure in the market.
The STOCHRSI is giving neutral, meaning that the price is expected to enter into a consolidation zone in the short-term range.
We also detected the formation of the bullish trend reversal pattern with the 50-period moving average in the 15-minutes timeframe.
Most of the technical indicators are bullish. Most moving averages are bullish at the current market level of $1,885.
ETH is now trading above the 200-hour simple and 200-hour exponential moving averages.
- ETH bullish reversal is seen above the $1,786 mark.
- The short-term range is expected to be mildly bullish.
- The average true range indicates high market volatility.
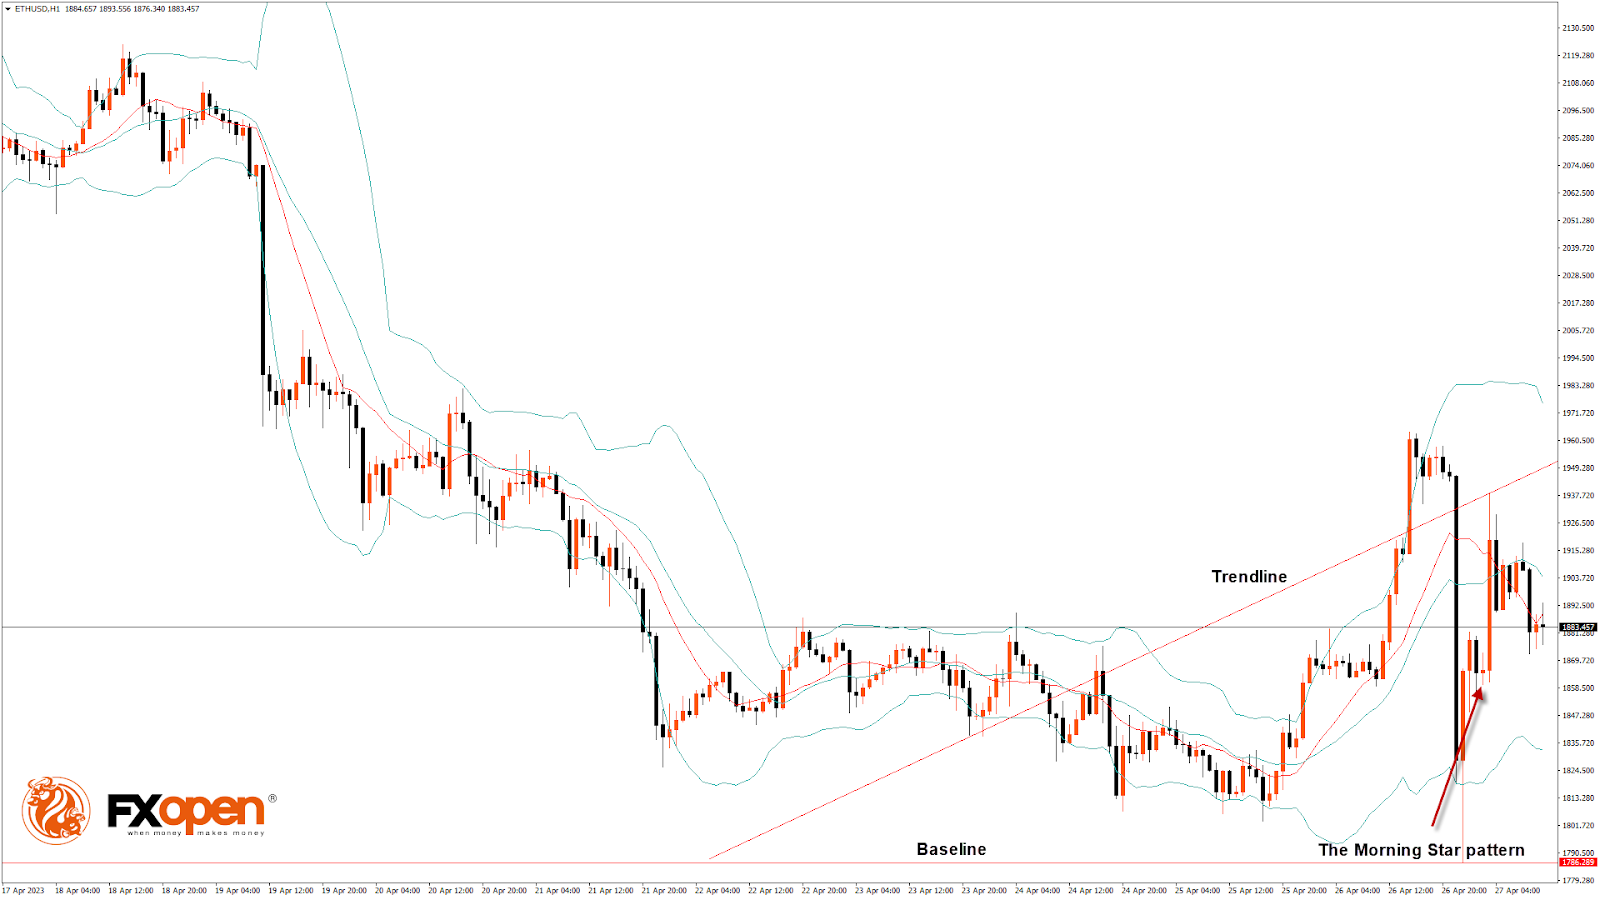
ETH Bullish Reversal Is above $1,786
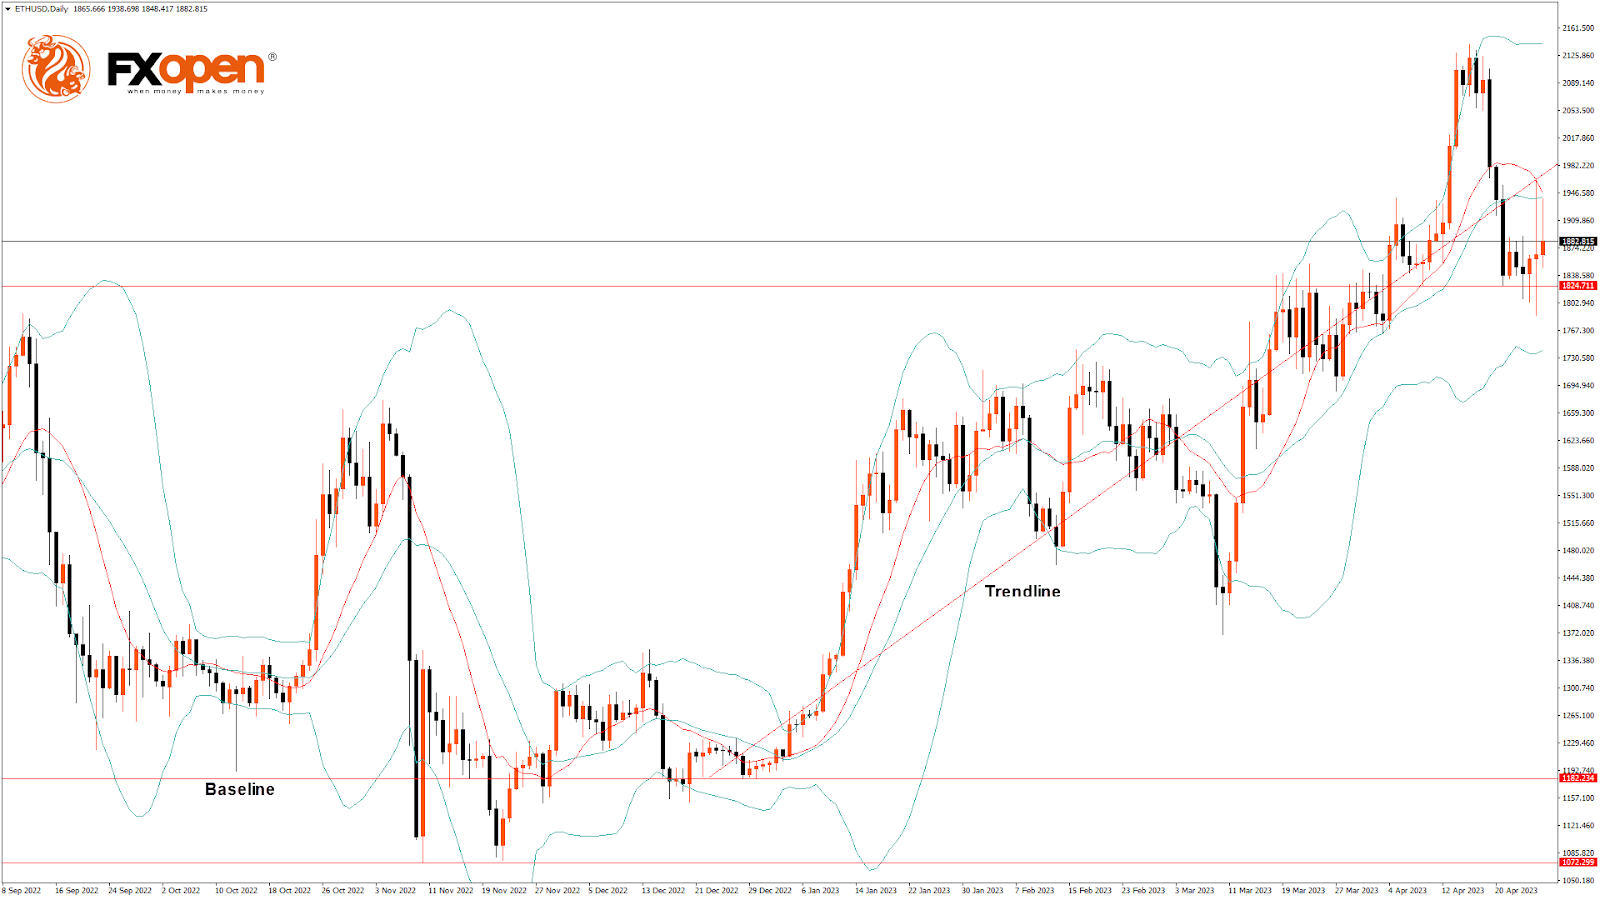
On the daily chart, ETH is trading just above its pivot level of $1,874 and is moving into a mild bullish channel. The price is about to break its classic resistance level of $1,955 and its Fibonacci resistance level of $2,044; supports are $1,808 and $1,845.
The key support levels to watch are $1,845, which is a 38.2% retracement from the 13-week high, and $1,862, which is a 14-3 daily raw stochastic at 20.
The Week Ahead
ETH continues to correct higher above $1,800, which indicates the bullish momentum, and is expected to move towards the $1,900 level in the medium-term range in the H1 timeframe.
We see a short-term bullish trend line forming from $1,786 towards the $1,954 level.
There is a minor bullish trend line with the resistance at $1,971, which is a 38.2% retracement from a 4-week high.
The immediate short-term outlook for ETH has turned mildly bullish, the medium-term outlook has turned bullish, and the long-term outlook is neutral in present market conditions.
The resistance zone is at $2,034, which is a 14-3 day raw stochastic at 70, and at $2,106, at which the price crosses the 9-day moving average.
The weekly outlook is $2,000 with a consolidation zone of $1,900.
BTCUSD Spikes Upwards after Hitting 50-day SMA
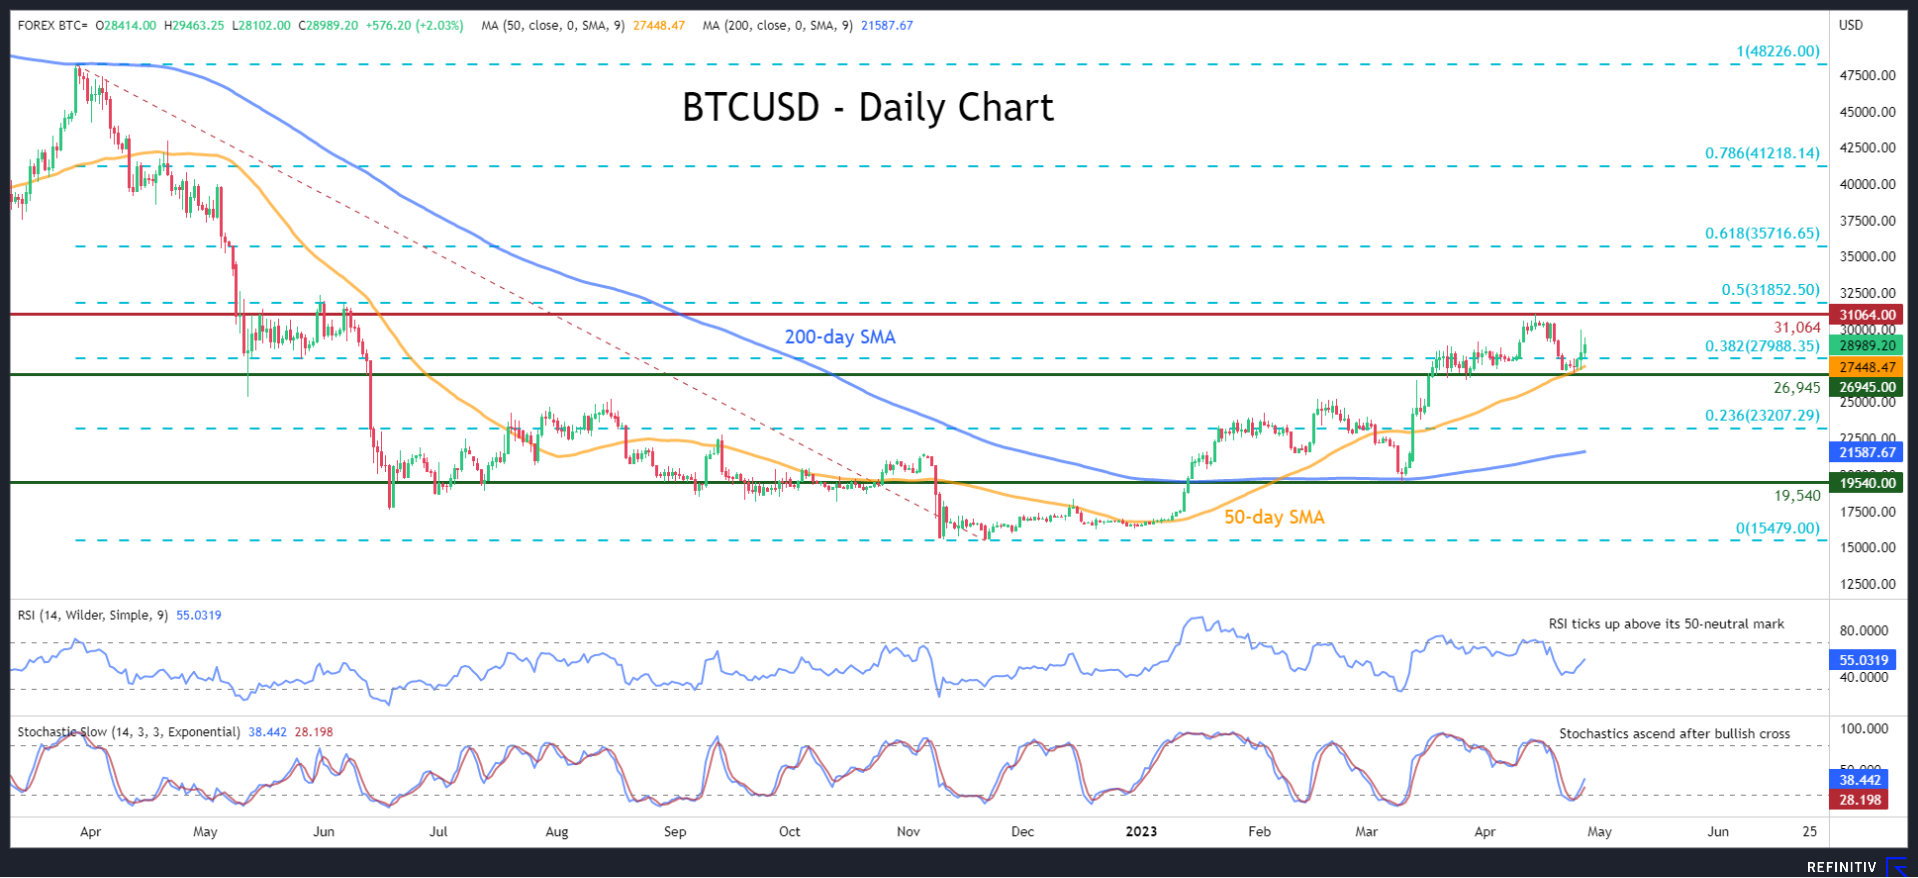
BTCUSD (Bitcoin) experienced a pullback after its 2023 surge peaked at the 10-month high of 31,064 in mid-April. However, the price has bounced back again after the 50-day simple moving average (SMA) curbed its retreat.
The momentum indicators currently suggest that buyers have re-gained the upper hand. Specifically, the RSI is pointing upwards above its 50-neutral mark, while the stochastic oscillator is ascending after posting a bullish cross in the 20-oversold zone.
Should the recent advance extend above the 30,000 psychological mark, the 10-month peak of 31,064 could be the first barrier for the bulls to clear. Surpassing that zone, the price may challenge 31,852, which is the 50.0% Fibonacci retracement of the 48,226-15,479 downtrend. A break above that zone could open the door for the 61.8% Fibo of 35,716.
Alternatively, if the price reverses lower again, the 38.2% Fibo of 27,988 might act as the first line of defence. Should that floor collapse, the bears could aim for the April low of 26,945. Failing to halt there, Bitcoin could descend towards the 23.6% Fibo of 23,207.
In brief, despite the recent downside correction from its multi-month high, Bitcoin has regained some ground after finding strong support at the 50-day SMA. For the technical picture to improve even further, the price must initially jump above the 30,000 psychological region before it posts a fresh higher high.
Bitcoin Hits the Resistance But Does Not Give Up
Market Picture
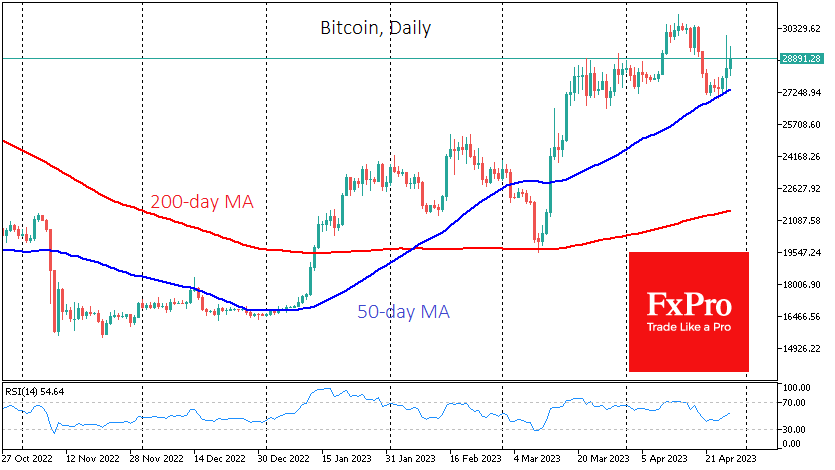
Bitcoin’s rally accelerated late Wednesday after hitting $29K but ran into strong resistance as it approached $30K (the level passed on some exchanges). The inability to break above this level triggered a massive wave of capitulation. It quickly, but not for long, pushed the price back to $27K, the price at the start of the week. By Thursday morning, buying prevailed again, returning the price to $29K.
On a broader picture, the bulls have managed to push the price above the 50-day moving average, which is pointing up from $27K on Monday to $27.4K. At the end of March, the market bought Bitcoin near this level. In other words, we have strong indications that the first cryptocurrency maintains its uptrend.
Financial news is also helping the buying. The rally comes on the heels of reports of the stock collapse of troubled First Republic Bank, which was bailed out in March. Another bout of capital preservation fears has brought attention back to crypto.
News Background
BitMEX co-founder Arthur Hayes said that with the “broken banking system”, investing in cryptocurrencies would help people protect themselves against the risk of losing money. He says, “Those who believe in traditional finance will inevitably suffer losses”.
Twitter analyst TechDev believes Bitcoin is in the early stages of a parabolic rally as the technical picture now resembles the bull market of 2015 when BTC went from less than $200 to $20,000 in two years.
Cryptocurrencies have evolved from “rebellious instruments” to a mainstream asset class, according to the UK’s Financial Conduct Authority (FCA). However, the agency expressed concern that organised crime could use crypto.
The CFTC intends to go to Congress with a proposal to remove the anonymity of crypto-assets and introduce digital identification of owners, said Commissioner Christy Goldsmith Romero.
WTI Oil: Bears to Pause for Consolidation after a Heavy Losses
Bears are taking a breather in early Thursday’s trading after a strong fall in past two days (down 5.5%), as oil prices were deflated by growing fears of US recession and strong rise in Russian oil exports, which hit the highest since 2019.
Russia increased production to meet strong rise in demand from India and China which offset the impact from the recent surprise decision of OPED+ group to further cut the output.
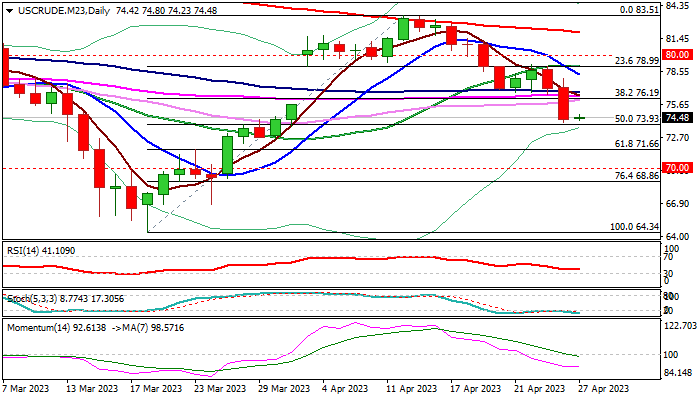
Oli price came under increased pressure after loss of pivotal supports at $80 and $79.00, with fresh acceleration lower, turning technical studies on daily chart to bearish setup and adding to negative near-term outlook.
Bears found a temporary footstep at $73.93 Fibo support (50% retracement of $64.34/$83.51 rally) and ahead of the top of thick daily cloud at $73.49, with oversold conditions suggesting a pause in the latest bear-leg from $79.15 (Apr 24 lower top).
With fundamentals remaining negative for oil, technical buying on partial profit-taking, may keep bears on hold for consolidation / mild correction.
Solid barriers at $76.19/73 (broken Fibo 38.2% / 100DMA) should ideally cap, with stronger upticks not to exceed falling 10DMA ($78.29) to keep bears in play.
Fresh bears also filled the gap of Apr 3, adding to negative signals, although firm break of $73.93 level is needed to confirm the signal and open way for attack at next targets at $71.66 (Fibo 61.8% of $64.34/$83.51) and $70.00 (psychological).
The WTI contract is also on track for the second consecutive weekly loss, which contributes to negative near-term structure.
Res: 74.80; 75.69; 76.19; 76.73.
Sup: 73.93; 73.49; 72.18; 71.66.