Sample Category Title
BoJ: Maintained Ultra-Easy Policy But Scrapped Forward Guidance
- No change on key policy short-term interest rate and limits of the Yield Curve Control programme.
- Scrapped forward guidance to maintain the interest rate at current or lower levels
- Need one and half-year to conduct a review of monetary policy guidance.
- USD/JPY and Nikkei 225 rallied; watch the 135.30 key short-term resistance on USD/JPY.
The Bank of Japan has maintained its key policy short-term policy interest rate as expected at -0.10% and kept the limits of its Yield Curve Control (YCC) program on the 10-year Japanese Government Bond (JGB) yield unchanged at 0.50% on either side of the 0% target.
Here are a couple of key highlights
BoJ removed forward guidance that pledged to keep key policy interest rates at current or lower levels and highlighted that it will need one to one and half-year to conduct a review of monetary policy guidance.
The latest BoJ quarter outlook report has indicated that the risk to inflation (price) outlook is skewed to the upside in the fiscal year 2023 but skewed to the downside later in the fiscal year 2025, inflationary expectations have moved sideways after heightening, Japan’s economy is likely to recover moderately after under pressure from past rises in raw materials.
In addition, the outlook report has mentioned that wage negotiations for the fiscal year 2023 are expected to see higher wave growth than last year, inflation (price) may deviate downward if wages do not strengthen as expected, mentioned that consumer inflation is likely to slow below 2% toward the middle of the fiscal year 2023 with Japan’s GDP output gap to turn positive around the same period.
New BoJ’s key median economic data forecasts
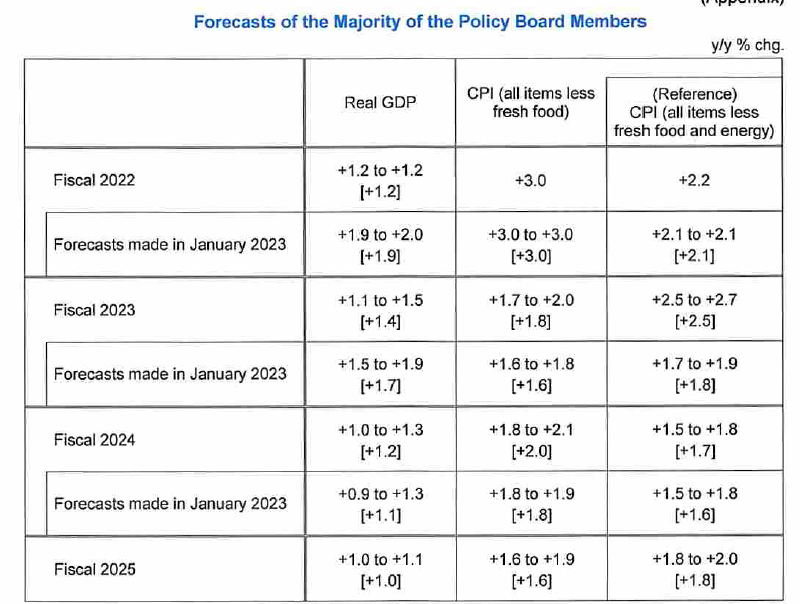
FY 2023 Core CPI at 1.8% year-on-year versus 1.6% previously
FY 2023 Core-Core CPI at 2.5% year-on-year versus 1.8% previously
FY 2024 Core CPI at 2.0 % year-on-year versus 1.8% previously
FY 2023 Core-Core CPI at 1.7% year-on-year versus 1.6% previously
FY 2023 Real GDP at 1.4% year-on-year versus 1.7% previously
FY 2024 Real GDP at 1.2% year-on-year versus 1.1% previously
In a nutshell, FY 2023 and 2024 inflation forecasts have been upgraded from the previous report while economic growth (real GDP) is being revised down for FY 203.
USD/JPY & Nikkei 225 moved higher ex-post BoJ decision
The USD/JPY has rallied by 1.2% (160 pips) from today’s current intraday low of 133.33 to print an intraday high of 134.94 at this time of the writing; still below a key pivotal resistance of 135.30.
In addition, the benchmark Nikkei 225 recorded an intraday gain of 0.8% to hover at a five-day high of 28,806.
What’s in the mind of BoJ’s new governor Ueda
It seems that Ueda is trying to be a “hedger” to prevent any disruptive movement in the global financial markets that increased cross-assets volatility significantly given that there are several potential risk-off shocks such as the ongoing US debt ceiling partisan squabbles that may lead to failure to extend the debt ceiling this summer’s deadline.
The key point to note is that prior “everlasting” forward guidance of keeping BoJ’s key interest rate at a negative level has been scrapped coupled with projections upgrade on Japan’s inflation (core and core-core) for both FY 2023 and FY 2024 which suggests that Ueda may be laying down the groundwork via baby steps for monetary policy normalization.
Perhaps, a change may come after summer when the US debt ceiling fiasco may be resolved and waiting for more clarity for a pause on the Fed’s current interest rate hiking cycle.
Technical Outlook and Review
DXY:
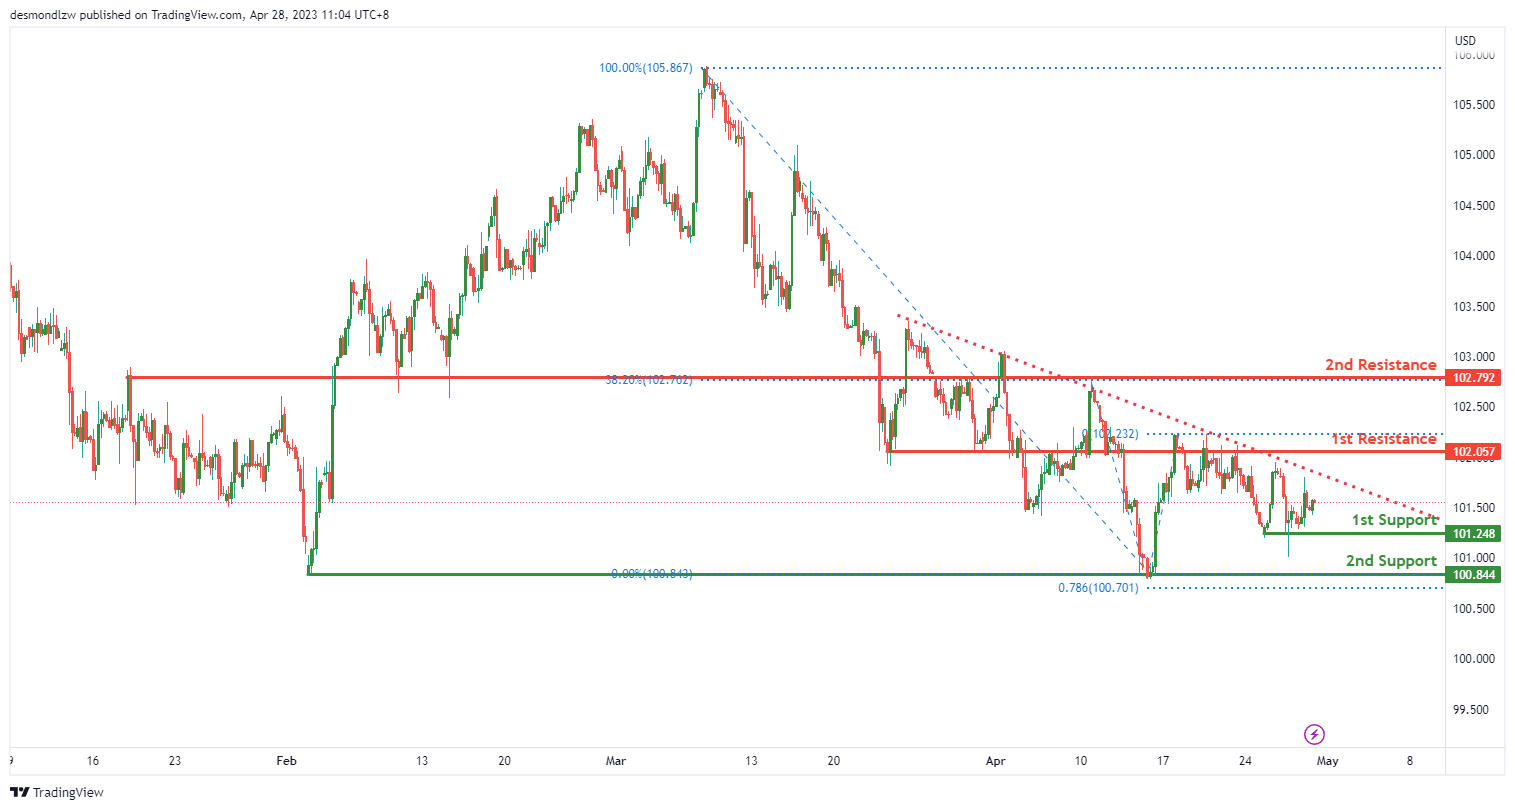
The DXY chart is currently experiencing a bearish momentum. The price is below a major descending trend line, suggesting that bearish momentum is on the cards. Additionally, the price is testing a descending trend line which acts as resistance.
Given the bearish momentum, price could potentially make a bearish continuation towards the 1st support at 101.24. This support level is a multi-swing low support and has previously acted as a strong level of support.
If price were to break the 1st support, the next level of support it could drop to is the 2nd support at 100.84. This support level is also a multi-swing low support and has a 78.60% Fibonacci projection lining up with it, making it an important level to watch.
On the other hand, if the price were to reverse and move upwards, it could encounter the 1st resistance at 102.05. This resistance level is an overlap resistance and could potentially act as a strong level of resistance.
If price were to break the 1st resistance, it could rise further towards the 2nd resistance at 102.79. This resistance level is also an overlap resistance and has a 38.20% Fibonacci retracement lining up with it, making it an important level to watch.
EUR/USD:
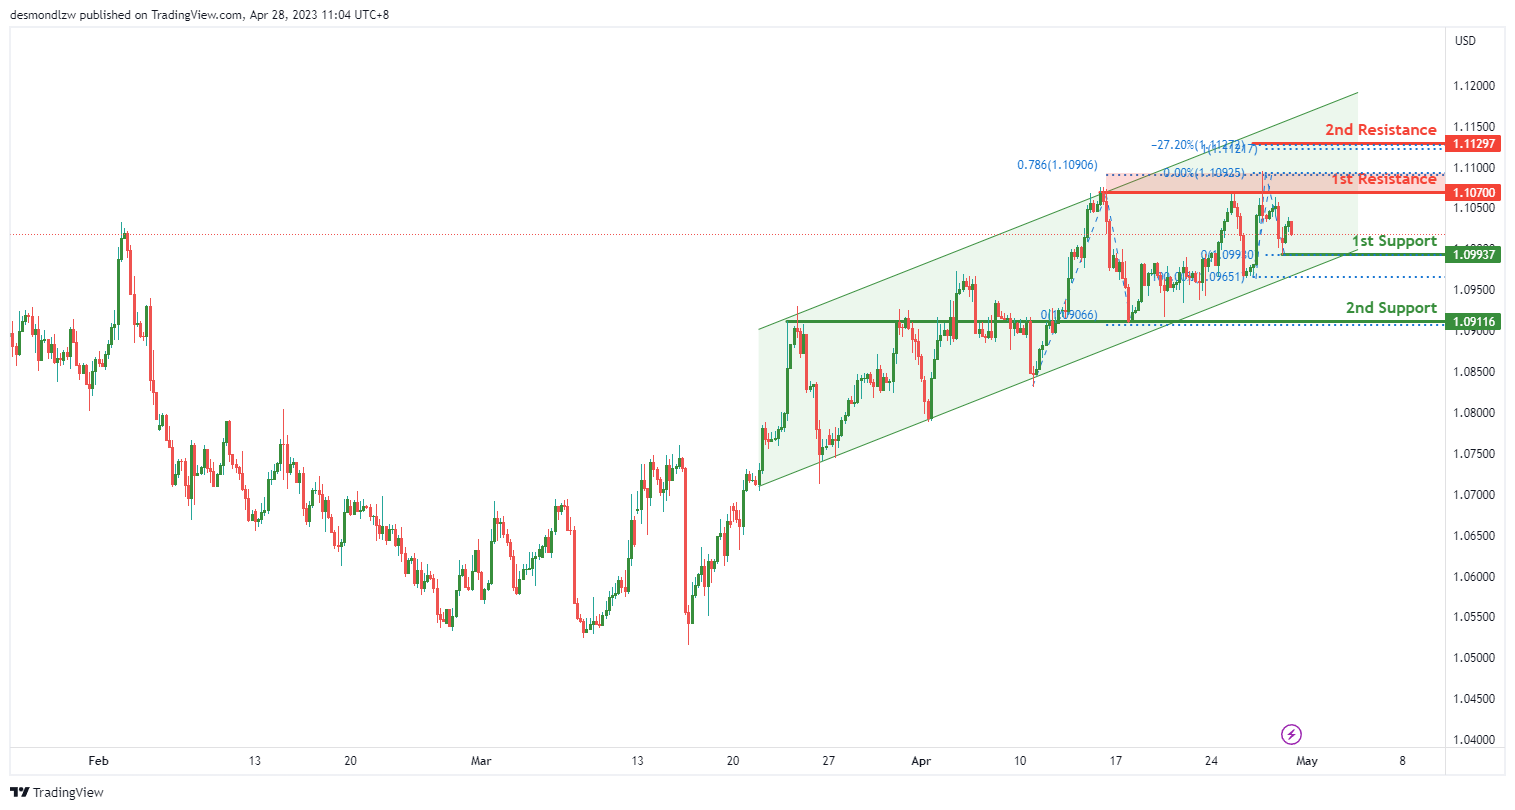
The EUR/USD chart is currently experiencing a bullish momentum. The price is in a bullish ascending channel, which suggests that price might continue to rise because of its bullish momentum.
Given the bullish momentum, price could potentially make a bullish continuation towards the 1st resistance at 1.1070. This resistance level is an overlap resistance and has a 78.60% Fibonacci projection lining up with it, making it an important level to watch.
If the price were to break the 1st resistance, it could rise towards the 2nd resistance at 1.1129. This resistance level has a -27% Fibonacci expansion lining up with it, making it an important level to watch.
On the other hand, if the price were to reverse and move downwards, it could encounter support at the 1st support at 1.0993. This support level is a swing low support and has previously acted as a strong level of support.
If price were to break the 1st support, the next level of support it could drop to is the 2nd support at 1.0911. This support level is also an overlap support, making it an important level to watch.
GBP/USD:
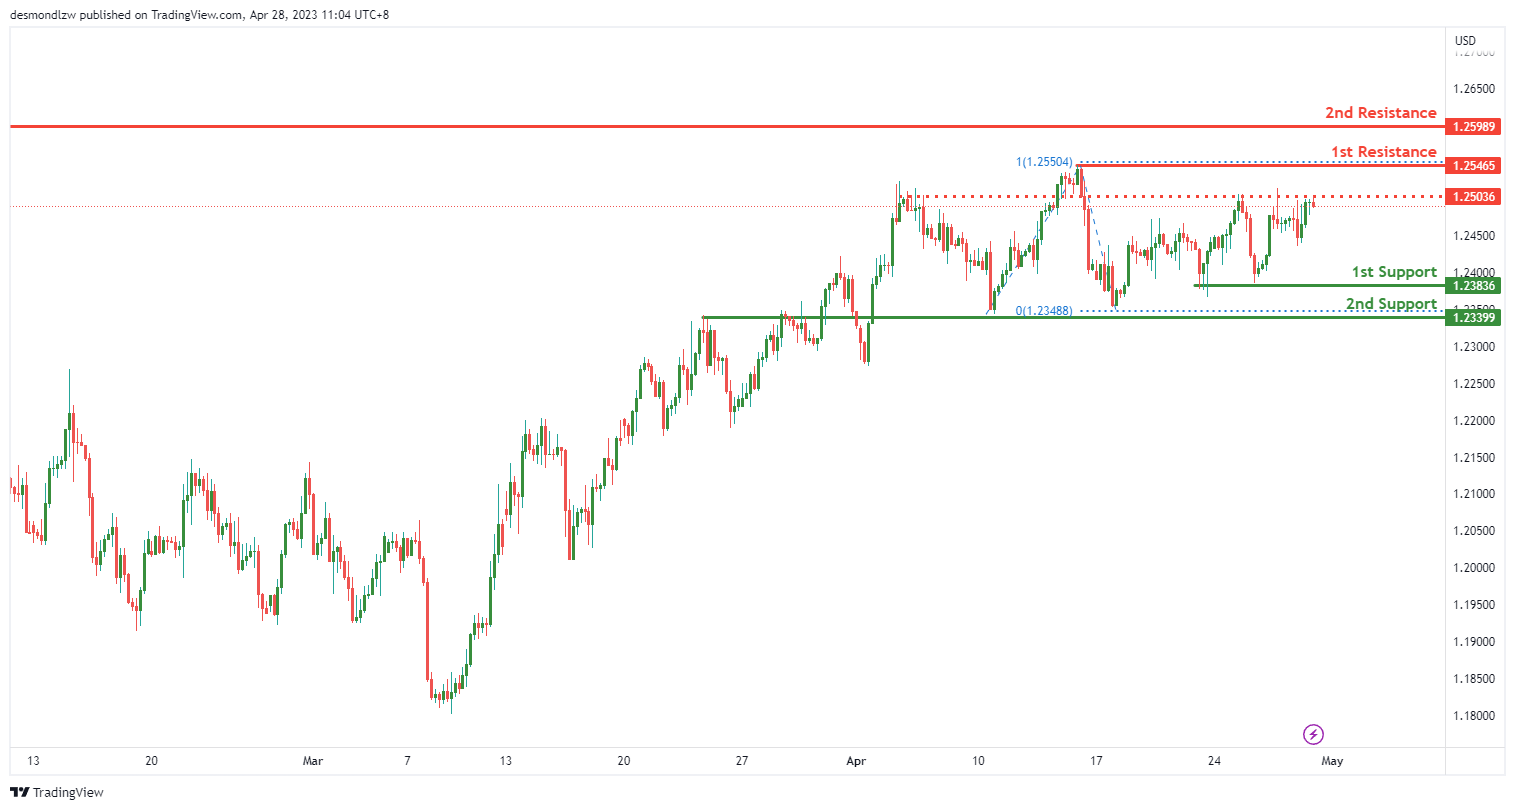
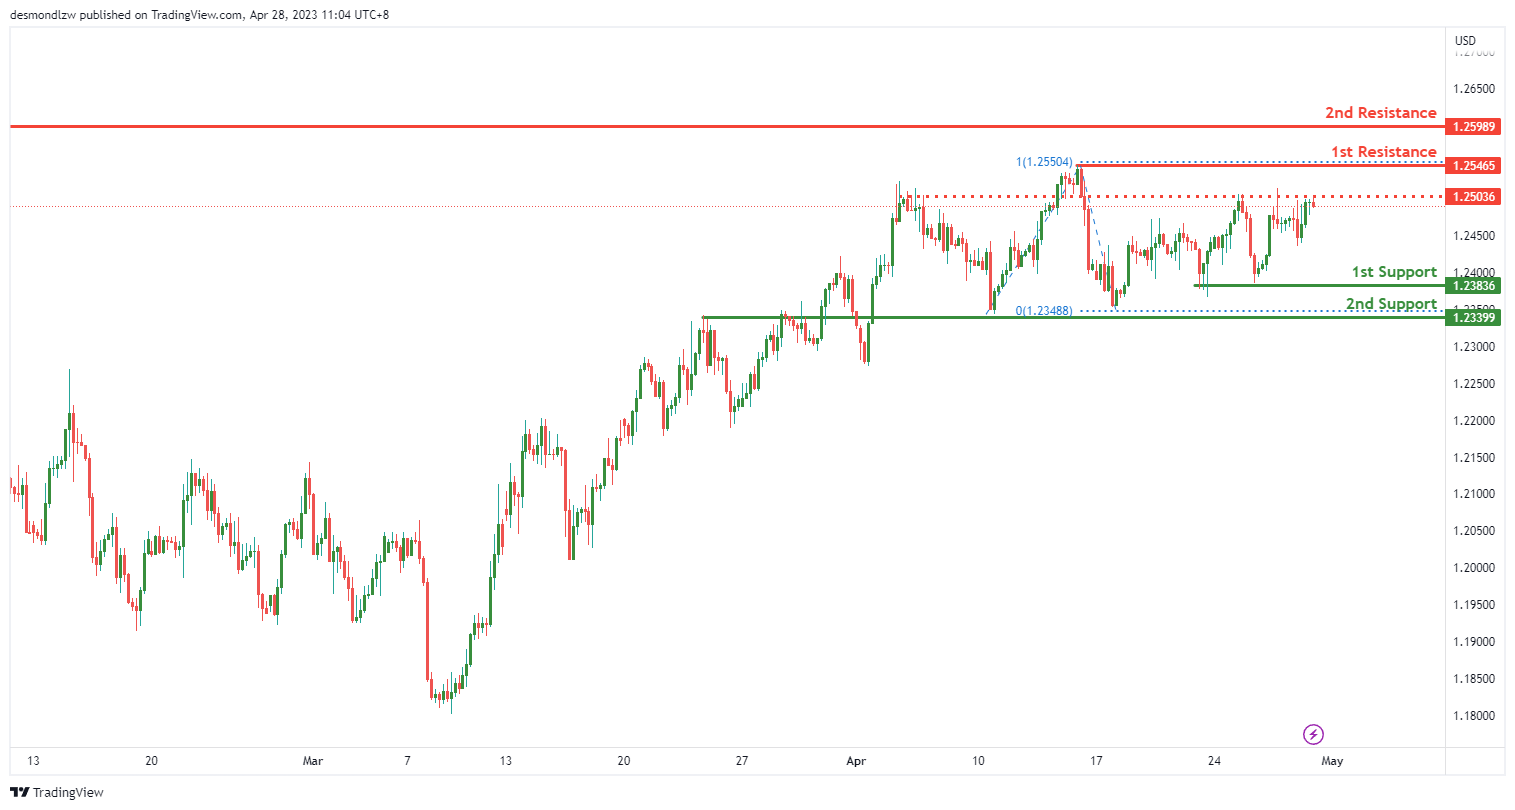
The GBP/USD chart is currently experiencing a bullish momentum. The price is showing signs of strength, and this bullish momentum could potentially lead to a continuation towards the 1st resistance at 1.2546.
If the price were to break the 1st resistance, it could rise further towards the 2nd resistance at 1.2598. This resistance level is a swing high resistance and could potentially act as a strong level of resistance.
On the other hand, if the price were to reverse and move downwards, it could encounter support at the 1st support at 1.2383. This support level is an overlap support and has previously acted as a strong level of support.
If price were to break the 1st support, the next level of support it could drop to is the 2nd support at 1.2339. This support level is also an overlap support, making it an important level to watch.
Additionally, there is an intermediate resistance at 1.2503 between where the price is now and the 1st resistance. If price were to break this intermediate resistance, it could trigger a strong bullish acceleration towards the 1st resistance.
USD/CHF:
The USD/CHF chart is currently experiencing a bearish momentum. The price is below a major descending trend line, suggesting that bearish momentum is on the cards. Additionally, the price is testing a descending trend line which acts as resistance.
Given the bearish momentum, price could potentially make a bearish reaction off the 1st resistance at 0.8960 and drop towards the 1st support at 0.8859. This support level is a multi-swing low support and has previously acted as a strong level of support.
If price were to break the 1st support, the next level of support it could drop to is the 2nd support at 0.8763. This support level is a swing low support and has previously acted as a strong level of support.
On the other hand, if the price were to reverse and move upwards, it could encounter resistance at the 1st resistance at 0.8960. This resistance level is an overlap resistance and could potentially act as a strong level of resistance.
If price were to break the 1st resistance, it could rise towards the 2nd resistance at 0.9006. This resistance level is also an overlap resistance and could potentially act as a strong level of resistance.
USD/JPY:
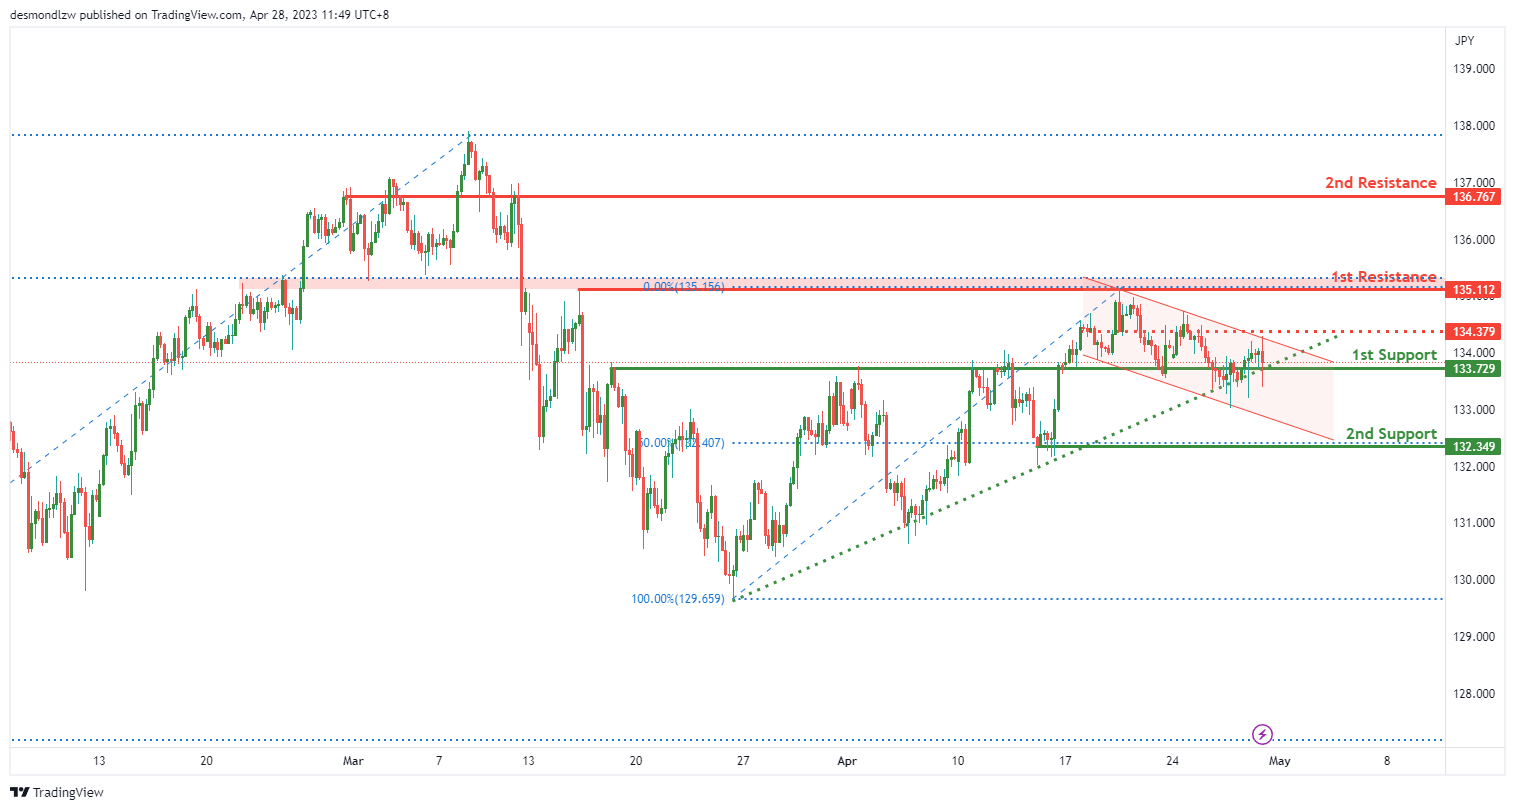
The USD/JPY chart is currently experiencing a bearish momentum. Although the price is above a major ascending trend line, it is also within a bearish descending channel which suggests that price might continue to go lower due to its bearish momentum.
If the price were to break below the ascending trendline, it could potentially drop towards the 1st support at 133.72. Given the bearish momentum, price could potentially make a bearish break off the 1st support and drop towards the 2nd support at 132.34. This support level is a multi-swing low support and has a 50% Fibonacci retracement lining up with it, making it an important level to watch.
If price were to break the 1st resistance at 135.11, it could rise towards the 2nd resistance at 136.76. This resistance level is an overlap resistance and could potentially act as a strong level of resistance.
On the other hand, if the price were to reverse and move downwards, it could encounter resistance at the intermediate resistance at 134.37. This resistance level is an overlap resistance and could potentially act as a strong level of resistance.
If price were to break the intermediate resistance, it could trigger a strong bullish acceleration towards the 1st resistance at 135.11.
AUD/USD:
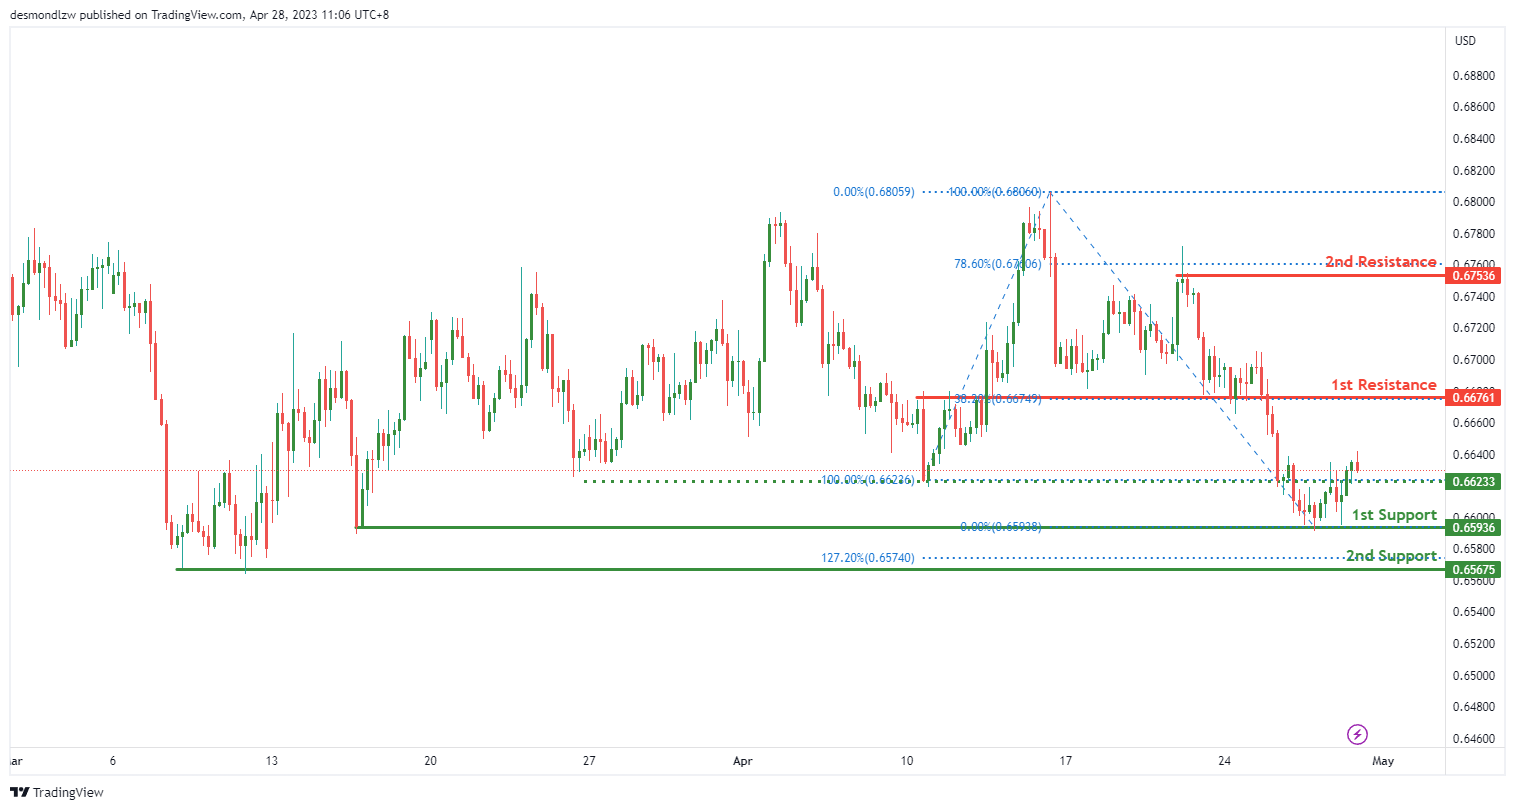
The AUD/USD chart is currently displaying strong bullish momentum, with potential for a bullish continuation towards the 1st resistance level of 0.6676. As of writing, the price is trading at 0.6643, which is above the Ichimoku cloud, indicating a bullish momentum.
There are two strong support levels identified on the chart. The first support level is at 0.6593, which is a multi-swing low support. This level has been tested multiple times in the past and has held up well, making it a good support level for potential price bounces. The second support level is at 0.6567, which is another multi-swing low support and a 127.20% Fibonacci Expansion. If the price were to drop below the first support level, this second support level could provide a good bounce point for prices to reverse back up.
In terms of resistance levels, there are two strong levels to watch out for. The first resistance level is at 0.6676, which is a pullback resistance and coincides with a 38.20% Fibonacci retracement. This resistance level is a good point to look out for potential price reversal. If the price were to break above this resistance level, it could signal a strong bullish momentum, potentially pushing prices up to the second resistance level at 0.6753. This level is a swing high resistance and a 78.60% Fibonacci retracement.
There is also an intermediate support level at 0.6623, which is an overlap support. This level could provide a good bounce point for prices if they were to drop between the current price and the first support level at 0.6593.
NZD/USD:
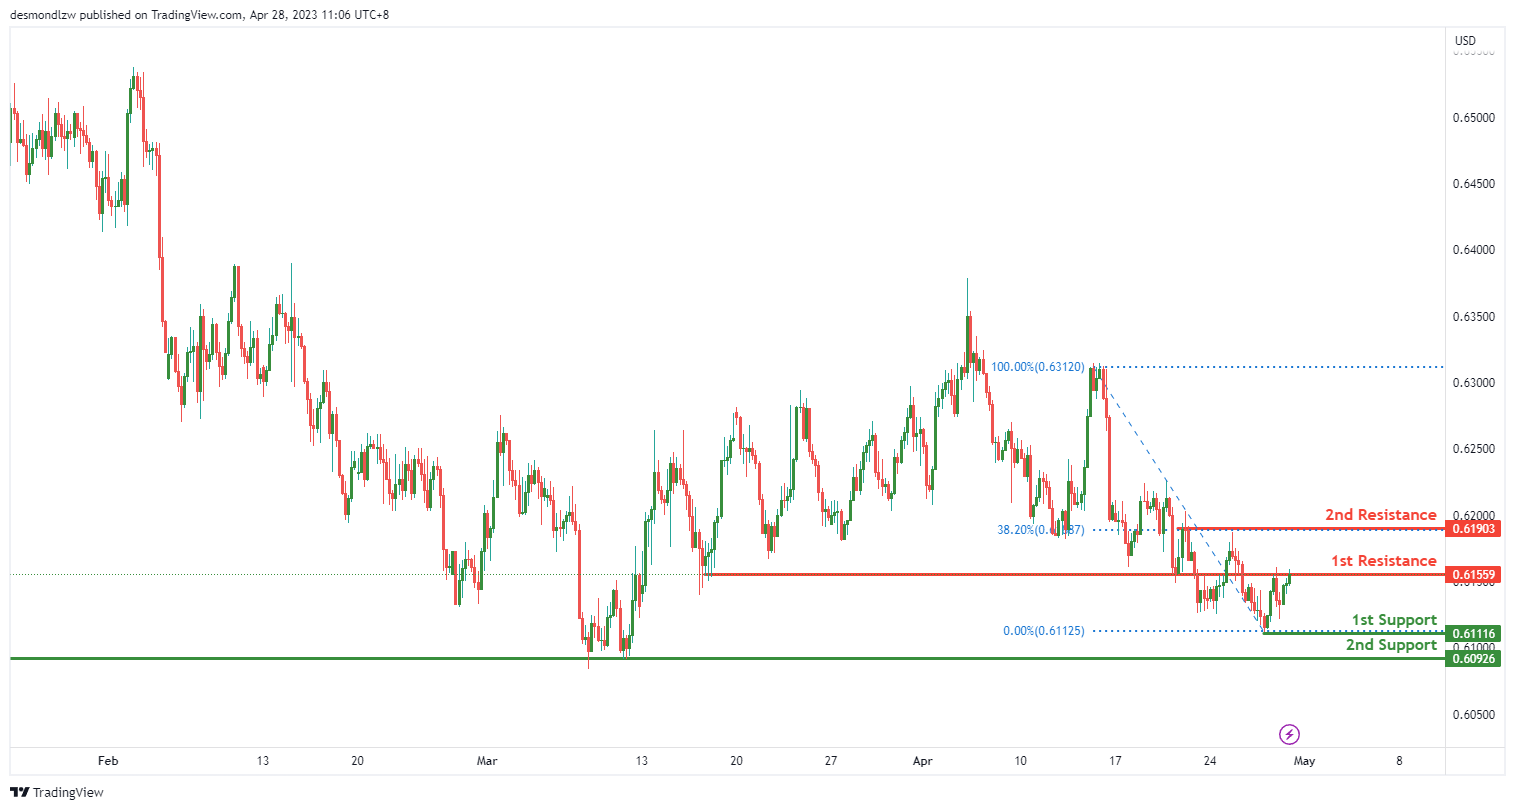
The NZD/USD chart is currently displaying strong bearish momentum, with potential for a bearish reaction off the first resistance level of 0.6155 and a potential drop towards the first support level of 0.6111. As of writing, the price is trading at 0.6133, which is below the Ichimoku cloud, indicating a bearish momentum.
There are two strong support levels identified on the chart. The first support level is at 0.6111, which is a swing low support. This level has been tested multiple times in the past and has held up well, making it a good support level for potential price bounces. The second support level is at 0.6092, which is another multi-swing low support. If the price were to drop below the first support level, this second support level could provide a good bounce point for prices to reverse back up.
In terms of resistance levels, there are two strong levels to watch out for. The first resistance level is at 0.6155, which is an overlap resistance. This resistance level coincides with the 38.20% Fibonacci retracement and could provide a good point to look out for potential price reversals. If the price were to break above this resistance level, it could signal a shift in momentum towards the bullish side, potentially pushing prices up to the second resistance level at 0.6190. This level is a multi-swing high resistance and another 38.20% Fibonacci retracement.
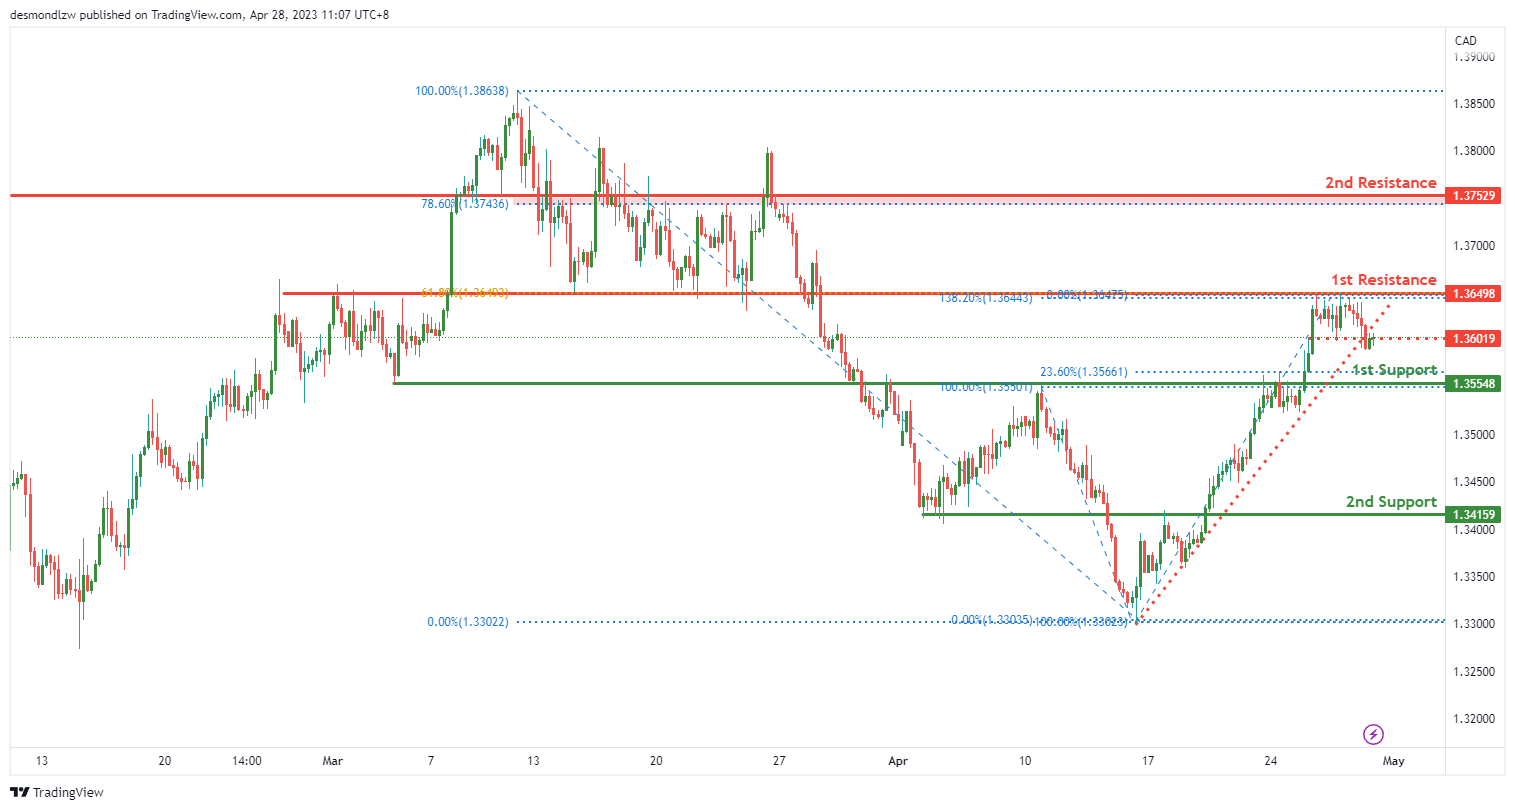
USD/CAD:
The USD/CAD chart is currently displaying strong bearish momentum, triggered by the break below an ascending support line. As of writing, the price is trading at 1.3567, which is below the Ichimoku cloud, indicating a bearish momentum.
There are two strong support levels identified on the chart. The first support level is at 1.3554, which is a pullback support and coincides with a 38.20% Fibonacci retracement. This support level is a good point to look out for potential price bounces. The second support level is at 1.3415, which is another pullback support. If the price were to drop below the first support level, this second support level could provide a good bounce point for prices to reverse back up.
In terms of resistance levels, there are two strong levels to watch out for. The first resistance level is at 1.3649, which is an overlap resistance and coincides with a 61.80% Fibonacci retracement. This resistance level could provide a good point to look out for potential price reversals. If the price were to break above this resistance level, it could signal a shift in momentum towards the bullish side, potentially pushing prices up to the second resistance level at 1.3752. This level is an overlap resistance and a 78.60% Fibonacci retracement.
There is also an intermediate resistance level at 1.3601, which is a pullback resistance. This level could provide a good point for prices to reverse back down towards the support levels.
DJ30:
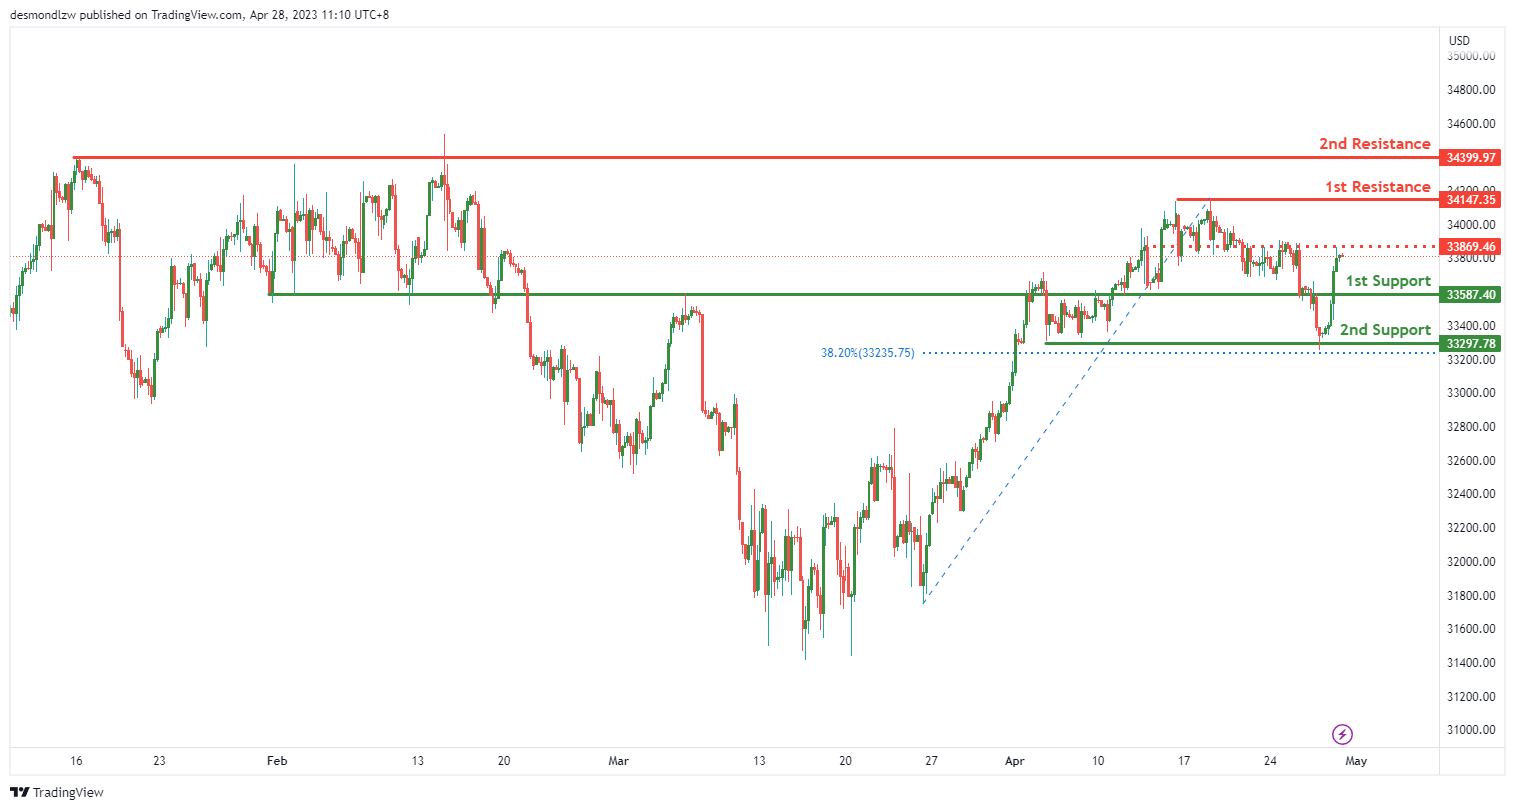
The DJ30 chart is currently displaying strong bullish momentum, with potential for a bullish continuation towards the first resistance level at 34147.35. As of writing, the price is trading at 33938.52, which is above the Ichimoku cloud, indicating a bullish momentum.
There are two strong support levels identified on the chart. The first support level is at 33587.40, which is a pullback support. This support level is a good point to look out for potential price bounces. The second support level is at 33297.78, which is a multi-swing low support and coincides with a 38.20% Fibonacci retracement. If the price were to drop below the first support level, this second support level could provide a good bounce point for prices to reverse back up.
In terms of resistance levels, there are two strong levels to watch out for. The first resistance level is at 34147.35, which is a multi-swing high resistance. This resistance level could provide a good point to look out for potential price reversals. If the price were to break above this resistance level, it could signal a shift in momentum towards the bullish side, potentially pushing prices up to the second resistance level at 34399.97. This level is also a multi-swing high resistance.
There is also an intermediate resistance level at 33869.46, which is a pullback resistance. This level could provide a good point for prices to reverse back down towards the support levels.
GER30:
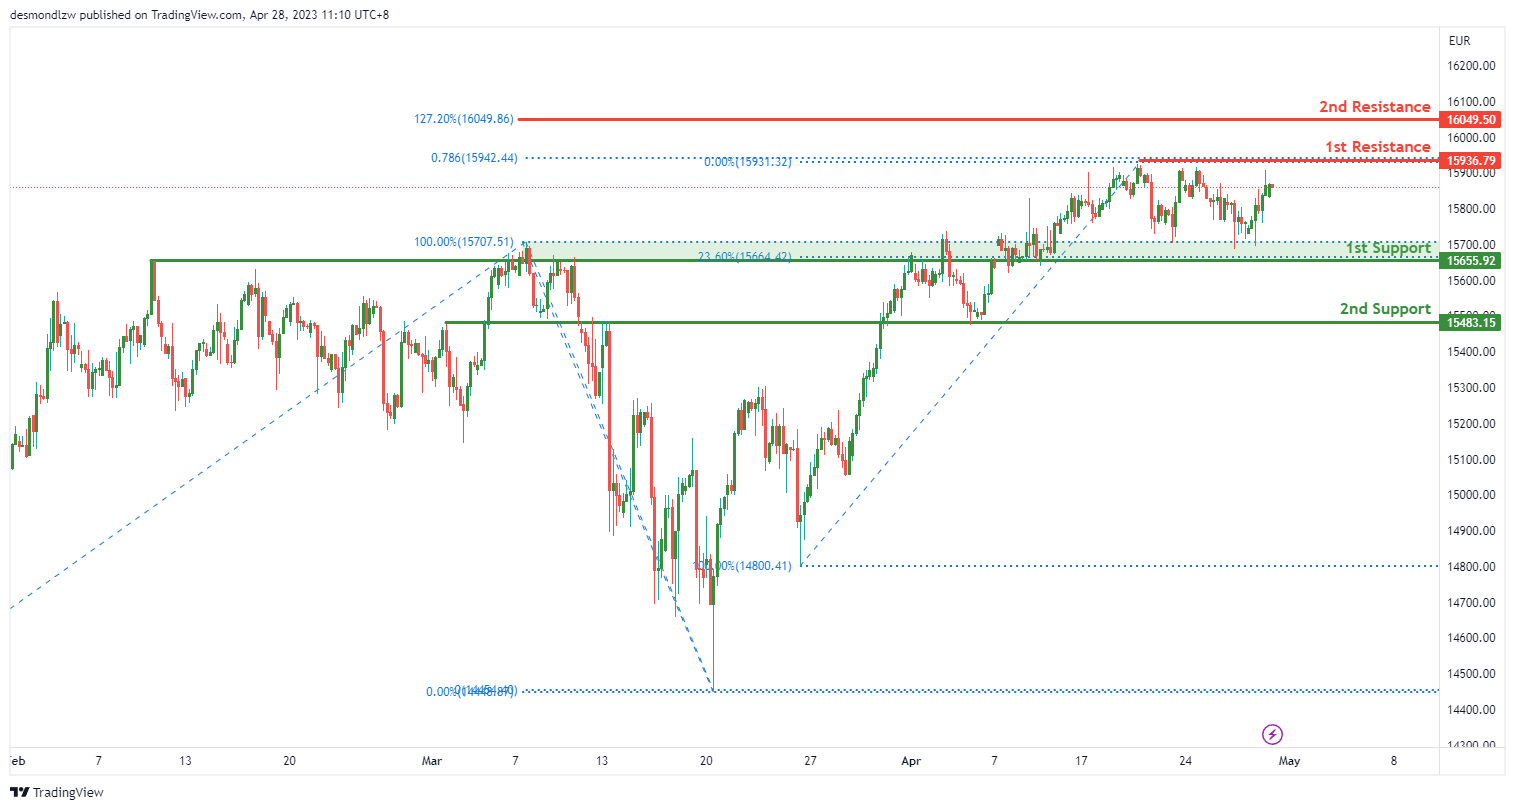
The GER30 chart is currently displaying strong bullish momentum, with potential for a bullish continuation towards the first resistance level at 15936.79. As of writing, the price is trading at 15709.70, which is above the Ichimoku cloud, indicating a bullish momentum.
There are two strong support levels identified on the chart. The first support level is at 14655.92, which is an overlap support and coincides with a 23.60% Fibonacci retracement. This support level is a good point to look out for potential price bounces. The second support level is at 15483.15, which is another overlap support. If the price were to drop below the first support level, this second support level could provide a good bounce point for prices to reverse back up.
In terms of resistance levels, there are two strong levels to watch out for. The first resistance level is at 15936.79, which is a swing high resistance and coincides with a 78.60% Fibonacci projection. This resistance level could provide a good point to look out for potential price reversals. If the price were to break above this resistance level, it could signal a shift in momentum towards the bullish side, potentially pushing prices up to the second resistance level at 16049.50. This level is a 127.20% Fibonacci expansion.
BTC/USD:
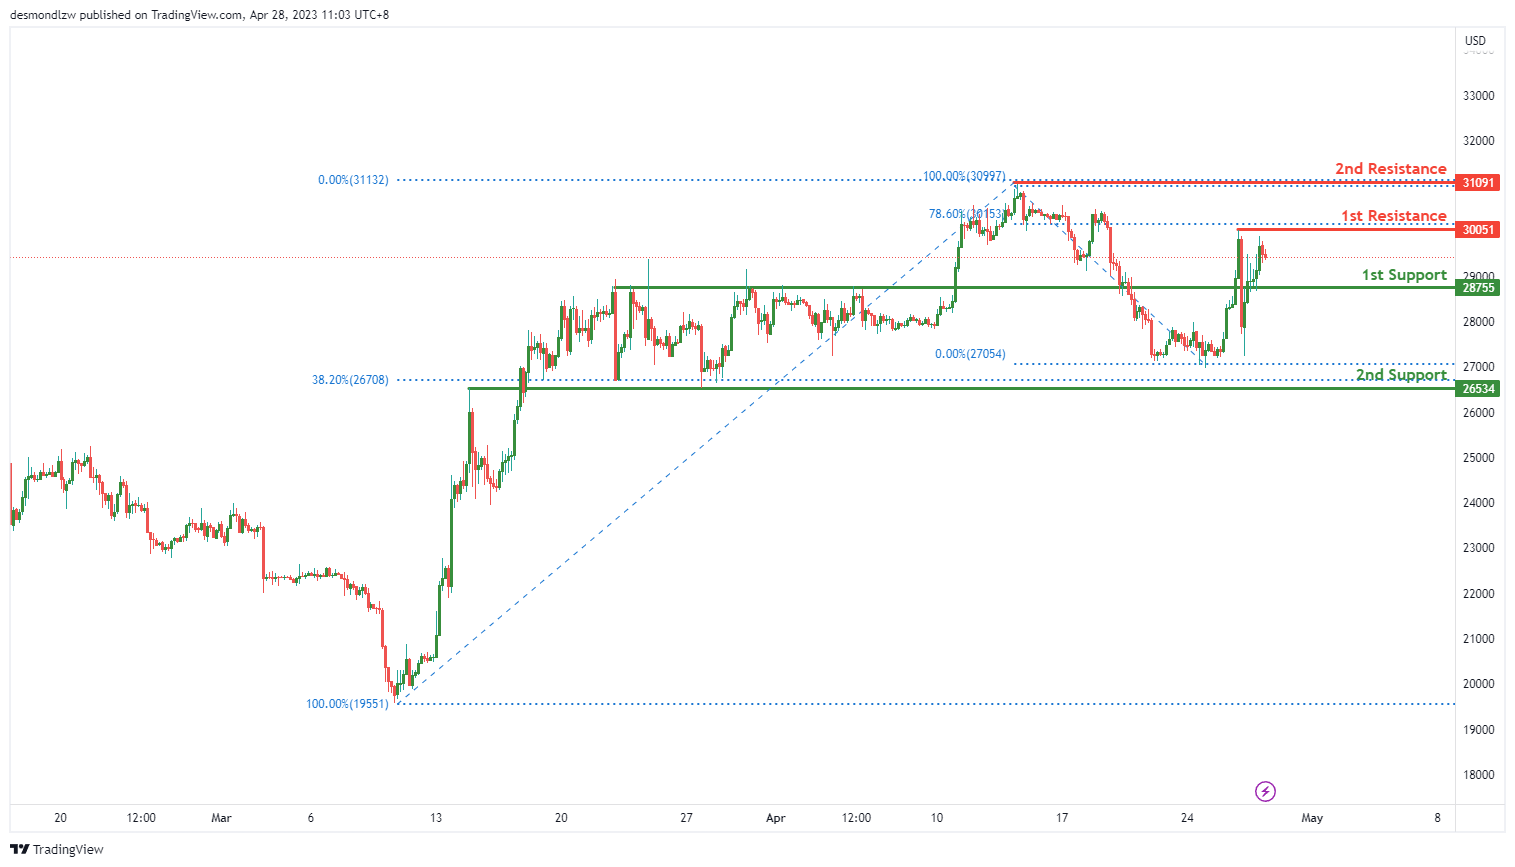
The BTC/USD chart is currently displaying bearish momentum, with potential for a bearish reaction off the first resistance level at 30051 and drop to the first support level at 28755. As of writing, the price is trading at 29307.31, which is below the Ichimoku cloud, indicating a bearish momentum.
There are two strong support levels identified on the chart. The first support level is at 28755, which is an overlap support. This support level is a good point to look out for potential price bounces. The second support level is at 26534, which is another overlap support and coincides with a 38.20% Fibonacci retracement. If the price were to drop below the first support level, this second support level could provide a good bounce point for prices to reverse back up.
In terms of resistance levels, there are two strong levels to watch out for. The first resistance level is at 30051, which is a swing high resistance. This resistance level could provide a good point to look out for potential price reversals. If the price were to break above this resistance level, it could signal a shift in momentum towards the bullish side, potentially pushing prices up to the second resistance level at 31091. This level is a swing high resistance and coincides with a 78.60% Fibonacci retracement.
US500
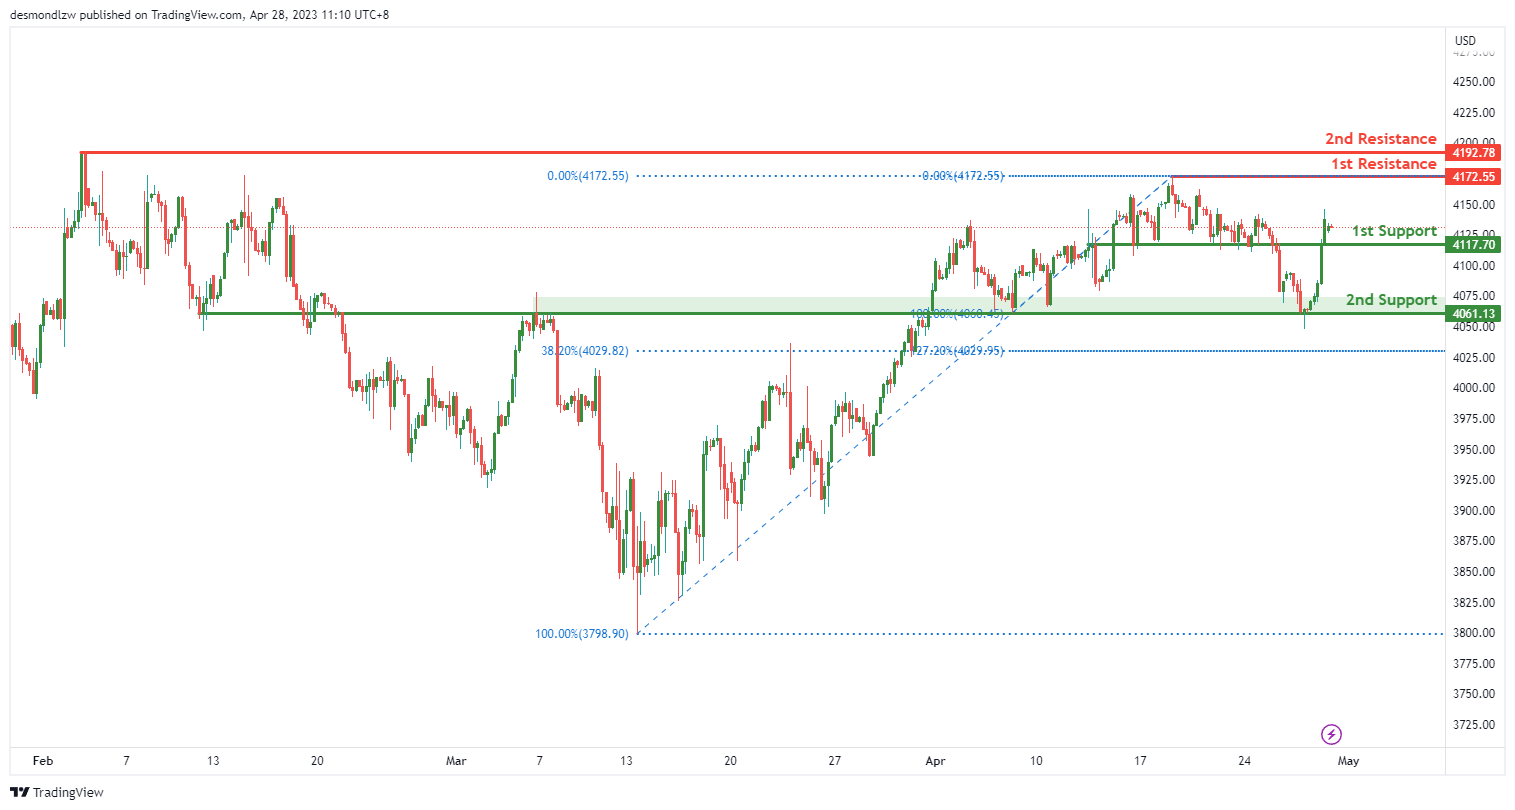
The US500 chart is currently displaying strong bullish momentum, with potential for a bullish continuation towards the first resistance level at 4172.55. As of writing, the price is trading at 4155.70, which is above the Ichimoku cloud, indicating a bullish momentum.
There are two strong support levels identified on the chart. The first support level is at 4147.70, which is a pullback support. This support level is a good point to look out for potential price bounces. The second support level is at 4061.13, which is another pullback support. If the price were to drop below the first support level, this second support level could provide a good bounce point for prices to reverse back up.
In terms of resistance levels, there are two strong levels to watch out for. The first resistance level is at 4172.55, which is a swing high resistance. This resistance level could provide a good point to look out for potential price reversals. If the price were to break above this resistance level, it could signal a shift in momentum towards the bullish side, potentially pushing prices up to the second resistance level at 4192.78. This level is also a swing high resistance.
ETH/USD:
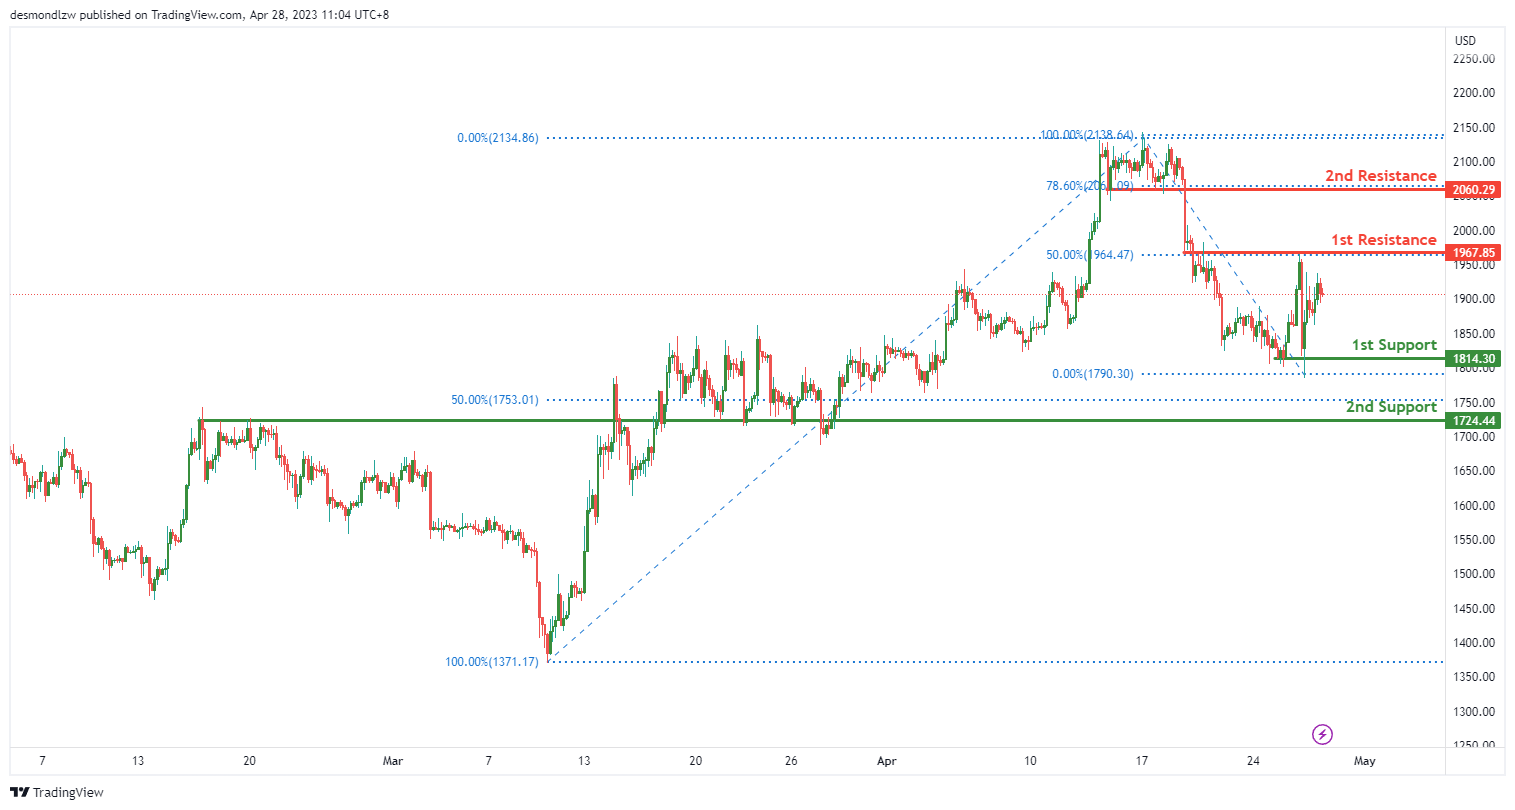
The ETH/USD chart is currently displaying bearish momentum, with potential for a bearish continuation towards the first support level at 1814.30. As of writing, the price is trading at 1877.34, which is below the Ichimoku cloud, indicating a bearish momentum.
There are two strong support levels identified on the chart. The first support level is at 1814.30, which is a multi-swing low support. This support level is a good point to look out for potential price bounces. The second support level is at 1724.44, which is an overlap support and coincides with a 50% Fibonacci retracement. If the price were to drop below the first support level, this second support level could provide a good bounce point for prices to reverse back up.
In terms of resistance levels, there are two strong levels to watch out for. The first resistance level is at 1967.85, which is an overlap resistance and coincides with a 50% Fibonacci retracement. This resistance level could provide a good point to look out for potential price reversals. If the price were to break below the first support level, it could signal a shift in momentum towards the bearish side, potentially pushing prices down to the second support level at 1724.44. On the other hand, if the price were to break above the first resistance level, it could potentially rise towards the second resistance level at 2060.29. This level is a pullback resistance and coincides with a 78.60% Fibonacci retracement.
WTI/USD:
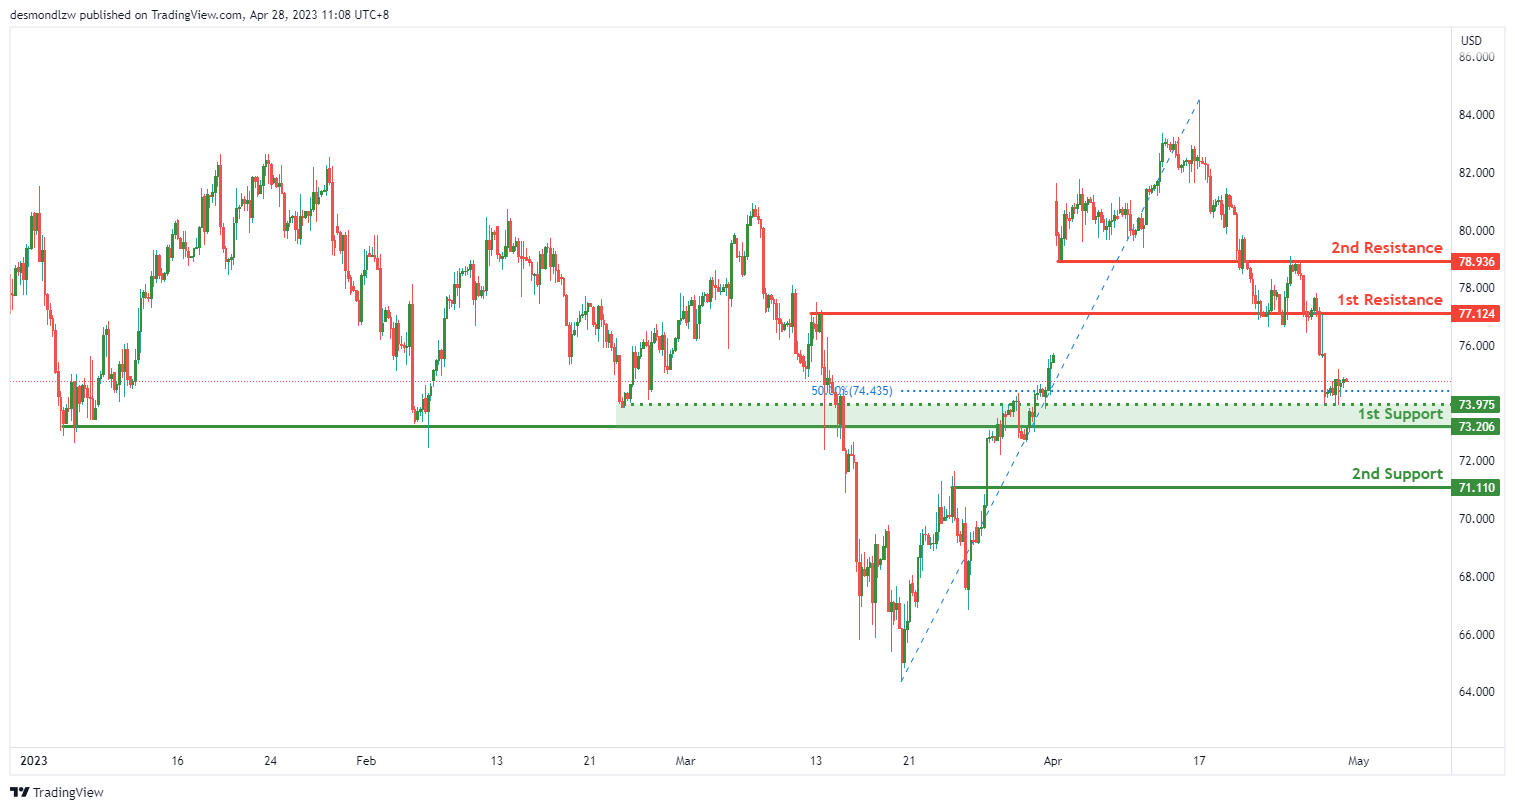
The WTI chart is currently displaying bullish momentum, with potential for a bullish bounce off the first support level at 73.20 and heading towards the first resistance level at 77.12. As of writing, the price is trading at 75.75, which is above the Ichimoku cloud, indicating a bullish momentum.
There are two strong support levels identified on the chart. The first support level is at 73.20, which is a pullback support. This support level is a good point to look out for potential price bounces. The second support level is at 71.11, which is also a pullback support. If the price were to drop below the first support level, this second support level could provide a good bounce point for prices to reverse back up.
In terms of resistance levels, there are two strong levels to watch out for. The first resistance level is at 77.12, which is an overlap resistance. This resistance level could provide a good point to look out for potential price reversals. If the price were to break above the first resistance level, it could potentially rise towards the second resistance level at 78.93. This level is also an overlap resistance, and both resistance levels indicate potential for further bullish momentum.
There is also an intermediate support level at 73.97, which is an overlap support. This level could potentially provide a good point to watch out for a bullish continuation towards the first resistance level.
XAU/USD (GOLD):
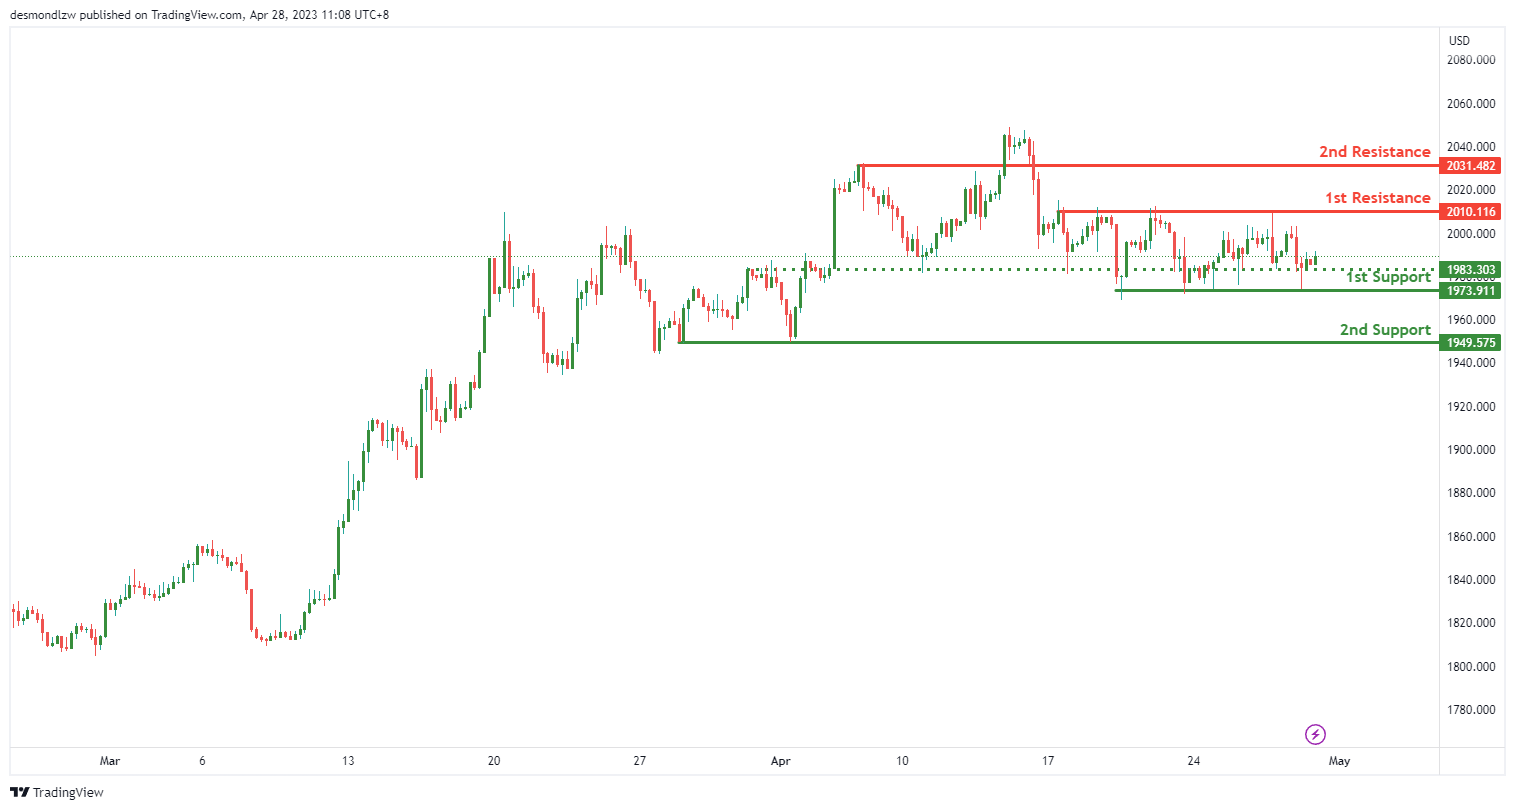
The XAU/USD chart is displaying bullish momentum, with potential for a bullish continuation towards the first resistance level at 2010.00. As of writing, the price is trading at 1989.18, which is above the Ichimoku cloud, indicating a bullish momentum.
There are two strong support levels identified on the chart. The first support level is at 1973.91, which is a multi-swing low support. This support level is a good point to look out for potential price bounces. The second support level is at 1949.57, which is also a multi-swing low support. If the price were to drop below the first support level, this second support level could provide a good bounce point for prices to reverse back up.
In terms of resistance levels, there are two strong levels to watch out for. The first resistance level is at 2010.00, which is a multi-swing high resistance. This resistance level could provide a good point to look out for potential price reversals. If the price were to break above the first resistance level, it could potentially rise towards the second resistance level at 2031.48. This level is also a pullback resistance, indicating potential for further bullish momentum.
There is also an intermediate support level at 1983.30, which is an overlap support. This level could potentially provide a good point to watch out for a bullish continuation towards the first resistance level.
GBP/JPY Daily Outlook
Daily Pivots: (S1) 166.66; (P) 167.09; (R1) 167.85; More...
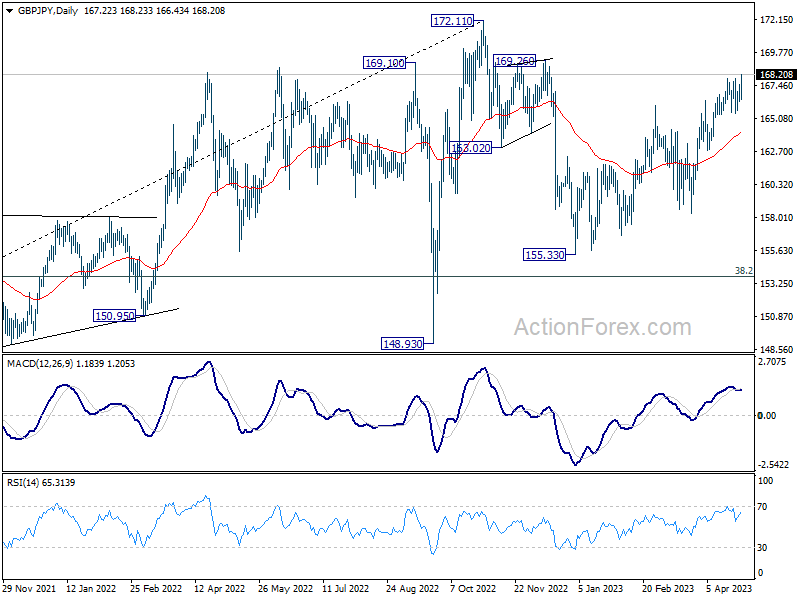
GBP/JPY's rally resumed by breaking through 167.95 resistance an intraday bias is back on the upside. Current rise from 155.33 should target 169.26 resistance first, and then 172.11 high. For now, near term outlook will remain cautiously bullish as long as 165.40 support holds, in case of retreat. However, firm break of 165.40 will argue that the corrective pattern from 172.11 is starting another falling leg. Intraday bias will be back on the downside for 162.75 support and below.
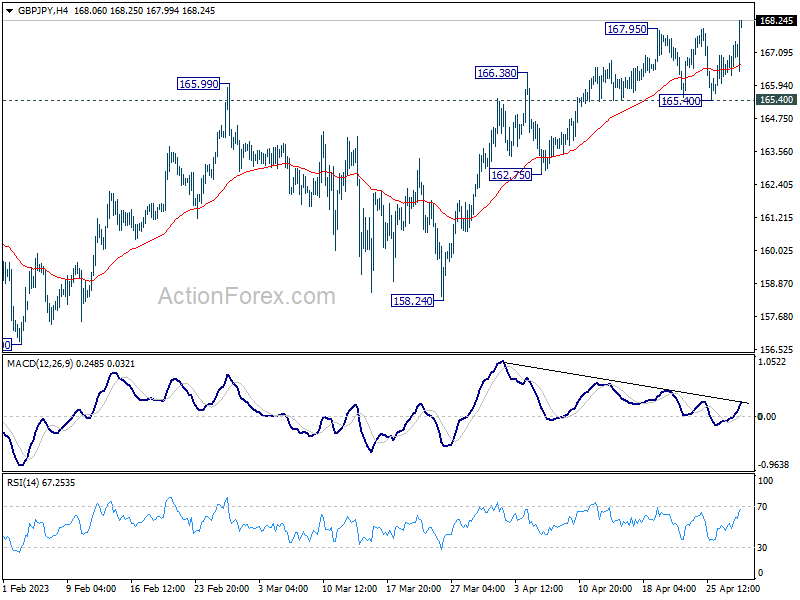
In the bigger picture, as long as 38.2% retracement of 123.94 (2020 low) to 172.11 (2022 high) at 153.70 holds, medium term bullishness is retained. That is, larger up trend from 123.94 (2020 low) is still in progress. Break of 172.11 high to resume such up trend is expected at a later stage.
Yen Falls on Dovish BoJ, Risk-On Sentiment Boosts Market
Yen declined broadly in Asian session as traders discovered that BoJ still has the potential to surprise the market with dovish moves. The selloff was triggered by the central bank's plan to review monetary policy in 12 to 18 months, a major disappointment for those who expected imminent changes as early as at today's meeting. Additionally, BoJ projects that core inflation will not sustain above target within the projection horizon. Risk-on sentiment, following the strong rebound in US stocks overnight, is another factor pressuring Yen. With the BoJ risk now cleared, bears should be feeling free to act.
At the moment, Australian dollar remains the worst performer for the week, as more analysts anticipate another RBA pause next week. Canadian dollar is the second worst, followed by The Sterling is the best performer, trailed by Euro and New Zealand dollar. While Dollar is recovering today, it remains mixed for the week. The overall picture may change, as Eurozone GDP, Canada GDP, and US PCE inflation data are set to be released today.
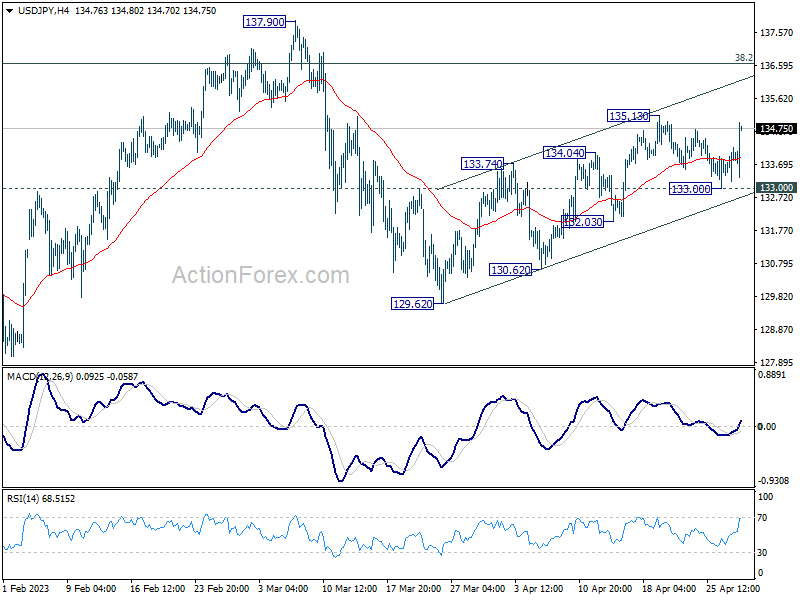
Technically, USD/JPY will be a focus in the next few hours, at least before US session. Break of 135.13 will resume the choppy rebound from 129.62. Attention will be on the reaction to the near-term channel resistance (now at around 136.10). Rejection by this resistance will likely keep the rebound corrective and favor a larger decline through 129.62 and 127.20 at a later stage. However, a strong break of the channel resistance will indicate upside acceleration and increase the likelihood of resuming the entire rise from 127.20 through 137.90 resistance.
In Asia, at the time of writing, Nikkei is up 0.80%. Hong Kong HSI is up 0.87%. China Shanghai SSE is up 0.67. Singapore Strait Times is down -0.21%. Japan 10-year JGB yield is down notably by -0.032 at 0.428. Overnight, DOW rose 1.57%. S&P 500 rose 1.96%. NASDAQ rose 2.43%. 10-year yield rose 0.096 to 3.528.
S&P 500 stays near term bullish after biggest rally since Jan
US stocks rebounded strongly overnight with DOW and S&P 500 having the biggest rally since January, and NASDAQ since March. Sentiment was boosted by Meta's quarterly performance, which shares ended up 14%. The miss in Q1 GDP data also added to hope that Fed is closer to ending the tightening cycle and gave the pessimists some bullets to call for a rate cut before the end of the year if the economy deteriorates further down the road.
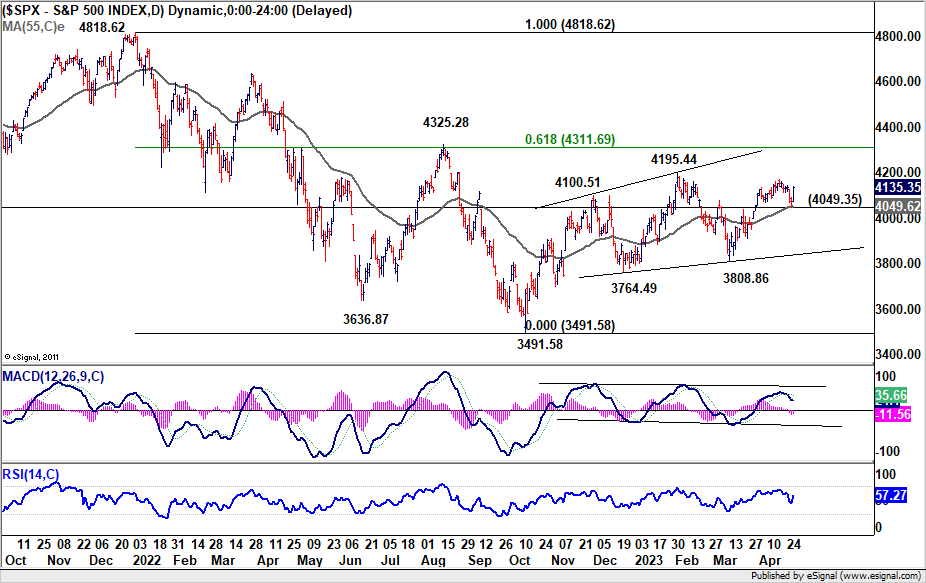
Technically, DOW, S&P 500 and NASDAQ all received strong support from their respective 55 D EMA this week. As for SPX, the development keeps the rally from 3808.83 alive. Near term outlook will now stay bullish as long as 4049.35 support holds. Break of 4195.44 resistance will confirm resumption of whole rebound from 3491.58.
The key hurdle remains on 4325.28 cluster resistance (61.8% retracement of 4818.62 to 3491.58 at 4311.69). Sustained break of this cluster resistance will open up further rally back to historical high at 4818.62. The reaction from this 4300 handle will hinge on next week's FOMC rate decision and Chair Jerome Powell's press conference.
BoJ stands pat, to take 1-1.5 yrs to review monetary policy
BoJ keeps monetary policy unchanged as widely expected, by unanimous vote. Under the yield curve control, short-term policy interest rate is held at -0.10%. 10-year JGB yield will be kept at around 0% with bond purchases without upper limit. 10-year JGB yield will continue to be allowed to fluctuate in range of around plus and minus 0.50% from 0% level.
The central bank maintained the pledge to continue with Quantitative and Qualitative Monetary Easing with Yield Curve Control for "as long as it is necessary" for meeting inflation target in a "stable manner". It "will not hesitate to take additional easing measures if necessary". BoJ will conduct a "broad-perspective review of monetary policy", with a planned time frame of around 12 to 18 months.
In the new economic projections, while core inflation forecasts were upgraded, it's not expected to sustain at the 2% level throughout the horizon.
- Real GDP forecasts (versus January estimates):
- Fiscal 2023 at 1.4% (down from 1.7%).
- Fiscal 2024 at 1.2% (up from 1.1%).
- Fiscal 2025 at 1.0% (new)
- CPI Core forecasts (versus January estimates):
- Fiscal 2023 at 1.8% (up from 1.6%).
- Fiscal 2024 at 2.0% (up from 1.8%).
- Fiscal 2025 at 1.6% (new).
- CPI Core-Core forecasts (versus January estimates):
- Fiscal 2023 at 2.5% (up from 1.8%).
- Fiscal 2024 at 1.7% (up from 1.6%).
- Fiscal 2025 at 1.8% (new).
Japan industrial production rose 0.8% mom, with signs of moderate pick up
Japan's industrial production expanded for the second consecutive month, recording a 0.8% mom growth in March, surpassing the expected 0.4% mom increase. The growth was driven by output in eight sectors, led by motor vehicles, while declines were observed in seven sectors, including electronic components and devices.
The Ministry of Economy, Trade and Industry upgraded its basic assessment for the month, stating that industrial production was "showing signs of moderately picking up" as parts supply shortages continued to ease. This is a marked improvement from the previous month's assessment of "weakening." The ministry also projects a further 4.1% growth in industrial production for April and a -2.0% decline in May.
Other economic indicators released include 7.2% yoy increase in retail sales for March, surpassing expectations of 6.5% yoy. However, unemployment rate rose for the second month in a row, reaching 2.8%, above expectation of 2.5%.
April, Tokyo core CPI, which excludes fresh food, accelerated from 3.2% to 3.5% yoy, exceeding expectations of 3.2% yoy. Core-core CPI, which excludes fresh food and fuel costs, accelerated from 3.4% to 3.8% year-on-year, marking the highest rate since April 1982.
Looking ahead
GDP data from Eurozone, Germany and France are the main focuses in European session. Germany will also publish CPI flash. Swiss will release retail sales and KOF economic barometer. Later in the day, Canada GDP, US personal income and spending with PCE inflation will be the main focuses.
GBP/JPY Daily Outlook
Daily Pivots: (S1) 166.66; (P) 167.09; (R1) 167.85; More...
GBP/JPY's rally resumed by breaking through 167.95 resistance an intraday bias is back on the upside. Current rise from 155.33 should target 169.26 resistance first, and then 172.11 high. For now, near term outlook will remain cautiously bullish as long as 165.40 support holds, in case of retreat. However, firm break of 165.40 will argue that the corrective pattern from 172.11 is starting another falling leg. Intraday bias will be back on the downside for 162.75 support and below.
In the bigger picture, as long as 38.2% retracement of 123.94 (2020 low) to 172.11 (2022 high) at 153.70 holds, medium term bullishness is retained. That is, larger up trend from 123.94 (2020 low) is still in progress. Break of 172.11 high to resume such up trend is expected at a later stage.
Economic Indicators Update
| GMT | Ccy | Events | Actual | Forecast | Previous | Revised |
|---|---|---|---|---|---|---|
| 23:30 | JPY | Tokyo CPI Core Y/Y Apr | 3.50% | 3.20% | 3.20% | |
| 23:50 | JPY | Industrial Production M/M Mar P | 0.80% | 0.40% | 4.60% | |
| 23:50 | JPY | Retail Trade Y/Y Mar | 7.20% | 6.50% | 6.60% | 7.30% |
| 23:30 | JPY | Unemployment Rate Mar | 2.80% | 2.50% | 2.60% | |
| 01:30 | AUD | Private Sector Credit M/M Mar | 0.30% | 0.30% | 0.30% | |
| 01:30 | AUD | PPI Q/Q Q1 | 1.00% | 1.50% | 0.70% | |
| 01:30 | AUD | PPI Y/Y Q1 | 5.20% | 5.80% | 5.80% | |
| 04:00 | JPY | BoJ Interest Rate Decision | -0.10% | -0.10% | -0.10% | |
| 05:00 | JPY | Housing Starts Y/Y Mar | -3.2% | -3.70% | -0.30% | |
| 05:30 | EUR | France GDP Q/Q Q1 P | 0.10% | 0.10% | ||
| 06:00 | EUR | Germany Import Price Index M/M Mar | -0.90% | -2.40% | ||
| 06:30 | CHF | Real Retail Sales Y/Y Mar | 0.40% | 0.30% | ||
| 07:00 | CHF | KOF Leading Indicator Apr | 98 | 98.2 | ||
| 07:55 | EUR | Germany Unemployment Change Mar | 10K | 16K | ||
| 07:55 | EUR | Germany Unemployment Rate Mar | 5.60% | 5.60% | ||
| 08:00 | EUR | Italy GDP Q/Q Q1 P | 0.20% | -0.10% | ||
| 08:00 | EUR | Germany GDP Q/Q Q1 P | 0.10% | -0.40% | ||
| 09:00 | EUR | Eurozone GDP Q/Q Q1 P | 0.10% | 0.00% | ||
| 12:00 | EUR | Germany CPI M/M Apr P | 0.60% | 0.80% | ||
| 12:00 | EUR | Germany CPI Y/Y Apr P | 7.30% | 7.40% | ||
| 12:30 | CAD | GDP M/M Feb | 0.20% | 0.50% | ||
| 12:30 | USD | Personal Income M/M Mar | 0.20% | 0.30% | ||
| 12:30 | USD | Personal Spending Mar | -0.10% | 0.20% | ||
| 12:30 | USD | PCE Price Index M/M Mar | 0.30% | 0.30% | ||
| 12:30 | USD | PCE Price Index Y/Y Mar | 4.60% | 5.00% | ||
| 12:30 | USD | Core PCE Price Index M/M Mar | 0.30% | 0.30% | ||
| 12:30 | USD | Core PCE Price Index Y/Y Mar | 4.50% | 4.60% | ||
| 12:30 | USD | Employment Cost Index Q1 | 1.10% | 1.00% | ||
| 13:45 | USD | Chicago PMI Apr | 43.7 | 43.8 | ||
| 14:00 | USD | Michigan Consumer Sentiment Index Apr F | 63.5 | 63.5 |
BoJ stands pat, to take 1-1.5 yrs to review monetary policy
BoJ keeps monetary policy unchanged as widely expected, by unanimous vote. Under the yield curve control, short-term policy interest rate is held at -0.10%. 10-year JGB yield will be kept at around 0% with bond purchases without upper limit. 10-year JGB yield will continue to be allowed to fluctuate in range of around plus and minus 0.50% from 0% level.
The central bank maintained the pledge to continue with Quantitative and Qualitative Monetary Easing with Yield Curve Control for "as long as it is necessary" for meeting inflation target in a "stable manner". It "will not hesitate to take additional easing measures if necessary". BoJ will conduct a "broad-perspective review of monetary policy", with a planned time frame of around 12 to 18 months.
In the new economic projections, while core inflation forecasts were upgraded, it's not expected to sustain at the 2% level throughout the horizon.
- Real GDP forecasts (versus January estimates):
- Fiscal 2023 at 1.4% (down from 1.7%).
- Fiscal 2024 at 1.2% (up from 1.1%).
- Fiscal 2025 at 1.0% (new)
- CPI Core forecasts (versus January estimates):
- Fiscal 2023 at 1.8% (up from 1.6%).
- Fiscal 2024 at 2.0% (up from 1.8%).
- Fiscal 2025 at 1.6% (new).
- CPI Core-Core forecasts (versus January estimates):
- Fiscal 2023 at 2.5% (up from 1.8%).
- Fiscal 2024 at 1.7% (up from 1.6%).
- Fiscal 2025 at 1.8% (new).
S&P 500 stays near term bullish after biggest rally since Jan
US stocks rallied strongly overnight, the DOW and S&P 500 recording their largest rallies since January, and NASDAQ since March. The turnaround in sentiment was driven by Meta's impressive quarterly performance, which saw shares close up 14%. Additionally, weaker-than-expected Q1 GDP data fueled expectations that Fed is getting closer to ending its tightening cycle, providing ammunition for pessimists to call for a potential rate cut before year-end should the economy continue to deteriorate.
Technically, DOW, S&P 500, and NASDAQ all found robust support from their respective 55 D EMA this week. In the case of SPX, the development keeps the rally from 3808.83 alive. Near-term outlook remains bullish as long as 4049.35 support level holds. Break of 4195.44 resistance will confirm resumption of the overall rebound from 3491.58.
Meanwhile, a critical obstacle lies in the 4325.28 cluster resistance (61.8% retracement of 4818.62 to 3491.58 at 4311.69) for SPX. Sustained break of this cluster resistance will pave the way for further rally towards historical high of 4818.62. The market's reaction to the 4300 handle will largely depend on next week's FOMC rate decision and Chair Jerome Powell's press conference.
Japan industrial production rose 0.8% mom, with signs of moderate pick up
Japan's industrial production expanded for the second consecutive month, recording a 0.8% mom growth in March, surpassing the expected 0.4% mom increase. The growth was driven by output in eight sectors, led by motor vehicles, while declines were observed in seven sectors, including electronic components and devices.
The Ministry of Economy, Trade and Industry upgraded its basic assessment for the month, stating that industrial production was "showing signs of moderately picking up" as parts supply shortages continued to ease. This is a marked improvement from the previous month's assessment of "weakening." The ministry also projects a further 4.1% growth in industrial production for April and a -2.0% decline in May.
Other economic indicators released include 7.2% yoy increase in retail sales for March, surpassing expectations of 6.5% yoy. However, unemployment rate rose for the second month in a row, reaching 2.8%, above expectation of 2.5%.
April, Tokyo core CPI, which excludes fresh food, accelerated from 3.2% to 3.5% yoy, exceeding expectations of 3.2% yoy. Core-core CPI, which excludes fresh food and fuel costs, accelerated from 3.4% to 3.8% year-on-year, marking the highest rate since April 1982.
RBA Board to Pause Again at its May Meeting: 3.6% Now the Likely Cash Rate Peak
The Reserve Bank Board meets next week on May 2.
Following the release of the March quarter inflation report Westpac now expects the Board to extend the pause it instigated at its April meeting to the May meeting.
This decision will be despite the likelihood that the FOMC will announce the decision to lift the federal funds rate by 0.25% to 5.125% two days after the RBA meeting (see below). However, as with the RBA, we do believe that this decision will mark the peak of the cycle.
We have always argued that May would likely be the peak of the tightening cycle so we are now lowering our forecast cash rate peak from 3.85% to 3.6%.
Given the uncertainty around the current outlook and a need to contain inflation expectations, the Board is almost certain to maintain its clear tightening bias. However, as we move through the remainder of 2023 the credibility of that bias is likely to fade.
In his recent speech on April 4 the Governor justified the pause in April by saying that it would: "give the Board more time to assess the economic outlook and the impact of the increases in interest rates so far." He expanded that: "This approach is consistent with our practice in earlier interest rate cycles … to move interest rates multiple times then wait for a while to assess the pulse of the economy and move again if the situation warranted doing so … it is a return to that world."
The key information available between the two meetings has been around the labour market and inflation.
The March employment report was relatively strong, indicating that, for now, the unemployment remained near 50-year lows. Given that the Board is aiming to return inflation to its target while retaining, as far as possible, the employment gains in recent years, this would not necessarily be viewed as 'bad news' if there was satisfactory progress on achieving the inflation objective.
The Governor describes the inflation objective in terms of reaching the top of the of the 2–3% target range by mid-2025.
That path has been laid out in the Bank's forecasts in the February Statement on Monetary Policy (SOMP). These have trimmed mean inflation slowing from 6.9%yr in December 2022 to 6.2%yr by June 2023, while headline inflation slows from 7.8%yr in December 2022 to 6.7%yr in June 2023.
These forecasts imply an expectation that the March inflation report would print at around 6.5–6.6%yr for trimmed mean and 7.2–7.3%yr for headline inflation.
It seems very unlikely that the staff's refreshed forecasts, which will be supplied to the Board at the May meeting, will indicate that the timing of the achievement of the inflation target needs to be pushed out further – a change that would require an immediate policy response from the Board.
Instead, it seems likely that the staff's forecasts for household spending and GDP growth in 2023 will be lowered somewhat, supporting the view that there is scope to pause (see below).
The March quarter inflation report printed 6.6%yr for the trimmed mean and 7.0%yr for headline inflation. The trimmed mean path is in line with expectations while the headline print looks to be slightly lower than expectations.
That result for the trimmed mean contrasts with the December quarter which printed 6.9%yr compared to the Bank's expectations of 6.5%yr – an upside surprise that prompted the hawkish shift in rhetoric following the February Board meeting.
With the inflation result in line with the Bank's forecast path for eventually achieving its inflation target, the Board can take time to allow a further assessment of the cumulative impact of 350bps of tightening. That includes assessing the lagged impact on the roughly 35% of mortgages that are progressing from fixed rate to much higher floating rate terms over the course of the next year or so. In this unusual cycle, rate increases do not end just because the RBA goes on hold.
The RBA Governor's comment in the speech about "a return to that world" points to linking further decisions to quarterly inflation reports. While useful, the monthly inflation indicators do not provide measures of underlying inflation, and a reliable link between the monthly headline measures and the quarterly headline measures has not yet been established.
If we look forward to the Bank's June quarter forecasts of 6.2%yr trimmed mean and 6.7%yr headline inflation, we expect these 'milestones' to be easily achieved. Indeed, our own forecasts have headline Inflation back to 4% by December 2023, compared to the Bank's current path which sees it back at 4.8%yr.
Indeed, our weaker growth and inflation path means that the need for further tightening will fade decisively in the second half of 2023.
We have argued for the last six months that the peak in the current cycle will be the May Board meeting. Our preference was for that peak to be 3.85%, with a final 25bp hike in May based on the 'here and now' – record low unemployment and very high inflation – rather than relying on forecasts. We still believe this would be the better policy approach given the risks, but it appears to be out of line with the Board's intentions.
If, as we now expect, the peak will be 3.6% there are now some upside risks to our growth and inflation profiles through the second half of 2023, although there also look to be downside risks to the first half forecasts.
These upside risks are also associated with our recently revised view that the housing market has stabilised and that immigration has lifted markedly.
On the downside, our already very weak profile for household spending may see a further downgrade given the prospect of a contraction in real retail sales in the March quarter. We are currently forecasting annual household spending growth to slow to 1.8% in the year to the June quarter and 0.7% in calendar 2023.
We currently forecast growth at 1% for 2023 with headline inflation at 4%.
These dynamics – materially below-trend growth and inflation closing in on the top of the inflation target – would be consistent with a rate cut cycle beginning in the March quarter. The upside risks to the growth and inflation outlook in the second half of 2023 raise the possibility that the rate cut cycle may begin somewhat later, although this is balanced somewhat by downside risks to our near-term profile.
With the uncertainty around next week's meeting, we will review these issues in light of the Board's decision next week.
Revised forecasts in the Statement on Monetary Policy
In his April 4 speech the Governor gave considerable attention to household spending. He revealed the Bank's forecast for spending growth in the March quarter of 0.2%qtr. That implies a likely downward revision to the February SOMP forecast for household consumption over the year to June 2023, from 2.5% to 2% or less. Household consumption growth for calendar 2023 could be lowered from 1.7% to 1% or less, in turn implying a possible downward revision to GDP growth in 2023 from 1.6% to 1.3-1.4%. At the margin these numbers will also have to incorporate a higher profile for population growth.
Conclusion
The inflation report is in line with the Board's path to achieving its stated objective of having inflation back at the top of the 2–3% target by mid-2025. This provides the Board with further scope to extend the pause we saw in April.
The Board will still retain its tightening bias but given that the next 'live' meeting is likely to be in August (following the release of the June quarter inflation report) and that the need for further tightening will have eased further by then, the cash rate appears to have peaked at 3.6%.
Change to FOMC Forecast for 2023
The FOMC also meet for their May meeting next week. Recent data has continued to point to the US economy losing momentum and growing downside risks related to activity and the labour market. Concerns around credit availability following the disruptions to the regional banks are also prevalent.
Regardless, comments made by FOMC members ahead of the pre-meeting blackout point to a desire to take out a little more insurance against inflation risks. Recognising this, we now forecast one final 25bp hike by the FOMC in May to 5.125%.
A lengthy pause thereafter is still expected, but the deterioration evident in consumer and business investment partials, the ongoing softening in the labour market and risks surrounding the banking system most likely mean that the first cut will now be seen in December, leaving the federal funds rate at 4.875% at end-2023, unchanged from our prior forecast.
By December 2023, we expect inflation to be back near the 2.0% target on an annualised basis, making way for an additional 200bps of cuts during 2024, leaving the fed funds rate at 2.875% end-2024.
The easing cycle we envisage for the FOMC will begin earlier and be more rapid than the RBA in recognition of the highly contractionary starting point and the likely more severe downturn than we are forecasting for Australia.
USD/JPY Aims Fresh Increase To 135.00, Oil Price Dips
Key Highlights
- USD/JPY could rise further if it clears the 134.20 resistance.
- It is facing a major bearish trend line with resistance near 134.25 on the 4-hour chart.
- EUR/USD is struggling to gain momentum above the 1.1075 resistance.
- The US Personal Income could increase by 0.2% in March 2023 (MoM).
USD/JPY Technical Analysis
The US Dollar started a downside correction from the 135.15 zone against the Japanese Yen. USD/JPY declined below 134.00 but remained supported near 133.00.
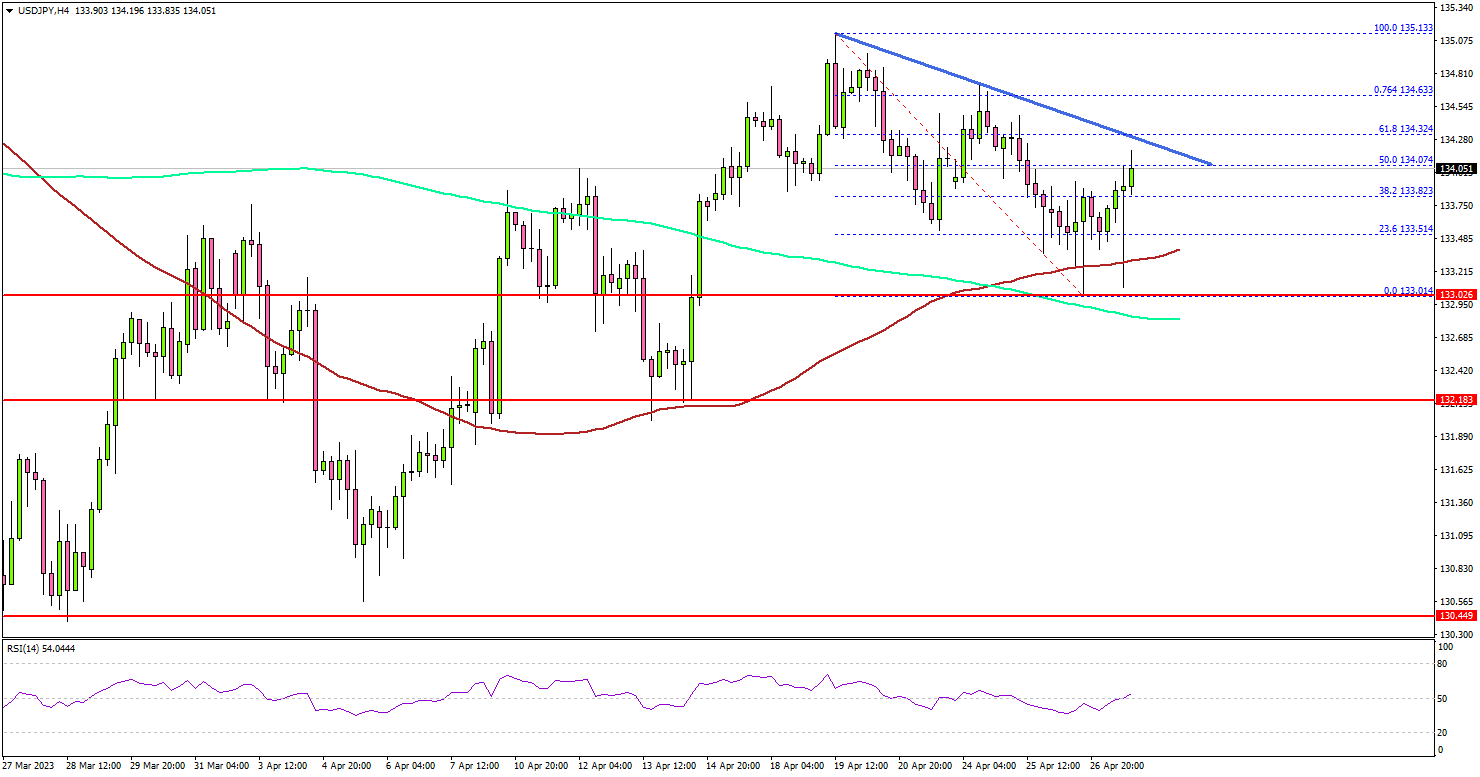
Looking at the 4-hour chart, the pair remained stable above the 133.00 zone, the 100 simple moving average (red, 4 hours), and the 200 simple moving average (green, 4 hours).
The pair is now attempting a fresh increase above the 133.50 resistance. Immediate resistance on the upside is near the 134.20 level. There is also a major bearish trend line forming with resistance near 134.25 on the same chart.
The next major resistance is near the 134.60 level. A clear upside break and close above the 134.60 resistance might send the pair toward 135.00.
The next key resistance is near the 135.15 zone. Any more gains might send the pair toward 136.20. On the downside, there is major support near 133.40 and the 100 simple moving average (red, 4 hours).
The next major support sits near the 133.00 level, below which the pair might accelerate lower. In the stated case, USD/JPY could visit the 132.20 support zone.
Looking at EUR/USD, the pair attempted a fresh increase above the 1.1075 resistance but failed to gain bullish momentum.
Economic Releases
- Euro Zone Gross Domestic Product for Q1 2023 (Prelim) (QoQ) - Forecast 0.2%, versus 0% previous.
- US Personal Income for March 2023 (MoM) - Forecast +0.2%, versus +0.3% previous.
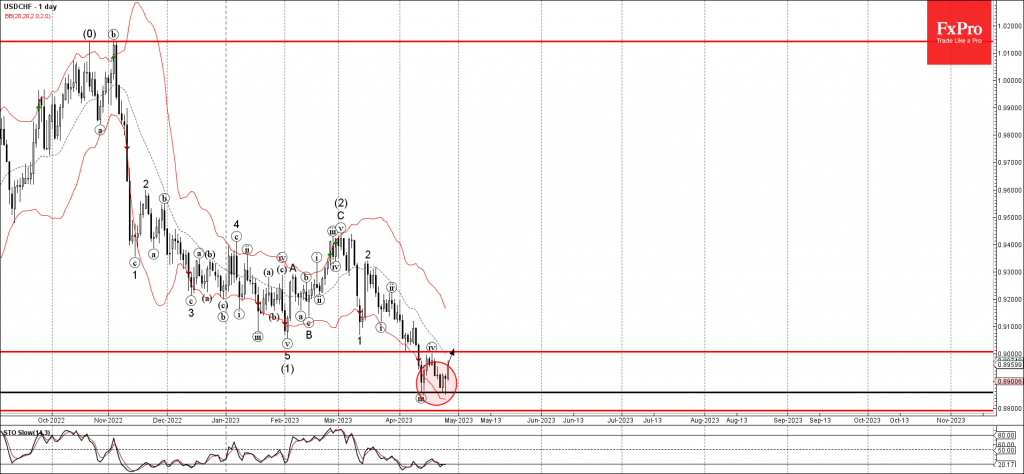
USDCHF Wave Analysis
- USDCHF reversed from support level 0.8860
- Likely to rise to resistance level 0.9000
USDCHF currency pair recently reversed up from the key support level 0.8860 (which stopped the previous impulse wave (iii) at the start of this month).
The support zone near the support level 0.8860 was further strengthened by the lower daily Bollinger Band.
Given the strength of the support level 0.8860 and the bullish divergence on the daily Stochastic, USDCHF currency pair can be expected to rise further toward the next round resistance level 0.9000 (top of the previous correction (iv)).