

Sample Category Title
EUR/GBP Daily Outlook
Daily Pivots: (S1) 0.8802; (P) 0.8850; (R1) 0.8918; More...
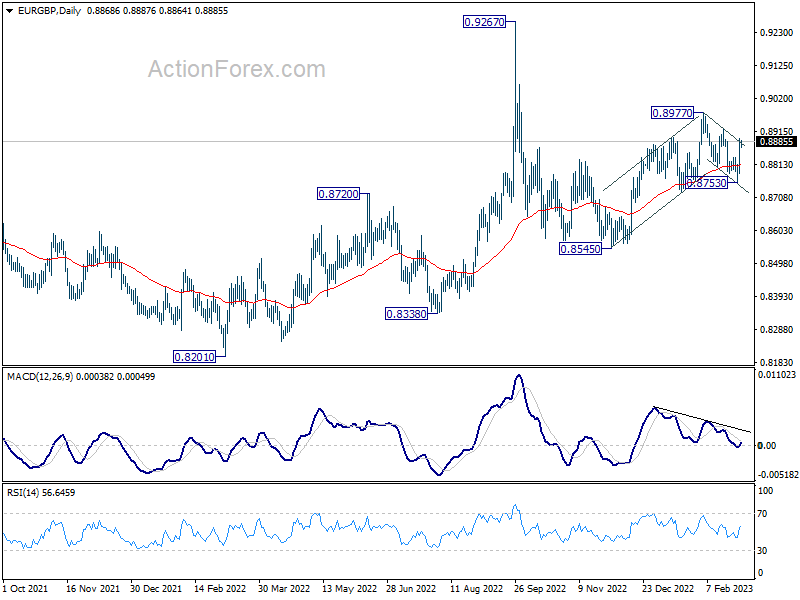
Intraday bias in EUR/GBP stays on the upside for the moment. Corrective fall from 0.8977 should have completed with three waves down to 0.8753, ahead of 0.8720 support. The development in turn suggests that rise from 0.8545 is not over. Further rise should be seen back to retest 0.8977 next.
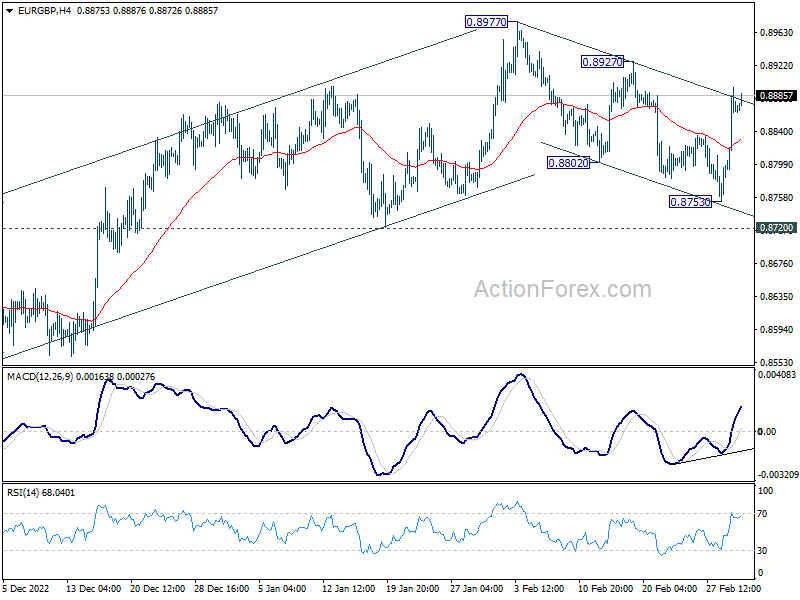
In the bigger picture, outlook is rather mixed for now, except that price actions from 0.9267 (2022 high) are part of the long term range pattern from 0.9499 (2020 high). With 0.8720 support intact, rise from 0.8545 is in favor to continue through 0.8977. However, firm break of 0.8720 will argue that such rebound has completed, and open up deeper fall through this support level.
EUR/AUD Daily Outlook
Daily Pivots: (S1) 1.5694; (P) 1.5761; (R1) 1.5853; More...
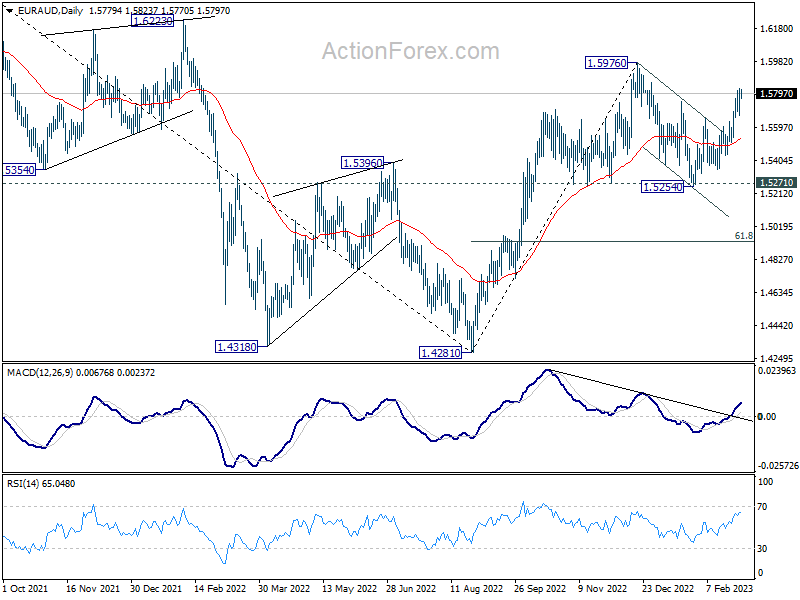
EUR/AUD's rally from 1.5254 resumed after brief consolidations. Intraday bias is back on the upside. Outlook is unchanged that corrective fall from 1.5976 has completed at 1.5254. Further rise should be seen to retest 1.5976 high. On the downside, below 1.5668 minor support will turn intraday bias neutral again.
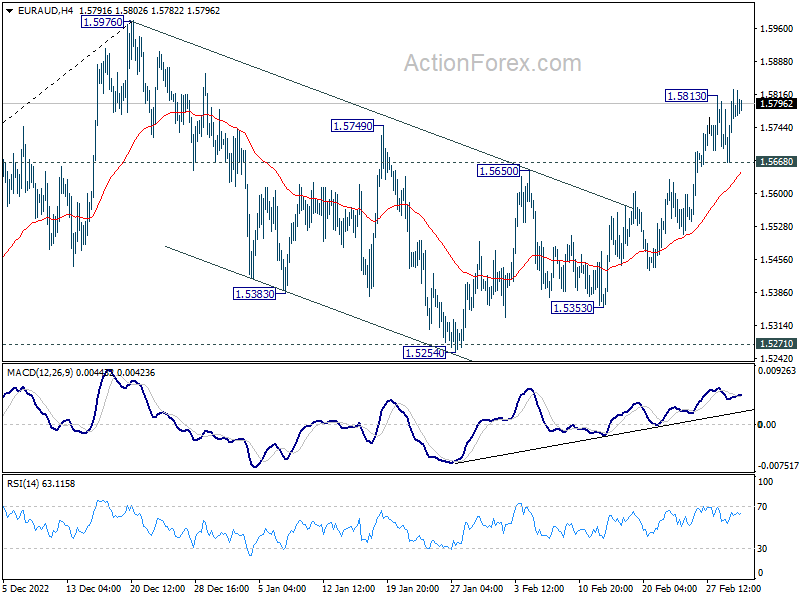
In the bigger picture, it's still early to confirm if rise from 1.4281 represents bullish trend reversal. But as long as 1.5271 support holds, such rally is in favor to continue. Break of 1.5976 will target 1.6434 key resistance next. On the other hand, firm break of 1.5271 will retain medium term bearishness instead.
Higher Yields Weigh on Equity Valuations as Inflation Heats Up
Europe is not having a good week in terms of economic news.
Today, investors will be focused on the flash CPI estimate for February, but there is not much suspense about the fact that the data will disappoint. On Tuesday, the data showed that French inflation hit a record, Spanish inflation ticked higher as well, and yesterday, it was Germans’ turn to announce the bad results. Inflation in Germany ticked higher to 9.3% last month, even after the country limited household heating costs. Therefore, it’s very likely that the Eurozone CPI, due this morning, is not going to hit the 8.2% mark expected by analysts.
The euro depreciation is to blame.
But the pricing in European markets already reflect, at least, a good part of the inflation disappointment: the European Central Bank’s (ECB) peak rate is expected to reach 4% into next year, and some ECB members now back the idea of a more rapid reversal in bond buying to tighten the financial conditions faster. Bundesbank Nagel is one of them. He also thinks that the ECB should speed up the rate hikes and reach the peak rate around September.
As a result, the hotter-than-expected inflation data pushes the European yields higher. The higher yields support recovery in the euro. The EURUSD spiked to 1.0690 yesterday, while the European stocks fell after the German CPI figures and the disappointing PMI data flashed the bulls out of the market.
Note that today’s inflation data may not make things worse; we could even see ‘buy the rumour sell the fact’ type of move, where the yields soften, the euro gives back some strength and equities rebound.
But the medium-term outlook for the European yields remains tilted to the upside. The latter should support the euro, but not the stock valuations.
The grass is not greener elsewhere
Across the Atlantic Channel, the news is not great, either. The ISM manufacturing index revealed a slower contraction in February, but the improvement compared to the last month was less than expected.
A slowing economic growth is not bad news for the Federal Reserve (Fed), but the mounting price pressure is. This is what the ISM report revealed yesterday.
Fed’s Neel Kashkari, who was once one of the most dovish Fed members, said that he may back a 50bp at this month’s FOMC meeting, while Raphael Bostic said that the Fed should hike the rates to 5-5.25% territory, and keep them there until next year.
Activity on Fed funds futures now gives more than 30% chance for a 50bp hike at the next meeting, and Fed swaps price in a peak Fed rate of around 5.5%. This number was around 4.9% at the start of the year.
Consequently, the US 2-year yield continues its steady climb toward to 5% mark, and the 10-year spiked above the 4% psychological level yesterday.
The S&P500 tested the critical 200-DMA to the downside. There is major speculation about an aggressive selloff below this 200-DMA level. And given the persistent positive pressure on the yields, clearing the 200-DMA support is not a matter of if, but a matter of when.
The higher yields are supportive of the US dollar. The dollar index swings up and down, above the minor 23.6% Fibonacci retracement on the September to February retreat.
If the dollar’s reaction to the hawkish Fed expectations is not more aggressive, it’s certainly because other major central banks are also gearing up the rate talk. The Bank of Japan’s 8BoJ) Ueda said he would consider normalizing policy if inflation remained sticky in Japan, while the Bank of England’s (BoE) Bailey warned that if they do ‘too little with interest rates now’, they will ‘have to do more later on.’ Sure thing. The latest BRC report showed that shop prices in the UK indeed hit a record. But traders are not necessarily in to keeping the pair above the 1.20 level. The next natural target for the Cable bears stands at 1.1920, near the 200-DMA, and if cleared could pave the way for a further slide to 1.1650/1.17 region.
In energy and commodities, US crude jumped more than 1% yesterday as the EIA data was much less scary than the API data released a day before. While the API hinted at around a 6-mio-barrel build in US inventories last week, the EIA printed a 1.2-mio-barrel build.
But the 50-DMA is still not cleared, and even if it did, offers into the 100-DMA, slightly below the $80pb level, still look particularly strong.
As a result, the energy stocks were the worst performing in February, despite their record profits. There are worries that the Chinese reopening may not be enough to push prices higher… after all, and latest news suggest that Western companies are racing to quit the country, as tense geopolitical relations with China, and Xi Jinping’s economic and political agenda don’t inspire confidence.
Inflation in Focus
Market movers today
Focus today is on the euro area flash HICP figures for February. Country inflation data have surprised on the upside this week and suggest a renewed uptick in headline inflation to 8.8%, with core inflation likely marking yet another record high from January's 5.3%. With the economy and labour market holding up better than expected, 'stickily' high core inflation could remain a worry for ECB for some time yet and markets have already started to price in more rate hikes. We also get the ECB minutes from the February meeting.
Otherwise it's a very quiet day with only US initial jobless claims on the radar. These are running at a low level adding to the picture of a strong US labour market.
In the Nordics, we get Danish currency reserve data this afternoon.
The 60 second overview
US: ISM manufacturing rose to 47.7 in February and thus remains in contractionary territory but perhaps more interestingly, the prices paid sub-index jumped to 51.3 from 44.5, which could suggests that producer prices are rising again, albeit at a slow pace. The employment sub-index fell below 50, but that is unlikely to deter the current view of other indicators of a strong US jobs market.
Fed: Fed members appear comfortable with the latest tightening in financial conditions, as Kashkari continued the recent hawkish comments by flagging upside risks to his December terminal rate forecast of 5.25-5.50%. Atlanta Fed's Bostic was more moderate and only saw two more 25bp hikes, yet he emphasized that rate cuts were off the table 'well into 2024', largely in line with our view.
Germany: German inflation unexpectedly rose in January to 9.3% from 9.2% despite a further drop in energy price inflation.
Equities: Equities had a bit of roller-coaster day yesterday with massive outperformance from Asia and Asian/China related stocks. Yesterday yet another day with high inflation/price prints (CPI in Germany, and ISM in US). Hence yet another day with the overheating theme dominating and higher yields taking the optimism away from equity investors. However, still a day where materials, industrials and financials outperformed while utilities underperformed. In US yesterday, Dow +0.02%, S&P 500 -0.5%, Nasdaq -0.7% and Russell 2000 +0.1%. Asian markets are mixed this morning. The same goes for European and US futures where the growth-intense indices are lower and value intense are higher.
FI: The market continues to push the terminal rate from both the Federal Reserve and ECB higher on the back of stronger economic data. Hence, the terminal rate by the Federal Reserve is now at 5.5%, while the ECB is at 4%. This is also reflected in the government bond yields that are moving higher.
FX: EUR generally rallied yesterday on the back of rising yields in the Euro Area, as inflationary pressures seem to persist, implying increasing expectations for ECB's terminal rate. Further, strong PMIs from China (anticipated positive spill-over effects likely larger to Euro Area economy relative to US) sent EUR/USD well above 1.06. EUR also appreciated rather significantly against SEK, NOK and GBP.
Credit: Though European equities closed in red, credit indices managed to tighten marginally, with iTraxx Xover closing 1.5bp tighter and Main 0.3bp. Primary took a breather, with only a few issuers tapping the market. However, CaixaBank showed that high-beta issues can still be absorbed as they brought a PerpNC6.5 AT1 to market, which was more than 3x oversubscribed.
EUR/CHF Daily Outlook
Daily Pivots: (S1) 0.9980; (P) 1.0004; (R1) 1.0049; More....
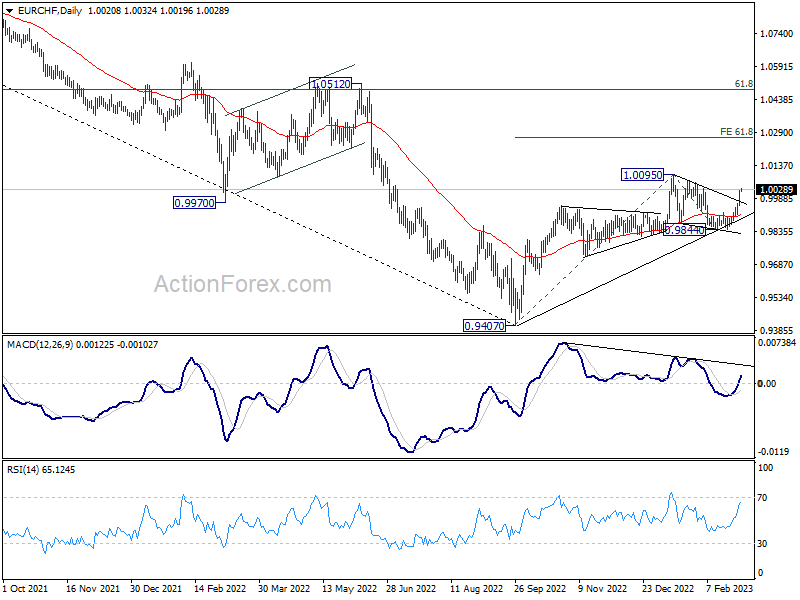
Intraday bias in EUR/CHF stays on the upside as rise from 0.9844 is in progress. The strong break of trend line resistance adds to the case that corrective pattern from 1.0095 should have completed with three waves down to 0.9844. Further rally should be seen back to retest 1.0095 high. On the downside, below 0.9996 minor support will turn intraday bias neutral and bring consolidations, before staging another rally.
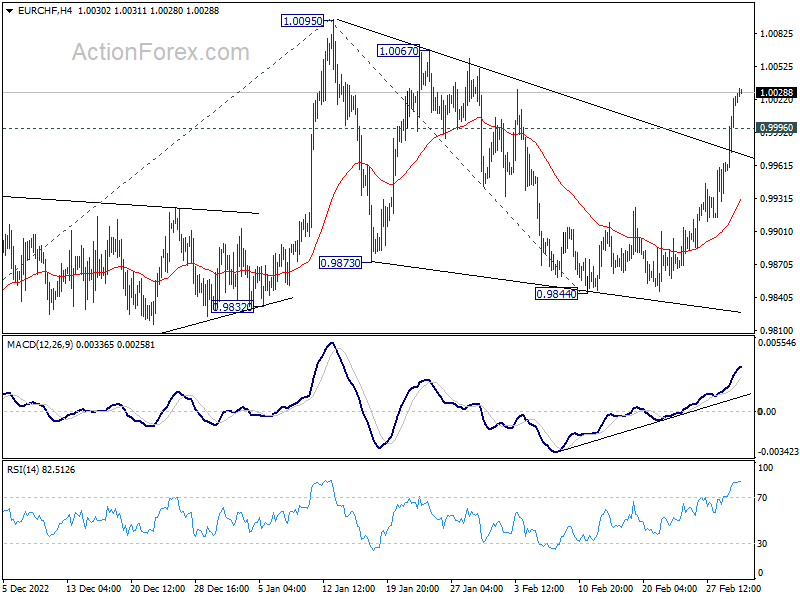
In the bigger picture, with 0.9832 support intact, rise from 0.9407 (2022 low) is still expected to continue. Break of 1.0095 and sustained trading above 55 week EMA (now at 1.0021) will be a medium term bullish signal, and bring further rally to 1.0505 cluster resistance (2020 low at 1.0505, 61.8% retracement of 1.1149 to 0.9407 at 1.1484). However, firm break of 0.9832 support will revive medium term bearishness and bring retest of 0.9407 low instead.
Euro Pauses Ahead of Eurozone Flash CPI Data
Euro is digesting this week's gains in Asian session, as traders turn their focus to flash CPI data from Eurozone. Market analysts believe that a 50bps hike by ECB this month is already a "done deal", as affirmed by rate-setters on several occasions. However, how far ECB will go with tightening measures depends very much on the upcoming economic projections, which are expected to be impacted by today's data release.
Elsewhere in market, Dollar is also showing some strength, supported by extended rally in treasury yields. On the other hand, Swiss Franc and Sterling, along with Aussie and Kiwi, are experiencing weakness.
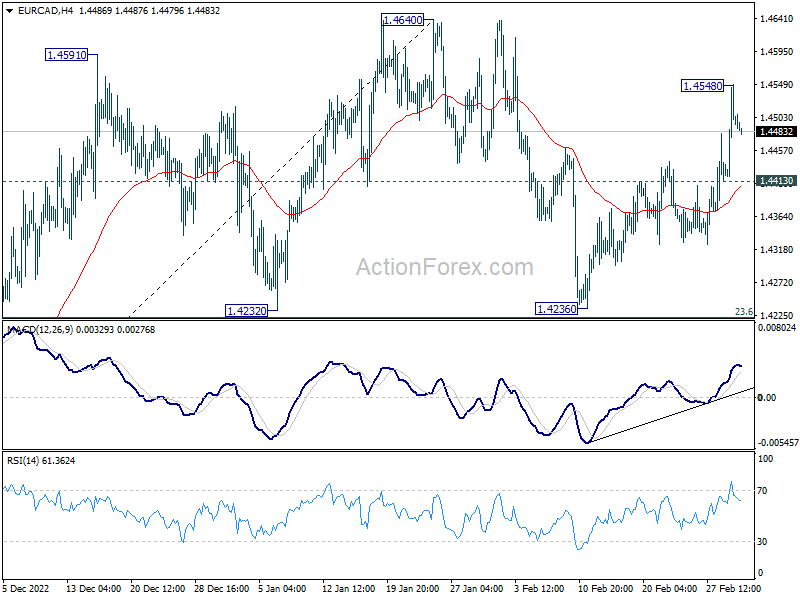
From a technical perspective, rebound of EUR/CAD from 1.4236 is currently taking a breather after reaching 1.4548. However, further rise is expected as long as the minor support level at 1.4413 holds. A break above 1.4548 will target 1.4640 high, and a decisive break there should resume larger uptrend from 1.2867. Furthermore, if a break of 1.4640 occurs, it could also be accompanied by a stronger rebound in EUR/USD towards 1.1032 high.
In Asia, Nikkei dropped -0.06%. Hong Kong HSI is down -0.73%. China Shanghai SSE is up 0.06%. Singapore Strait Times is down -0.59%. Japan 10-year JGB yield is up 0.0003 at 0.508. Overnight, DOW rose 0.02%. S&P 500 dropped -0.47%. NASDAQ dropped -0.66%. 10-year yield rose 0.078 to 3.994, after hitting 4.006.
US 10-year yield breaks 4% on inflation worry, more upside ahead
US treasury yields marched higher overnight, and look set to extend rally today. Two-year yield hit its highest level in 16 years and could soon challenge the 5% handle, while 10-year yield remains above the 4% handle in the Asian session.
It's believed that persistent worries about inflation remaining at a higher level for an extended period are driving the moves. As a result, Fed may respond by accelerating the tightening pace again. There is growing expectation in the market that Fed will implement a 50bps rate hike on March 22, with a 30% chance of this happening compared to 24% a week ago. Moreover, there is a 55% chance that rate will peak at 5.50-5.75% in July.
Furthermore, the recent surge in European yields is considered an even stronger reason for the rally in US yields. The recovery in EUR/USD reflects this sentiment. Germany 10-year yield hitting the highest level since 2011 on similar worries about inflation and ECB policies. A peak above 4% for ECB is more likely than ever before, while a rate cut this year is all but ruled out.
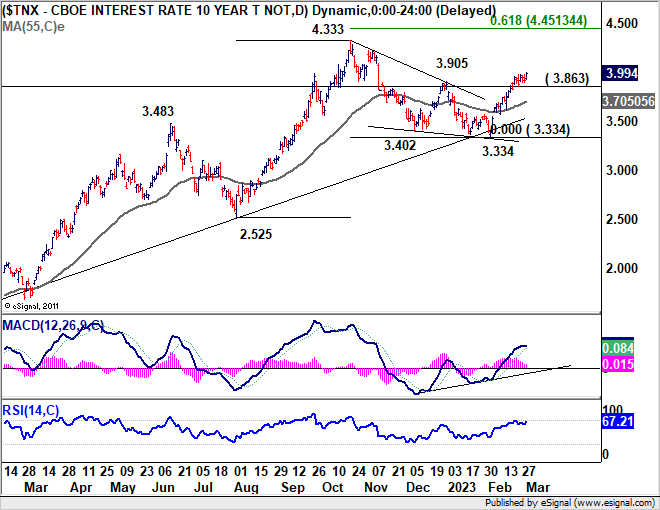
From a technical perspective, as long as the support level at 3.863 holds, the rally in US 10-year yield from 3.334 is expected to continue. The current development affirms that correction from 4.333 has completed with three waves down to 3.334. A retest of 4.333 is likely to occur next. While it is still early to predict, the TNX could eventually hit the 61.8% projection of 2.525 to 4.333 from 3.334 at 4.451 before topping out.
Fed Kashkari: Risk of under-tightening greater than over-tightening
Minneapolis Fed President Neel Kashkari said yesterday that he is "open-minded" on either a 25bps or a 50bps rate hike at the March meeting. But he also noted, "I think my colleagues agree with me that the risk of under-tightening is greater than the risk of over-tightening
Kashkari also said, "what's more important is what we signal in the dot plot… At this point I haven't decided what my dot is, but I would lean towards continuing to push up my rate and policy path,"
"Given the data in the last month — the inflation report and strong jobs report — these are concerning data points suggesting we're not making progress as fast as we'd like," Kashkari said. "At same time we don't want to overreact."
Fed Bostic wants rate at 5-5.25% until well into 2024
Atlanta Fed President Raphael Bostic said Fed should hike by 50bps to 5.00-5.25%, and hold it at that level until well into 2024. "We must determine when inflation is irrevocably moving lower," he wrote in an essay. "We're not there yet."
"That's why I think we need to raise the federal funds rate to between 5-5.25% and leave it there well into 2024. This will allow tighter policy to filter through the economy and ultimately bring aggregate supply and aggregate demand into better balance and thus lower inflation."
"If we are going to get inflation back in the range of our target, the breadth of inflation will have to narrow considerably," Bostic wrote. "When inflation is no longer top of mind, our mission will largely be accomplished. We are clearly not there yet. But I—and the Committee—are committed to doing all we can to ensure that we get there as soon as possible."
BoJ Takata: We need to patiently maintain monetary easing
BoJ board member Hajime Takata said said in a speech today, "now is the time where the BOJ must scrutinise whether the economy and prices can achieve a sustained, positive cycle."
"While we need to be mindful of the impact of our massive stimulus program on market function, we're at a stage where we need to patiently maintain monetary easing," he said.
Looking ahead
Eurozone CPI flash is a major focus in European session while unemployment rate will be released too. ECB minutes will also be published. Later in the day, US will release jobless claims and non-farm productivity.
EUR/CHF Daily Outlook
Daily Pivots: (S1) 0.9980; (P) 1.0004; (R1) 1.0049; More....
Intraday bias in EUR/CHF stays on the upside as rise from 0.9844 is in progress. The strong break of trend line resistance adds to the case that corrective pattern from 1.0095 should have completed with three waves down to 0.9844. Further rally should be seen back to retest 1.0095 high. On the downside, below 0.9996 minor support will turn intraday bias neutral and bring consolidations, before staging another rally.
In the bigger picture, with 0.9832 support intact, rise from 0.9407 (2022 low) is still expected to continue. Break of 1.0095 and sustained trading above 55 week EMA (now at 1.0021) will be a medium term bullish signal, and bring further rally to 1.0505 cluster resistance (2020 low at 1.0505, 61.8% retracement of 1.1149 to 0.9407 at 1.1484). However, firm break of 0.9832 support will revive medium term bearishness and bring retest of 0.9407 low instead.
Economic Indicators Update
| GMT | Ccy | Events | Actual | Forecast | Previous | Revised |
|---|---|---|---|---|---|---|
| 21:45 | NZD | Terms of Trade Index Q4 | 1.80% | -1.70% | -3.40% | -3.90% |
| 23:50 | JPY | Capital Spending Q4 | 7.70% | 6.90% | 9.80% | |
| 23:50 | JPY | Monetary Base Y/Y Feb | -1.60% | -3.20% | -3.80% | |
| 00:30 | AUD | Building Permits M/M Jan | -27.60% | -7.60% | 18.50% | |
| 05:00 | JPY | Consumer Confidence Feb | 31.1 | 32 | 31 | |
| 09:00 | EUR | Italy Unemployment Jan | 7.80% | 7.80% | ||
| 10:00 | EUR | Eurozone Unemployment Rate Jan | 6.60% | 6.60% | ||
| 10:00 | EUR | Eurozone CPI Y/Y Feb P | 8.20% | 8.60% | ||
| 10:00 | EUR | Eurozone CPI Core Y/Y Feb P | 5.30% | 5.30% | ||
| 12:30 | EUR | ECB Monetary Policy Meeting Accounts | ||||
| 13:30 | USD | Initial Jobless Claims (Feb 24) | 196K | 192K | ||
| 13:30 | USD | Nonfarm Productivity Q4 | 2.50% | 3.00% | ||
| 13:30 | USD | Unit Labor Costs Q4 | 1.40% | 1.10% | ||
| 15:30 | USD | Natural Gas Storage | -72B | -71B |
US 10-year yield breaks 4% on inflation worry, more upside ahead
US treasury yields marched higher overnight, and look set to extend rally today. Two-year yield hit its highest level in 16 years and could soon challenge the 5% handle, while 10-year yield remains above the 4% handle in the Asian session.
It's believed that persistent worries about inflation remaining at a higher level for an extended period are driving the moves. As a result, Fed may respond by accelerating the tightening pace again. There is growing expectation in the market that Fed will implement a 50bps rate hike on March 22, with a 30% chance of this happening compared to 24% a week ago. Moreover, there is a 55% chance that rate will peak at 5.50-5.75% in July.
Furthermore, the recent surge in European yields is considered an even stronger reason for the rally in US yields. The recovery in EUR/USD reflects this sentiment. Germany 10-year yield hitting the highest level since 2011 on similar worries about inflation and ECB policies. A peak above 4% for ECB is more likely than ever before, while a rate cut this year is all but ruled out.
From a technical perspective, as long as the support level at 3.863 holds, the rally in US 10-year yield from 3.334 is expected to continue. The current development affirms that correction from 4.333 has completed with three waves down to 3.334. A retest of 4.333 is likely to occur next. While it is still early to predict, the TNX could eventually hit the 61.8% projection of 2.525 to 4.333 from 3.334 at 4.451 before topping out.
Technical Outlook and Review
DXY:
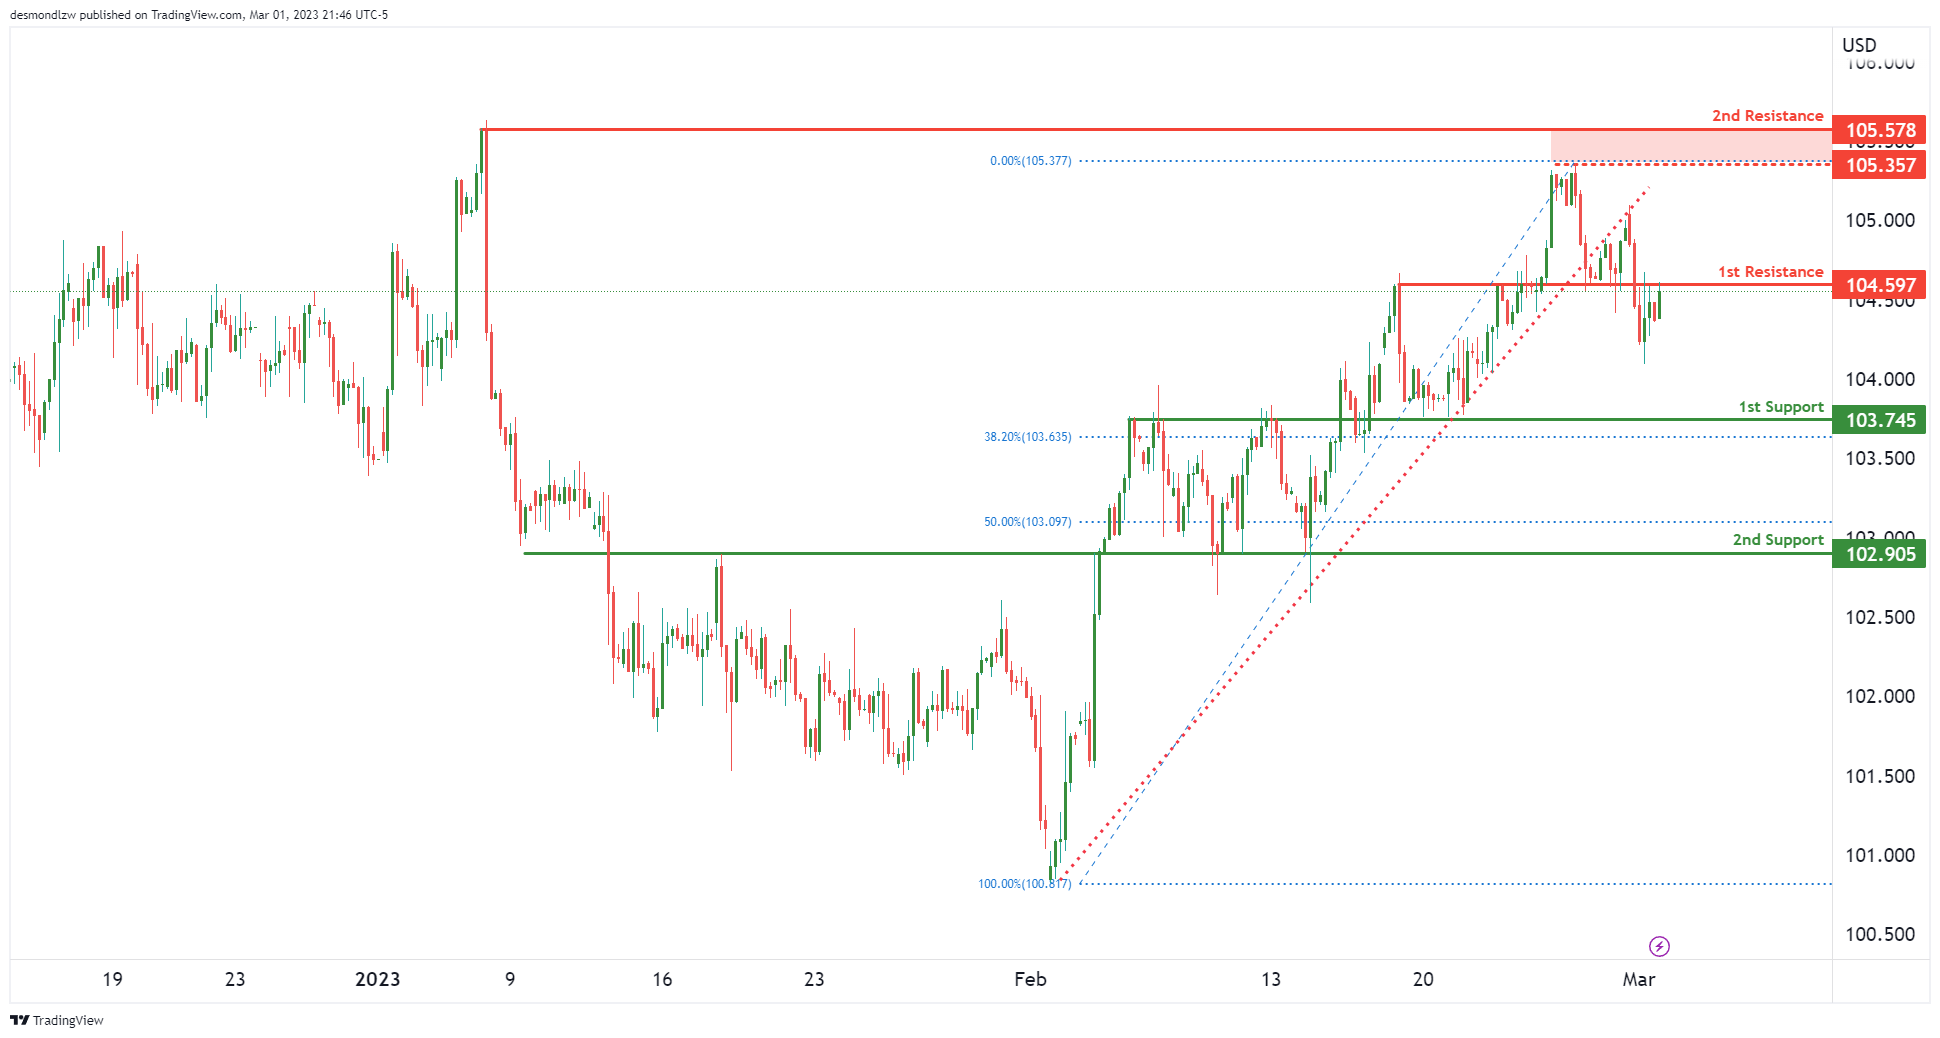
Price is testing our 1st resistance at 104.59 which is an overlap resistance. Reversing from here could see it drop to our 1st support at 103.74 which lines up with our 38.2% Fibonacci retracement. Breaking that level could see a further drop to 2nd support at 102.90 that lines up with our 50% Fibonacci retracement.
It’s worth noting that price has recently broken our ascending support-turned-resistrance trend line suggesting a possible change in momentum from bullish to bearish.
EUR/USD:
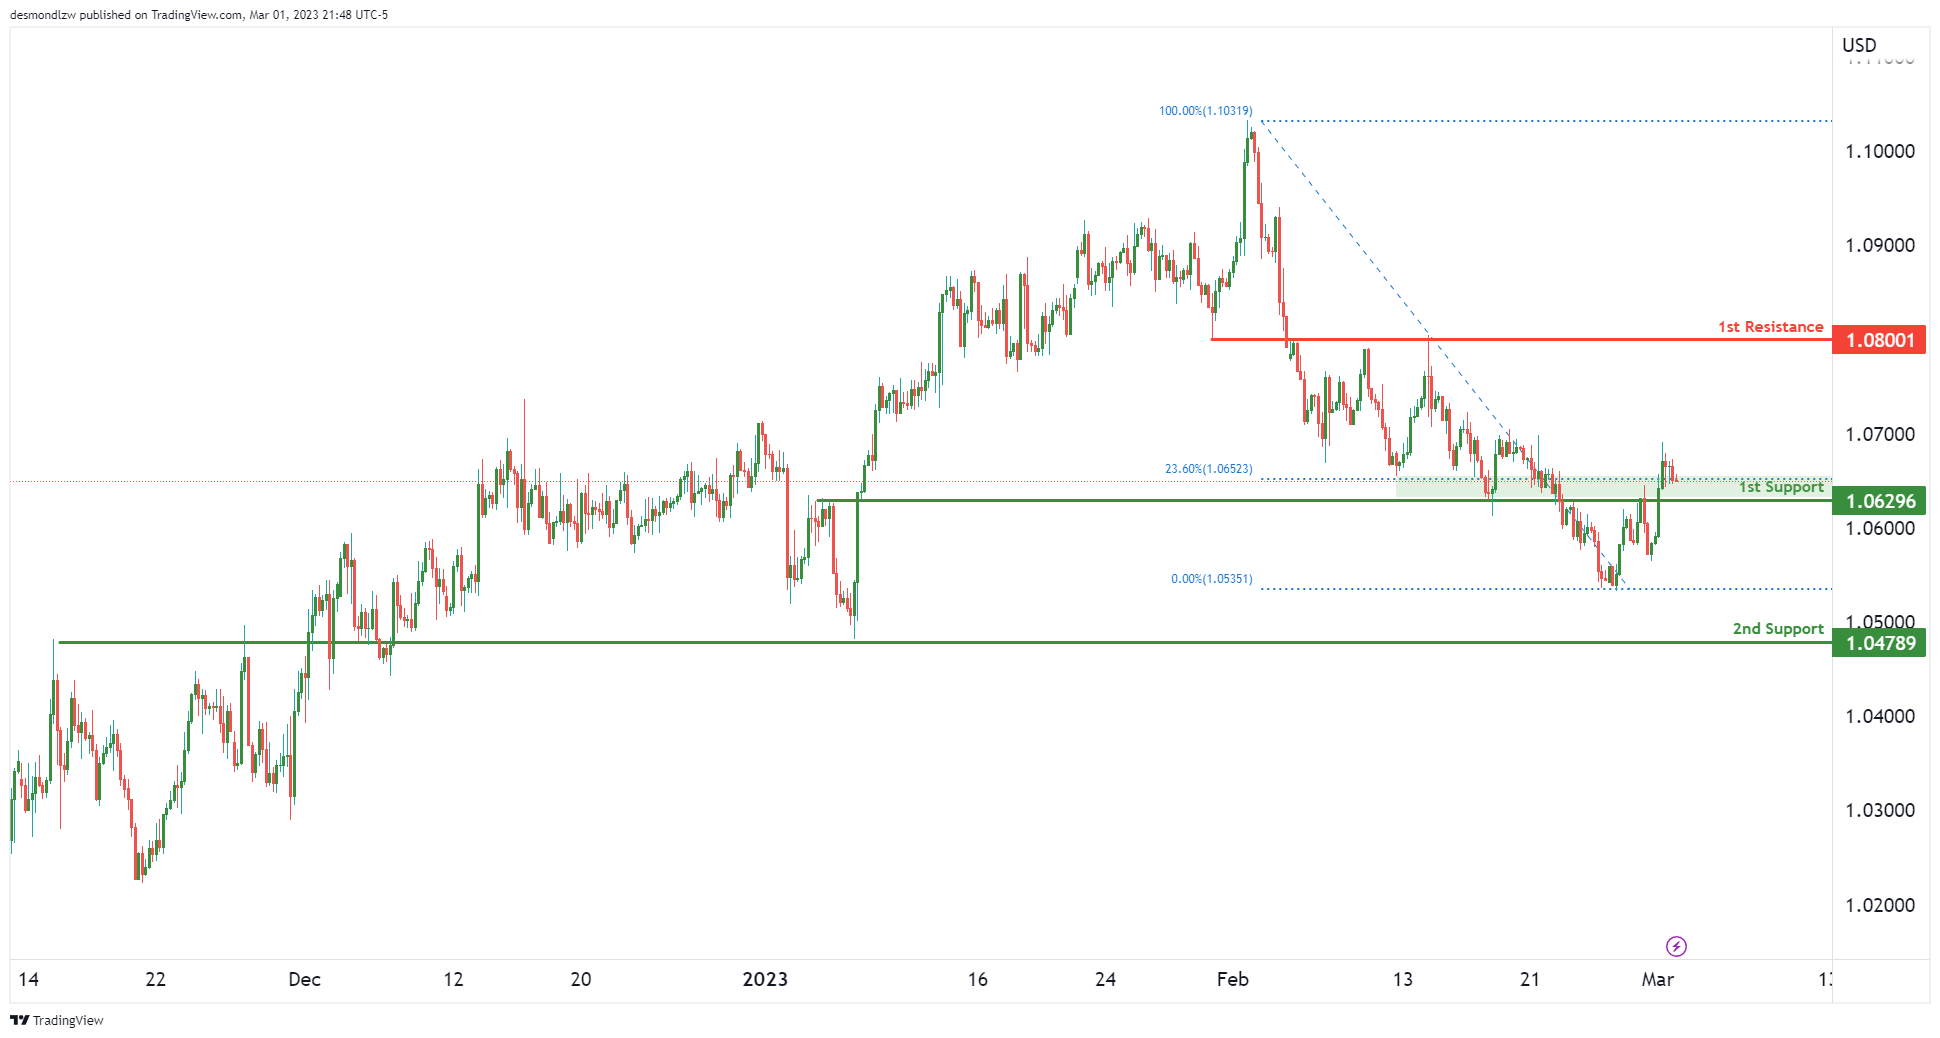
Price is testing our 1st support at 1.0629 which lines up with the 23.6% Fibonacci retracement – this Fibonacci retracement is traditionally seen as the first retracement that needs to be broken to trigger a bigger move up. If price were to bounce from here, the 1st resistance to watch out for is 1.0800.
Were prices to drop from here, the overlap support we’re looking at is down at 1.0478.
GBP/USD:
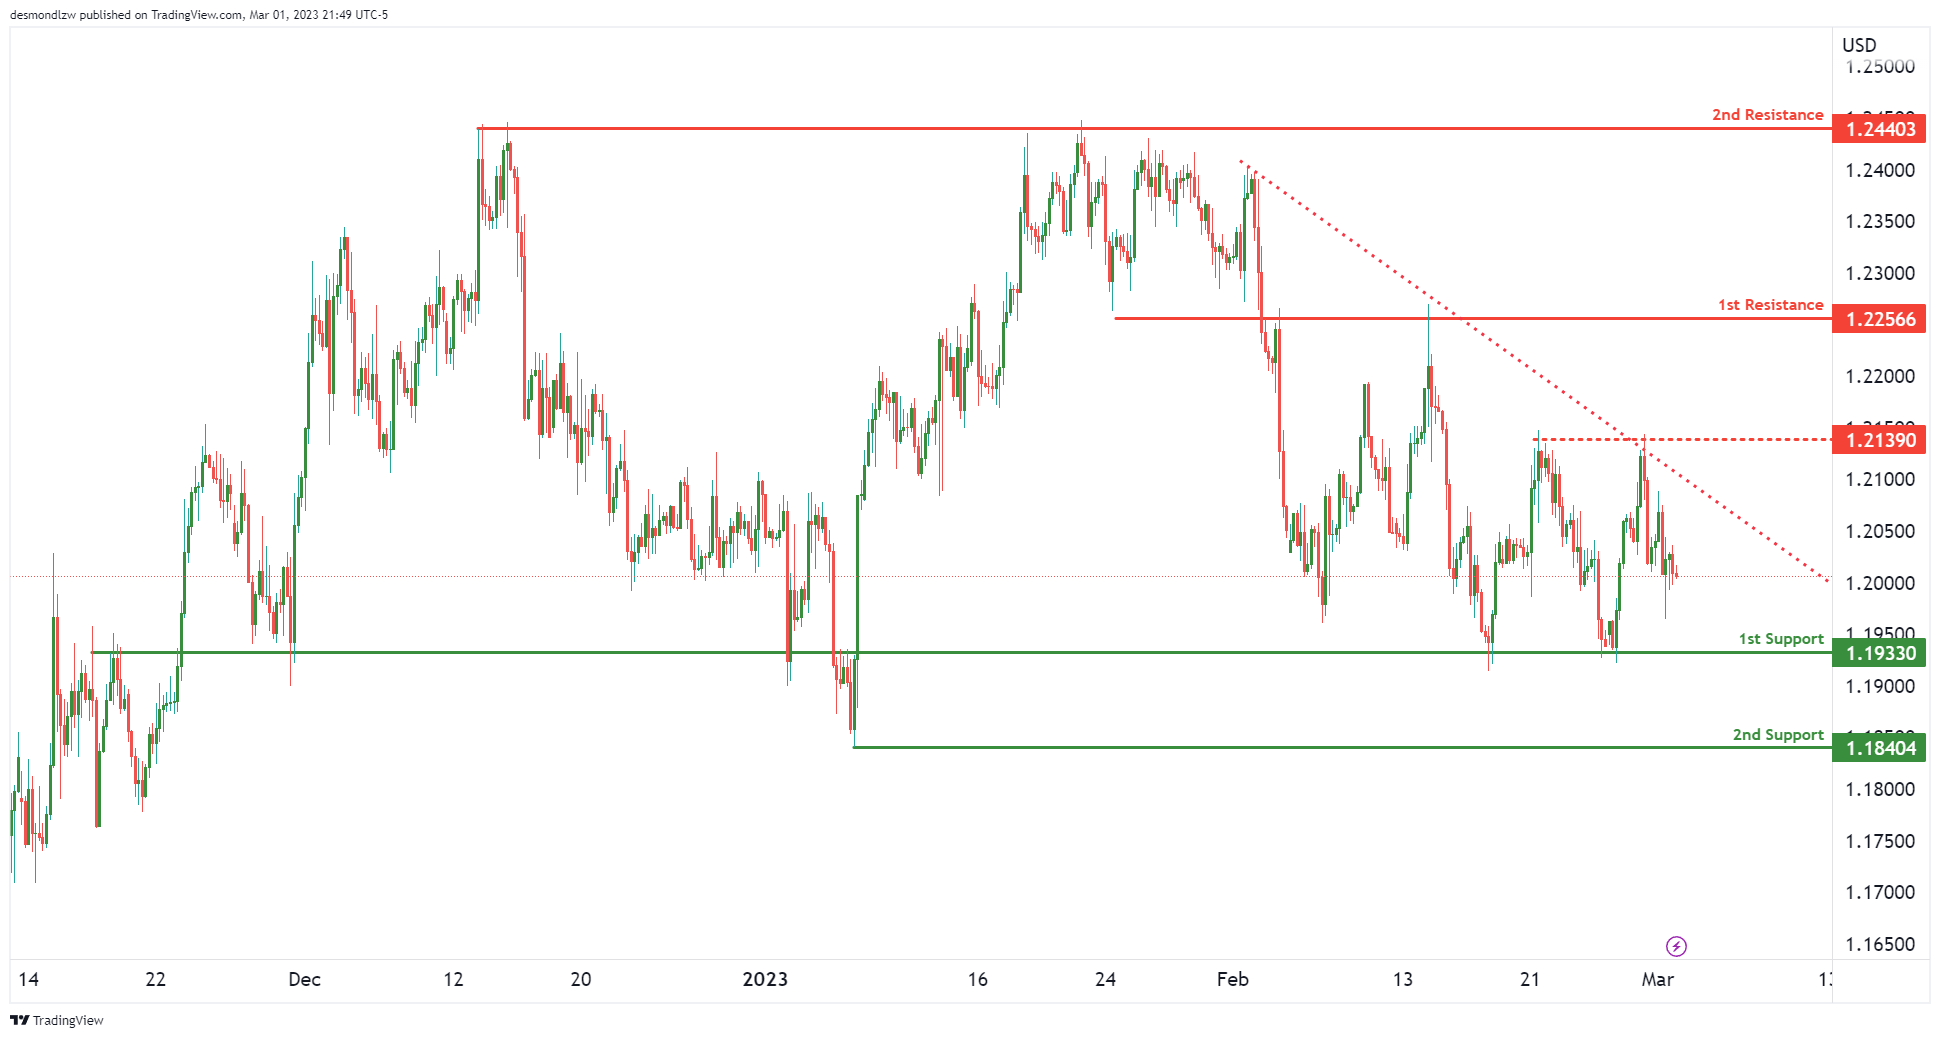
Price is seeing a descending resistance line squeeze it against our 1st support at 1.1933 which is a strong overlap support. If prices were to break this 1st support, the next key support to watch out for is the recent swing low at 1.1840.
In terms of resistance, our intermediate resistance is at 1.2139 which is a double swing high resistance. Breaking this, along with the descending resistance trend line, could trigger a move up to 1.2256 which is our 1st resistance.
USD/CHF:
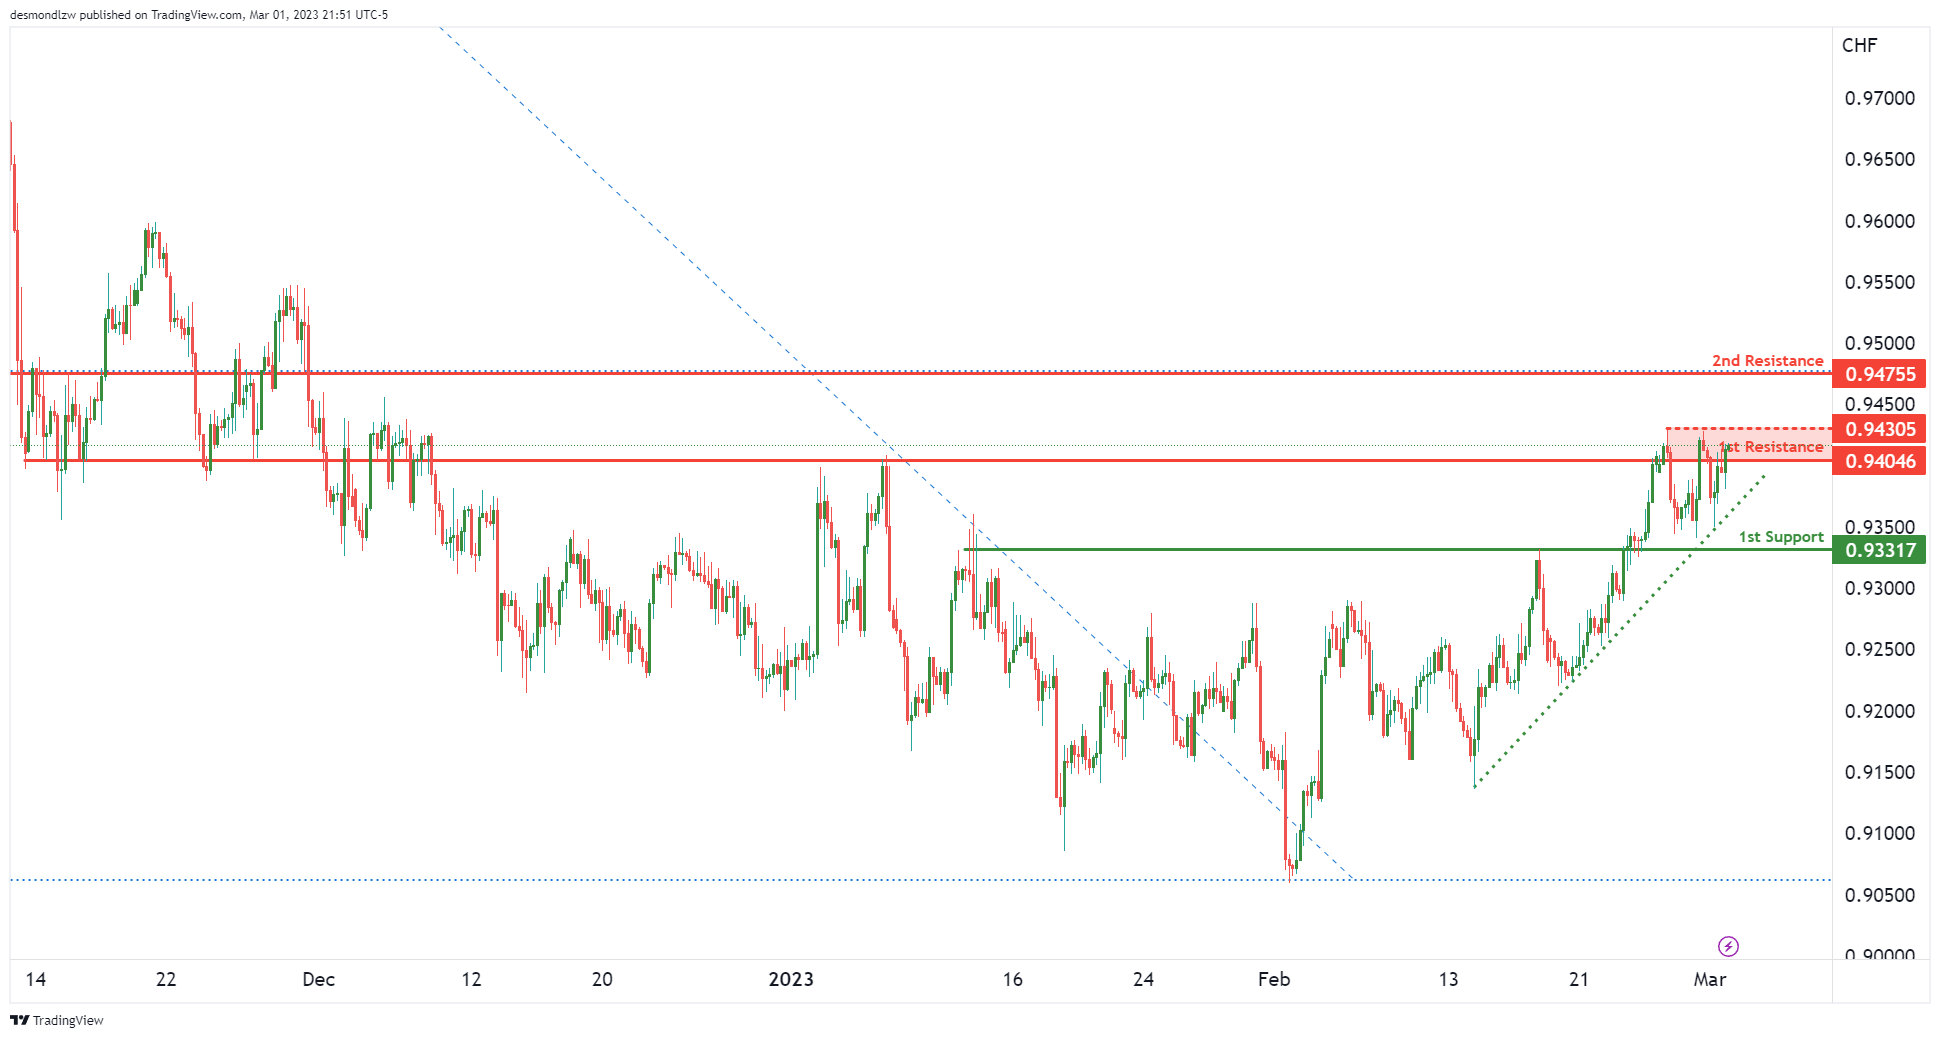
Price is seeing an ascending support line continue to push it up against our 1st resistance area of 0.9430. If price were to break this level, we could see a further push u p to 0.9475 which lines up with the larger 38.2% Fibonacci retracement.
If prices fail to break the 1st resistance and instead reverse, we could see it drop to the 1st support at 0.9331 which is a strong overlap support.
USD/JPY:
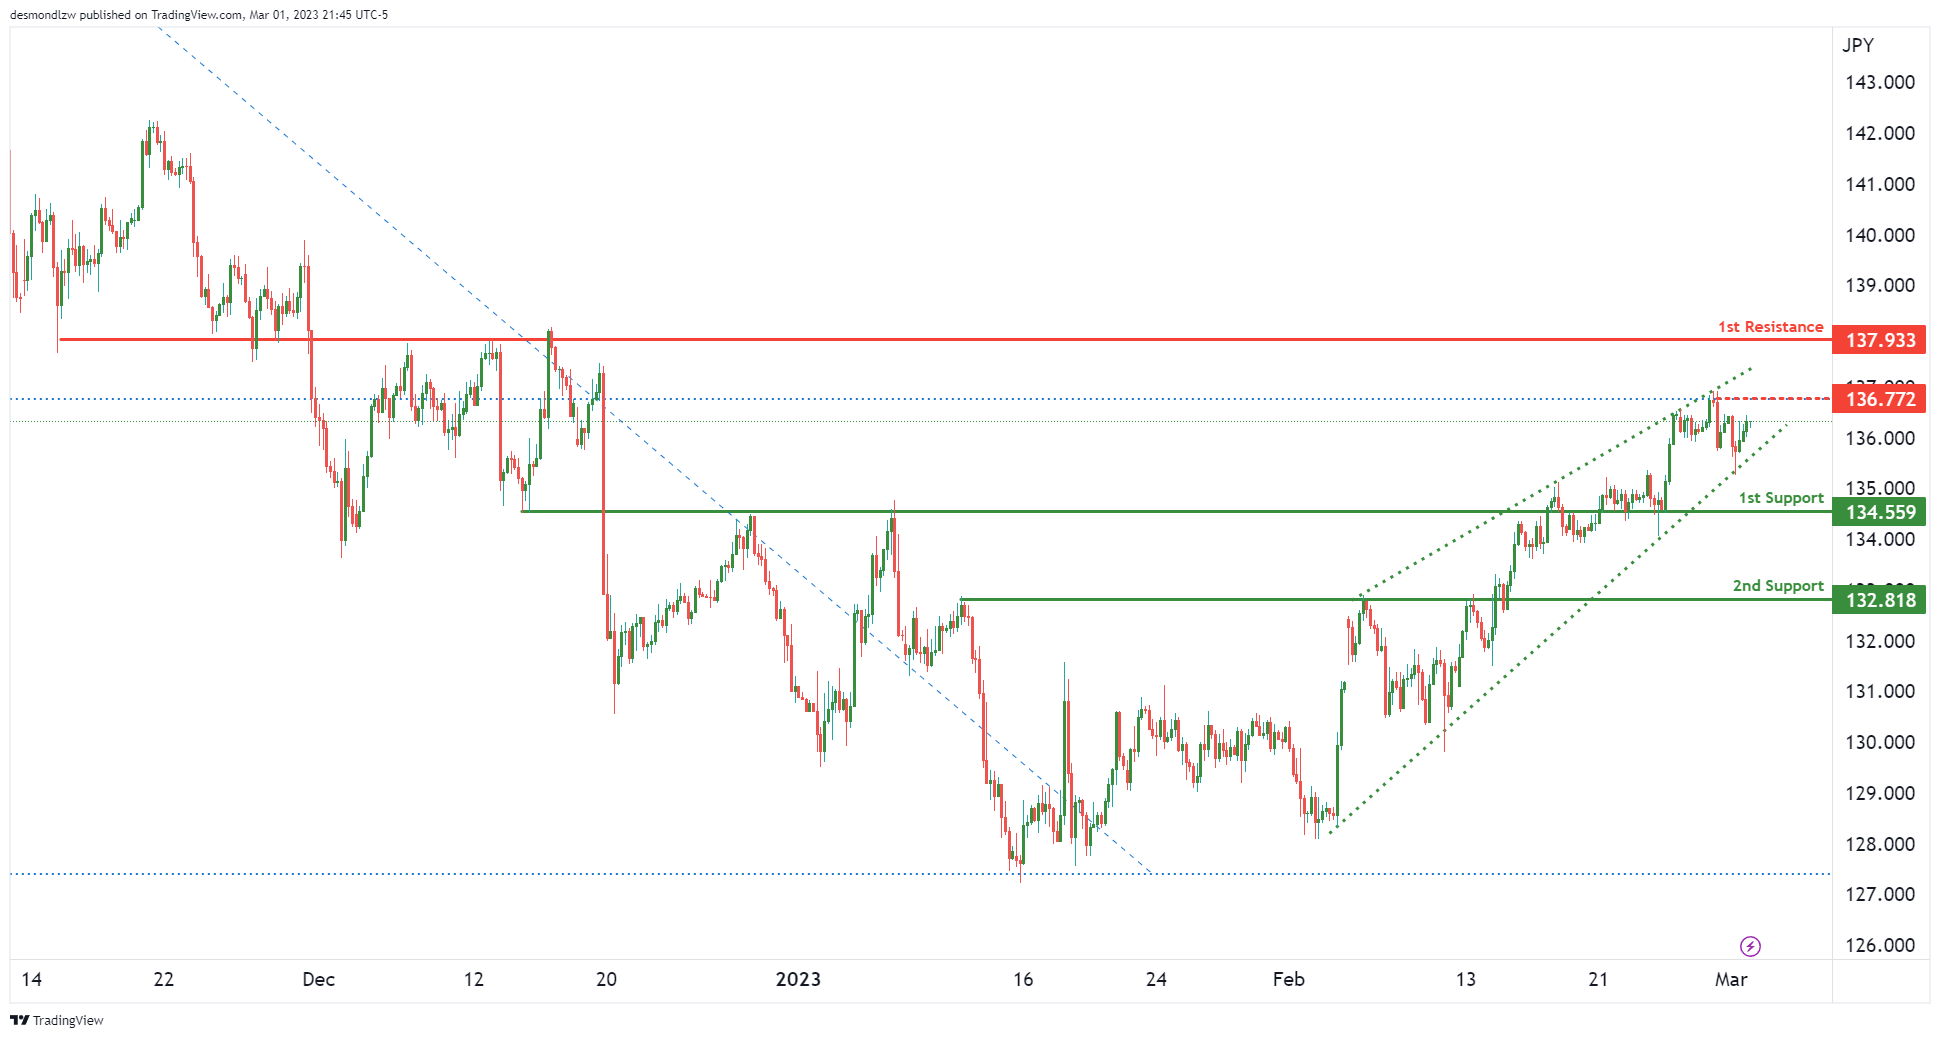
We’re seeing price rise nicely within our ascending wedge with the first intermediate resistance at 136.77 which is a 38.2% Fibonacci retracement. If it breaks this level, then the 1st resistance is at 137.93 which is a strong overlap resistance.
In terms of support, we can see an overlap support at 134.55 which is our 1st support. Breaking that could trigger a drop to 2nd support at 132.81.
AUD/USD:
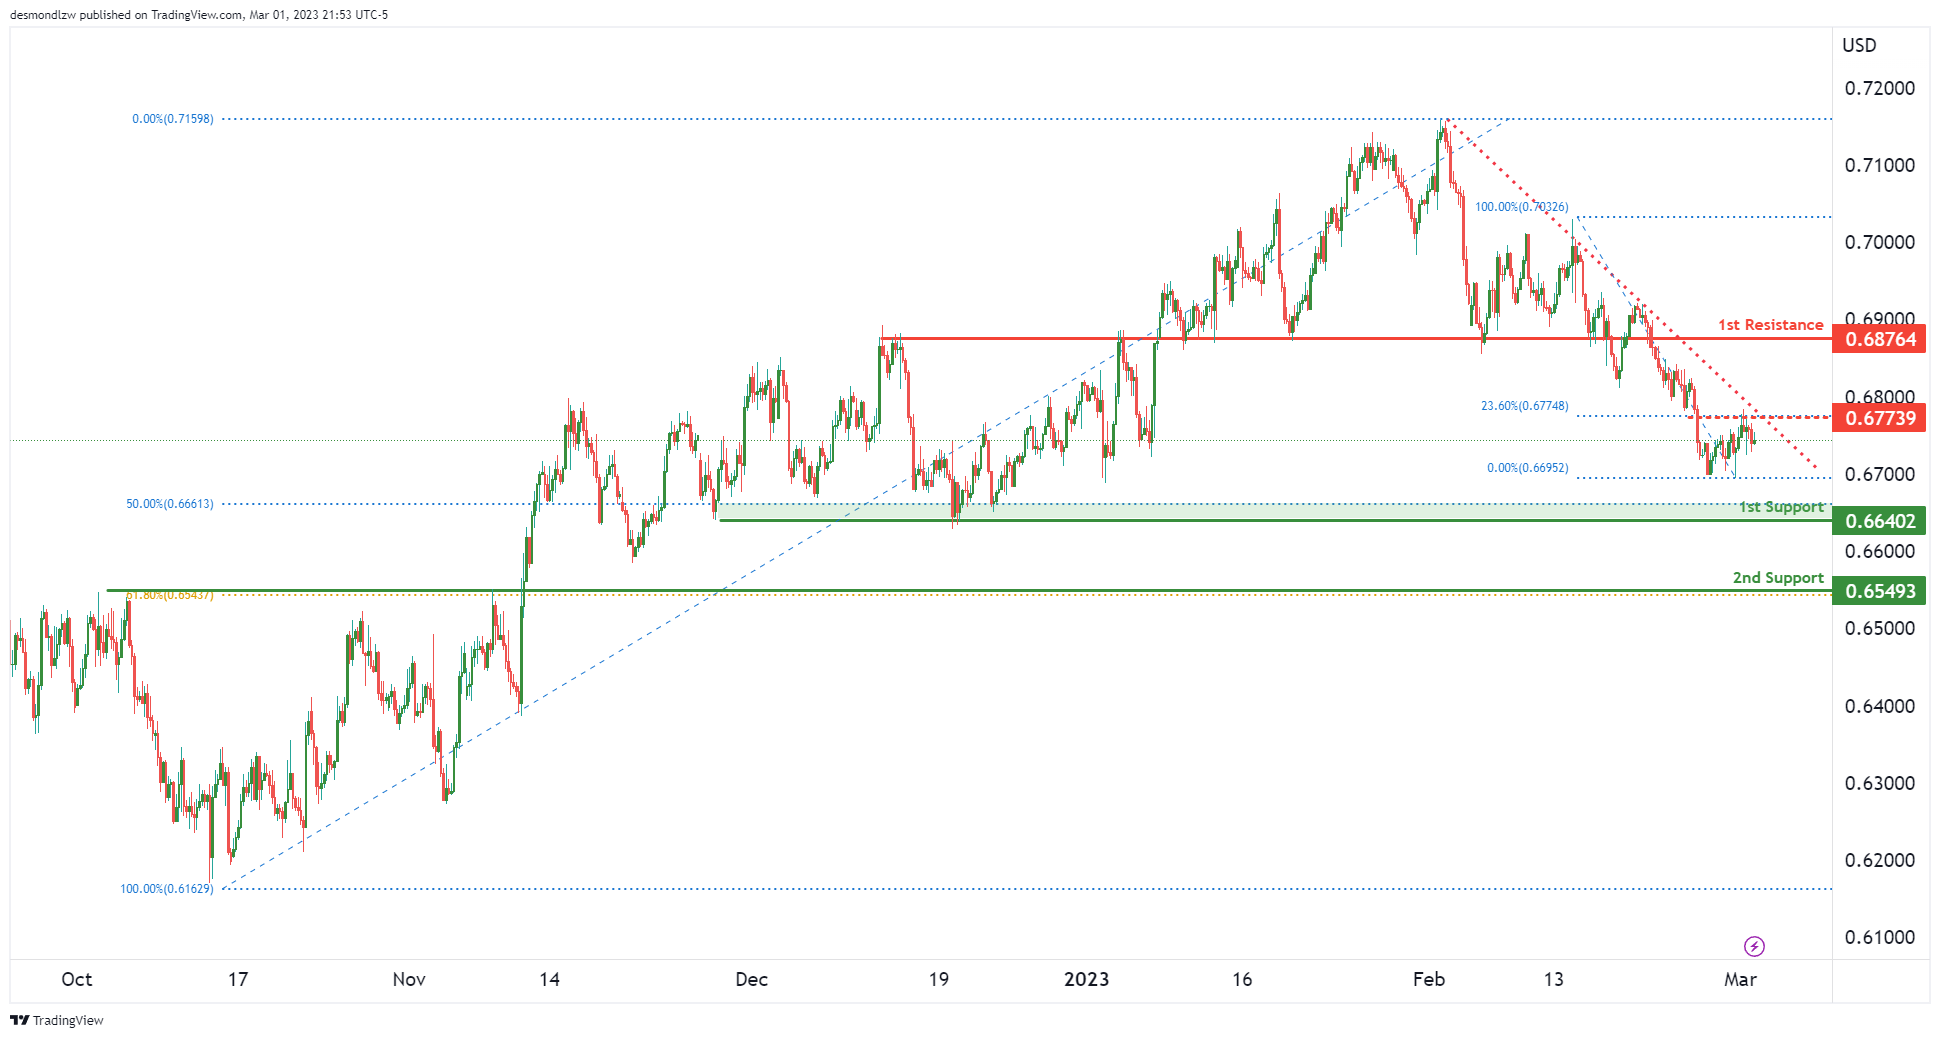
Price is seeing a descending resistance line push prices down towards our 1st support at 0.6640 which is a multiple swing low support + 50% Fibonacci retracement. It’s worth noting that price has also reacted off the intermediate resistance at 0.6773 which is an overlap resistance along with a 23.6% Fibonacci retracement.
If prices were to break the 1st support, we could see a bigger drop to 0.6549 which is a pullback support that lines up with the 61.8% Fibonacci retracement.
NZD/USD:
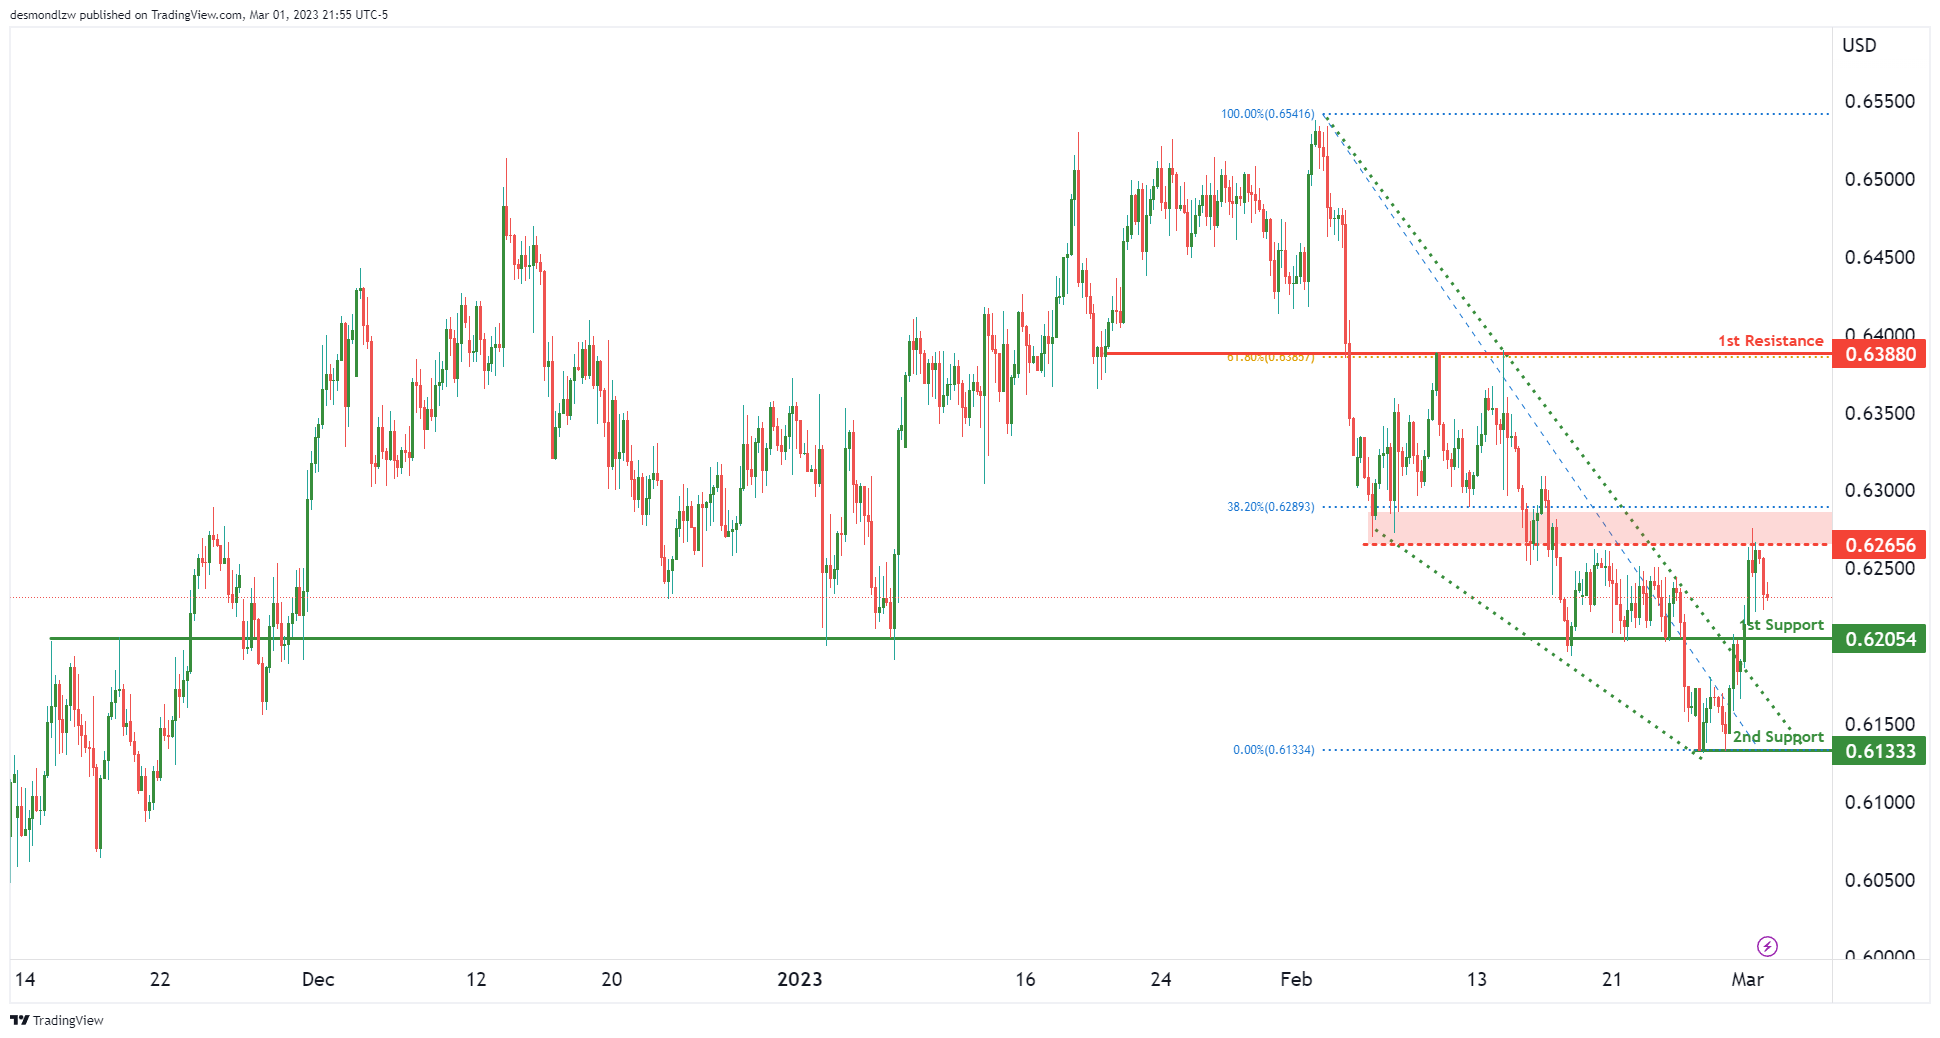
Price is seeing a strong overlap support at 0.6205 which is our 1st support. Ir prices were to rise from here, the first intermediate resistance it would face is at 0.6265 which is an overlap resistance that lines up with a 38.2% Fibonacci retracement. Breaking this intermediate resistance could trigger a bigger move up to 1st resistance at 0.6388 that is a 61.8% Fibonacci retracement and an overlap resistance.
If price were to reverse and break our 1st support instead, then we could see a drop towards 0.6133 which is our most recent swing low support.
USD/CAD:
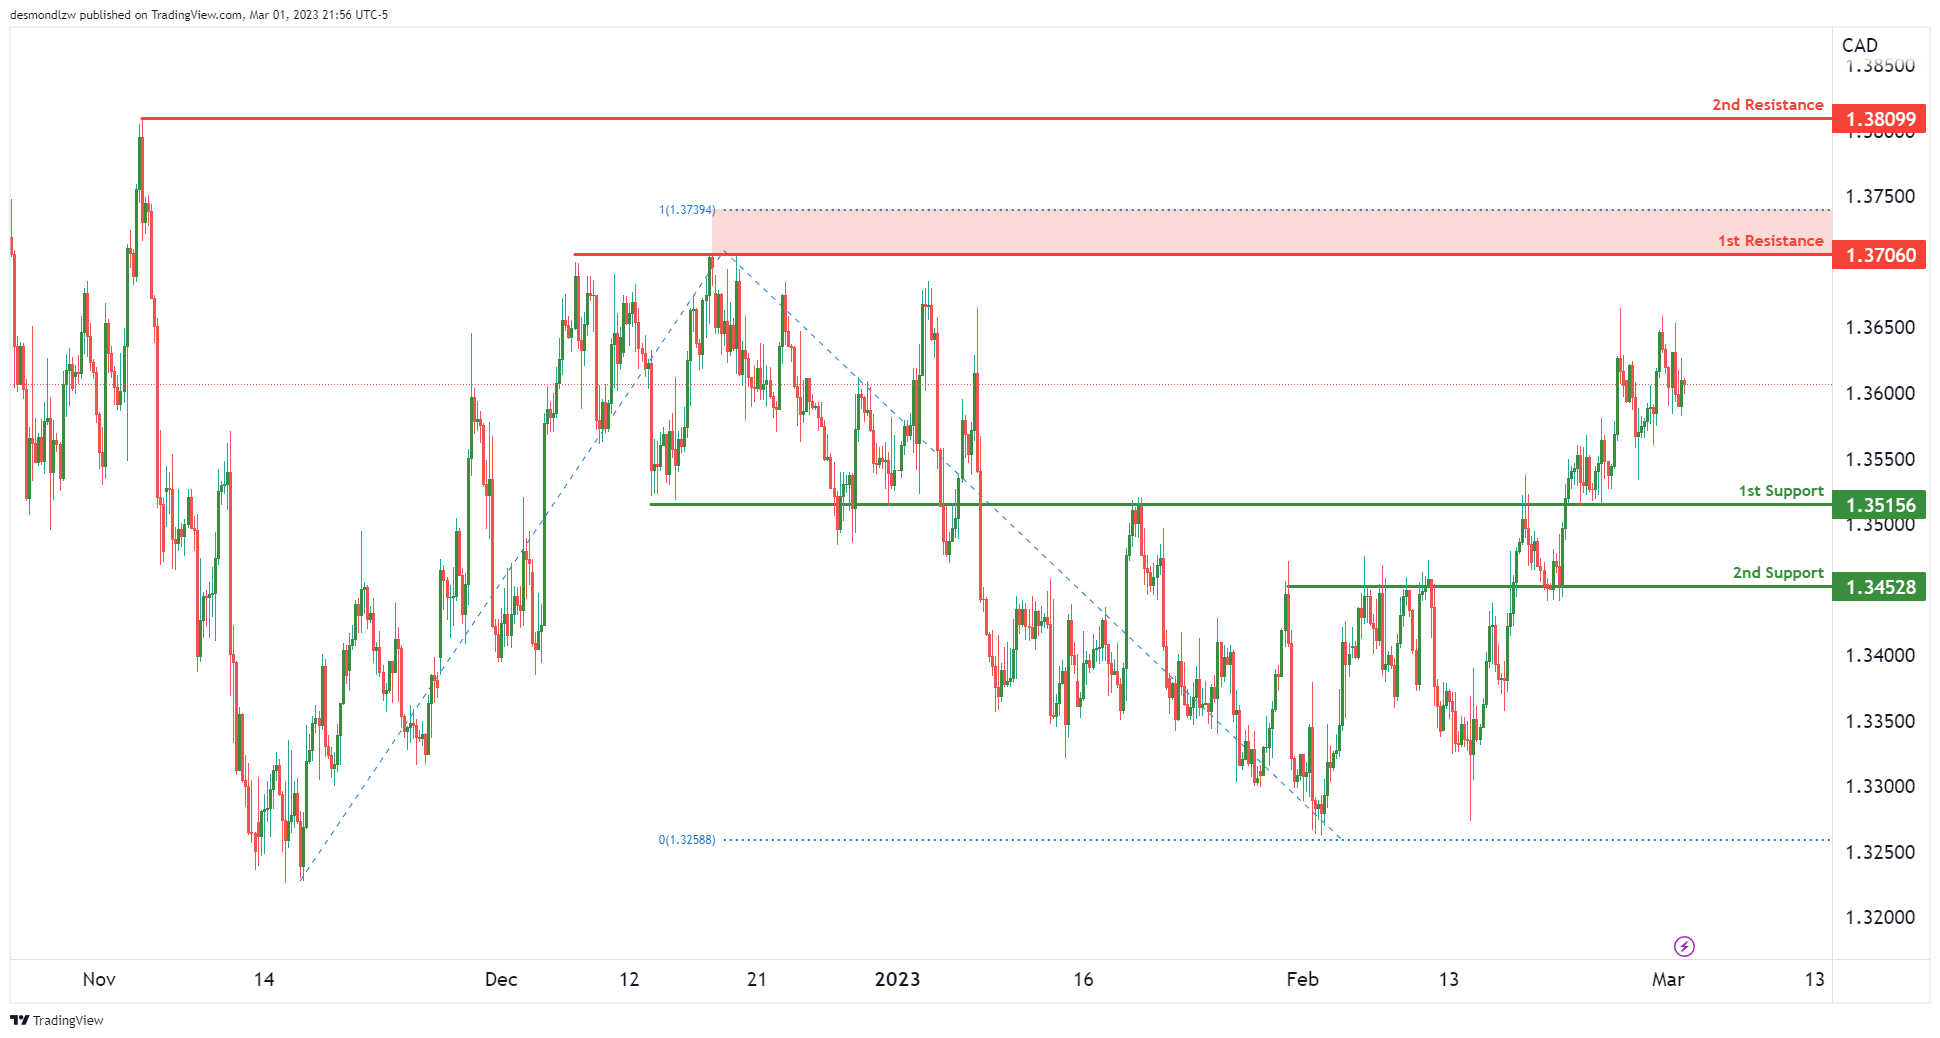
We’re seeing prices hover between two major levels. The 1st resistance of 1.3706 which is a multiple swing high resistance level and the 1st support of 1.3515 that is a strong overlap support level. Breaking either of these levels could trigger moves up to the 2nd resistance at 1.3809 or the 2nd support at 1.3452 which is another overlap support.
DJ30:
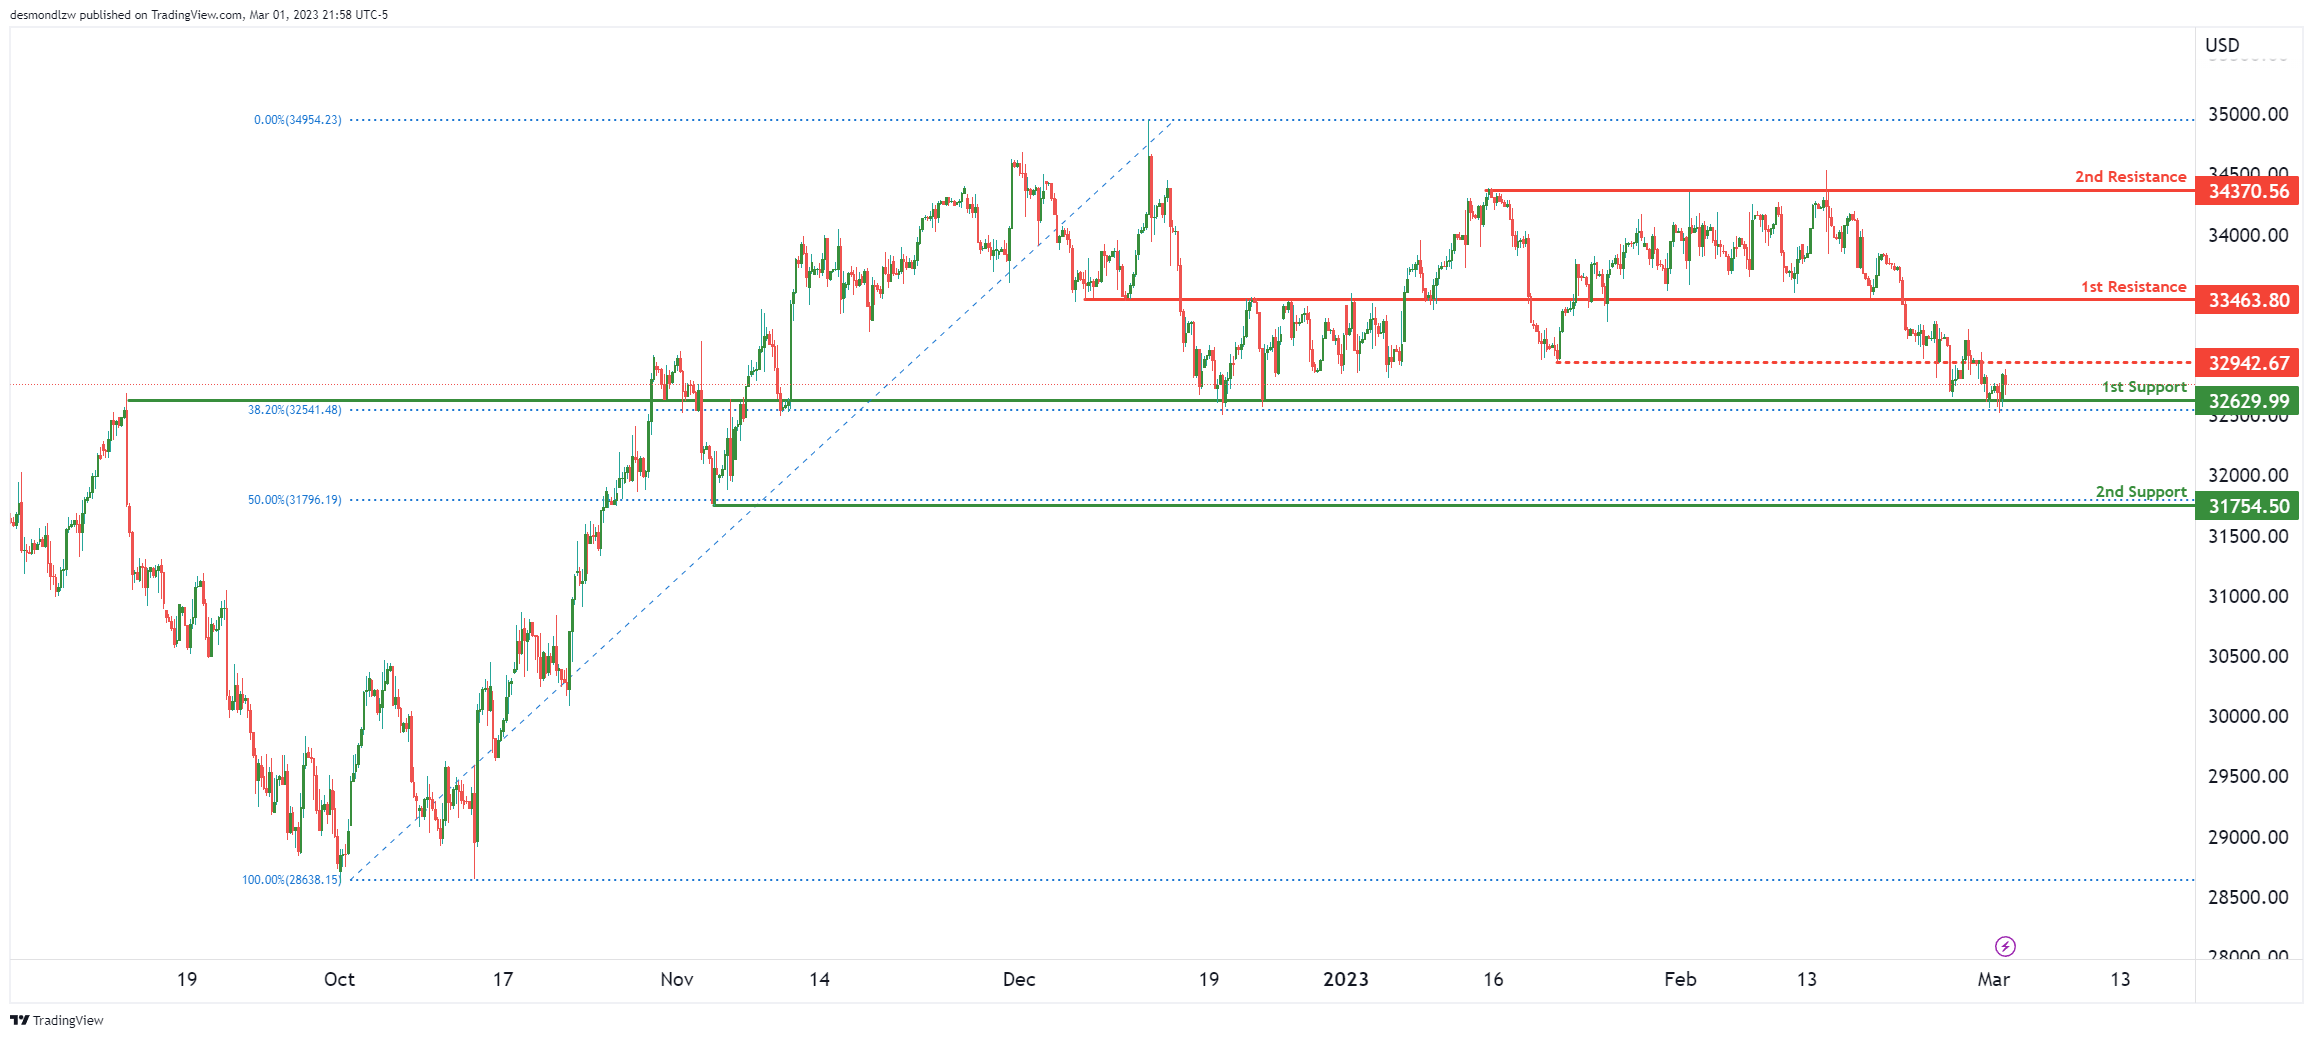
Price is testing our 1st support at 32629 that happens to be an overlap support and a major 38.2% Fibonacci retracement. If price were to bounce from here, it first needs to celar the intermediate resistance at 32942 which is a pullback resistance before it can make a further push up to 1st resistance at 33463 that is a overlap resistance.
Were prices to break the 1st support, the next key level to watch out for is the 2nd support at 31754 which is a smaller swing low support that lines up with the 50% Fibonacci retracement.
DAX:
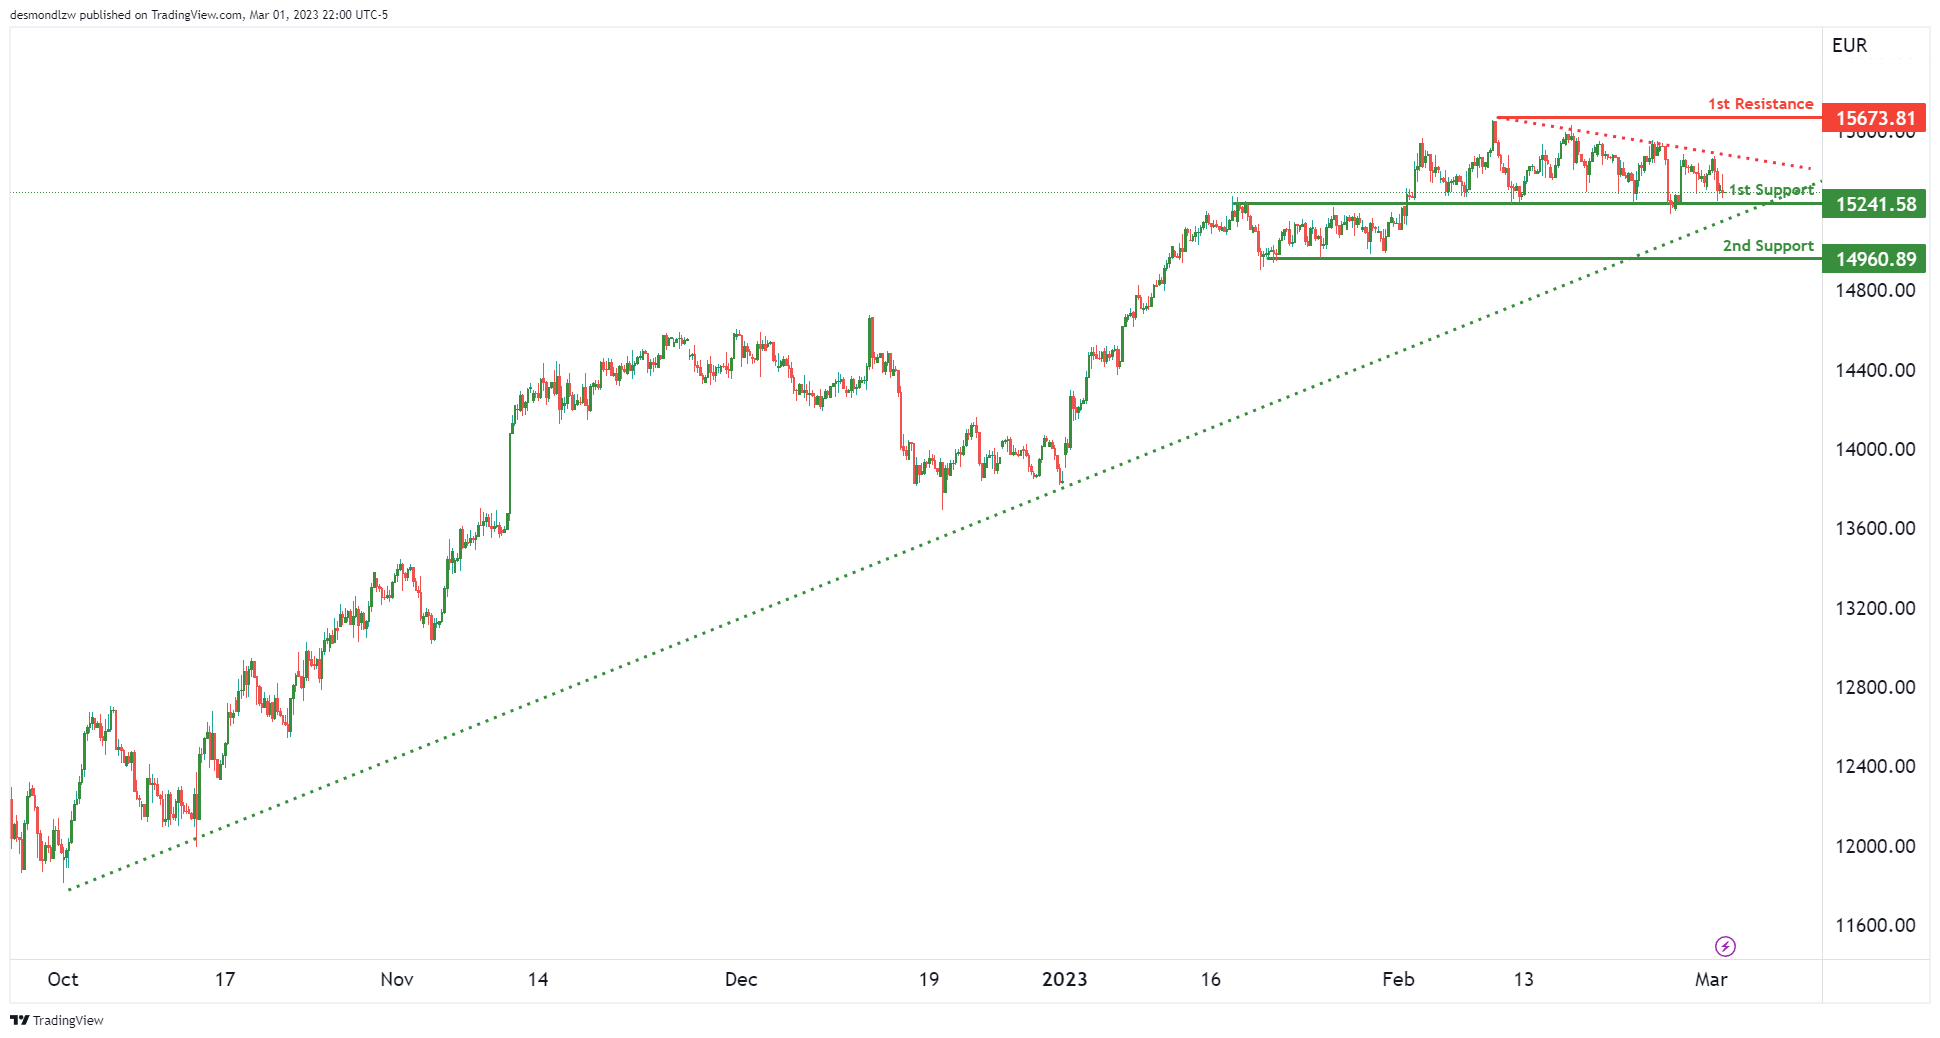
We can see a long term ascending support line and a short term descending resistance line squeeze prices. The 1st support is at 15241 which is an overlap support. If prices were to break this level along with the ascending support line, we could see a drop down to 2nd support at 14960 which is a recent swing low support.
However, if prices were to bounce from here and break the descending resistance line, the next key resistance to watch out for is 15673 which is the most recent swing high resistance.
S&P500:
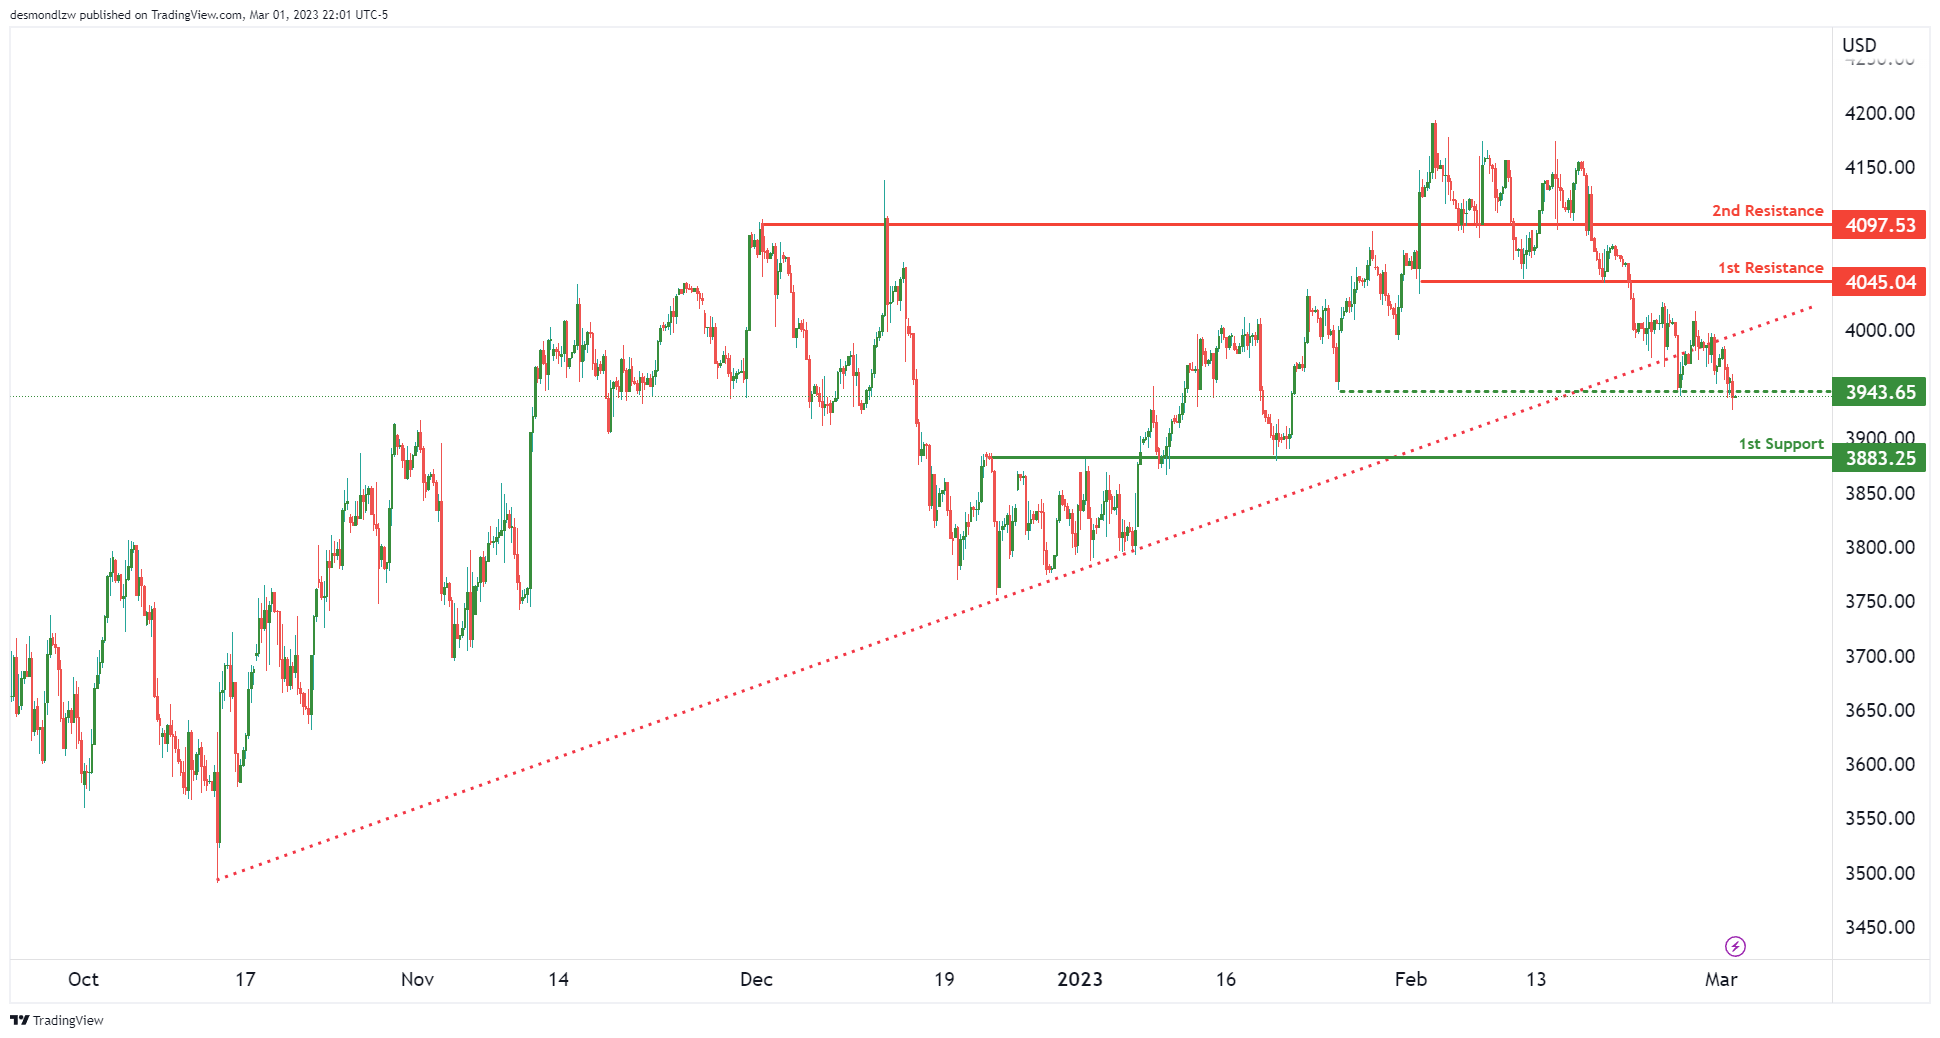
Price has recently broken an ascending support-turned-resistance line and is testing an intermediate support at 3943. If price were to break this intermediate support, we could see a push down to 1st support at 3883 which is a strong overlap support.
However, if prices were to bounce from here and rally upwards, the 1st resistance to watch out for is 4045 which is a pullback resistance. Breaking that, the next key resistance would be at 4097 which is an overlap resistance.
BTC/USD:
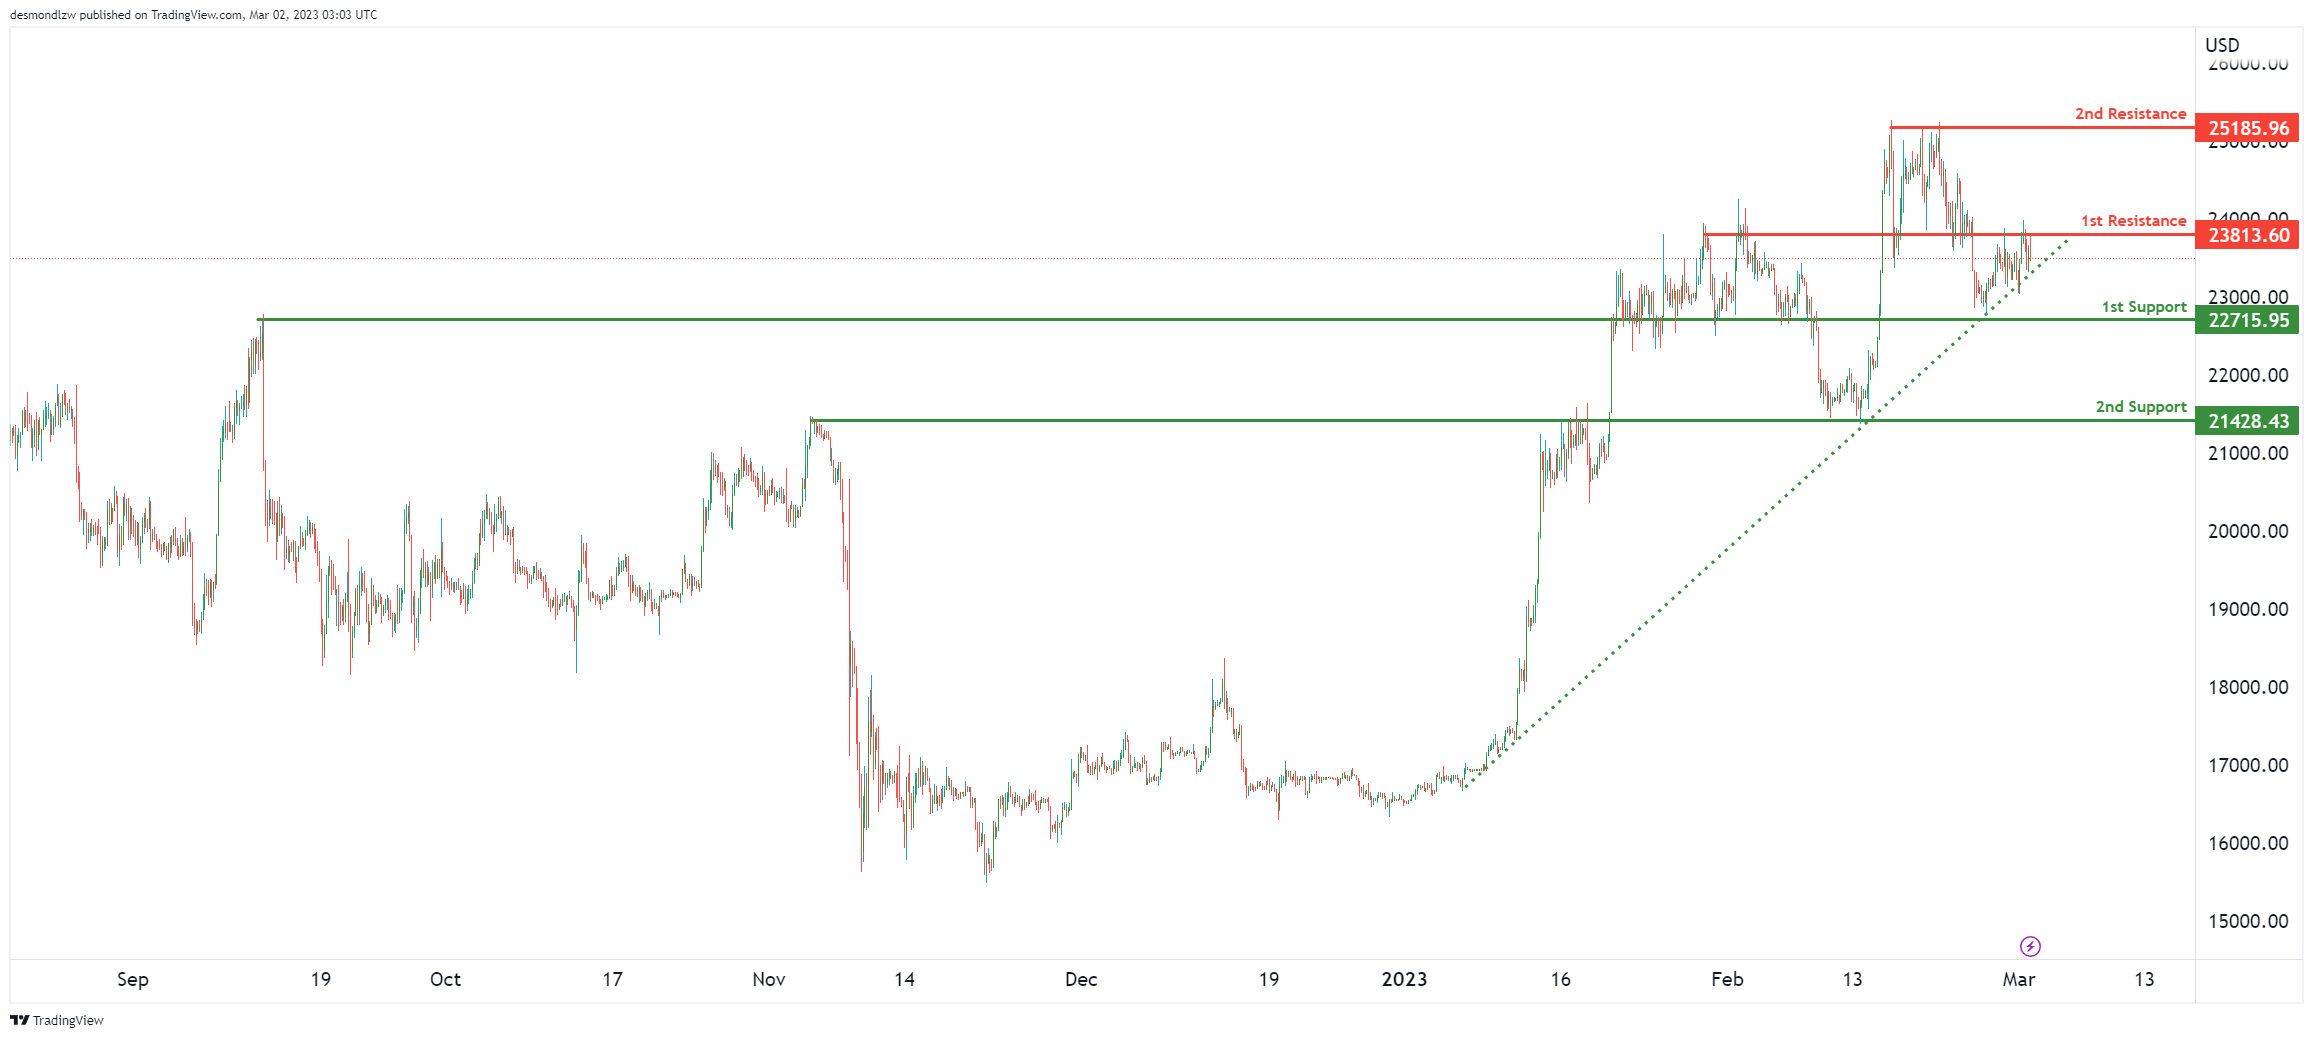
Price is seeing an ascending support line squeeze prices against the 1st resistance at 23813 which is an overlap resistance. If prices were to break past the 1st resistance, we could see a rally up to recent swing high resistance at 25185.
However, if prices were to break the ascending support line, we could see a drop to 1st support at 22715 which is a long-term overlap support.
ETH/USD:
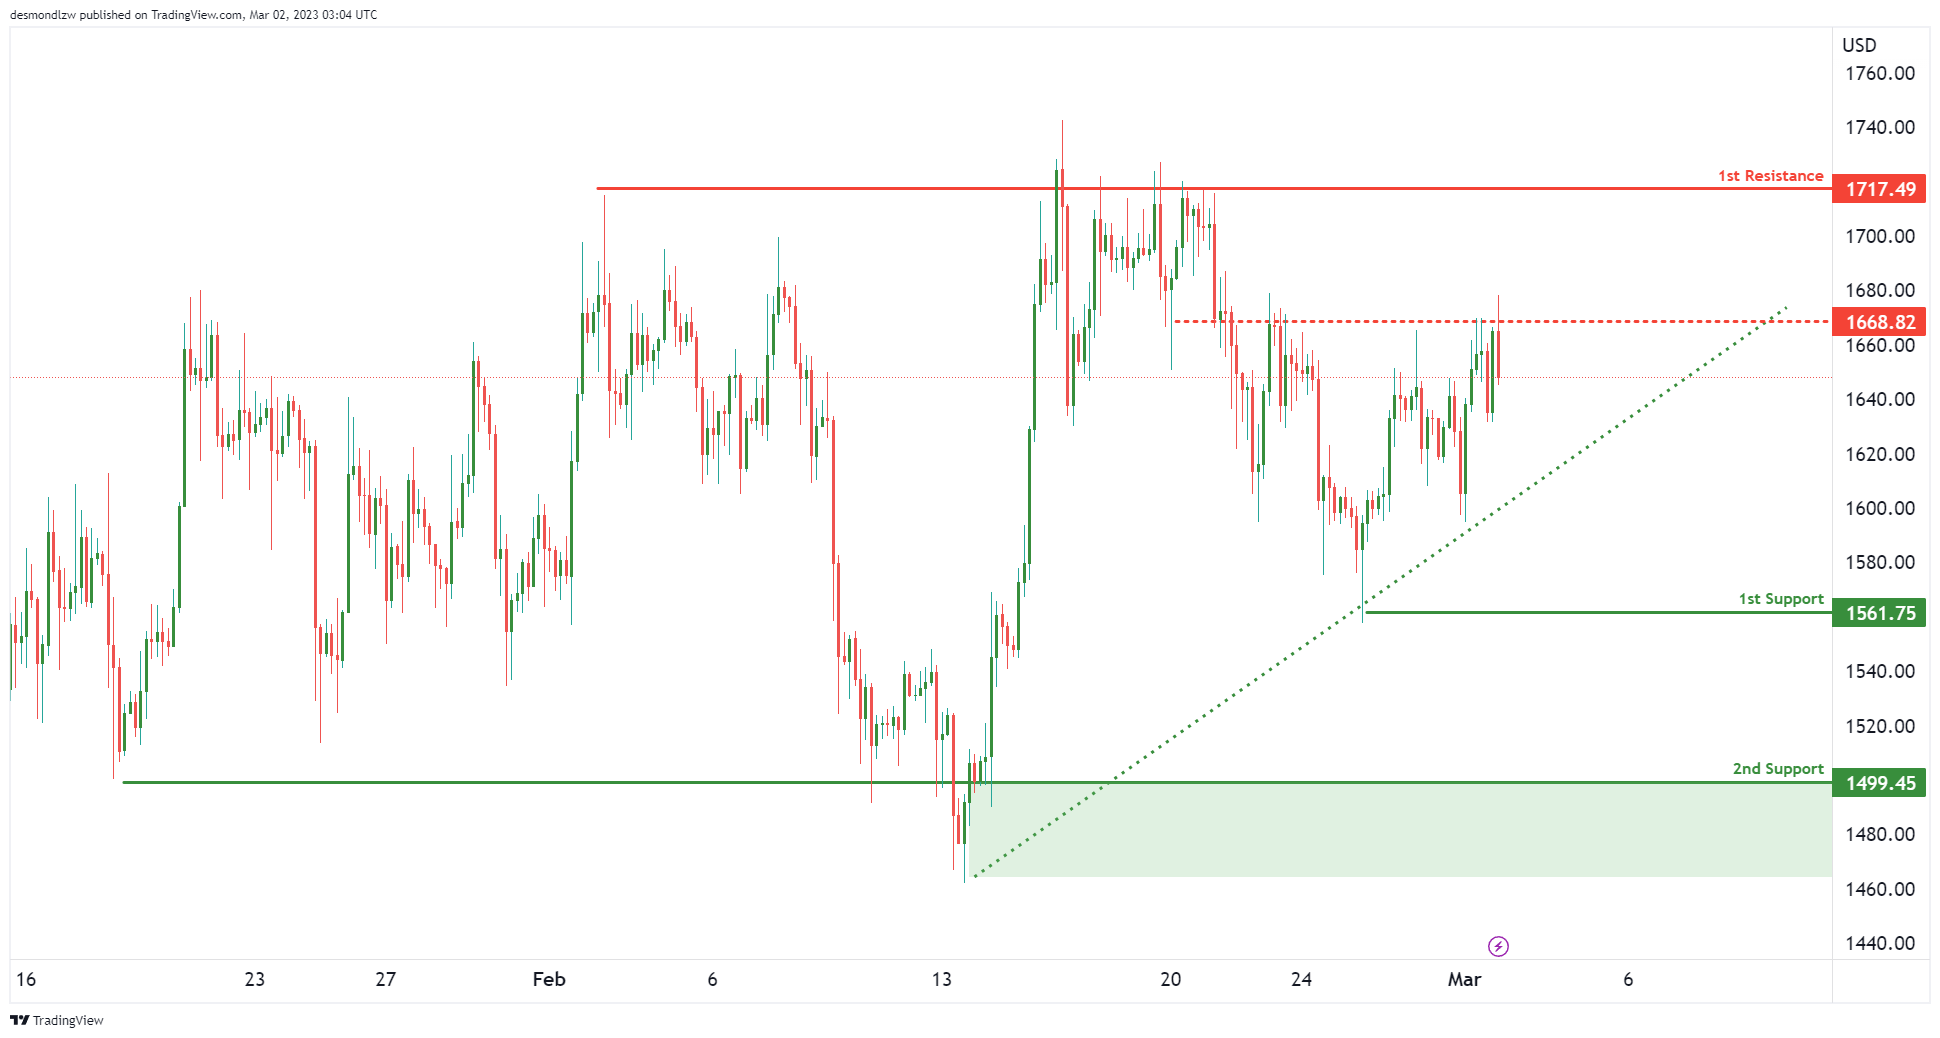
Price is testing an intermediate overlap resistance at 1668 and at the same time, is being pushed up by our ascending support trend line. If prices were to break the intermediate resistance, we could see a bigger push up to 1st resistance at 1717.
However, if prices were to break the ascending support line, we could see a drop to 1561 which is our 1st support that coincides with the swing low support.
BCO/USD:
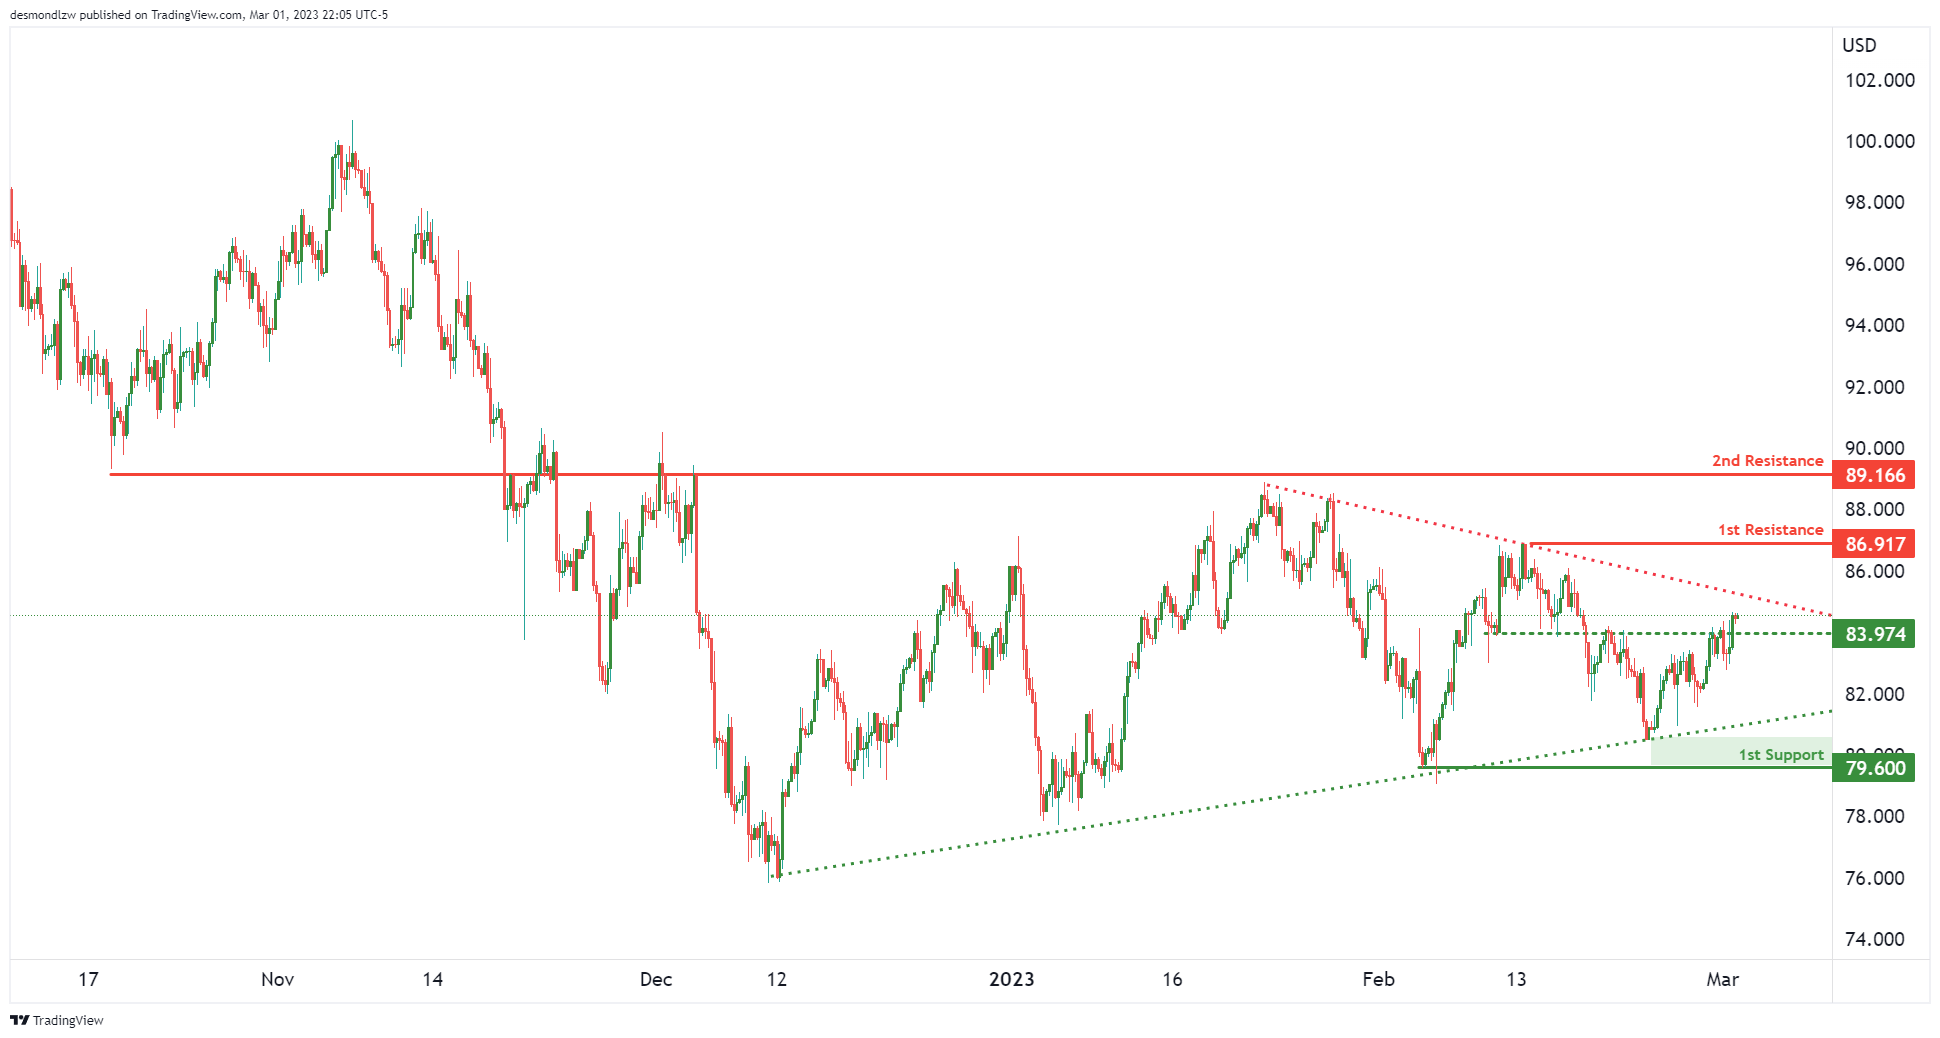
We’re seeing a long term ascending support line and a descending resistance line squeeze prices together. There is an intermediate support at 83.97 which is pushing prices up against the descending resistance line. If prices were to break that descending resistance line, we could see a bigger push up to 86.81 which is our 1st swing high resistance. Breaking that level, a bigger push up to 89.16 is possible which is a big overlap resistance.
However, if prices were to react off the descending resistance and make a push down, the 1st support is at 79.60 which is a recent swing low support.
XAU/USD (GOLD):
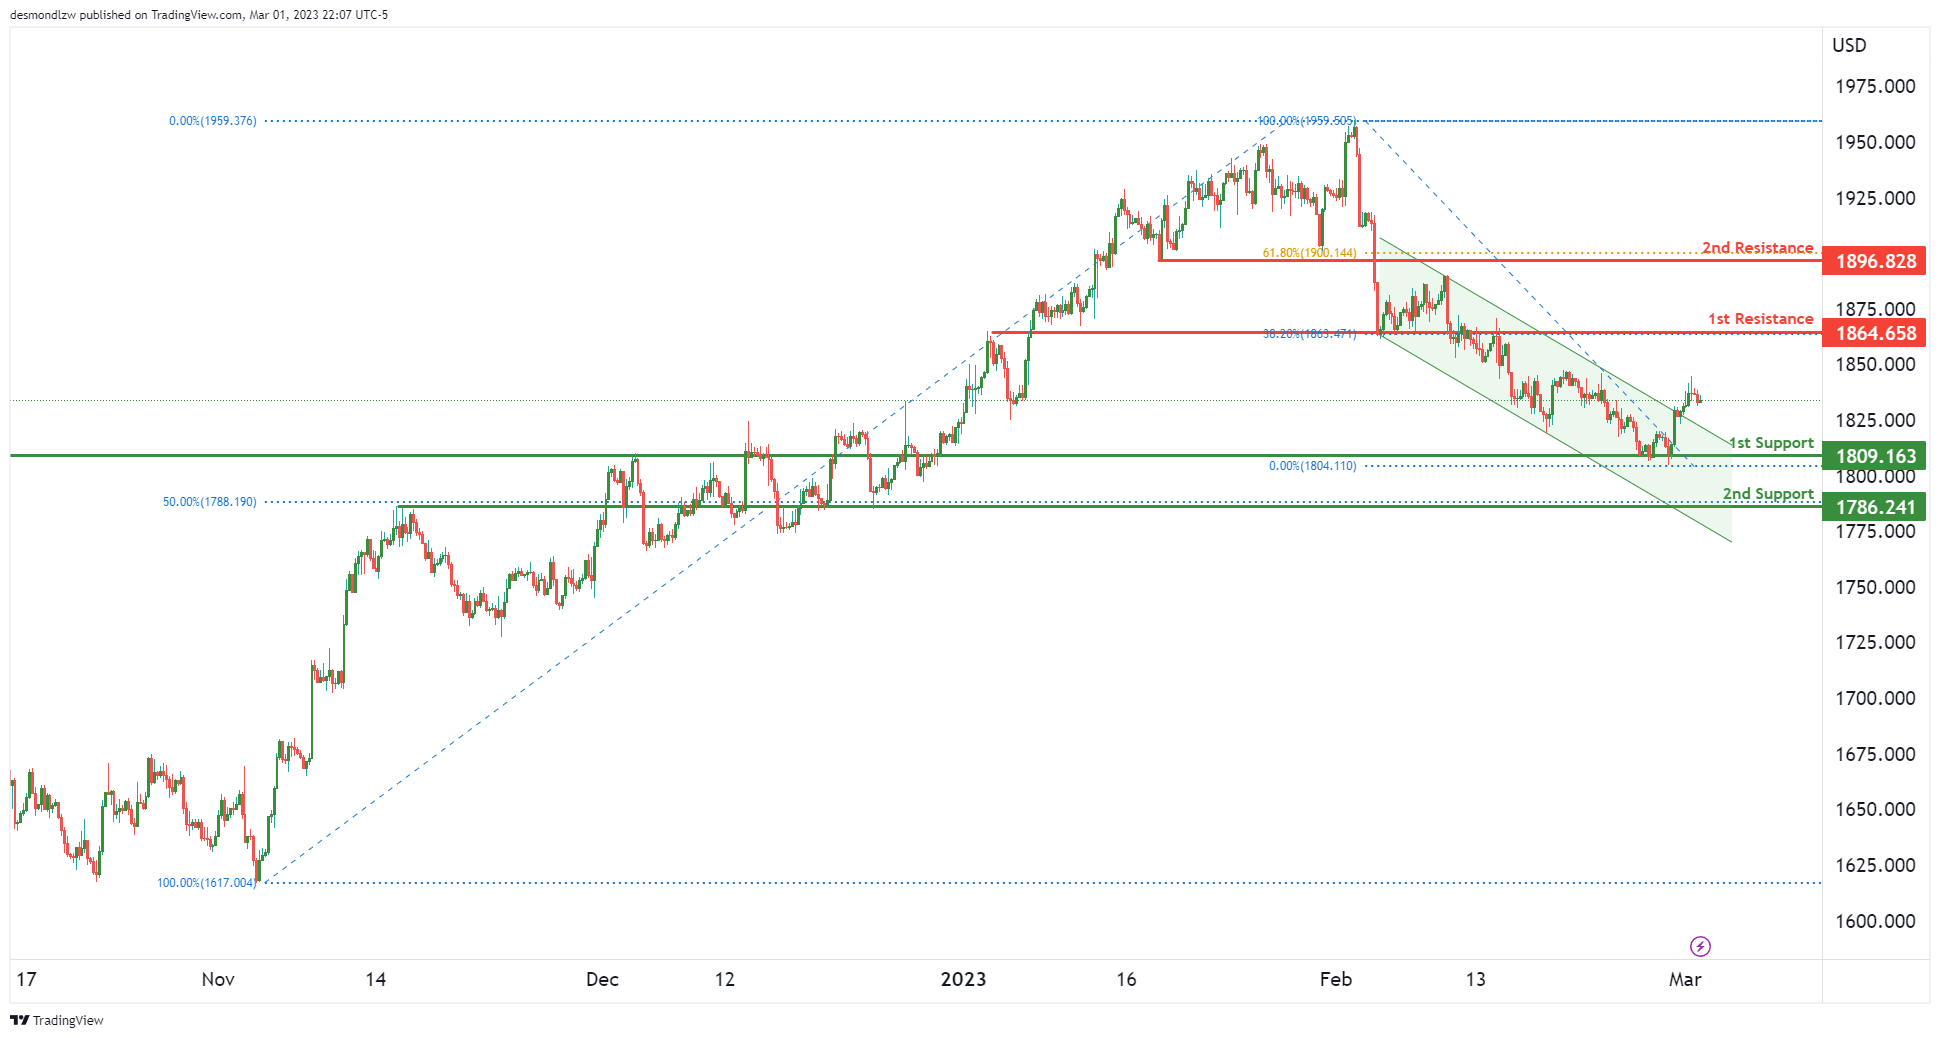
Price has broken out of a recent bearish channel suggesting a bullish move might be on the cards. We’re seeing the 1st resistance at 1864 which is an overlap resistance that lines up with the 38.2% Fibonacci retracement. If prices were to break that level, the next key resistance is at 1896 which ia a pullback resistance lining up with the 61.8% Fibonacci retracement.
In terms of support, we have an overlap support at 1809 and a further 2nd support at 1786 which lines up nicely with our 50% Fibonacci retracement.
BoJ Takata: We need to patiently maintain monetary easing
BoJ board member Hajime Takata said said in a speech today, "now is the time where the BOJ must scrutinise whether the economy and prices can achieve a sustained, positive cycle."
"While we need to be mindful of the impact of our massive stimulus program on market function, we're at a stage where we need to patiently maintain monetary easing," he said.
Bitcoin Price Could Rise If Stays Above $23K
Key Highlights
- Bitcoin price is consolidating above the $23,000 support zone.
- BTC broke a major bearish trend line at $23,500 on the 4-hours chart.
- Gold price climbed higher above the $1,830 resistance zone.
- EUR/USD extended its recovery above the 1.0640 resistance zone.
Bitcoin Price Technical Analysis
Bitcoin price found support near the $22,800 zone after a major decline. BTC/USD traded as low as $22,823 and recently started an upside correction.
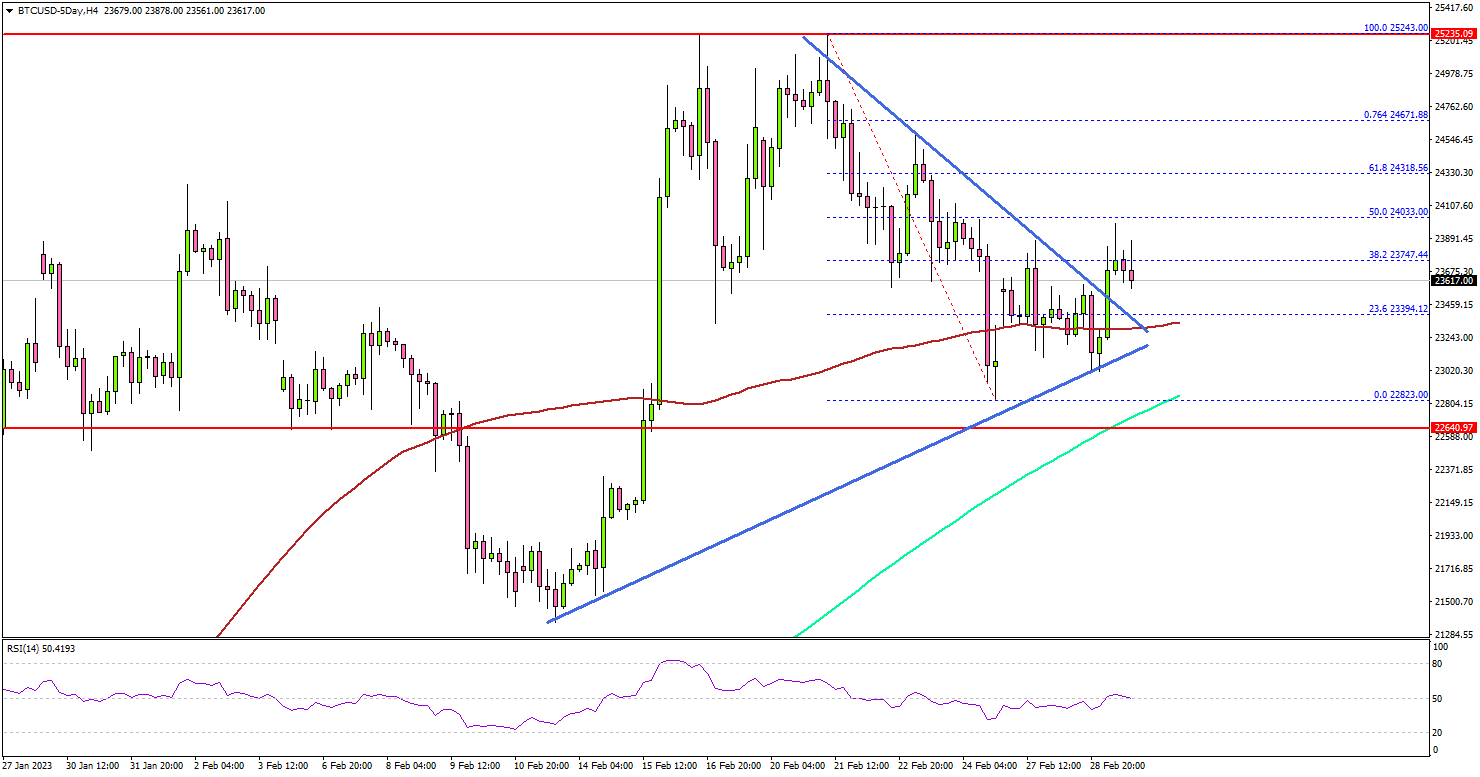
Looking at the 4-hours chart, the price climbed higher above the $23,400 resistance zone. Besides, there was a break above a major bearish trend line with resistance at $23,500 on the 4-hours chart.
There was a break above the 23.6% Fib retracement level of the downward move from the $25,243 swing high to $22,823 low. On the upside, the price is facing resistance near the $24,050 resistance zone.
The 50% Fib retracement level of the downward move from the $25,243 swing high to $22,823 low is also near the $24,050 level. A close above the $24,050 level may perhaps start another steady increase in the coming sessions.
In the stated case, the price could rise towards the $24,650 level. Any more gains could set the pace for a move towards the $25,000 level.
On the downside, the price is stable above the 100 simple moving average (red, 4-hours), and the 200 simple moving average (green, 4-hours). An initial support sits near the $23,400 level. The main breakdown support sits near the $22,850 zone.
If there is a downside break and close below $22,850, bitcoin might start another decline in the coming days. In the stated case, it could revisit the $22,200 support or even test $21,500.
Economic Releases
- Eurozone Consumer Price Index for Feb 2023 (YoY) – Forecast +8.2%, versus +8.6% previous.
- Eurozone Consumer Price Index for Feb 2023 (MoM) – Forecast -0.3%, versus -0.2% previous.
- US Initial Jobless Claims - Forecast 197K, versus 192K previous.