

Sample Category Title
RBA’s ‘Narrow Path to Achieving a Soft Landing’ Getting Narrower
RBA’s Statement on Monetary Policy points to rising concerns around domestic inflation pressures.
The Reserve Bank has released its February Statement on Monetary Policy (SoMP). The highlight of these Statements is usually the Bank’s revised forecasts for growth, unemployment and inflation. However, this time around it was the more detailed picture around underlying inflation and wages that was of most interest. And on this, the Statement does show a notable shift, both indicators now expected to track above 4%yr in 2023 and wages growth to remain around 4% in 2024. While that was in line with our priors, it’s a troubling prospect for a central bank seeking to return inflation to the 2-3% target band. Aside from forecast changes, the SoMP also provides important colour around the Bank’s views and the messages coming via its liaison programme, both of which are tending to underscore the more hawkish tone present in the Governor’s decision statement earlier in the week.
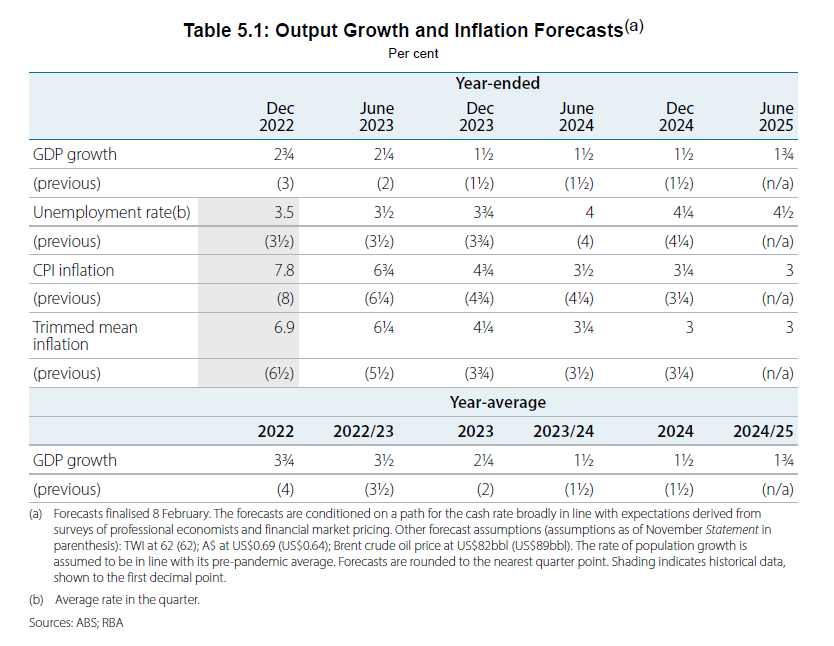
That decision statement had already given away most of the key points from the Bank’s latest forecasts, namely: “CPI inflation to decline to 4¾ per cent this year and to around 3 per cent by mid-2025”; “GDP growth … to slow to around 1½ per cent over 2023 and 2024”; and “the unemployment rate to increase to 3¾ per cent by the end of this year and 4½ per cent by mid-2025” – all of which were largely unchanged from November.
Note that this is despite some slight shifts in the ‘conditioning assumptions’ used by the RBA in its forecasts – a peak cash rate of 3¾% rather than 3½% (based on the market economist forecasts and market pricing); an AUD at US$0.69 rather than US$0.64; and crude oil prices at US$82/bbl vs US$89/bbl. Note also that the RBA’s forecast horizon has also been extended out to June 2025.
While the central case view was largely unchanged, the RBA did make some notable tweaks to the it’s more detailed forecasts.
On inflation, the upside surprise on annual ‘trimmed mean’ inflation in Q4 (6.9% vs the RBA’s forecast 6.5%) led the Bank to lift its 2023 track, underlying inflation now holding at 6.2%yr in H1 and only easing back to 4.3%yr by December (vs previously forecast to track back to 3.8%yr). Aside from the starting point, the RBA also cited “second-round effects from higher energy prices” and a pick-up in domestic labour cost growth as factors lifting the view here.
Wages are quickly becoming the Bank’s central concern. Back in November we noted that the RBA’s 3.9%yr forecast for wages growth in 2023 looked underdone compared to our own forecast peak of 4.5%yr. The February SoMP has materially closed the gap, the RBA now forecasting a lift to 4.2%yr by year-end, holding at 4%yr in 2024. This was directly in line with our expectations going into the Statement.
That said, our broader views on the inflation outlook are now considerably more ‘constructive’ than the Bank’s. Westpac expects both headline and underlying measure of inflation to track back to a sub-4% annual pace by year-end with a larger deflationary pulse from supply-side factors showing through (including lower fuel prices, which the RBA’s convention assumes hold flat). We have already observed some encouraging supply-side developments in the US, particularly as they affect fuel, food, energy, goods, and building costs.
On the growth outlook, the unchanged view for 2023 and 2024 reflects a slightly weaker picture around momentum in the second half of 2022 (mainly around consumer spending but also dwelling investment and public demand), offset by a stronger outlook for population growth (now assumed to track in line with pre-COVID average pace). Notably consumer spending is seen as having moderated in the December quarter mainly due to the impact of higher prices on purchasing power rather than higher interest rates on household disposable incomes.
Interestingly the bank continues to sound relatively comfortably on the capacity of the mortgage belt to absorb interest rate rises. Based on cash rate rises to date, it projects scheduled mortgage payments to reach 9½-9¾% of household disposable income by the end of 2023, a similar level to total payments (principal, interest and excess payments) made through 2022. The accumulated ‘excess savings’ buffer across the wider household sector is also now estimated at just under $300bn with $120bn of this sitting in mortgage offset accounts.
A box-story ‘side-note’ in the SoMP also sends a more nuanced message around the ‘cash flow’ channel of interest rate rises. High household debt and the higher prevalence of variable rate and shorter-duration fixed term mortgages means this channel of policy tightening operates more quickly in Australia compared with most other advanced economies. However, the evidence suggests that policy more broadly (including effects through other channels) is not any more potent in Australia than elsewhere. While this has potentially chilling implications for how far policy rates may need to rise, it does not seem to be a view that is framing the Bank’s policy decisions.
Over five pages of the SoMP is dedicated to coverage of feedback from the RBA’s detailed business liaison program, which looks to be having a significant bearing on the Bank’s views. Key take-outs include: “some goods-related firms implemented fewer and smaller price increases over recent months than earlier in 2022 and expect price growth to slow further over coming quarters”; “… labour cost pressures generally increased as wages growth picked up over the December quarter” ; “Firms … expect wages growth to stabilise around 4 per cent in coming quarters” ; “… around half are looking to expand headcount”; “Around one-third of private sector firms reported wage increases above 5 per cent in the December quarter”.
Those comments feed directly into the Bank’s concerns around inflation expectations, which look to have been elevated slightly. The Overview section of the SoMP largely reiterates the messages from the Governor’s decision statement but gives more prominence to inflation expectations and their link with inflation psychology. Specifically, it observes that: “Longer term inflation expectations and wages growth in Australia have so far remained consistent with the inflation target. It is important this remains the case. That said, domestically sourced inflation and wages growth are both picking up. Given the importance of avoiding a price-wage spiral, the Board will continue to play close attention to both the price-setting behaviour of firms and the evolution of labour costs in the period ahead.”
Conclusion
The RBA has already described what it sees as a “narrow path to achieving a soft landing” in the economy. The February SoMP suggests this path is becoming even narrower with domestic inflation pressures coming to the fore and looking both stronger and more persistent, especially with respect to the labour market. Westpac remains comfortable with the view we expressed in October that the cash rate is likely to peak at 3.85%, entailing a further 0.25% increase in March and a final 0.25% increase at the May Board meeting. While we think this and a sharp disinflationary effect from easing supply-side pressures will be sufficient to bring inflation back under control, the tone of this latest RBA commentary suggests the Board may see itself with less scope to pause and potentially more work to do.
Riksbank Makes a U-turn and Puts Weak Krona in Focus
Market movers today
We get the University of Michigan consumer sentiment indicator including inflation expectations, which became a major market mover last summer.
Two more speeches from FOMC members are scheduled after the close of European markets, namely Waller and Harker.
The UK publishes GDP for December and for Q4 as a whole, after the better than expected November print.
In the Nordics, Norwegian CPI is key today, see below.
The 60 second overview
Fed speak: Yesterday, Richmond Fed's Barkin continued the hawkish tone of recent FOMC speeches, as he emphasized that Fed has its 'foot unequivocally on the brake'. In addition, Atlanta Fed's Wage Growth Tracker remained unchanged at 6.1% in January, supporting the view that labour market conditions still remain too tight. Markets' focus is already turning towards the key January CPI print next week, where we are looking for an uptick in both headline (0.5% m/m) and core (0.4% m/m) terms. Read more details from our preview (Research US - Soft landing to no landing?, 9 February), where we take a look at the inflation components as well as the most recent round of labour market data. We continue to forecast Fed terminal rate at 5.00-5.25% by May and first rate cuts only in early 2024.
Riksbank starts active QT: In Sweden, the Riksbank delivered a 50bp rate hike as expected and new rate path broadly in line with expectations signalling another hike in April. More interestingly, they came with a hawkish surprise in the form of active QT, motivated to strengthen the SEK. The Riksbank decided to actively start selling their government bond holdings from April with a pace of SEK3bn per month in nominal SGBs and 0.5bn per month in inflation-linked government bonds. This can be put into relation to current holdings of SEK 288bn nominal SGBs and SEK45bn in linkers, and issuance from Debt Office of SEK2bn bi-weekly in nominal bonds and SEK0.5bn in linkers. According to the press release, the Riksbank will primarily sell longer maturities. The natural market reaction has been a steepening of the SGB curve and cheapening on ASW. See more in our Flash Comment Riksbank - a U-turn for SEK, 9 February.
German CPI: German January inflation figures showed headline CPI inflation broadly flat at 8.7% (from 8.6% in December). The press release did not contain any details on sub-components, but it seems Destatis decided to already take into account the German gas and electricity prices from January, which probably limited the uptick in energy inflation otherwise expected. With German HICP arriving at 9.2%, that leaves upside risks for the final January euro area HICP figures released on 23 February (Eurostat had initially assumed a German figure closer to 8.6% for their calculations in the flash HICP).
EU summit: Yesterday, EU summit kicked off in Brussels, where EU leaders will discuss how to respond to the subsidies and buy-America provisions of the IRA. The Commission has suggested a reform of state-aid rules, but some countries worry that would distort the EU single market, while Germany, the Netherlands and other fiscally conservative states oppose yet another round of joint borrowing for a new EU green subsidy fund. A breakthrough therefore seems unlikely, although Italy seems open to a "quid pro quo", agreeing to a relaxing of state-aid rules in exchange for more time/flexibility on spending NGEU funds.
FI: European yields staged a strong rally from the start coinciding with the release of the delayed German CPI. The release leaves around 0.2pp upside risks to the final January euro area release in 2w. It was otherwise a relatively quiet day, which ended with a complete reversal of the sell-off following the change to the remuneration of government deposits at ECB from 1 May. Bunds are therefore back around 2.3%. Bund ASW spreads were broadly unchanged on the day. Intra euro area spreads performed amid flatter curves from the long end. The next key event for bond markets is the US CPI on Tuesday.
Today, we also get voluntary TLTRO repayment for February. After the EUR63bn repayment in January, we expect a relatively low repayment, around EUR10bn, but as per usual, these estimates are difficult to make.
FX: SEK and NOK rebound sharply yesterday ending a period of sustained weakness. EUR/SEK fell to around 11.10 after the Riksbank hiked rates and announced its decision to start selling bonds. EUR/NOK followed EUR/SEK lower and dropped below 11.00.
Credit: Mirroring the overall positive sentiment yesterday, the credit markets saw tightening in CDS indices. iTraxx Main closed the day 0.9bp lower at 75.3bp, while iTraxx Xover was 6.4bp lower at 393.5bp. The primary market continued the high pace with new notable deals from Nokia OYJ, Ineos Finance Plc, Nykredit Realkredit A/S and Banco De Sabadell SA.
Nordic macro
We have seen the underlying trend (monthly change) in Norwegian core inflation peak during the autumn and slow at the end of the year. Prices for food and imported goods such as furniture, as well as hotel and restaurant services, have clearly been decelerating. We expect much of this picture to have continued into 2023, driven by a combination of lower cost increases and weaker demand. On the other hand, we know some segments are struggling with lower margins and need to raise prices, and January is often a month when firms take the opportunity to adjust their pricing. We also have to expect rents to rise more than normal, as these are linked to inflation. There is therefore considerable uncertainty, but we expect core inflation to rise to 5.9% y/y in January, where consensus expects 6.1 %.
Technical Outlook and Review
USD/JPY:
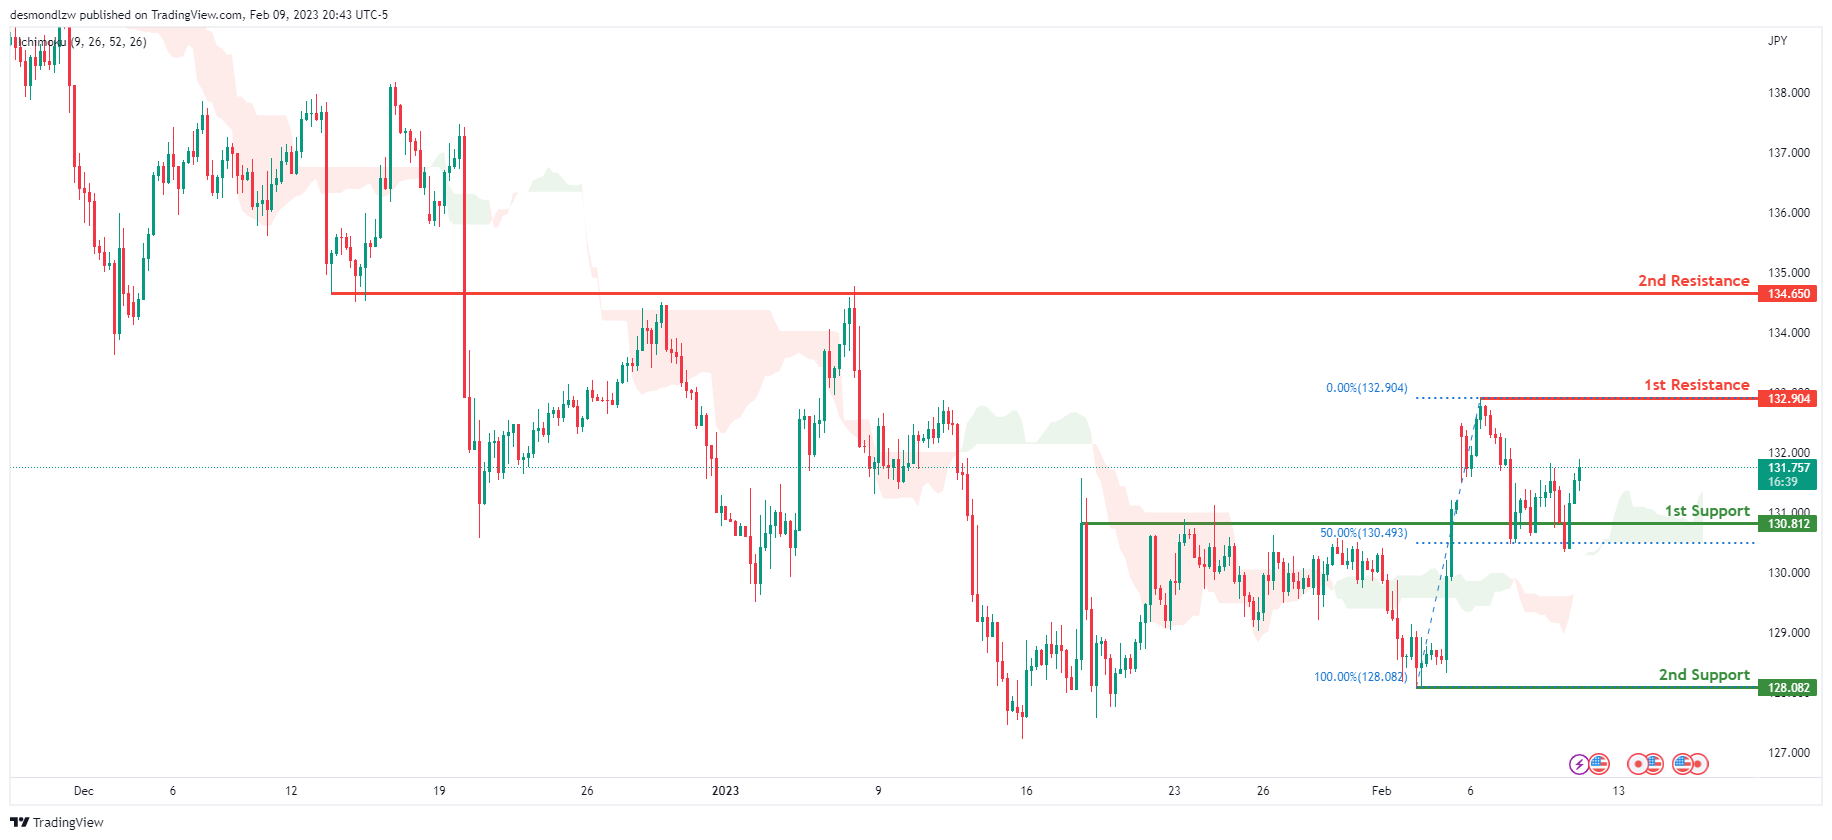
Looking at the H4 chart, my overall bias for USDJPY is bullish due to the current price crossing above the Ichimoku cloud, indicating a bullish market. If this bullish momentum continues, expect the price to possibly continue heading towards the 1st resistance at 132.904, where the recent high is. In an alternate scenario, price could possibly head back down to retest the 1st support at 130.812, where the overlap support and 50% Fibonacci line is.
Areas of consideration:
- H4 time frame, 1st resistance at 132.904
- H4 time frame, 1st support at 130.812
DXY:
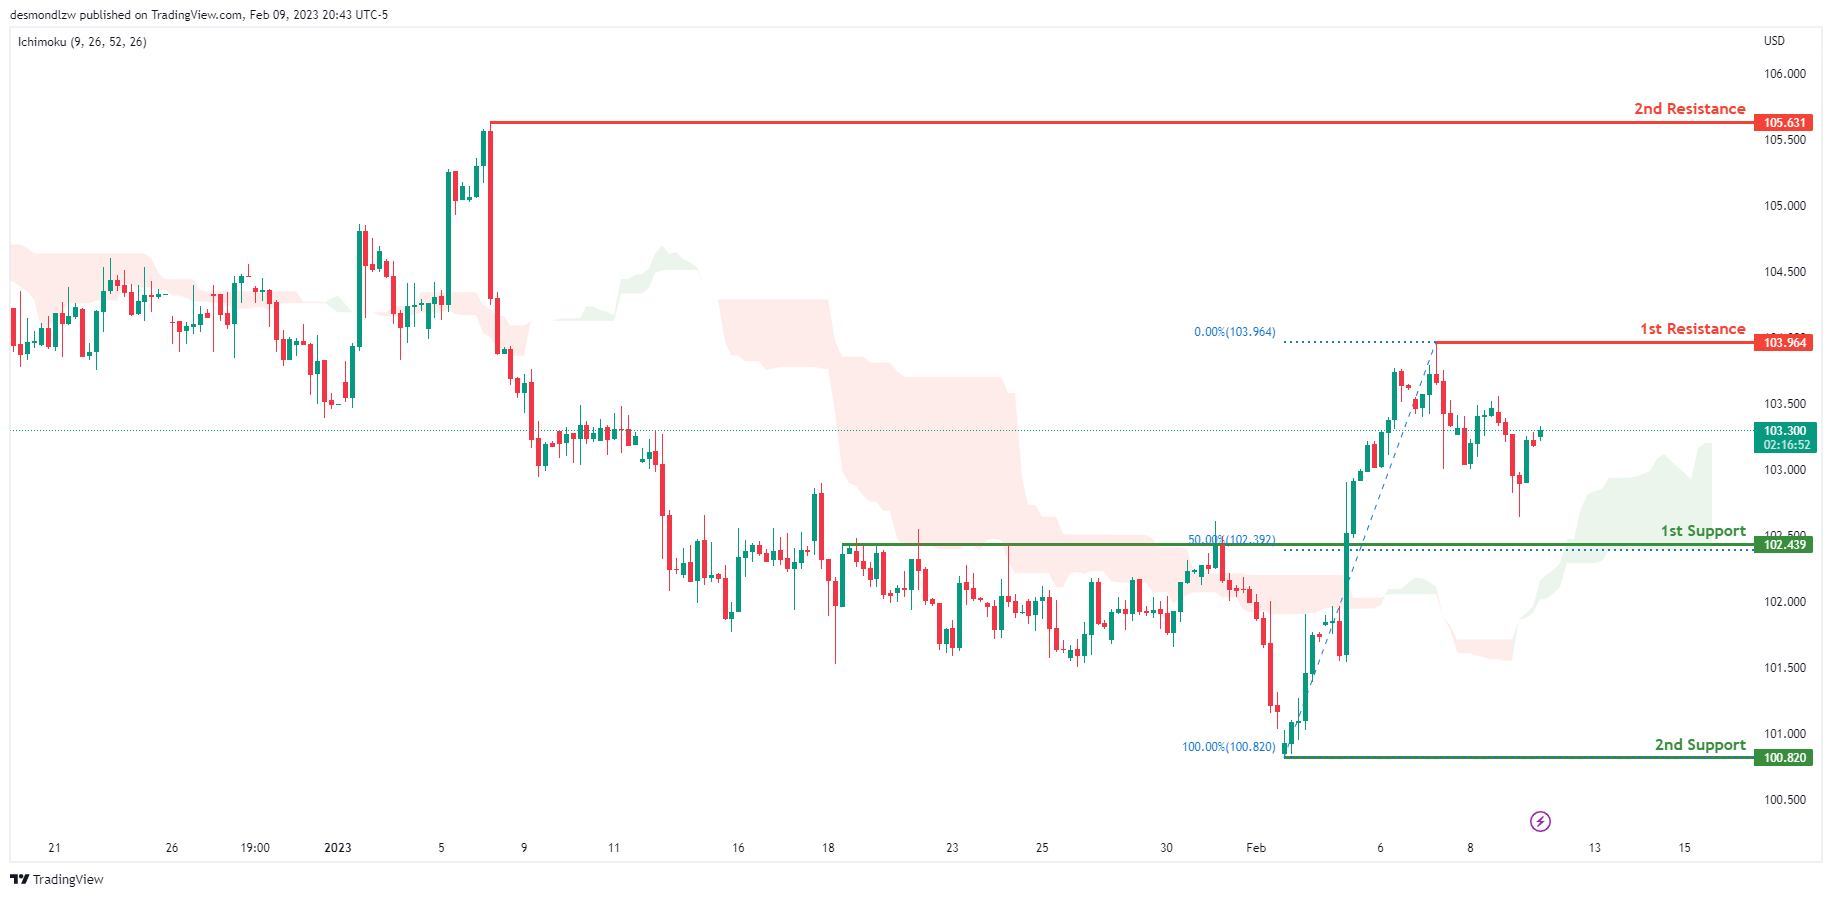
Looking at the H4 chart, my overall bias for DXY is bullish due to the current price crossing above the Ichimoku cloud, indicating a bullish market. If this bullish momentum continues, expect the price to possibly continue heading towards the 1st resistance at 103.964, where the previous swing high is. In an alternative scenario, price could head back down to retest the 1st support at 102.439, where the 50% Fibonacci line and overlap support is.
Areas of consideration:
- H4 time frame, 1st resistance at 103.964
- H4 time frame, 1st support at 99.241
EUR/USD:
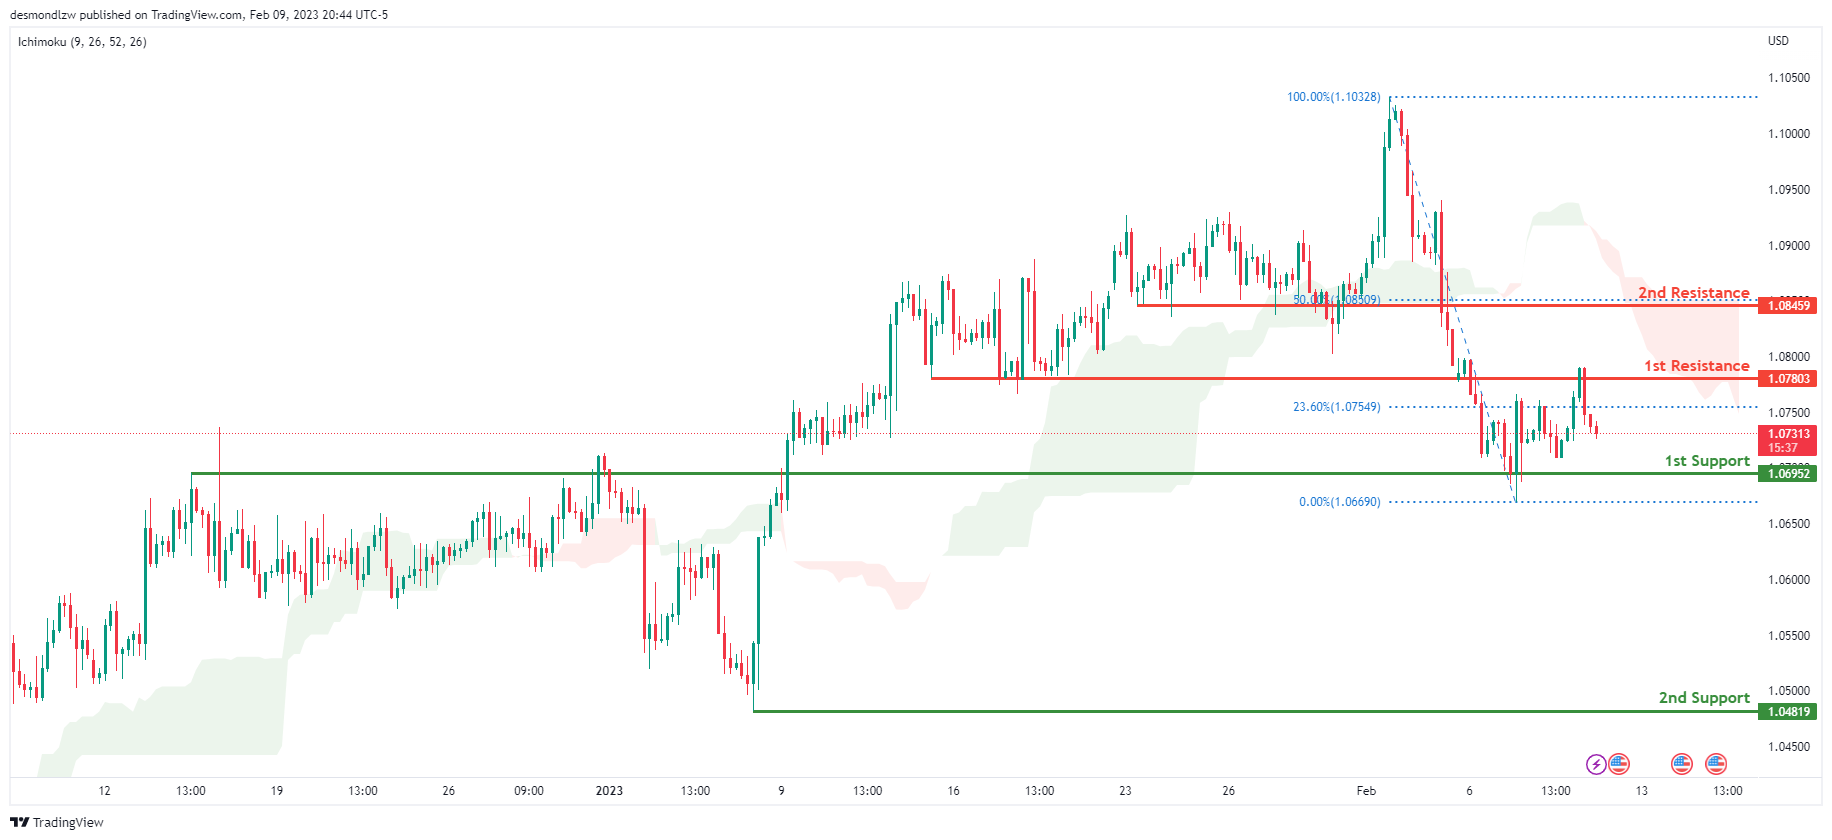
Looking at the H4 chart, my overall bias for EURUSD is bearish due to the current price crossing below the Ichimoku cloud, indicating a bearish market structure. If this bearish momentum continues, expect the price to possibly continue heading towards the 1st support at 1.06952, where the overlap support is. In an alternate scenario, price could possibly head back up to retest the 1st resistance at 1.07803, where the overlap resistance and 23.6% Fibonacci line is.
Areas of consideration :
- H4 1st resistance at 1.07803
- H4 1st support at 1.06952
GBP/USD:
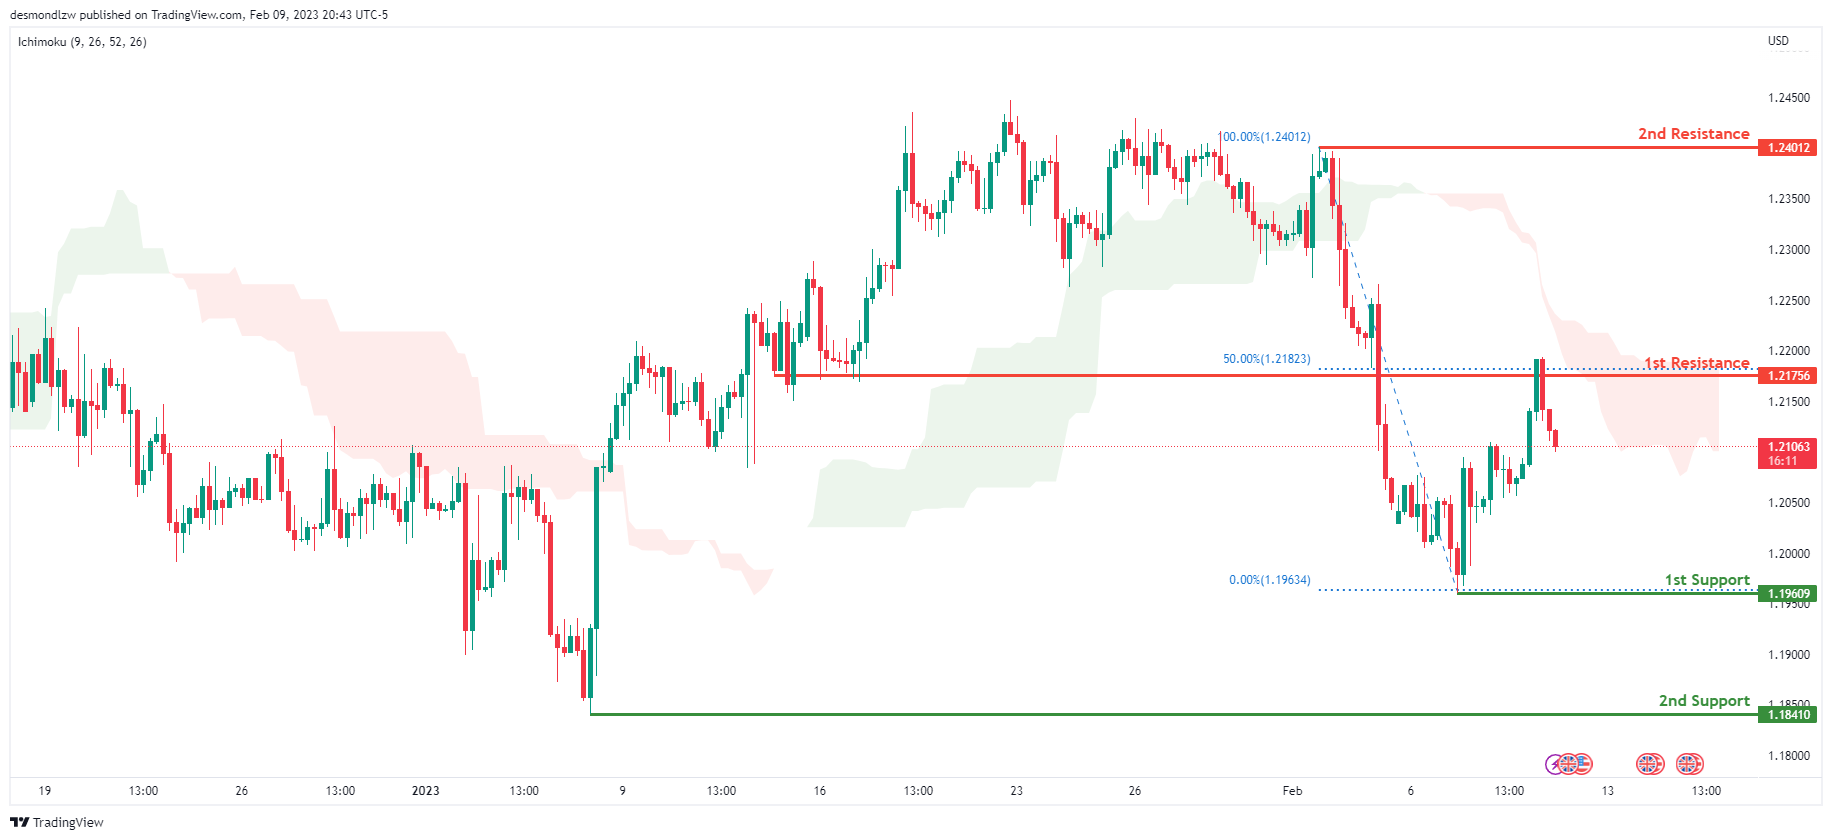
Looking at the H4 chart, my overall bias for GBPUSD is bearish due to the current price crossing below the Ichimoku cloud, indicating a bearish market. If this bearish momentum continues, expect the price to possibly continue to head towards the 1st support at 1.19609, where the recent swing low is. In an alternate scenario, price could head back up to retest the 1st resistance line at 1.21756 where the overlap resistance and 50% Fibonacci line is.
Areas of consideration:
- H4 1st resistance at 1.21756
- H4 1st support at 1.19609
USD/CHF:
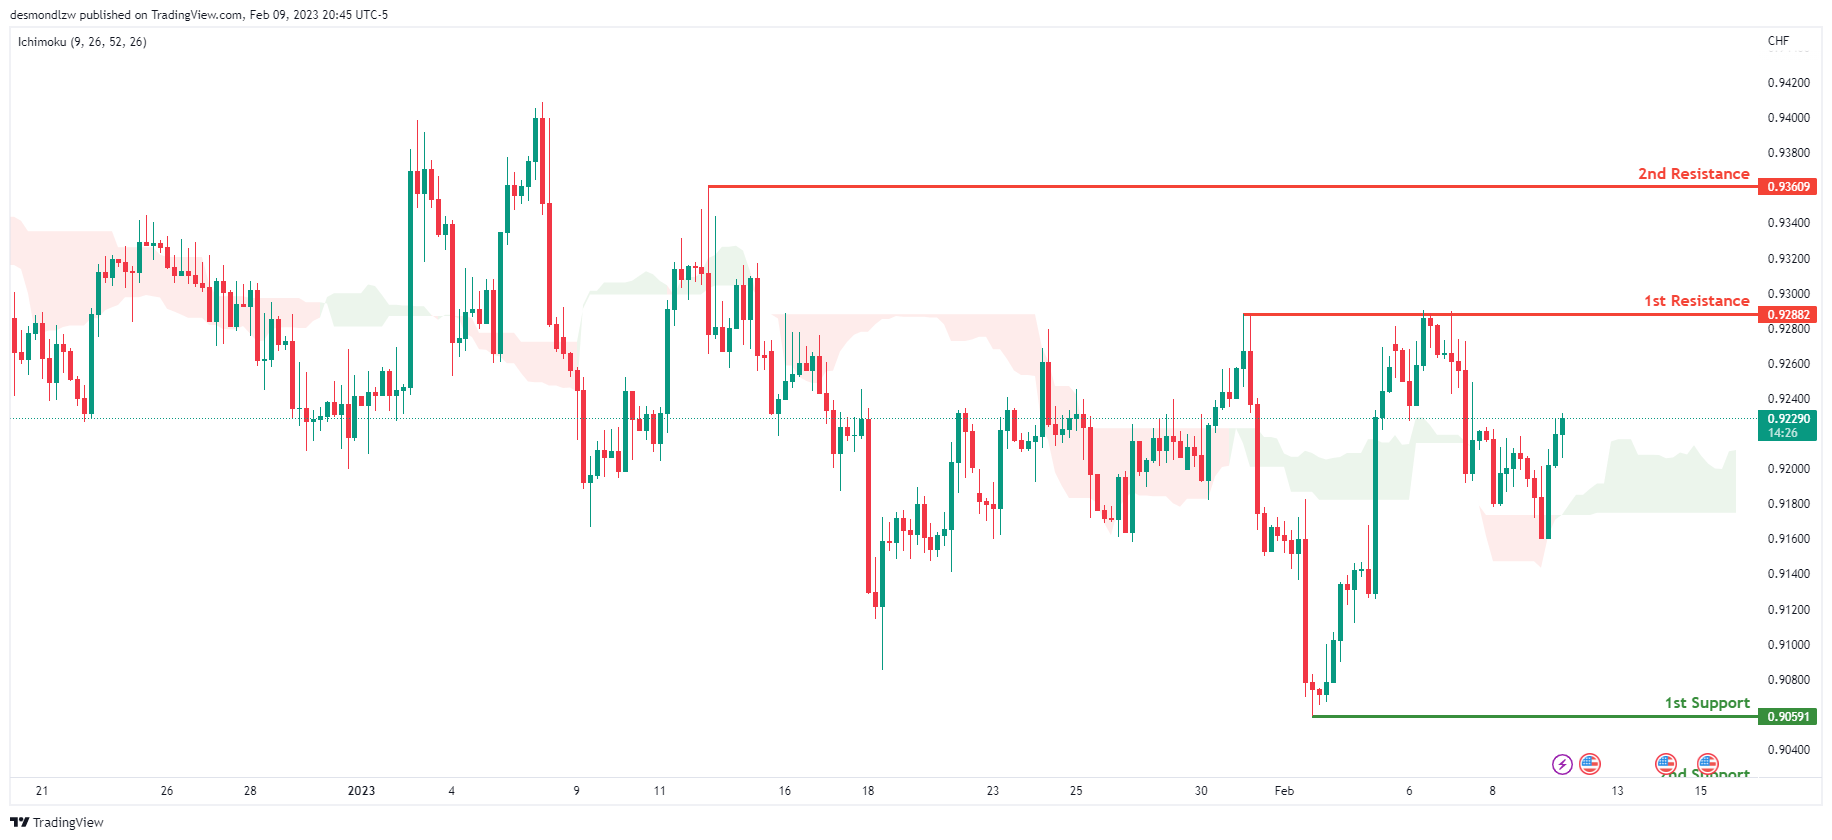
Looking at the H4 chart, my overall bias for USDCHF is bullish due to the current price being above the Ichimoku cloud, indicating a bullish market. If the current bullish trend continues, expect the price to possibly break the 1st resistance at 0.92882, where the previous swing high is, before heading towards the 2nd resistance at 0.93609 where the intermediate high is. In an alternative scenario, price could possibly head back down to retest the 1st support at 0.90591, where the recent swing low is.
Areas of consideration
- H4 1st support at 0.90591
- H4 1st resistance at 0.92882
- H4 2nd resistance at 0.93609
XAU/USD (GOLD):
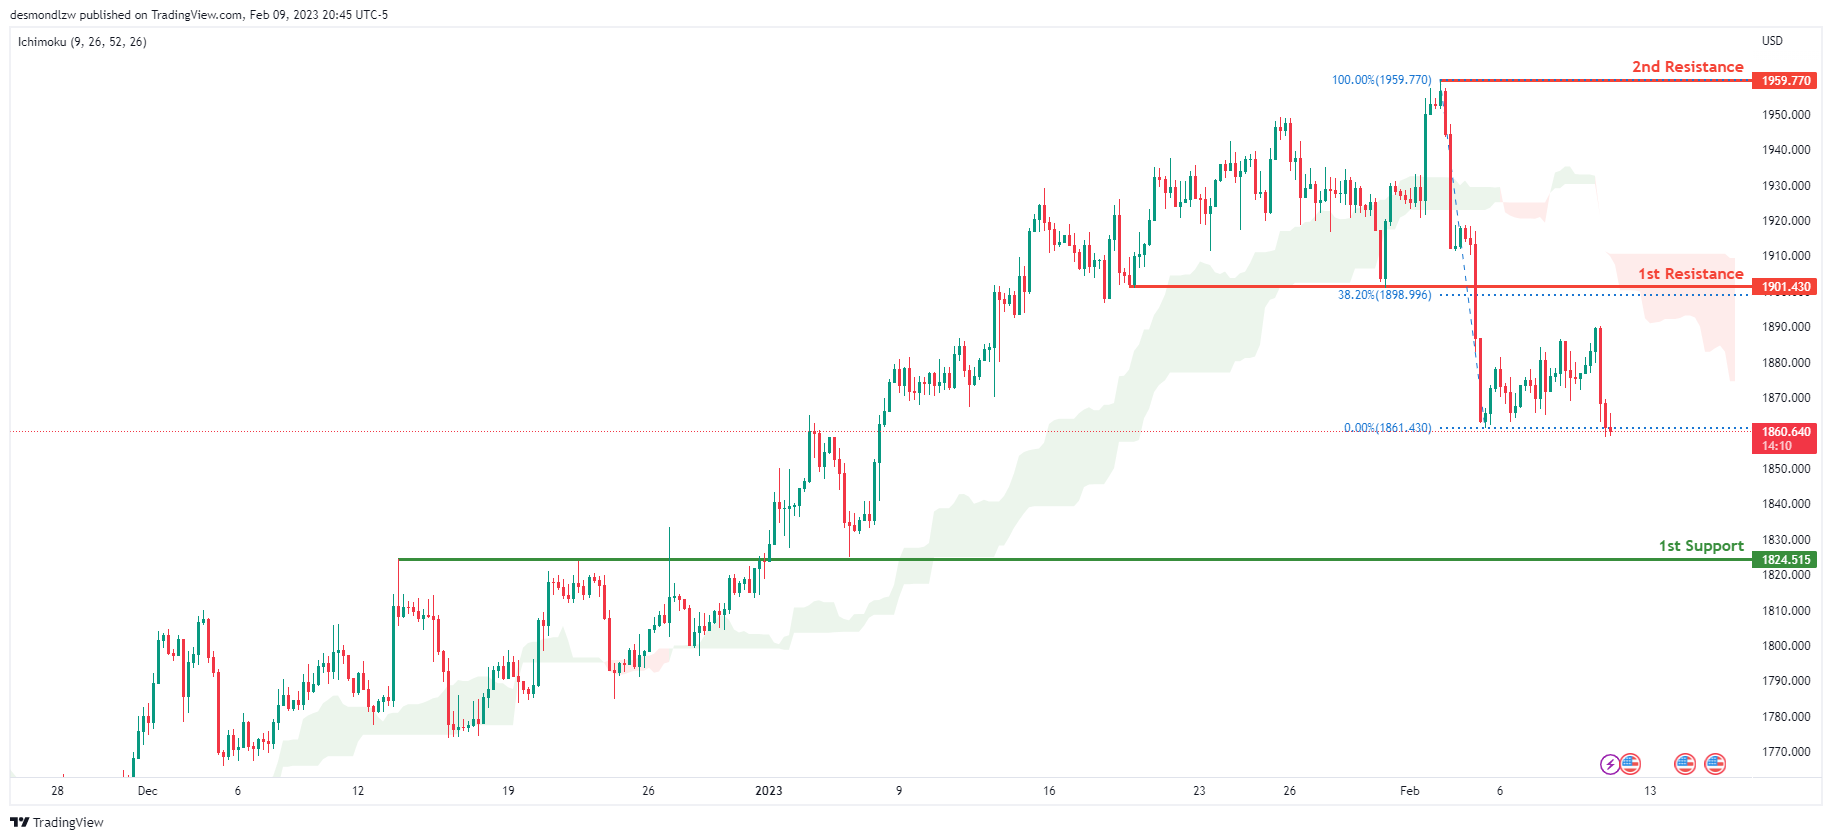
Looking at the H4 chart, my overall bias for XAUUSD is bearish due to the current price being below the Ichimoku cloud, indicating a bearish market. If this bearish momentum continues, expect the price to possibly continue heading towards the 1st support at 1824.515 where the overlap support is. In an alternative scenario, price could possibly head back up to retest the 1st resistance at 1901.430, where the overlap resistance and 38.2% Fibonacci line is.
Areas of consideration:
- H4 time frame, 1st resistance at 1901.430
- H4 time frame, 1st support at 1824.515
AUD/USD:
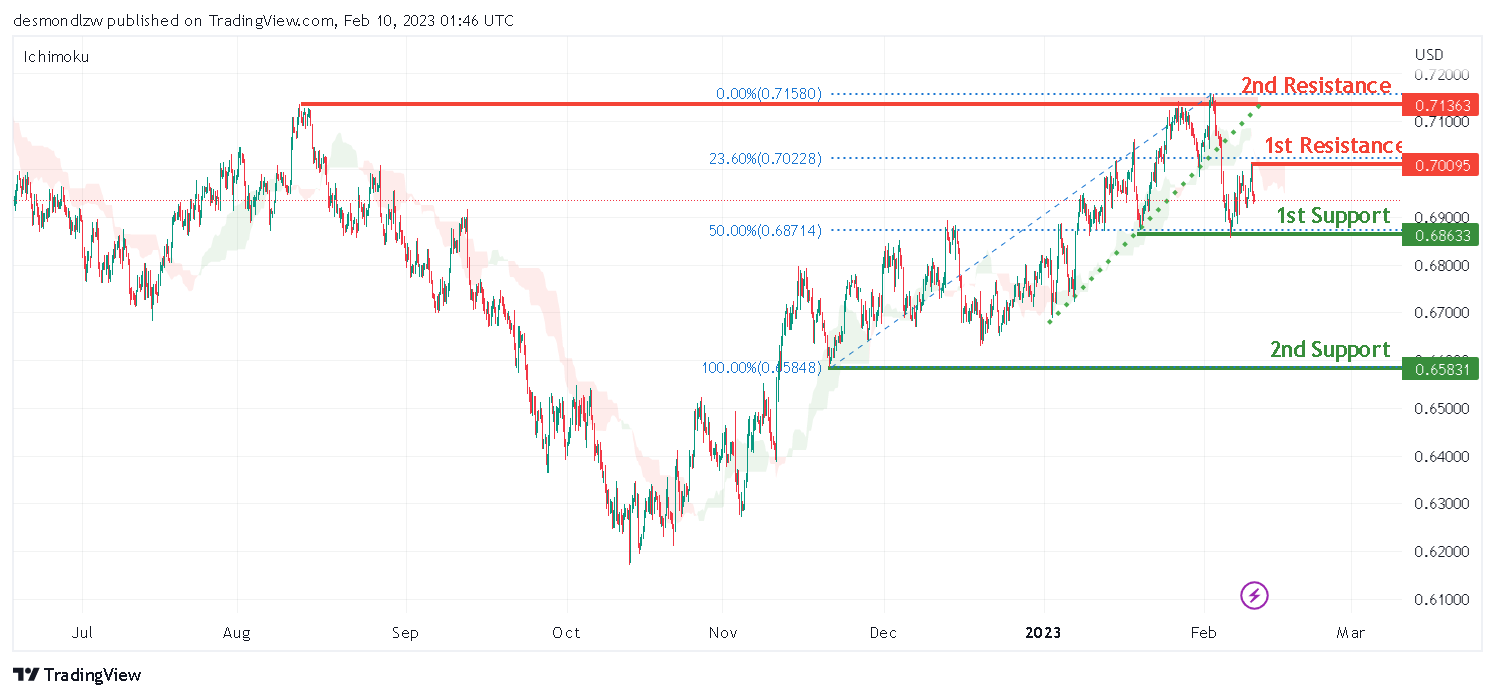
Looking at the H4 chart, my overall bias for AUDUSD is bearish due to the current price being below the Ichimoku cloud, and the ascending trend line has been broken, indicating a change of market structure.
The 1st support is at 0.68633 which is in line with the 50% Fibonacci retracement. The 2nd support is at 0.65831 which is the recent swing low.
In an alternate scenario, the price could possibly go back up towards the 1st resistance level at 0.70095 which is the recent swing high and in line with the 23.6% Fibonacci retracement. There is 2nd resistance at 0.71363 which is the previous swing high.
Areas of consideration
- H4. 2nd resistance at 0.71363
- H4. 1st resistance at 0.70095
- H4, 1st support at 0.68633
- H4, 2nd support at 0.65831
NZD/USD:
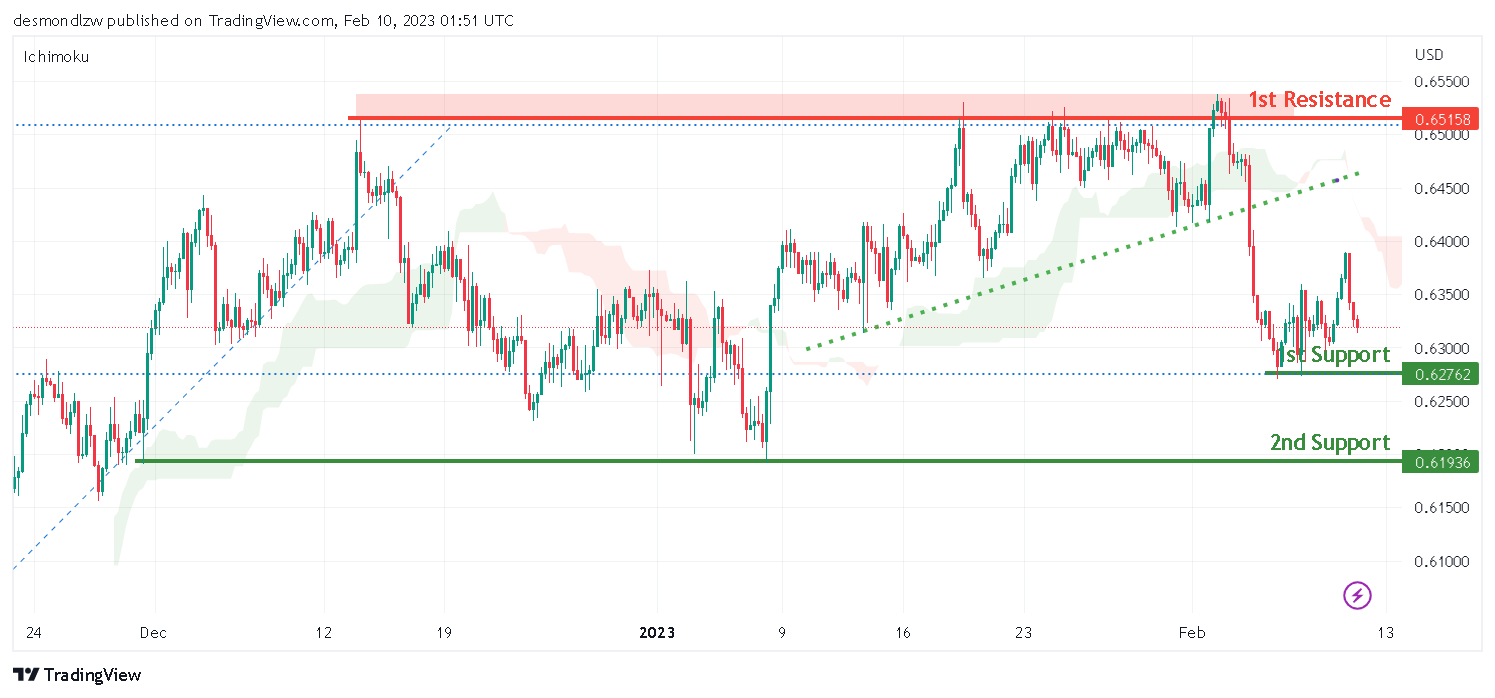
Looking at the H4 chart, my overall bias for NZDUSD is bearish, as the current price is below the Ichimoku Cloud, and the ascending trend line has been broken, indicating a change of market structure. Expecting the price to go down towards the 1st support at 0.62762 which is the recent overlap swing low. It is also inline with 23.6% Fibonacci retracement. The 2nd support is at 0.61936.
In an alternate scenario, price could possibly go up towards the 1st resistance level at 0.65158 which is the recent overlap swing high. There is an intermediate resistance at 0.63636 which is in line with 50% Fibonacci retracement.
Areas of consideration:
- H4 time frame, 1st resistance at 0.65158
- H4 time frame, intermediate resistance at 0.65158
- H4 time frame, 1st support at 0.62762
- H4 time frame, 2nd support at 0.61936
USD/CAD:
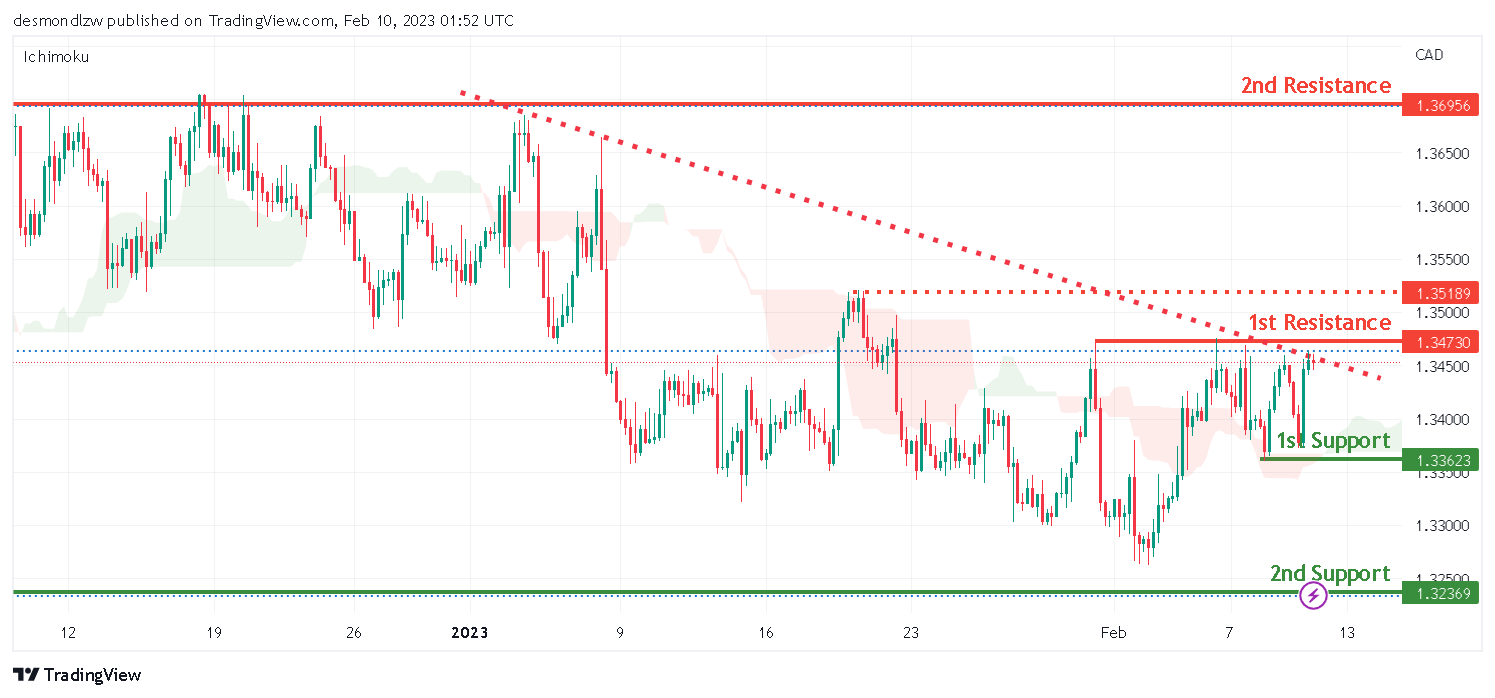
Looking at the H4 chart, my overall bias for USDCAD is bearish , as there is a descending trend line. Expecting the current price is head down towards the 1st support at 1.33623 which is the recent swing low. The 2nd support is at 1.32369 which is the previous swing low.
In an alternative scenario, the price could possibly head up to the 1st resistance at 1.34730 which is the recent swing high and also in line with the 50% Fibonacci retracement. The 2nd resistance is at 1.36933 which is the previous swing high.
Areas of consideration:
- H4 time frame, 2nd resistance at 1.36933
- H4 time frame, 1st resistance at 1.34730
- H4 time frame, 1st support at 1.33623
- H4 time frame, 2nd support at 1.32369
OIL:
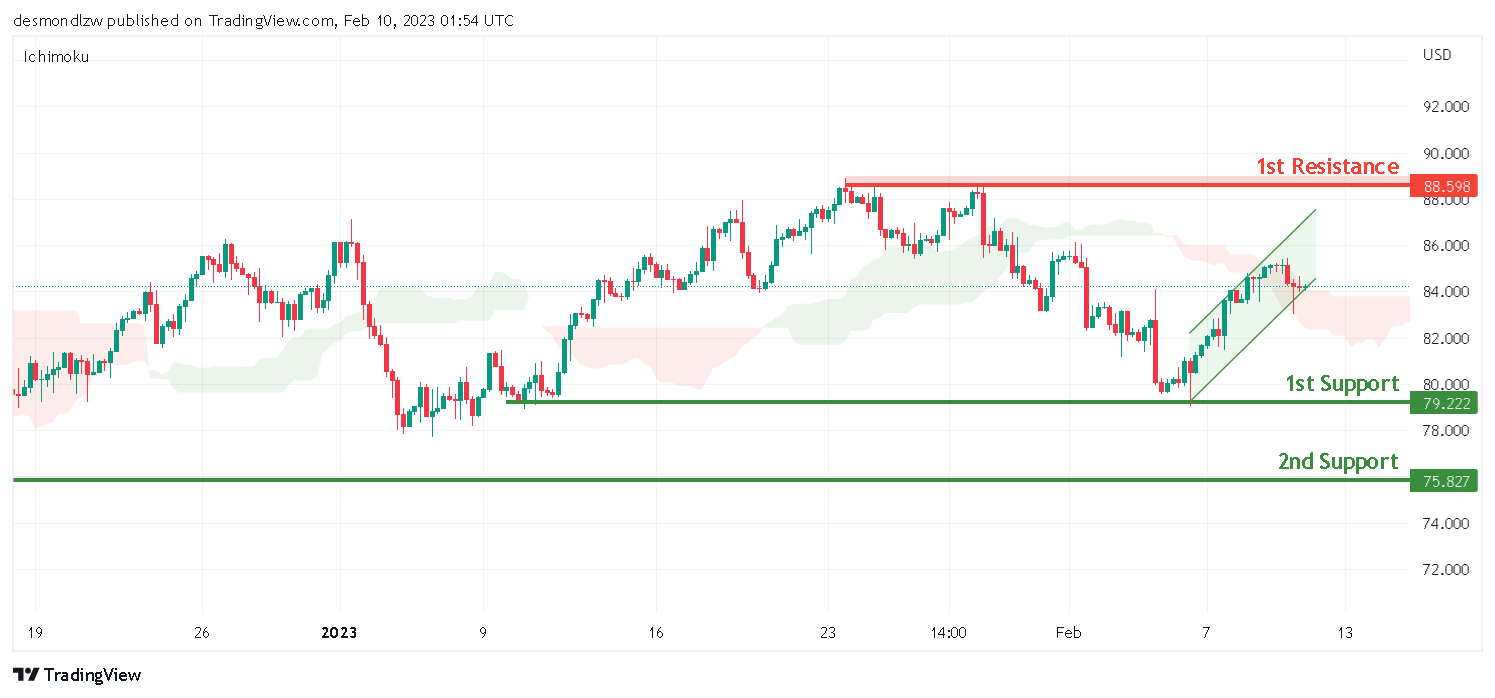
Looking at the H4 chart, my overall bias for BOC is bullish.as the there is an ascending channel, Expecting the price head up towards the 1st resistance level at 88.598 which is the recent swing high , before it heads down to the 2nd support at 75.827 which is the recent swing low.
In an alternate scenario, the price could possibly head down towards the 1st support level at 79.222 which is the recent overlap swing low, before the price drops to the 2nd support at 75.827.
Areas of consideration:
- H4 time frame, 1st resistance at 88.598
- H4 time frame,1st support at 79.587
- H4 time frame, 2nd support at 75.827
Dow Jones Industrial Average:
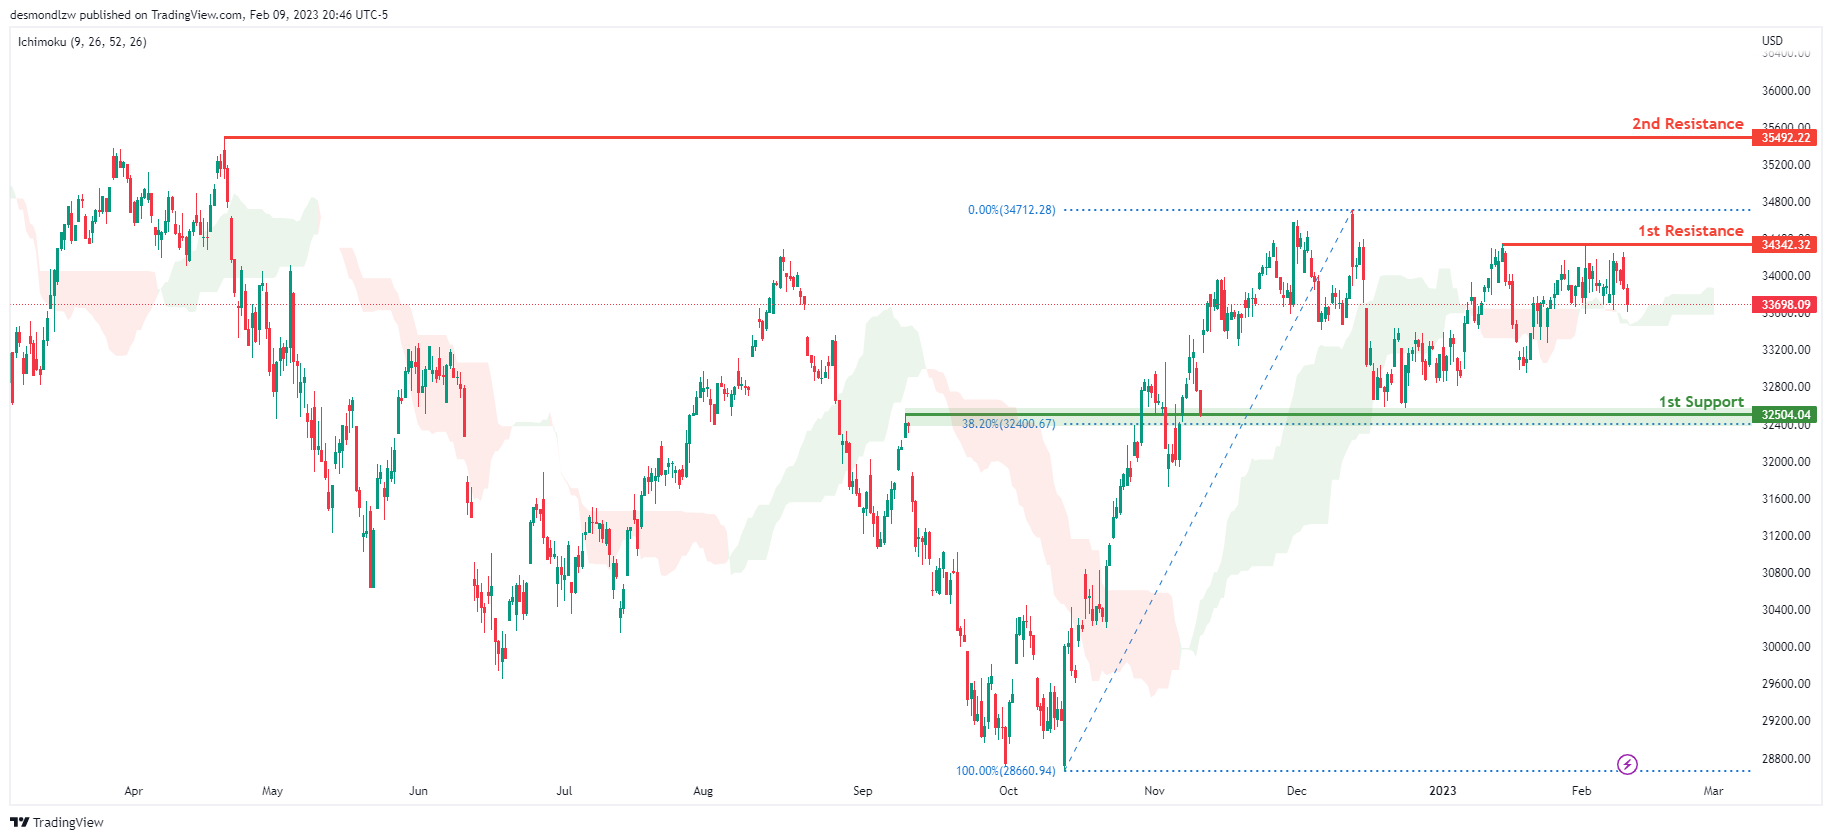
On the H4 chart, the overall bias for DJI is bullish. To add confluence to this, the price is crossing above the Ichimoku cloud which indicates a bullish market. If this bullish momentum continues, expect the price to possibly continue heading towards the 1st resistance line at 34342.32, where the recent swing high is. In an alternative scenario, price could possibly head back down towards the 1st support at 32581.97, slightly above where the 38.2% Fibonacci line is.
Areas of consideration:
- H4 time frame, 1st support at 32581.97
- H4 time frame, 1st Resistance at 34342.32
DAX:
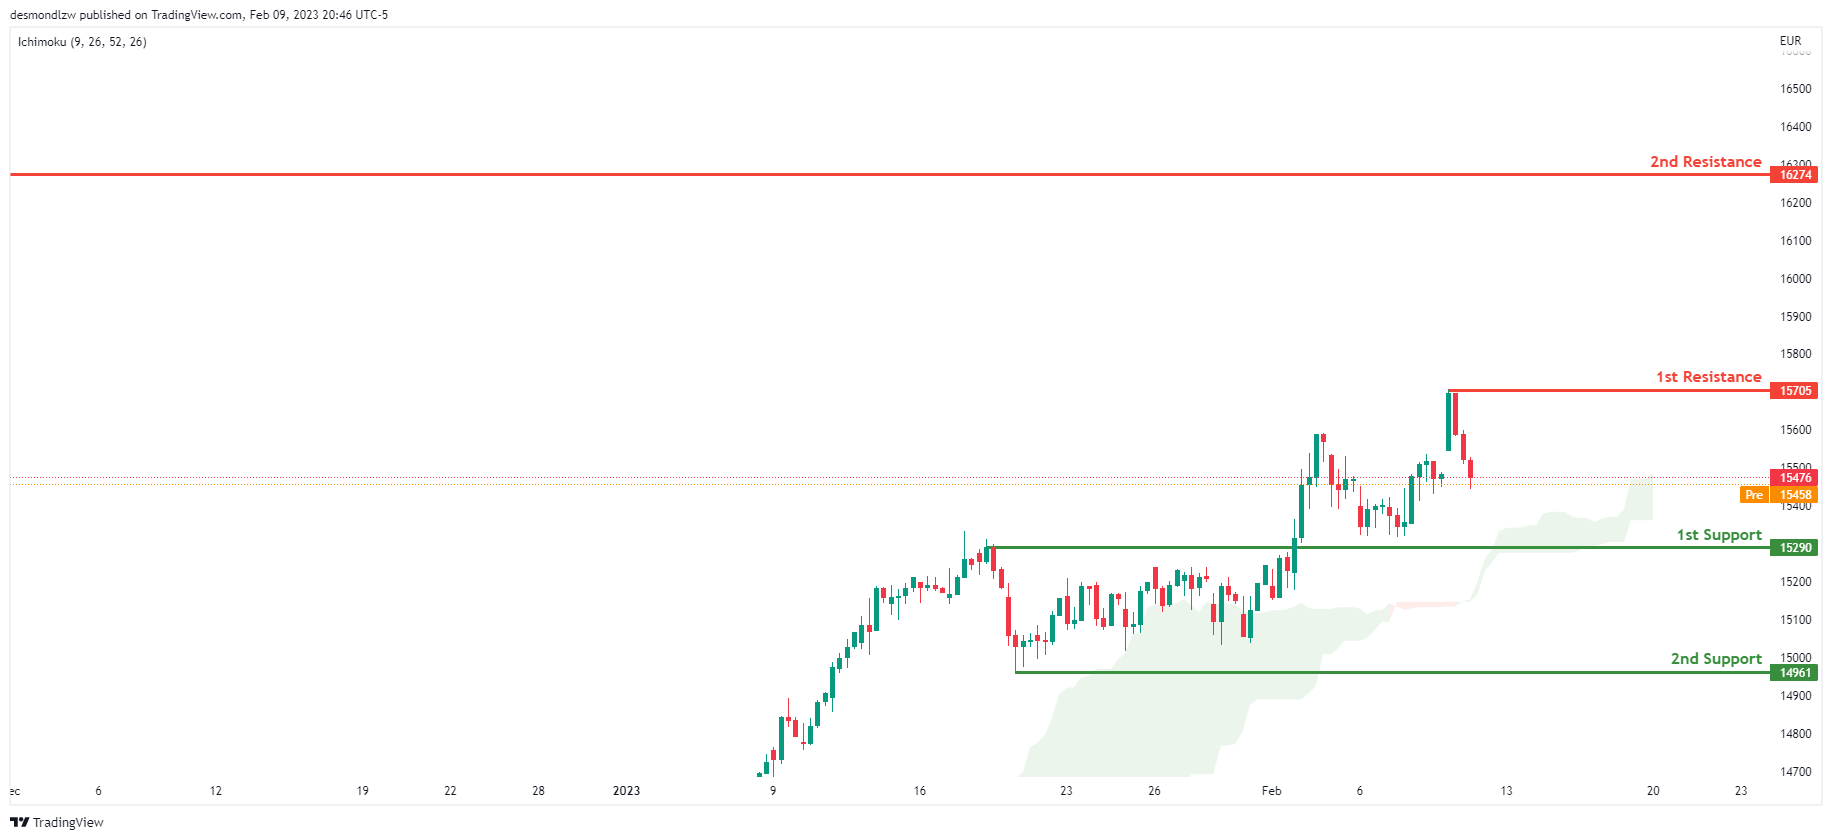
Looking at the H4 chart, my overall bias for DAX is bullish due to the current price crossing above the Ichimoku cloud, indicating a bullish market. If this bullish momentum continues, expect the price to possibly head towards the 1st resistance line at 15705, where the recent high is. In an alternative scenario, price could possibly head down to retest the 1st support at 15290, where the overlap support is.
Areas of consideration:
- H4 time frame, 1st resistance is at 15705
- H4 time frame, 1st support is at 15290
ETHUSD:
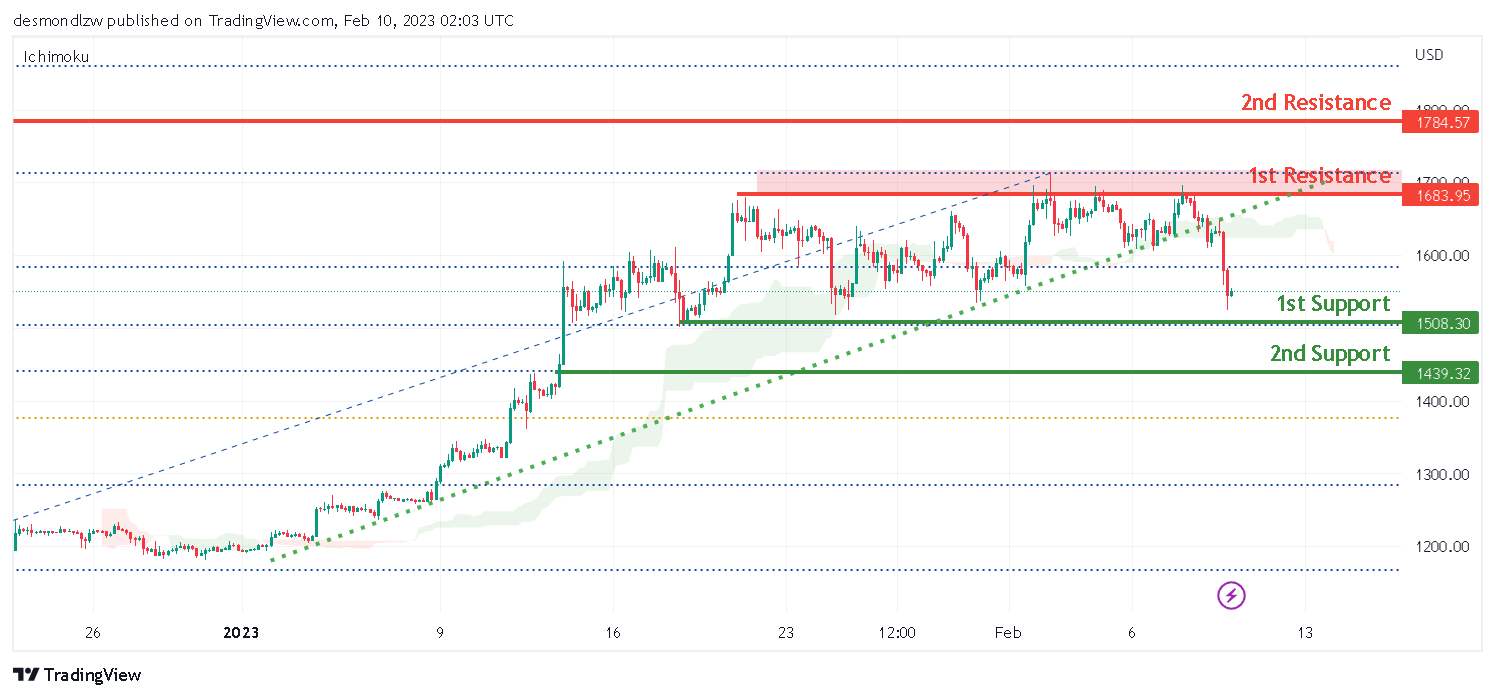
Looking at the H4 chart, my overall bias for ETHUSD is slightly bearish, the strong ascending trend line has been broken. Expecting the price to go down to break the 1st support line at 1508.30 which is the recent swing low, before it heads towards the 2nd support at 1439.32 which is in line with 50% Fibonacci retracement.
In an alternate scenario, the price may go up and break the 1st resistance line at 1683.95 before breaking the 2nd resistance line at 1784.57 which is the recent swing high.
Areas of consideration:
- H4 time frame, 2nd resistance of 1784.57
- H4 time frame, 1st resistance of 1683.95
- H4 time frame, 1st support at 1508.30
- H4 time frame, 2nd support at 1439.32
BTCUSD:
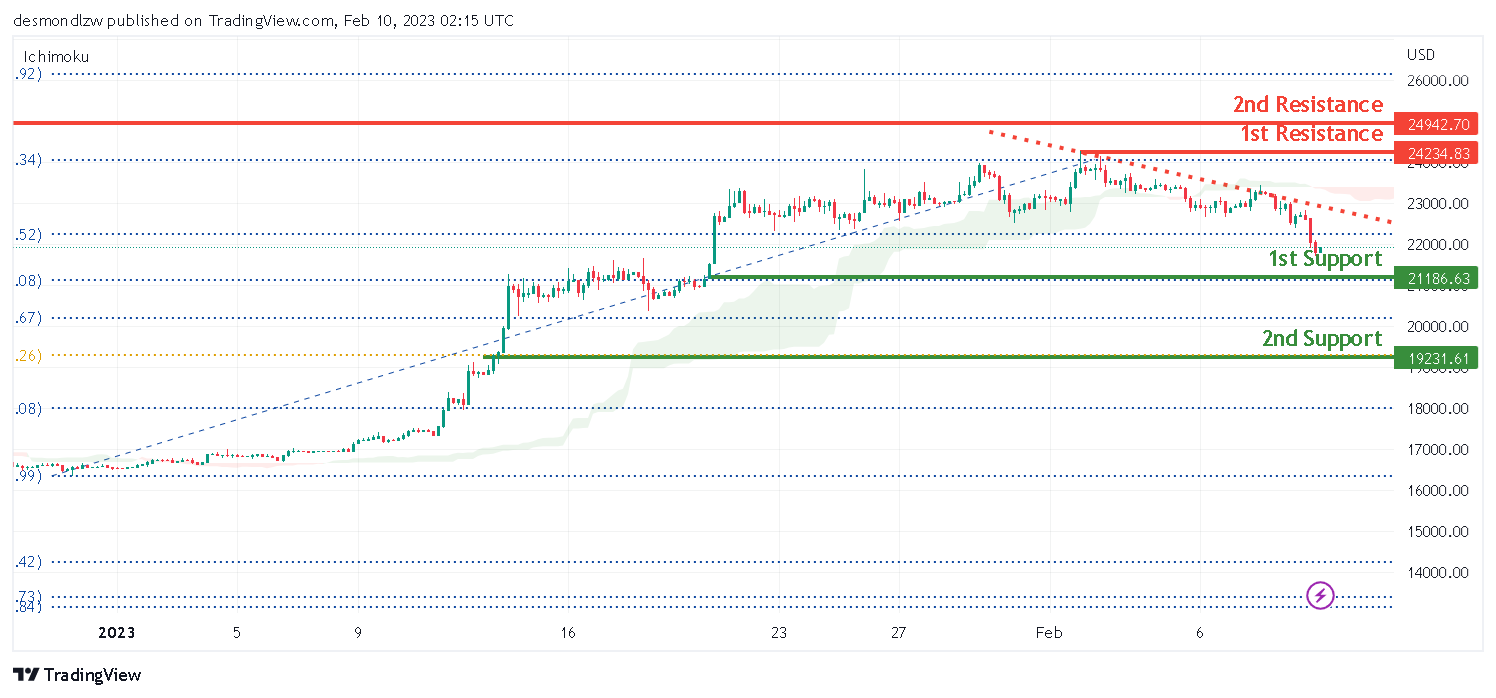
Looking at the H4 chart, my overall bias for BTCUSD is bearish. An ascending channel has broken, a descending channel was created, expecting the price to break the 1st support line at 20698.01 which is in line with 38.2% Fibonacci retracement, before heading down towards the 2nd support at 19231.61 which is in line with 61.8% Fibonacci retracement.
In an alternative scenario, the price could possibly head up to the 1st resistance at 24234.83 which is the recent swing high
Areas of consideration:
- H4 time frame, 2nd resistance 24942.70
- H4 time frame, 1st resistance 24234.83
- H4 time frame, 1st support at 20698.01
- H4 time frame, 2nd support at 19231.61
S&P 500:
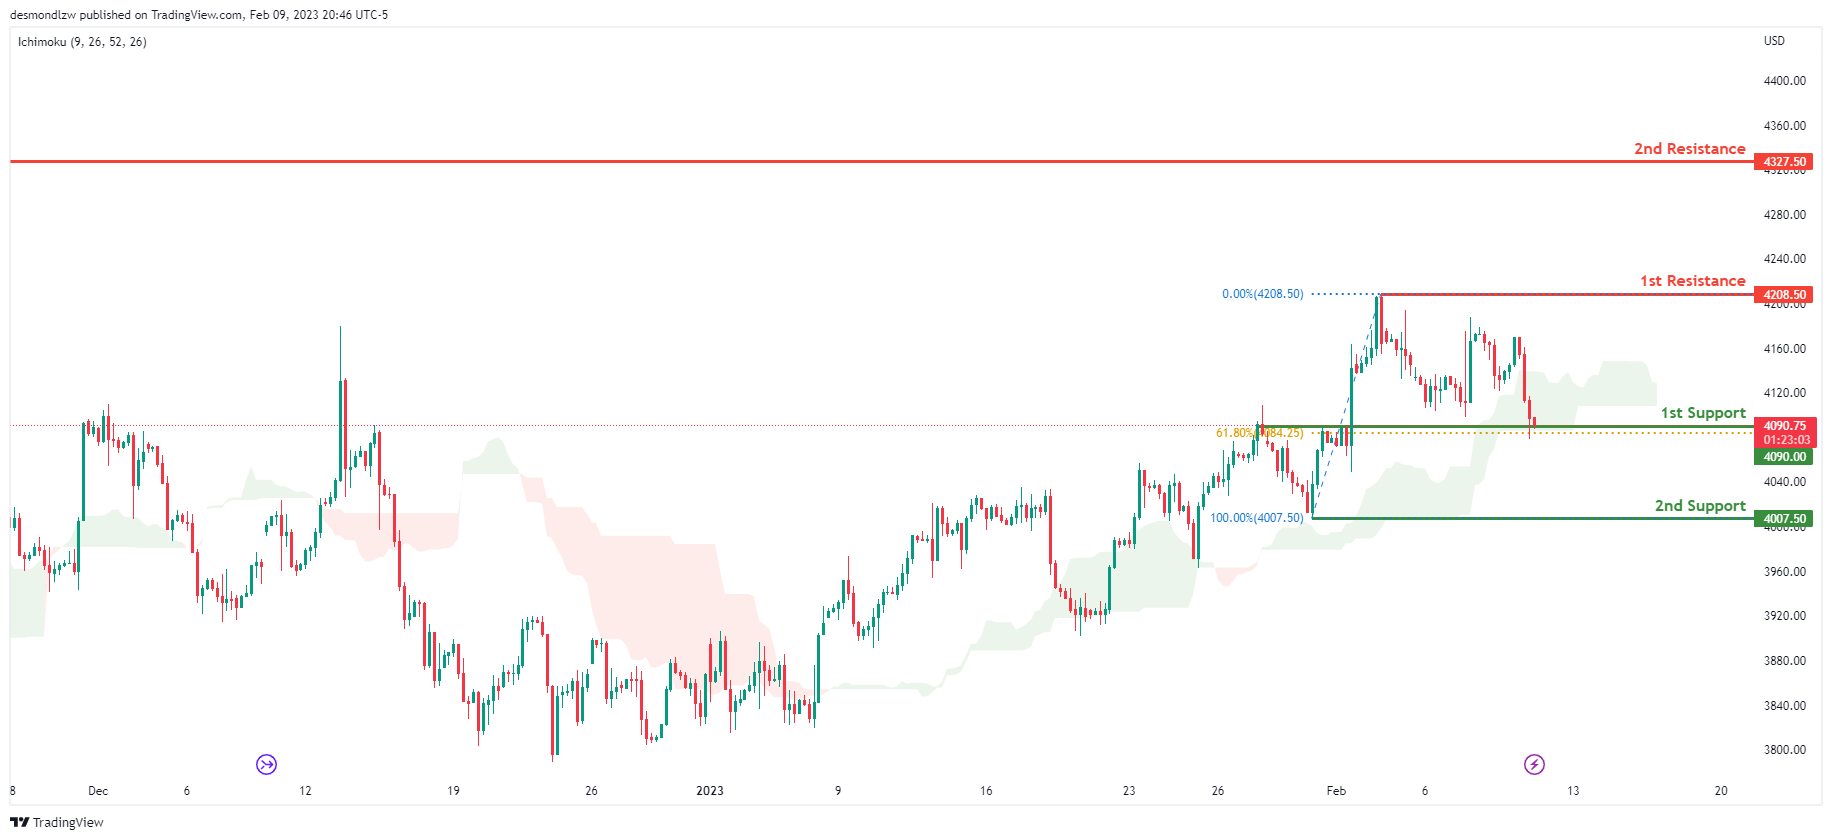
Looking at the H4 chart, my overall bias for S&P500 is bullish due to the current price being above the Ichimoku cloud, indicating a bullish market. If this bullish momentum continues, expect the price to possibly break the 1st resistance at 4208.50, where the recent swing high is., before heading towards the 2nd resistance at 4327.50 where the previous swing high is, In an alternative scenario, price could possibly head back down to retest the 1st support at 4090.00, where the 50% Fibonacci line is.
Areas of consideration:
- H4 time frame, 1st support at 4090.00
- H4 time frame, 1st resistance at 4208.50
- H4 time frame, 2nd resistance at 4327.50
Focus Turns to UK GDP and Canada Employment for Direction
The markets are overall staying in directionless mode for now. Dollar's selloff overnight didn't last, as risk rally faded quickly. The greenback in actually the strongest one in Asian session, while Aussie and Kiwi are the weakest, indicating some risk aversion. As for the week, Sterling is so far the best performer, followed by Swiss Franc while Euro is the worst, followed by Canadian. Risk sentiment will continue to be the main driver overall, if investors could made up their mind.
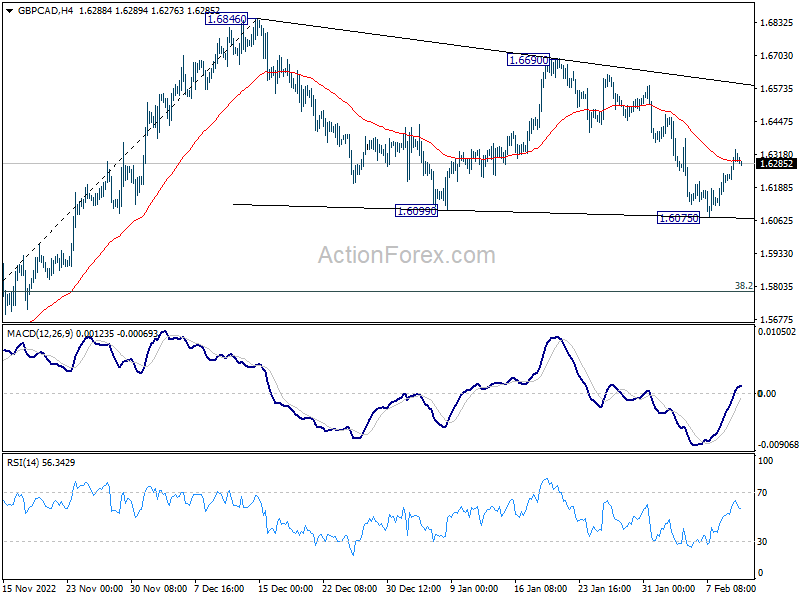
GBP/CAD is a pair to watch today given that UK GDP and Canada employment data are featured. Technically, it's possible that the corrective pattern from 1.6846 has completed with three waves to 1.6075. Sustained trading above 4 hour 55 EMA (now at 1.6294) will affirm this case and bring stronger rise back to 1.6690/6846 resistance first. Nevertheless, rejection by 4 hour 55 EMA will open up another fall to 1.6075 and below, before the corrective pattern completes.
In Asia, at the time of writing, Nikkei is up 0.23%. Hong Kong HSI is down -2.01%. China Shanghai SSE is down -0.56%. Singapore Strait Times is down -0.23%. Japan 10-year JGB yield is up 0.001 at 0.499. Overnight, DOW dropped -0.73%. S&P 500 dropped -0.88%. NASDAQ dropped -1.02%. 10-year yield rose 0.030 to 3.683.
Japan PPI slowed to 9.5% yoy in Jan, CGPI staying at record high
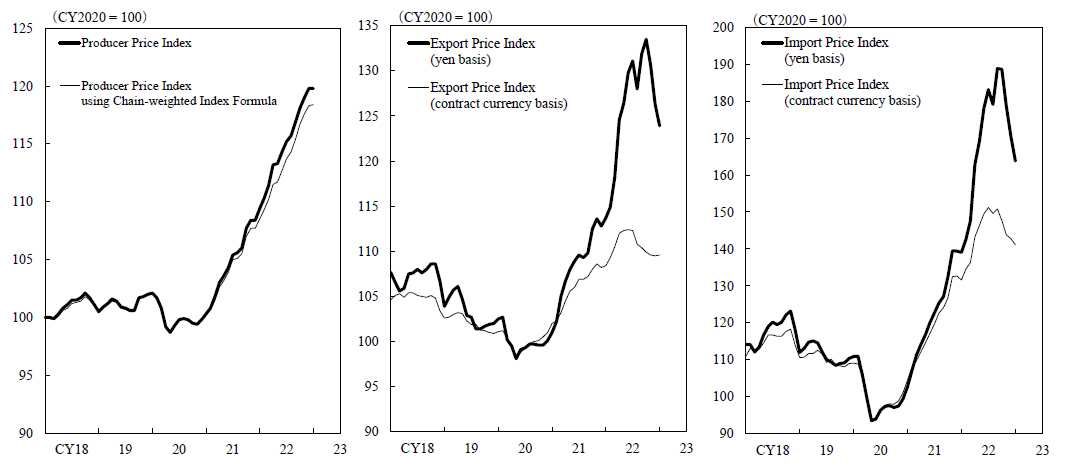
Japan PPI slowed from 10.5% yoy to 9.5% yoy in January, below expectation of 11.2% yoy. Sitting at 119.8 and unchanged from prior month, corporate goods price index matched the record high made in December.
On Yen basis, export price index slowed further to 9.0% yoy, comparing to the peak of 20.1% yoy made in September. Import price index also slowed to 17.8% yoy, comparing to the peak of 49.2% made in July. For the month, export price index declined for the third month, by -1.9% mom. Import price index dropped for the fourth month, by -3.9% mom.
Japan FM Suzuki will discuss joint statement with BoJ with new governor
Japan Finance Minister Shunichi Suzuki said that the goals as mentioned in the joint statement with BoJ signed back in 2013 "remains important policy challenges". He mentioned that targets like "the need to pull Japan out of deflation and achieve stable economic growth."
But he also mentioned the possibility of revising the join statement with new BoJ Governor. "What to do with the statement is something the government must discuss with the new governor," Suzuki told parliament. Nevertheless, it's premature to decide whether it's necessary for the revision as the government has yet to nominate the new BoJ head.
Separately, Tsuyoshi Takagi, the ruling Liberal Democratic Party's parliament affairs chief for the lower house, said that the government will present its nomination for the new BoJ Governor and the two deputies on February 13. Jun Azumi, an executive of the opposition Constitutional Democratic Party of Japan said hearings would be held at the lower house on February 24.
RBA SoMP: No GDP contraction, trimmed mean inflation to stay higher and longer
In the Statement on Monetary Policy, RBA reiterated that "further increases in interest rates will be needed to ensure that the current period of high inflation is only temporary."
"In assessing how much further interest rates need to increase, the Board will be paying close attention to developments in the global economy, trends in household spending and the outlook for inflation and the labour market."
The economy is not forecast to contract within the projection horizon. Meanwhile, trimmed mean inflation is projected to stay higher and longer till mid 2024.
Year-average GDP growth forecast to be (from 3.75% in 2022):
- 2.25% in 2023 (unchanged from prior forecast).
- 1.50% in 2024 (unchanged).
- 1.75% in 2024/25 year (new).
Headline CPI (7.8% in December 2022) is projected to slow to:
- 6.75% in June 2023 (unchanged).
- 4.75% in December 2023 (unchanged).
- 3.50% in June 2024 (down from 4.25%).
- 3.25% in December 2024 (unchanged).
- 3.00% in June 2025 (new).
Trimmed mean CPI (6.9% in December 22) is projected to slow to:
- 6.25% in June 2023 (up from 5.50%).
- 4.25% in December 2024 (up from 3.75%).
- 3.25% in June 2024 (down from 3.50%).
- 3.00% in December 2024 (down from 3.25%).
- 3.00% in June 2025 (new).
Looking ahead
UK GDP, production, goods trade balance will be released in European session. Italy will release industrial output. Later in the day, Canada employment will be a major focus, but don't forget US U of Michigan consumer sentiment too.
GBP/USD Daily Outlook
Daily Pivots: (S1) 1.2052; (P) 1.2123; (R1) 1.2189; More...
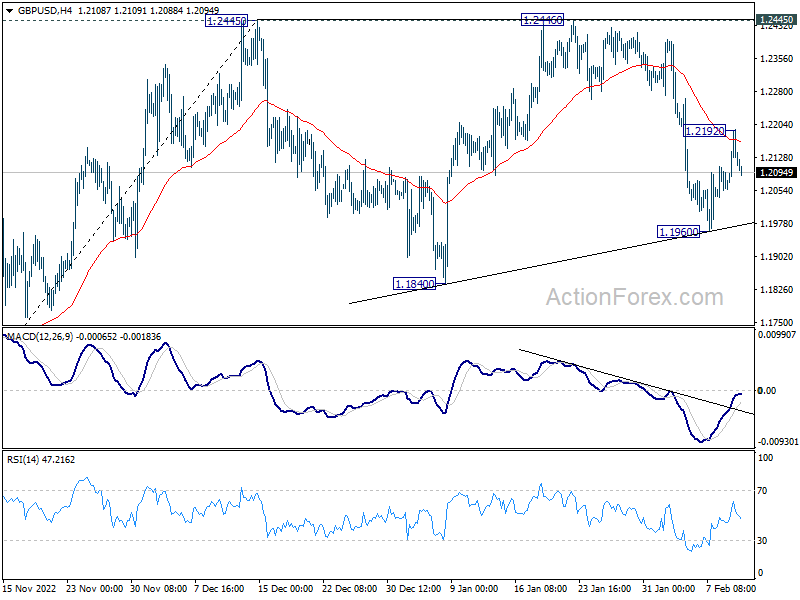
Despite recovering to 1.2192, GBP/USD failed to sustain above 4 hour 55 EMA and retreated. Intraday bias is turned neutral again. On the upside, break of 1.2192 will affirm the case that corrective pattern from 1.2445 has completed with three waves to 1.1960. Further rise would be seen back to 1.2445/6. Decisive break there will resume larger rise from 1.0351. On the downside, through break of 1.1960 will extend the corrective pattern with another fall to 1.1840 support and possibly below.
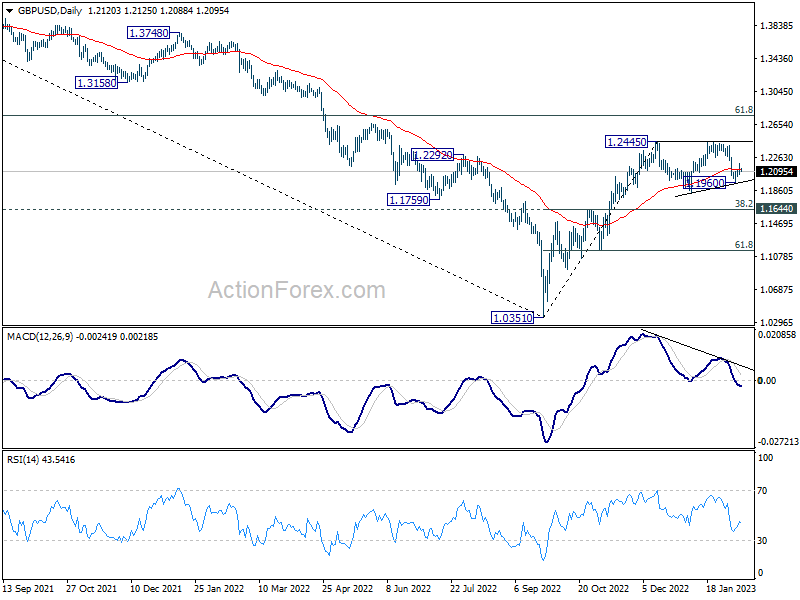
In the bigger picture, rise from 1.0351 medium term bottom is at least correcting whole down trend from 1.4248 (2021 high). Further rise is expected as long as 1.1644 resistance turned support holds. Next target is 61.8% retracement of 1.4248 to 1.0351 at 1.2759. Sustained break there will pave the way back to 1.4248.
Economic Indicators Update
| GMT | Ccy | Events | Actual | Forecast | Previous | Revised |
|---|---|---|---|---|---|---|
| 23:50 | JPY | PPI Y/Y Jan | 9.50% | 11.20% | 10.20% | 10.50% |
| 00:30 | AUD | RBA Monetary Policy Statement | ||||
| 01:30 | CNY | CPI Y/Y Jan | 2.10% | 2.30% | 1.80% | |
| 01:30 | CNY | PPI Y/Y Jan | -0.80% | -0.50% | -0.70% | |
| 06:00 | JPY | Machine Tool Orders Y/Y Jan P | 1.00% | |||
| 07:00 | GBP | GDP M/M Dec | -0.30% | 0.10% | ||
| 07:00 | GBP | GDP Q/Q Q4 P | 0.00% | -0.30% | ||
| 07:00 | GBP | Industrial Production M/M Dec | -0.20% | -0.20% | ||
| 07:00 | GBP | Industrial Production Y/Y Dec | -5.30% | -5.10% | ||
| 07:00 | GBP | Manufacturing Production M/M Dec | -0.20% | -0.50% | ||
| 07:00 | GBP | Manufacturing Production Y/Y Dec | -6.10% | -5.90% | ||
| 07:00 | GBP | Goods Trade Balance (GBP) Dec | -17.2B | -15.6B | ||
| 09:00 | EUR | Italy Industrial Output M/M Dec | 0.10% | -0.30% | ||
| 12:00 | GBP | NIESR GDP Estimate (3M) Jan | 0.10% | |||
| 13:30 | CAD | Net Change in Employment Jan | 15.0K | 104K | ||
| 13:30 | CAD | Unemployment Rate Jan | 5.00% | 5.00% | ||
| 15:00 | USD | Michigan Consumer Sentiment Index Feb P | 65 | 64.9 |
GBP/USD Daily Outlook
Daily Pivots: (S1) 1.2052; (P) 1.2123; (R1) 1.2189; More...
Despite recovering to 1.2192, GBP/USD failed to sustain above 4 hour 55 EMA and retreated. Intraday bias is turned neutral again. On the upside, break of 1.2192 will affirm the case that corrective pattern from 1.2445 has completed with three waves to 1.1960. Further rise would be seen back to 1.2445/6. Decisive break there will resume larger rise from 1.0351. On the downside, through break of 1.1960 will extend the corrective pattern with another fall to 1.1840 support and possibly below.
In the bigger picture, rise from 1.0351 medium term bottom is at least correcting whole down trend from 1.4248 (2021 high). Further rise is expected as long as 1.1644 resistance turned support holds. Next target is 61.8% retracement of 1.4248 to 1.0351 at 1.2759. Sustained break there will pave the way back to 1.4248.
RBA SoMP: No GDP contraction, trimmed mean inflation to stay higher and longer
In the Statement on Monetary Policy, RBA reiterated that "further increases in interest rates will be needed to ensure that the current period of high inflation is only temporary."
"In assessing how much further interest rates need to increase, the Board will be paying close attention to developments in the global economy, trends in household spending and the outlook for inflation and the labour market."
The economy is not forecast to contract within the projection horizon. Meanwhile, trimmed mean inflation is projected to stay higher and longer till mid 2024.
Year-average GDP growth forecast to be (from 3.75% in 2022):
- 2.25% in 2023 (unchanged from prior forecast).
- 1.50% in 2024 (unchanged).
- 1.75% in 2024/25 year (new).
Headline CPI (7.8% in December 2022) is projected to slow to:
- 6.75% in June 2023 (unchanged).
- 4.75% in December 2023 (unchanged).
- 3.50% in June 2024 (down from 4.25%).
- 3.25% in December 2024 (unchanged).
- 3.00% in June 2025 (new).
Trimmed mean CPI (6.9% in December 22) is projected to slow to:
- 6.25% in June 2023 (up from 5.50%).
- 4.25% in December 2024 (up from 3.75%).
- 3.25% in June 2024 (down from 3.50%).
- 3.00% in December 2024 (down from 3.25%).
- 3.00% in June 2025 (new).
Japan FM Suzuki will discuss joint statement with BoJ with new governor
Japan Finance Minister Shunichi Suzuki said that the goals as mentioned in the joint statement with BoJ signed back in 2013 "remains important policy challenges". He mentioned that targets like "the need to pull Japan out of deflation and achieve stable economic growth."
But he also mentioned the possibility of revising the join statement with new BoJ Governor. "What to do with the statement is something the government must discuss with the new governor," Suzuki told parliament. Nevertheless, it's premature to decide whether it's necessary for the revision as the government has yet to nominate the new BoJ head.
Separately, Tsuyoshi Takagi, the ruling Liberal Democratic Party's parliament affairs chief for the lower house, said that the government will present its nomination for the new BoJ Governor and the two deputies on February 13. Jun Azumi, an executive of the opposition Constitutional Democratic Party of Japan said hearings would be held at the lower house on February 24.
Japan PPI slowed to 9.5% yoy in Jan, CGPI staying at record high
Japan PPI slowed from 10.5% yoy to 9.5% yoy in January, below expectation of 11.2% yoy. Sitting at 119.8 and unchanged from prior month, corporate goods price index matched the record high made in December.
On Yen basis, export price index slowed further to 9.0% yoy, comparing to the peak of 20.1% yoy made in September. Import price index also slowed to 17.8% yoy, comparing to the peak of 49.2% made in July. For the month, export price index declined for the third month, by -1.9% mom. Import price index dropped for the fourth month, by -3.9% mom.
Cliff Notes: Global Fight Against Inflation Not Yet Over
Key insights from the week that was.
In Australia, the RBA was the focus for participants this week. Offshore, with the data calendar light, markets had time to reflect on last week’s nonfarm payrolls surprise and the responses of FOMC members.
The RBA delivered a 25bp rate hike in February, a decision that was widely expected by market participants and in line with Westpac’s view. What was more surprising, however, was the slightly hawkish shift in rhetoric since their last meeting in December. Going against the trend seen in market chatter, which has been focused on the potential for a lower peak in the cash rate or even a near-term pause, the Board instead responded to the 6.9% print for annual trimmed mean inflation in Q4 which was above their forecast of 6.5%. Coupled with the RBA’s central expectation that inflation will not reach the top of the target band until mid-2025, this result led them to take a firmer stance in their forward guidance, stating that “further increases in interest rates will be needed over the months ahead.” A full view of the RBA’s baseline forecasts and assessment of risks will be available in their February Statement on Monetary Policy (due 11:30am AEDT).
As outlined by Senior Economist Matthew Hassan in this week’s video update, these developments are consistent with Westpac’s view that the cash rate will be raised by 25bps in March and May to a peak of 3.85%. Inflation threats should then recede over the course of 2023 allowing a series of interest rate cuts to occur through 2024. This period of contractionary policy will come at a cost though, a material slowdown in economic growth, centred on the Australian consumer.
Indeed, some evidence of this weakening has begun to emerge in the retail sector, as evinced by the 0.2% decline in retail sales volumes in Q4. With annual growth now down to 1.8% from 5.5% in June, it is clear that key retail segments are feeling the effects of tighter policy and lost purchasing power owing to elevated inflation. It should be noted that broader measures of consumer spending such as the Westpac Card Tracker suggest non-retail spending has been offsetting much of the weakness in retail, meaning total consumer spending likely remained resilient into year-end.
The trade surplus meanwhile finished the year with a sizeable surplus, having printed $12.2bn in December. For Q4, the surplus widened from $29.3bn to $38.3bn, representing a substantial $9bn improvement in the trade position due to higher commodity prices and a lower import bill. Constructive for the outlook, easing restrictions in China and their mandate for outbound students to return to in-person learning are both set to support Australia’s services exports and the broader trade position this year.
This week’s big story offshore actually came to the market last Friday: January’s stellar nonfarm payrolls gain of 517k, with +71k in back revisions to the prior two months. Questions have been raised over the impact of strikes and seasonal adjustment. Still, at 356k, the average of the past three months is 3.5 times the monthly pace the FOMC believe balances demand and supply.
Intriguingly, despite strong job creation and limited supply, wage growth abruptly decelerated through the second half of 2022 into 2023, with average hourly earnings gaining around 0.3% per month over the period – a sub-4% annualised pace compared to the 5.9% peak for annual growth at March 2022. While this measure has likely been biased down by the creation of low-to-mid income jobs, the composition adjusted Employment Cost Index reported a similarly sized deceleration Q2 to Q4 2022, the annualised pace of private sector wage growth slowing from 6% to 4%.
Despite the market’s shock over the payrolls print, the policy consequences seem benign. A slew of FOMC members spoke this week and, while watchful for upside risks for inflation, their consensus expectation from December for a peak fed funds rate of 5.125% (just 50bps higher than the current level) was affirmed. Chair Powell in particular took a balanced approach to the risks, highlighting that financial conditions had tightened following the payrolls release and that the deceleration in wages growth was constructive for services inflation which, to date, has only crested while annual goods inflation more than halved.
We remain of the view that the prudent path for the FOMC would be to deliver one more 25bp hike then pause through the remainder of 2023, allowing time to assess the cumulative effect of policy on inflation and activity. An additional 25bp hike to 5.125% is certainly justifiable on risk management grounds, though the market clearly believes this would prove too much for the economy and be reversed quickly, with the move to 5.125% priced in by June but out by December. The risk we need to remain watchful over is an acceleration in demand-driven inflation. Arguably this would require wage growth to kick higher, improving household’s discretionary spending power and confidence.
The data out this week was of little significance. US consumer credit data came in materially below expectations, highlighting the effectiveness of contractionary monetary policy. But initial claims remained benign, indicating that the majority of households have robust job security. The US service PMIs (out last Friday) conflict with one another, the ISM expansionary at 55.2 but S&P Global’s measure contractionary at 46.8. An average of the two points to modest growth in the economy at the start of 2022; but the divergence between the two surveys suggests this growth is unequally distributed, with small-to-mid sized firms under pressure.
USD/JPY Nears Key Support As Dollar Trims Gains
Key Highlights
- USD/JPY started a downside correction below 132.50.
- A major bullish trend line is forming with support near 129.10 on the 4-hours chart.
- EUR/USD and GBP/USD started an upside correction.
- Gold price might recover if it clears the $1,900 resistance zone.
USD/JPY Technical Analysis
The US Dollar failed again to clear the 133.00 resistance against the Japanese Yen. USD/JPY started a fresh decline below the 132.50 and 132.20 support levels.
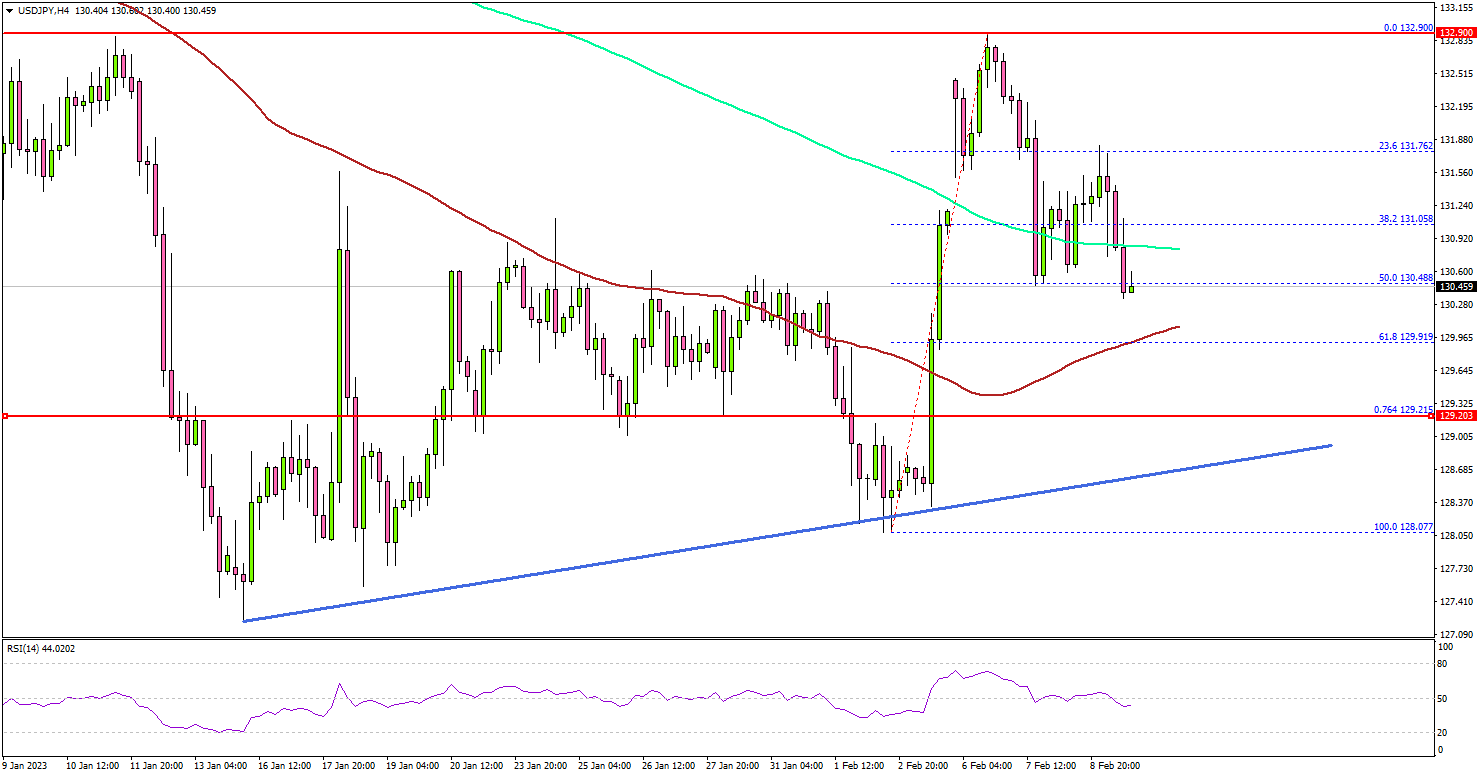
Looking at the 4-hours chart, the pair declined below the 131.50 support zone and the 200 simple moving average (green, 4-hours). There was also a spike below the 50% Fib retracement level of the upward move from the 128.07 swing low to 132.90 high.
An immediate support is near the 130.00 zone or the 100 simple moving average (red, 4-hours). It is near the 61.8% Fib retracement level of the upward move from the 128.07 swing low to 132.90 high.
The next major support is near the 129.20 level. There is also a major bullish trend line forming with support near 129.10 on the same chart. If there is a downside break, the pair could decline towards the 128.50 level.
On the upside, the pair is facing resistance near the 131.20 level. The next major resistance is near the 131.50 level. A clear move above the 131.50 resistance might start a steady increase towards the 132.00 resistance zone.
Any more gains could open the doors for a move towards the 132.50 level. The next key hurdle is near 133.00, above which the pair could climb towards the 134.20 resistance zone.
Looking at gold price, the bulls may perhaps attempt a recovery wave above the key $1,900 resistance zone in the near term.
Economic Releases
- UK GDP for Dec 2022 (MoM) - Forecast -0.3%, versus +0.1% previous.
- Canada’s employment Change for Jan 2023 – Forecast 15K, versus 104K previous.
- Canada’s Unemployment Rate April 2023 - Forecast 5.1%, versus 5% previous.