Sample Category Title
USDCAD’s Upside Could be Tested
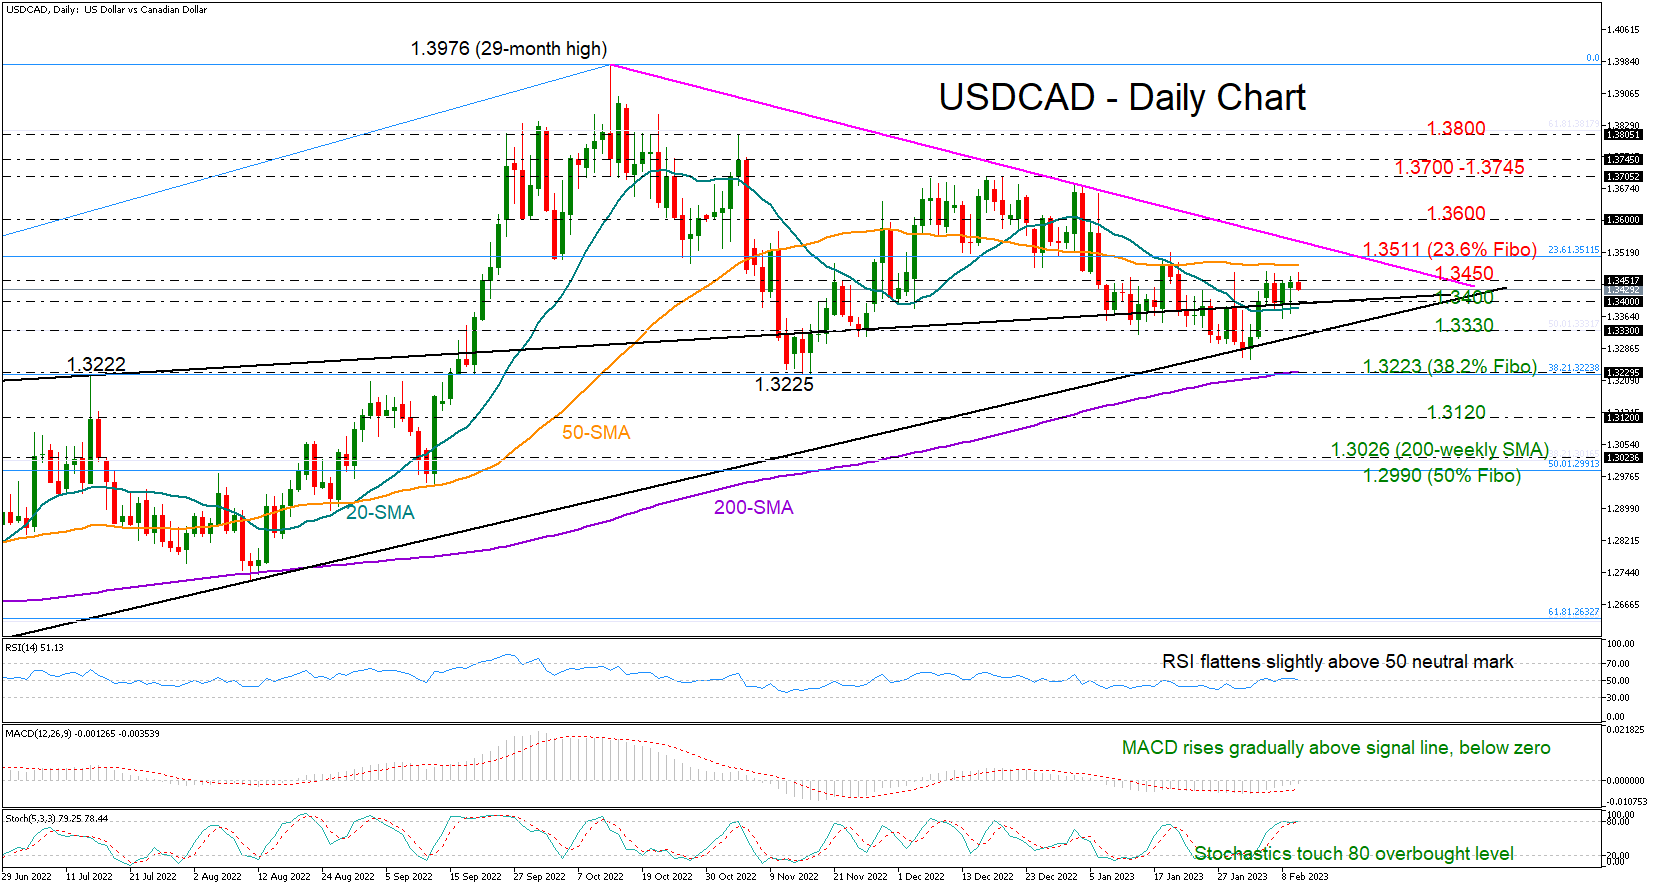
USDCAD has been on the sidelines this week, constrained between the familiar 1.3450 resistance and key upward-sloping line from August 2021 at 1.3400.
The technical picture is leaning softly to the bullish side as the RSI is flattening slightly above its 50 neutral mark. Meanwhile, the MACD is gradually recovering above its red signal line but within the negative zone, while the Stochastic oscillator has already reached its 80 overbought level, reflecting fading upside pressures ahead of the Canadian employment report.
Nevertheless, sentiment will remain jittery if the pair continues to face limitations around the 23.6% Fibonacci retracement of the 1.2006-1.3976 upleg at 1.3511. The tentative resistance trendline from October’s top of 1.3976 is cementing that ceiling. Hence, a clear close above that wall would attract buyers' attention, likely lifting the price straight to the 1.3600 number. Then, another victory here may prompt an extension towards the 1.3700-1.3745 boundary.
In the event of a downside reversal, the bears will fight for a break below the 1.3400 floor and the 20-day simple moving average (SMA) with scope to reach the support trendline from June’s low at 1.3330. Slightly lower, the 200-day SMA could immediately calm selling tendencies near the 38.2% Fibonacci of 1.3223. If it fails, the decline may pick up steam towards the 1.3130 handle.
Summing up, USDCAD is maintaining a neutral short- and medium-term outlook. A decisive close above 1.3511 or below 1.3330 could navigate the market accordingly.
GBPJPY is in Neutral Bias with 161.80 Being Strong Obstacle
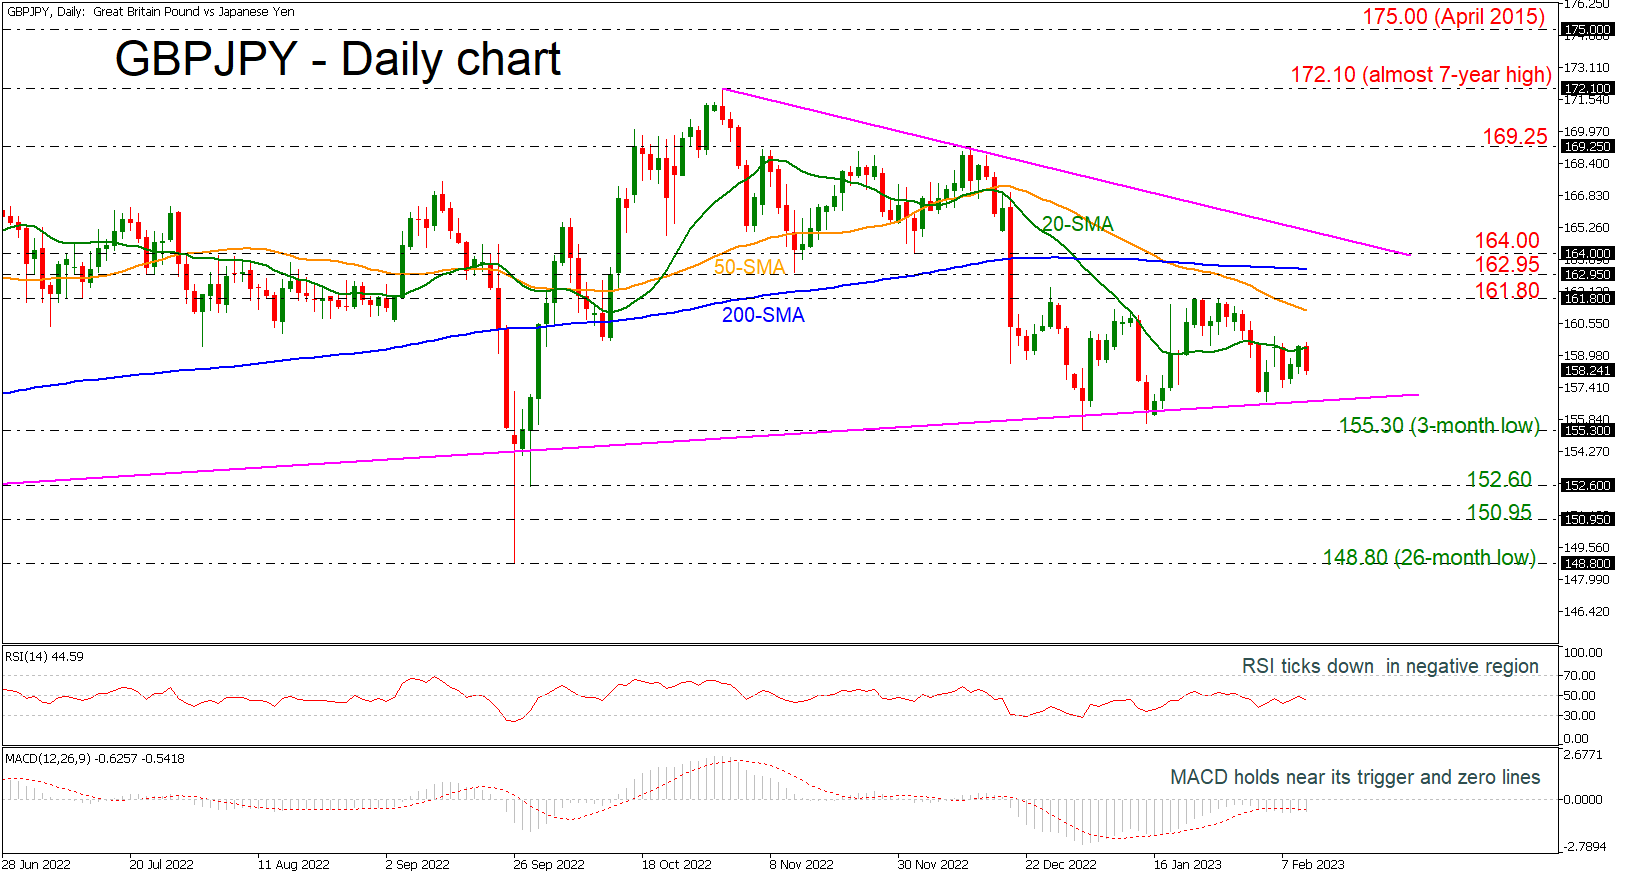
GBPJPY is standing above the long-term uptrend line, but the short-term view seems to be neutral, finding strong resistance at 161.80. The RSI indicator is pointing slightly down in the bearish region, while the MACD is moving sideways below its trigger and zero lines. In trend indicators, the 20- and the 200-day simple moving averages (SMAs) are flattening, mirroring the price action.
Should the pair manage to strengthen its momentum, the next resistance could come around the 50-day SMA at 161.20 and the 161.80 barrier. A break above this could challenge the 200-day SMA near 163.00, while even higher it would shift the bias to a more bullish one and open the way towards the 164.00 mark and the short-term downtrend line at 165.00.
However, if prices are unable to break above 161.80 in the next few sessions, the risk would shift back to the downside with the long-term uptrend line at 156.50 once again coming into focus as well as the three-month low of 155.30. A drop lower would take the market down to the 152.60 support and the 150.95 barrier.
Summarizing, GBPJPY is failing to endorse the broader bullish outlook, remaining below the SMAs and the 161.80 key level.
EUR/USD: Cycle Correction Nears Completion Level
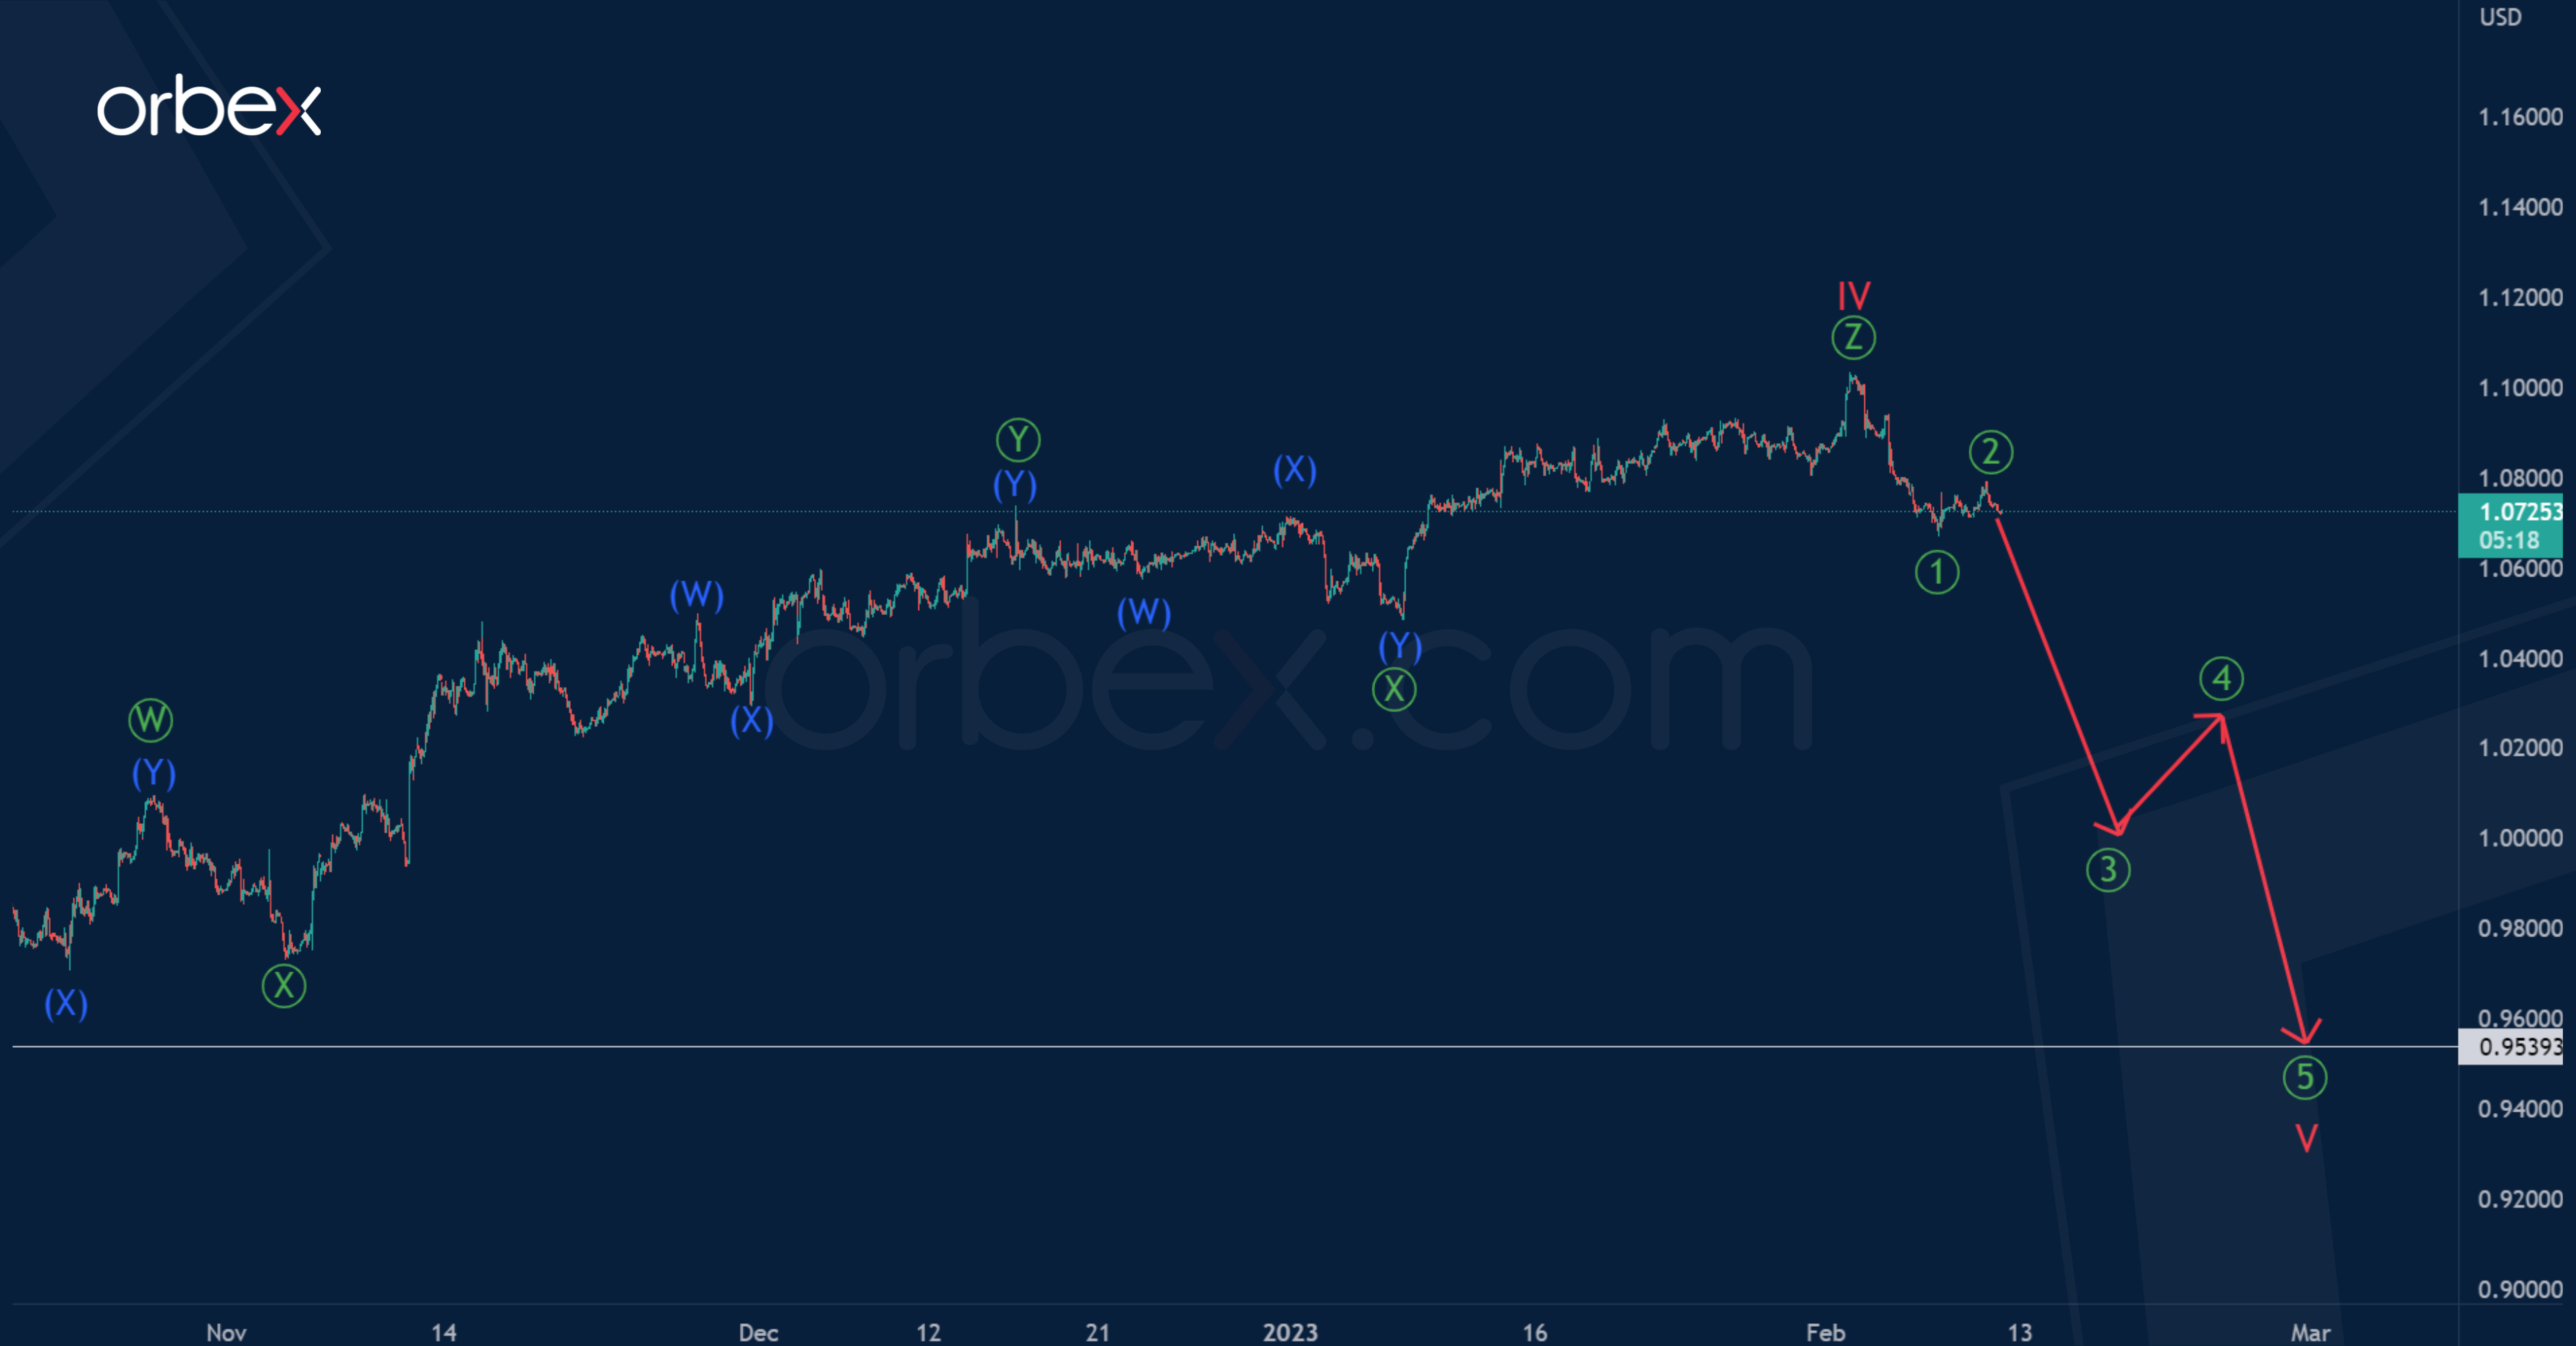
We talked about the EURUSD pair a few reviews ago. The construction of a bearish cycle impulse, consisting of five main sub-waves I-II-III-IV-V, continues.
Most likely, correction IV is under development. This complex correction looks like a triple zigzag consisting of primary sub-waves.
The primary sub-waves look complete. The development of the last sub-wave is expected in the near future. It can form a zigzag (A)-(B)-(C). Impulse (C) is needed to complete this zigzag. Its end is possible at 1.122.
At that level, correction IV will be at 61.8% of impulse III.
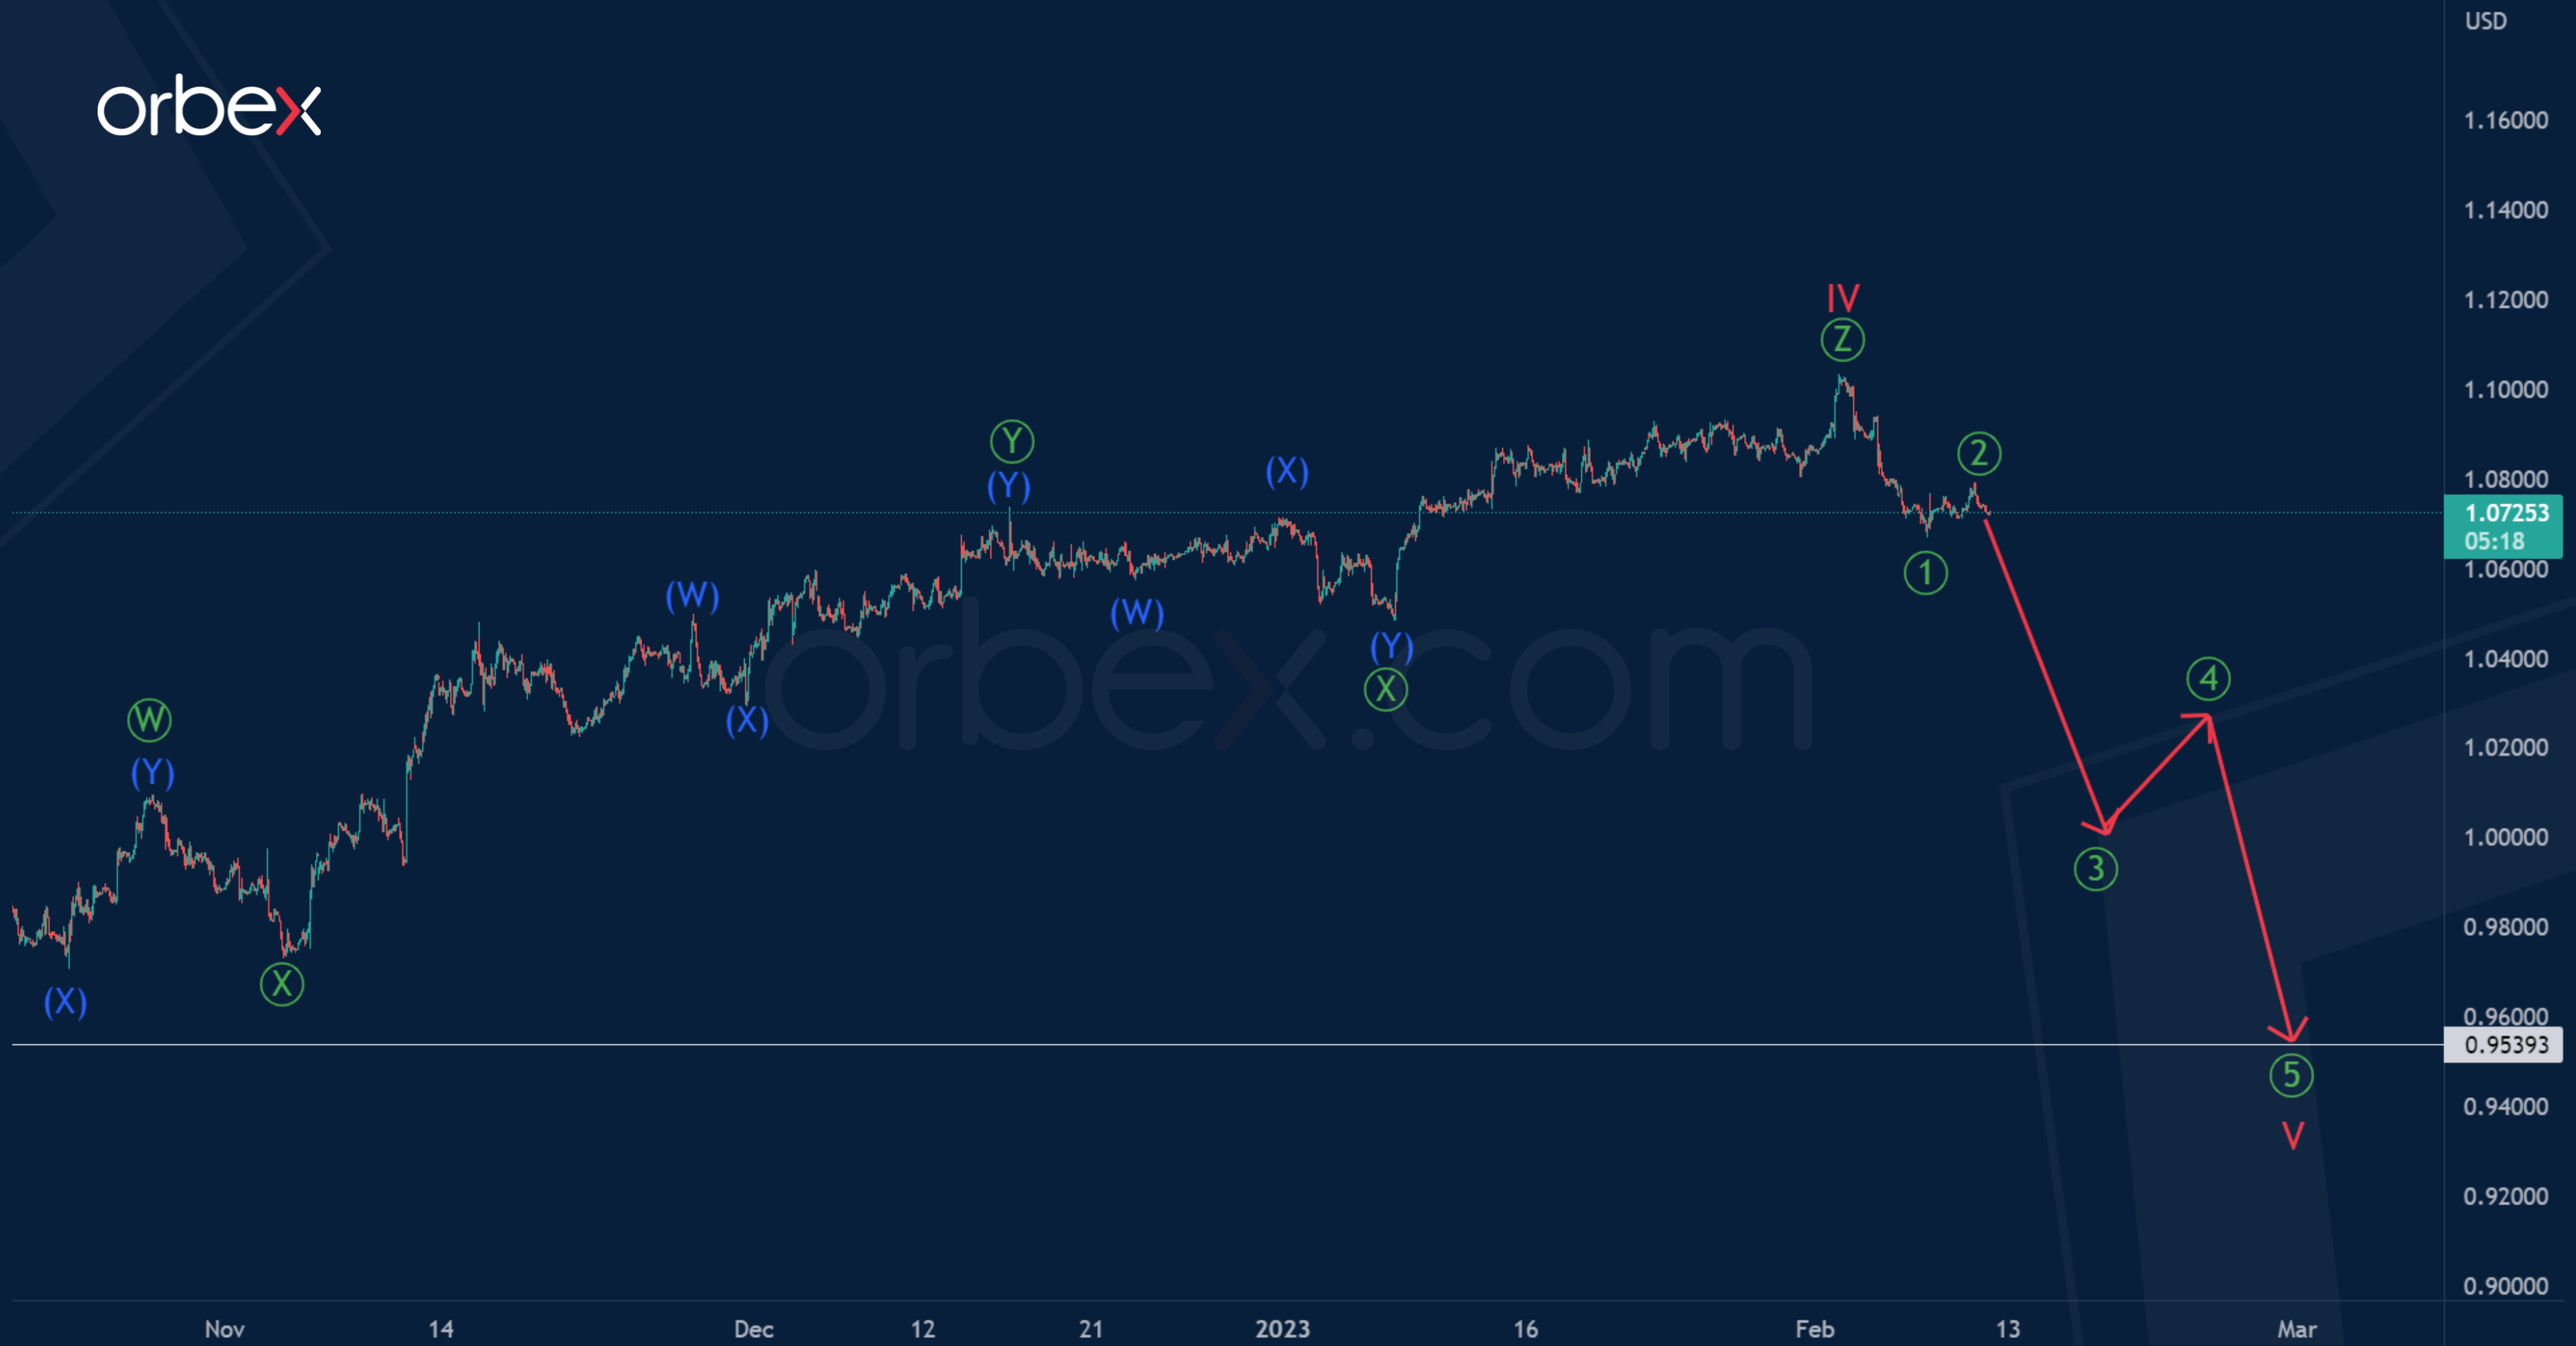
Let's look at the second option. According to this view, cycle correction IV has been completed. It is a triple zigzag.
Now we can notice the development of the initial part of the cycle wave V, which may take the form of a primary impulse, its possible structure is shown by trend lines.
It is assumed that the bears can re-go to the minimum of 0.953, at which a large impulse wave III was completed.
S&P 500 Breaks Under Trend Line
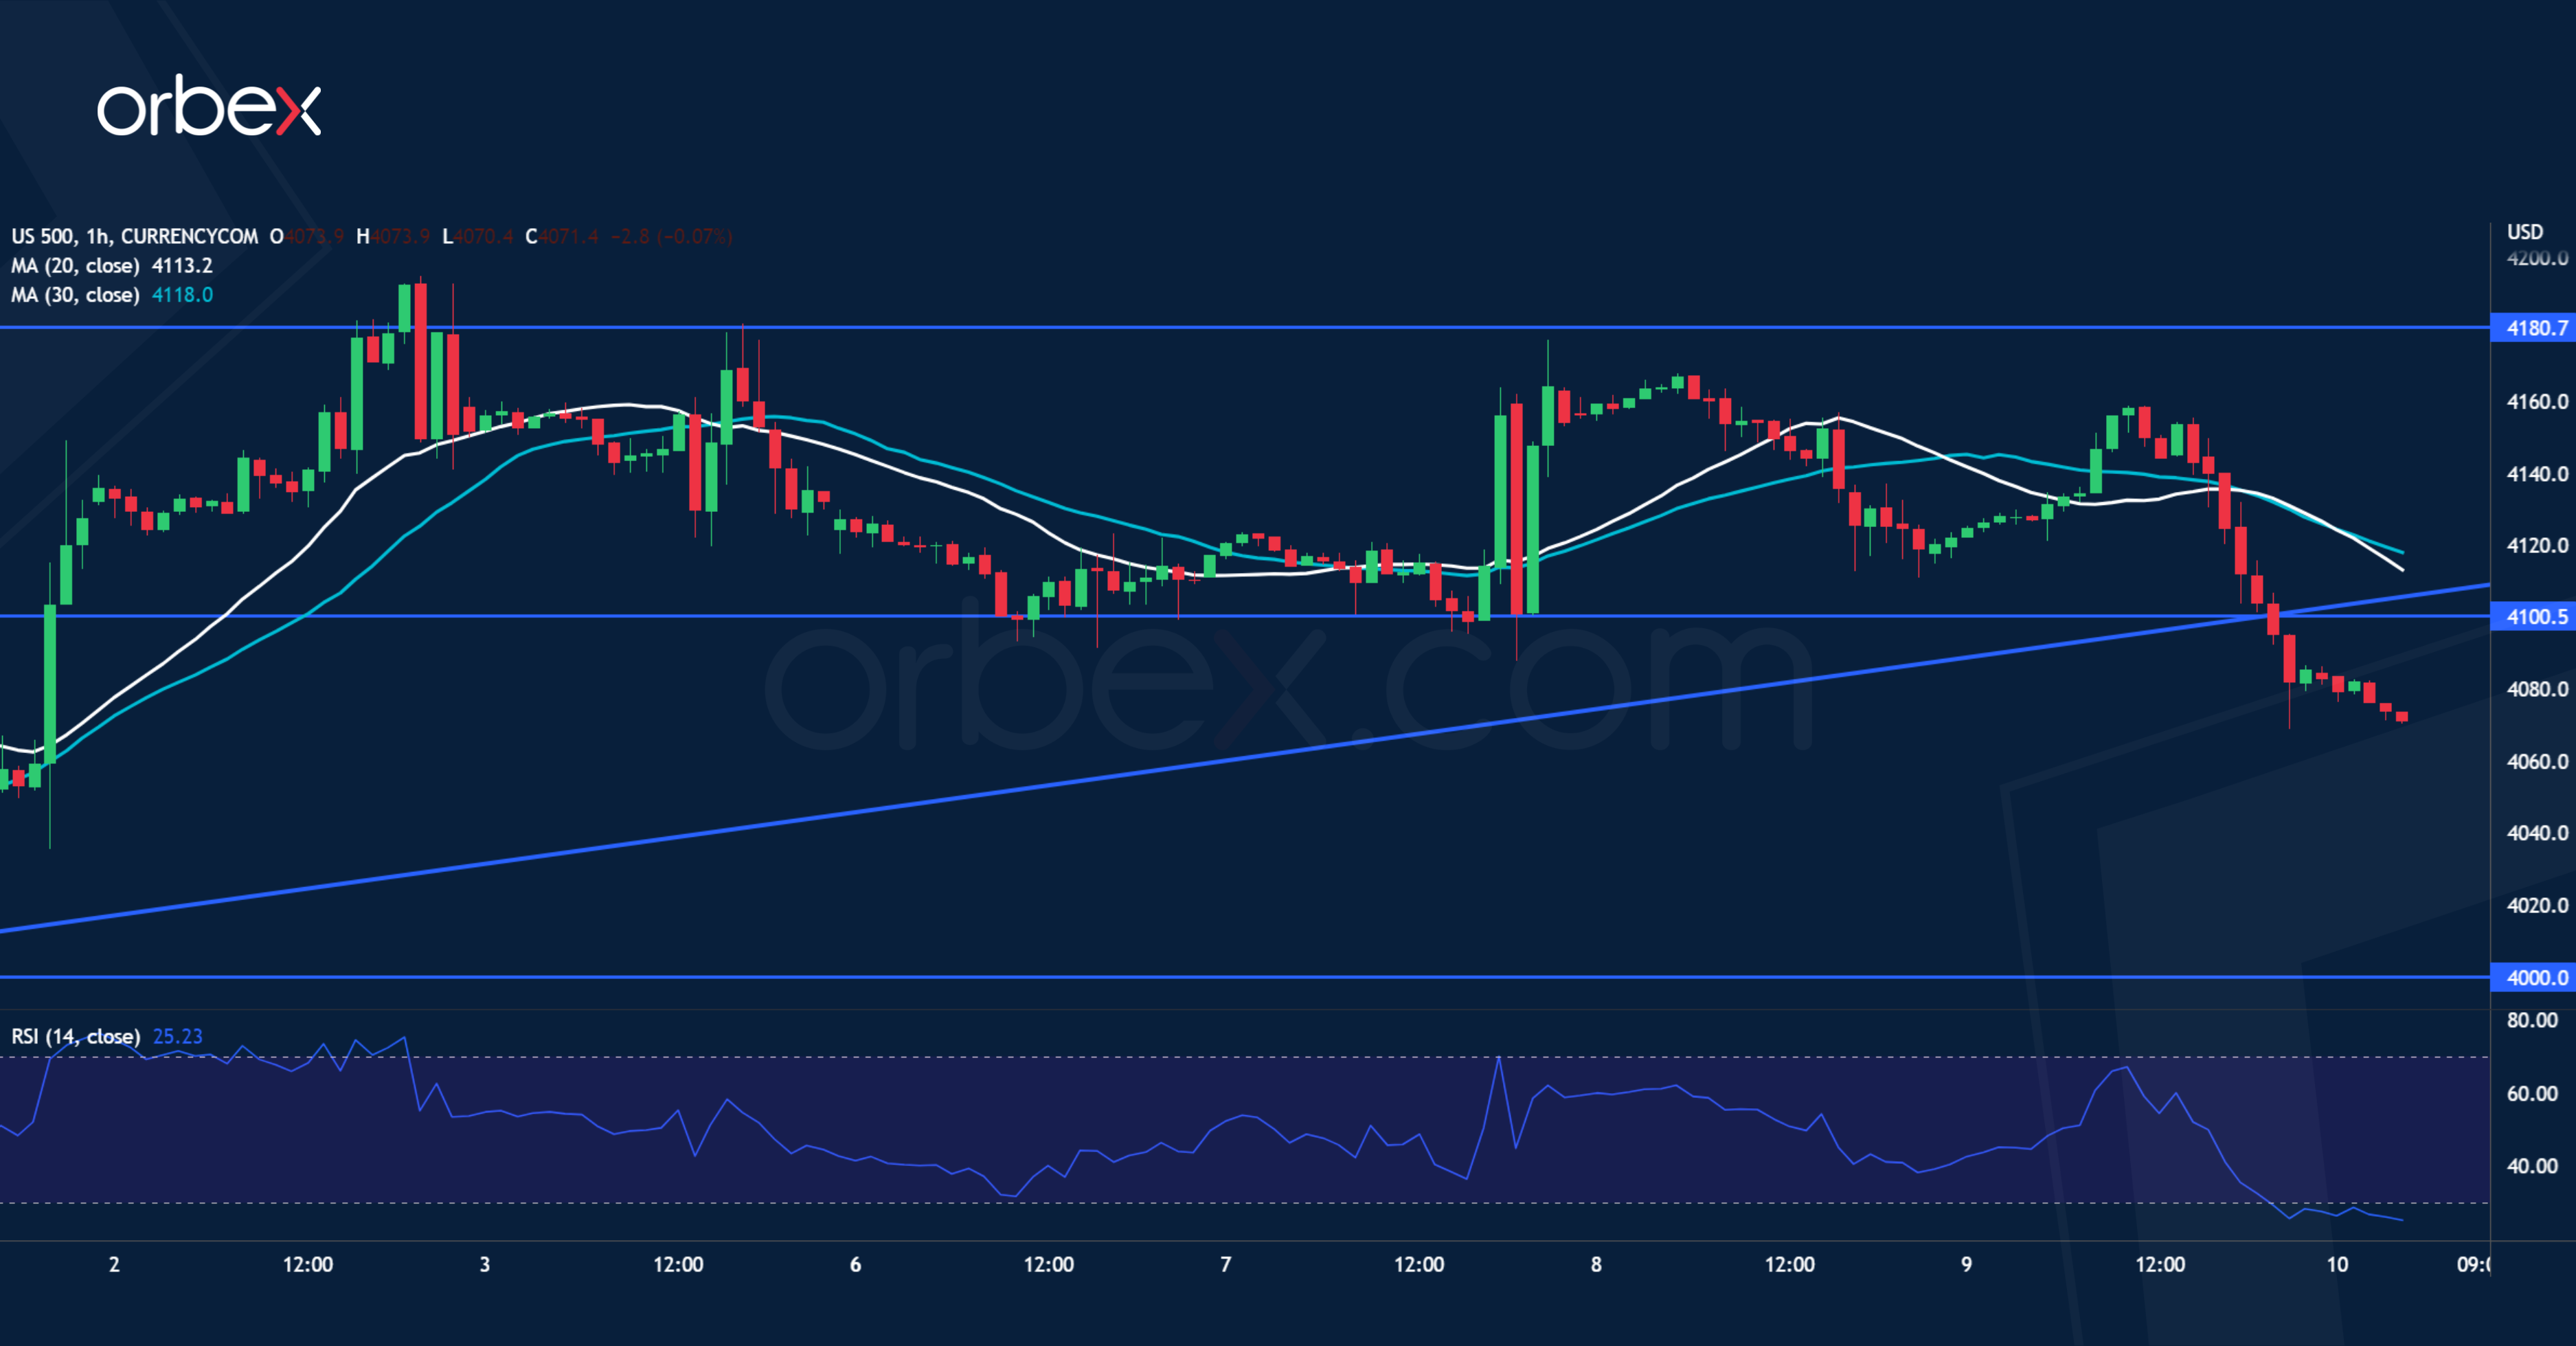
The S&P 500 pared earlier gains after US Treasury yields climbed. On the daily chart, the rally has gained traction after a break above the double top (4130) formed by the September and December highs. But the mood has turned south in the short-term after a fall under the rising trend line from January’s breakout rally. This dynamic support was confluent with the previous swing low of 4100 and the breach has invalidated this demand area, making it a fresh resistance. The psychological level of 4000 is a key support.
NZD/USD Struggles to Bounce
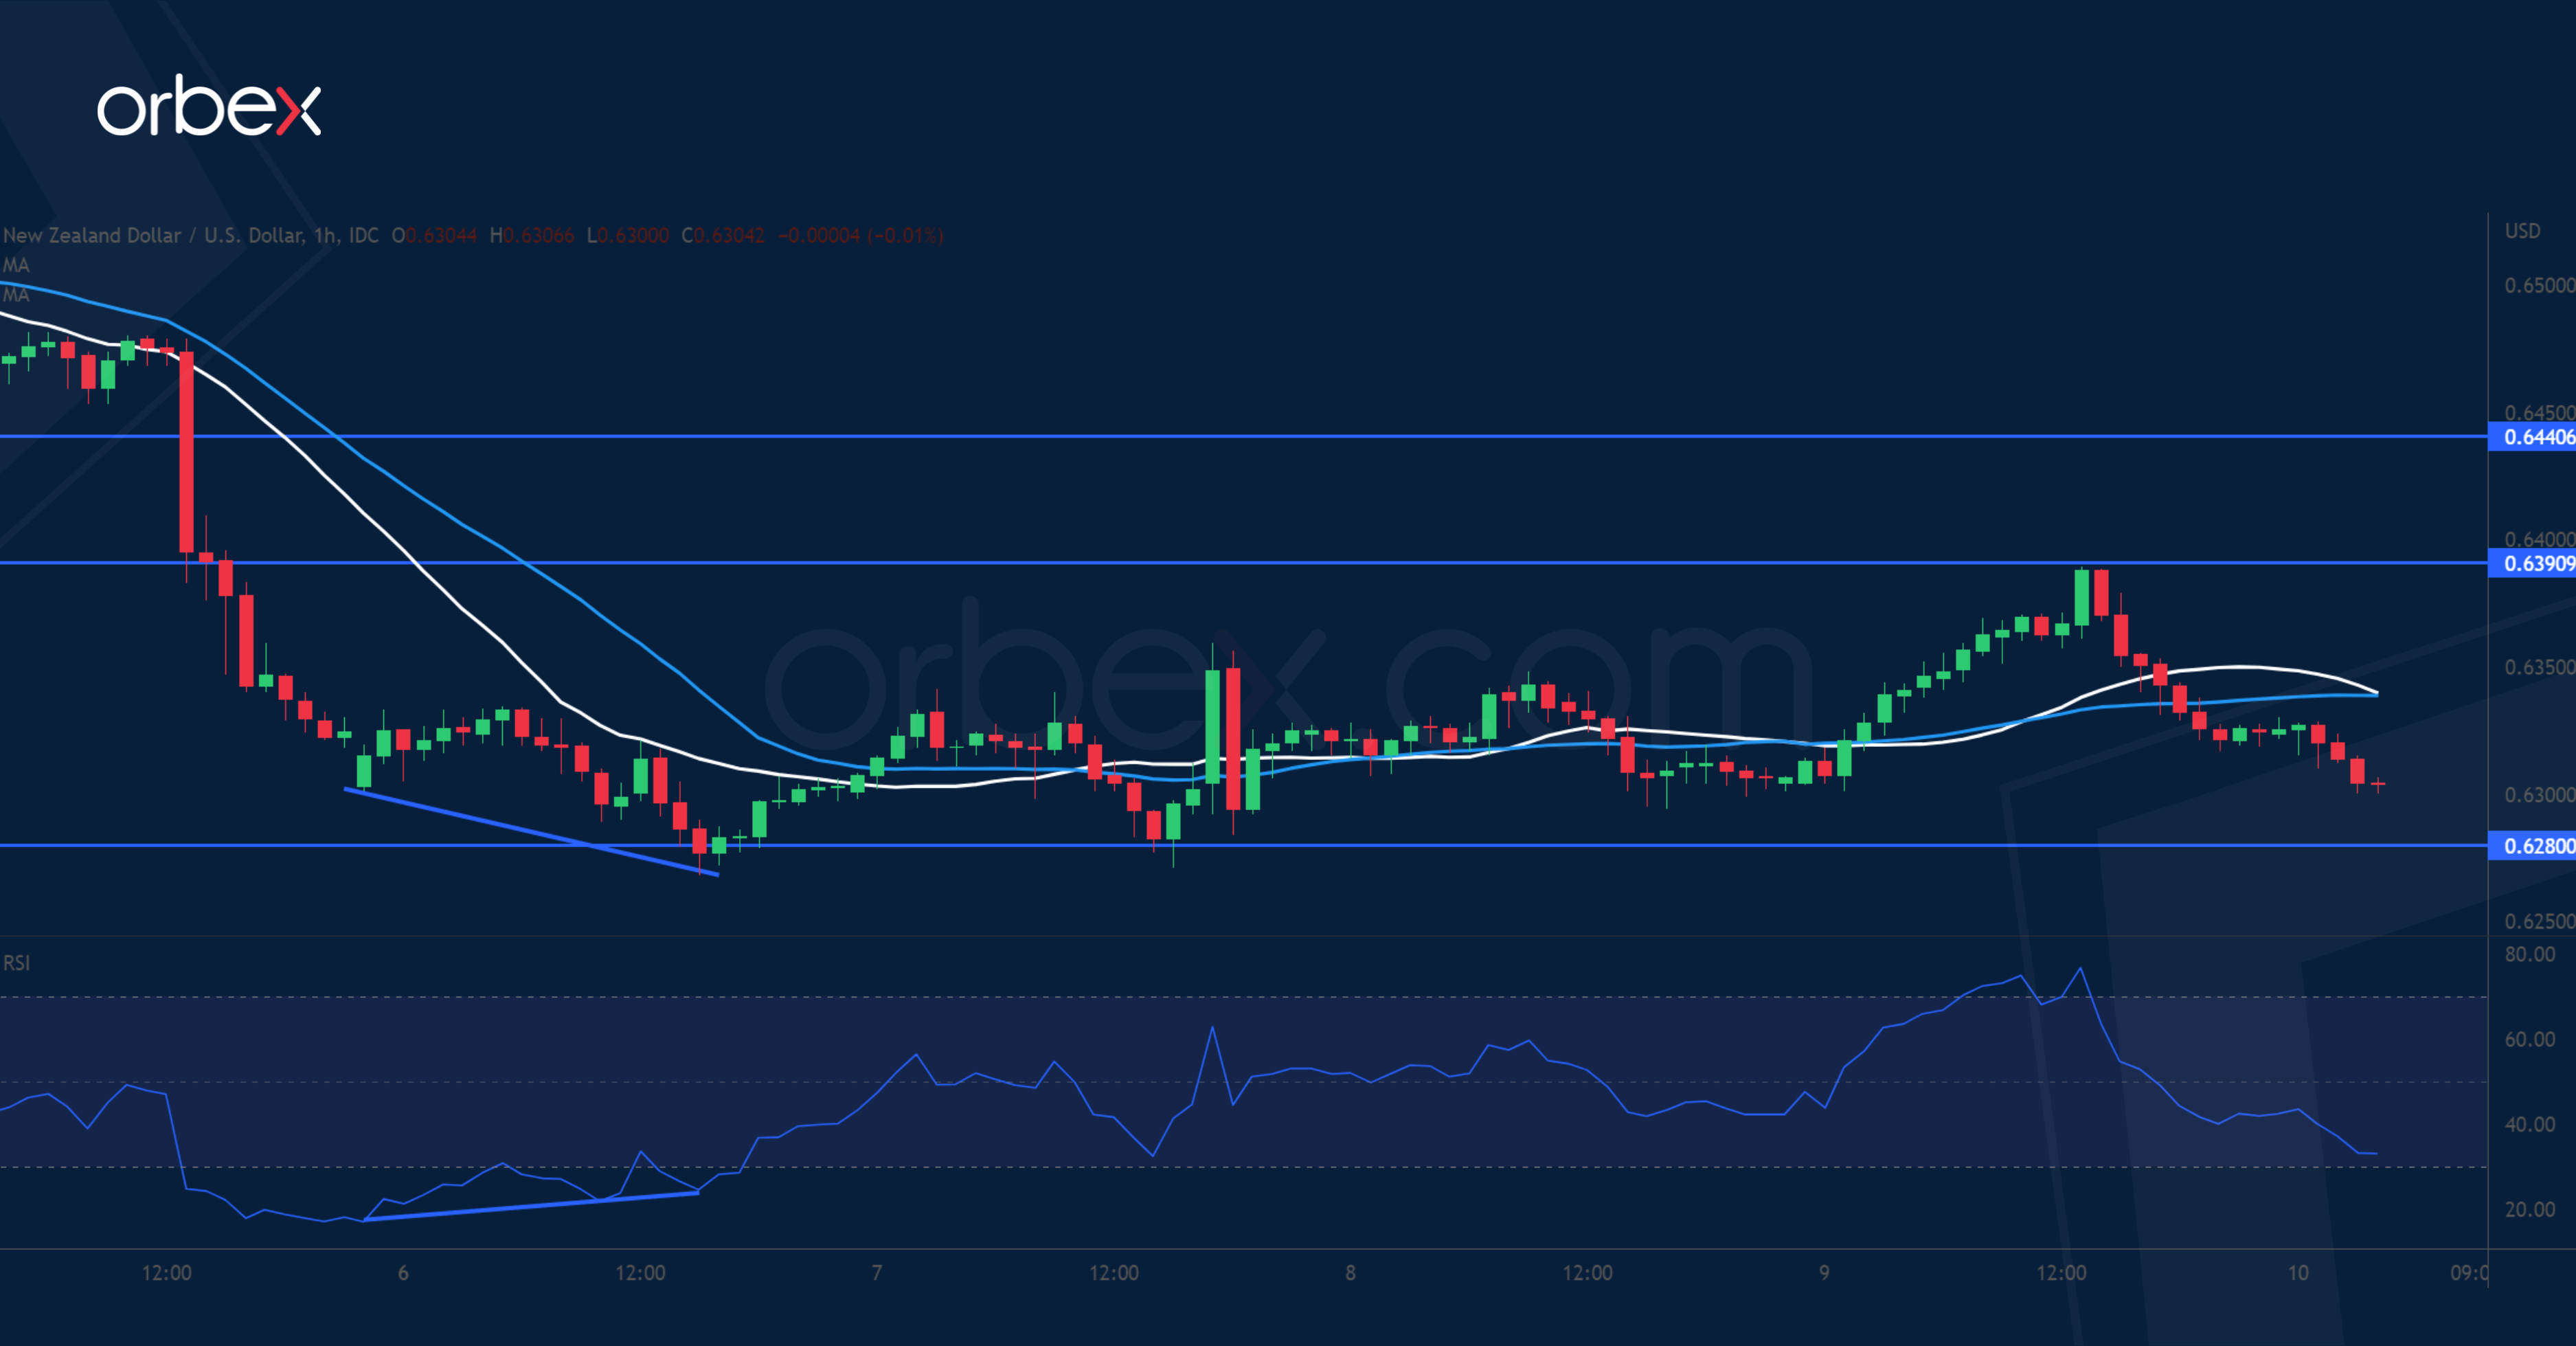
The New Zealand dollar falls back over subdued risk appetite. The pair is looking to hold on to its gains after breaking above the December high of 0.6500. Last month’s swing low around 0.6200-0.6280 is a major demand zone to keep the bullish bias valid. A bullish RSI divergence on the hourly chart is an encouraging sign after the downward momentum faded, but strong offers emerged near the support-turned-resistance at 0.6390 as trapped buyers sought to get out. 0.6280 is the first layer of defence on the downside.
GBP/USD Stages Recovery
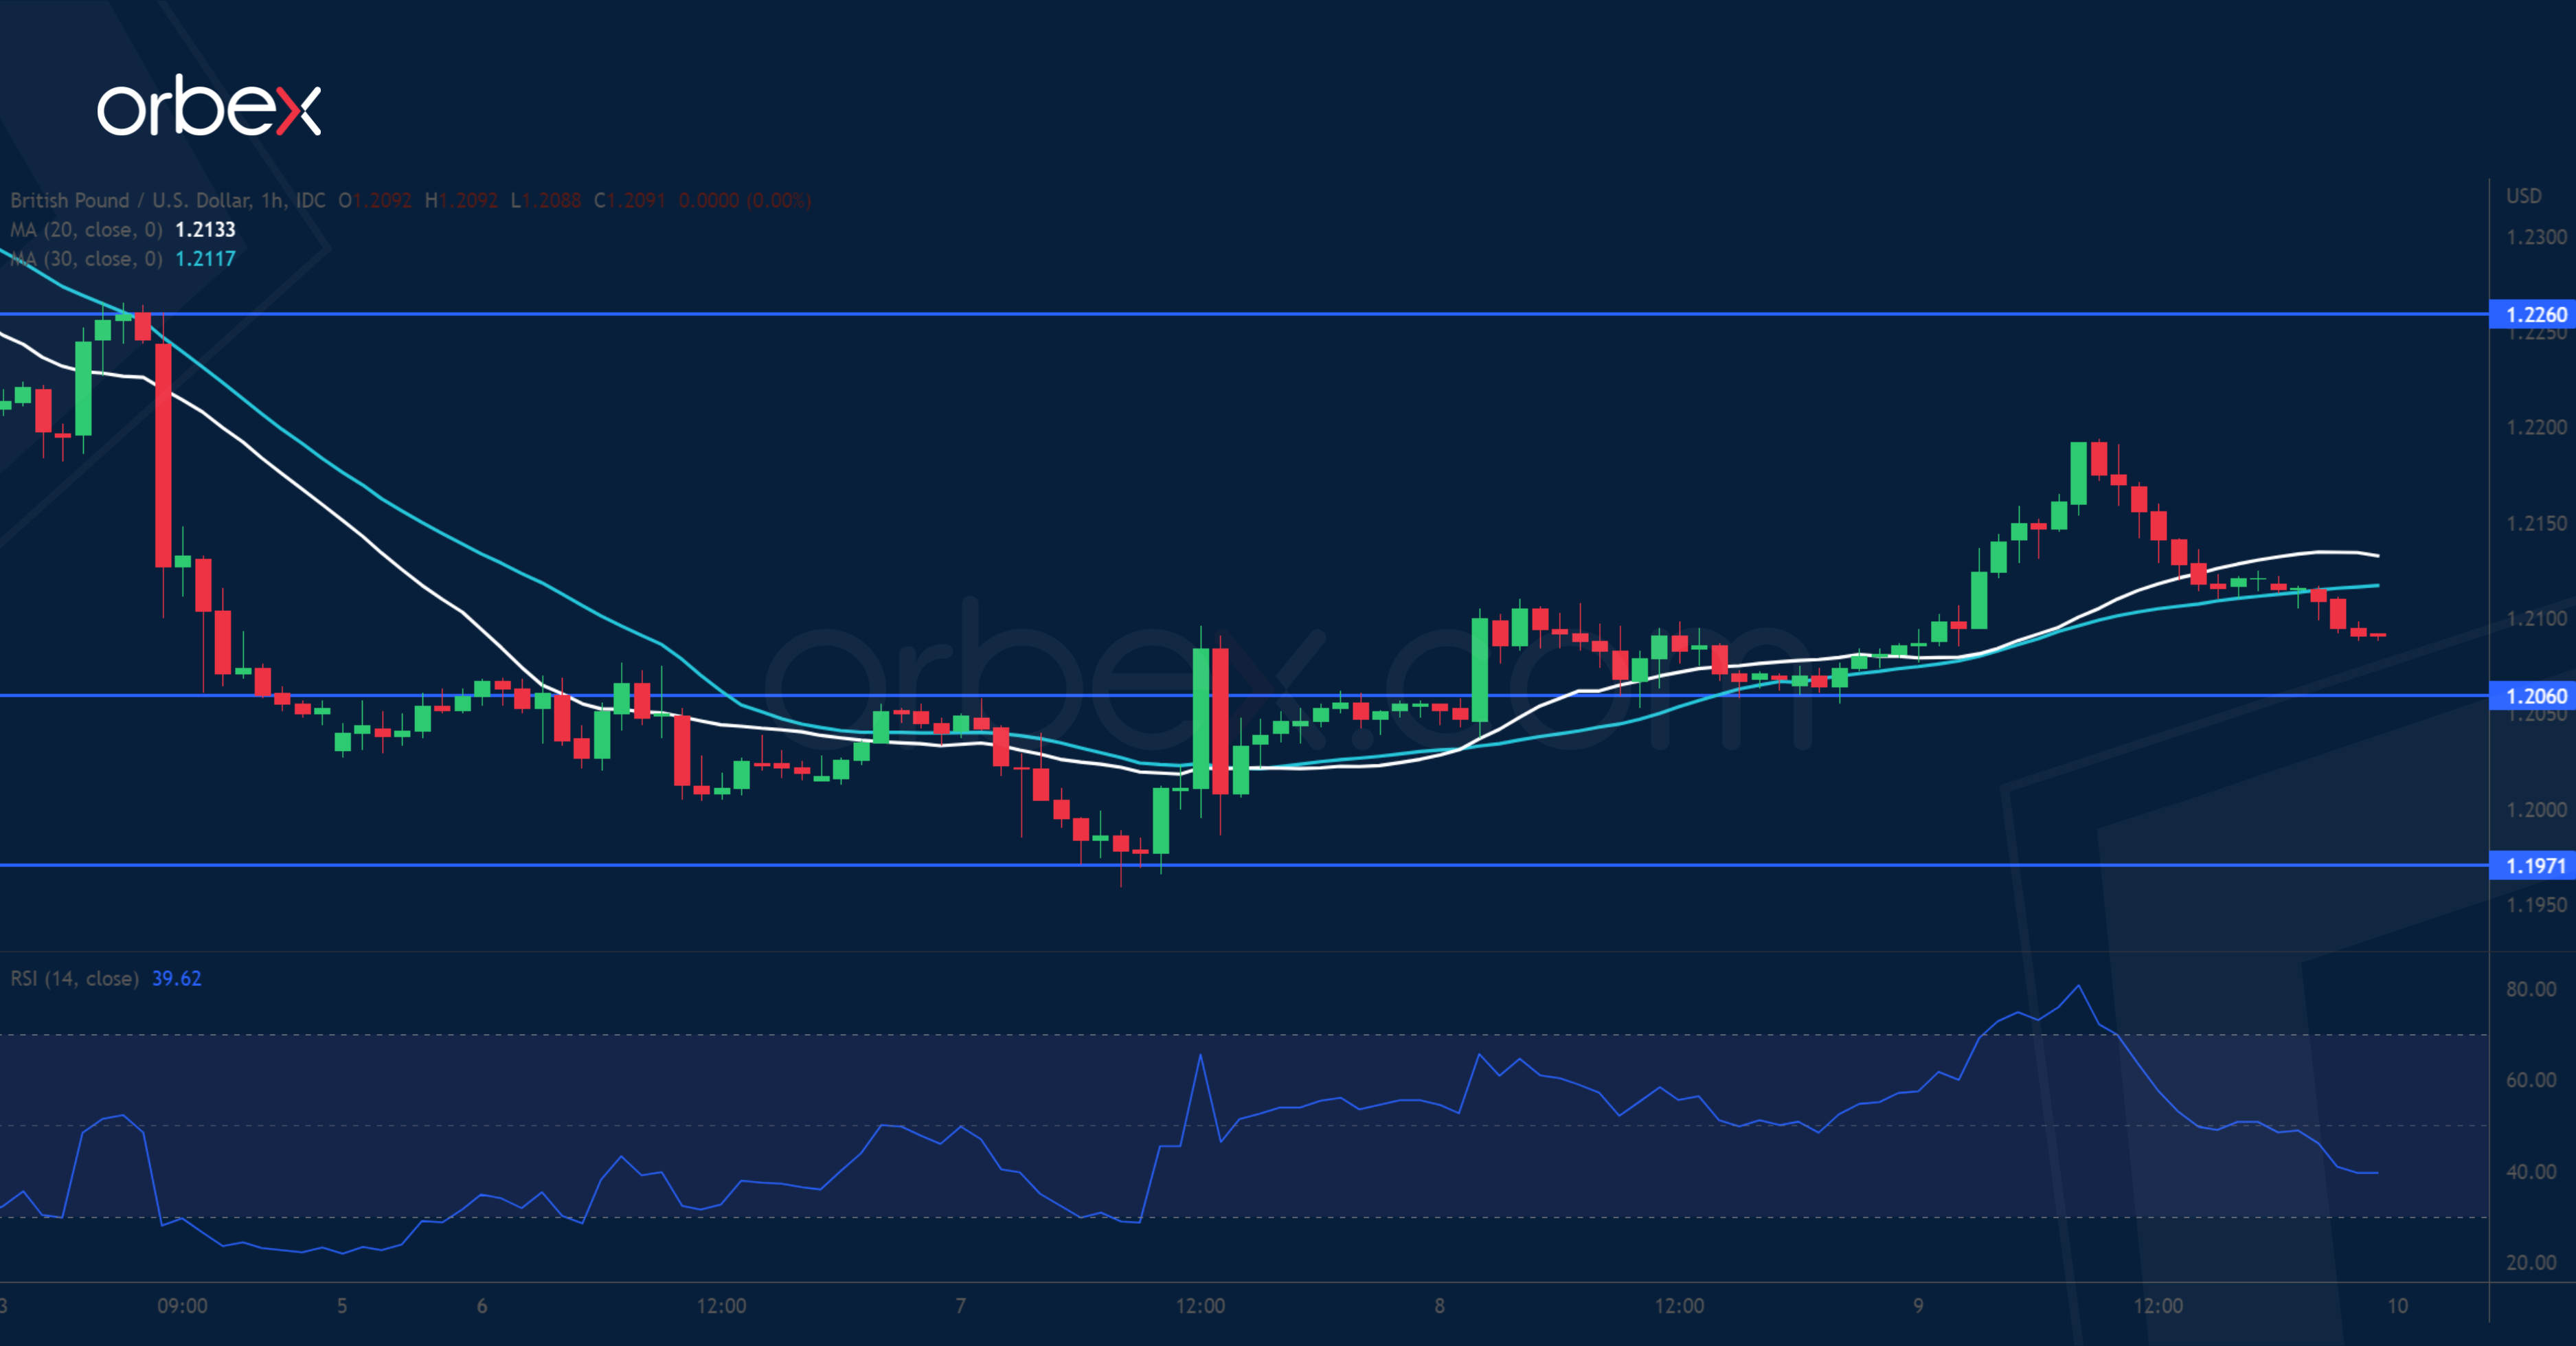
The pound retreats as traders reposition ahead of a series of UK data. After coming off December’s high of 1.2440, the pair is staging a bounce from the demand zone around the psychological level of 1.2000. The recovery theme remains intact from a medium-term perspective. Though the short-term price action could be choppy as the cable strives to gain a secure footing above 1.2060. 1.2260 at the tip of a previously faded rebound is a key hurdle, and its breach would bring the pair back to its recent peak near 1.2400.
EUR/AUD Daily Outlook
Daily Pivots: (S1) 1.5417; (P) 1.5454; (R1) 1.5519; More...
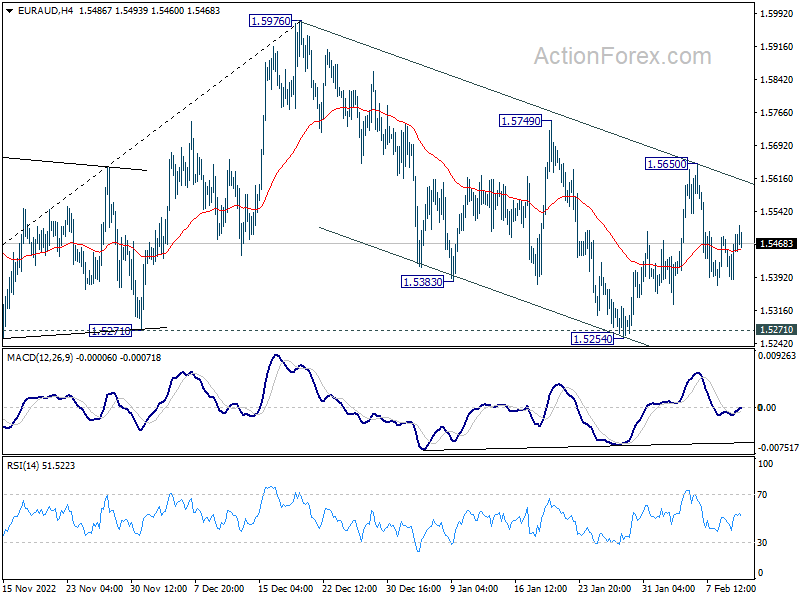
No change in EUR/AUD's outlook as deeper fall could be seen to retest 1.5254/71 support zone. Firm break there will carry larger bearish implication and resume the fall from 1.5976. On the upside, above 1.5650 will resume the rebound to 1.5749 resistance.
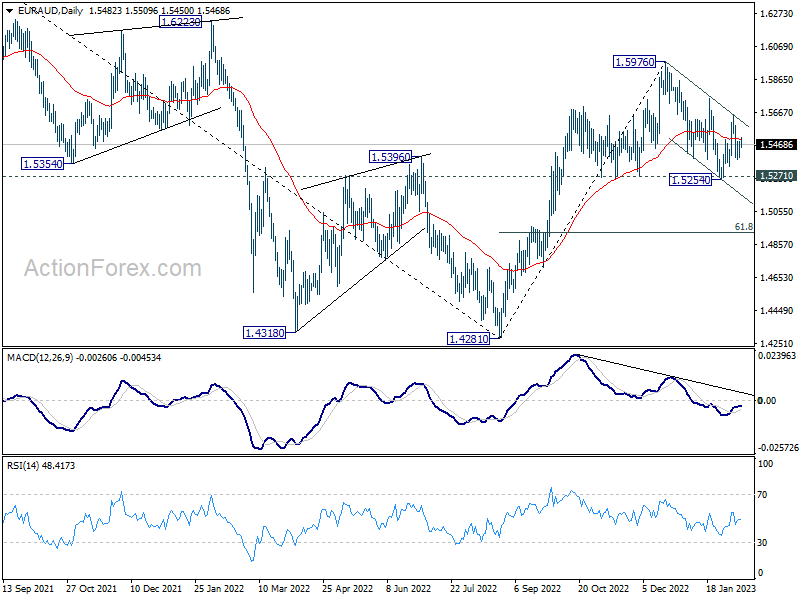
In the bigger picture, it's still early to confirm if rise from 1.4281 represents bullish trend reversal. But as long as 1.5271 support holds, such rally is in favor to continue. Break of 1.5976 will target 1.6434 key resistance next. On the other hand, firm break of 1.5271 will retain medium term bearishness instead.
EUR/GBP Daily Outlook
Daily Pivots: (S1) 0.8839; (P) 0.8862; (R1) 0.8884; More...
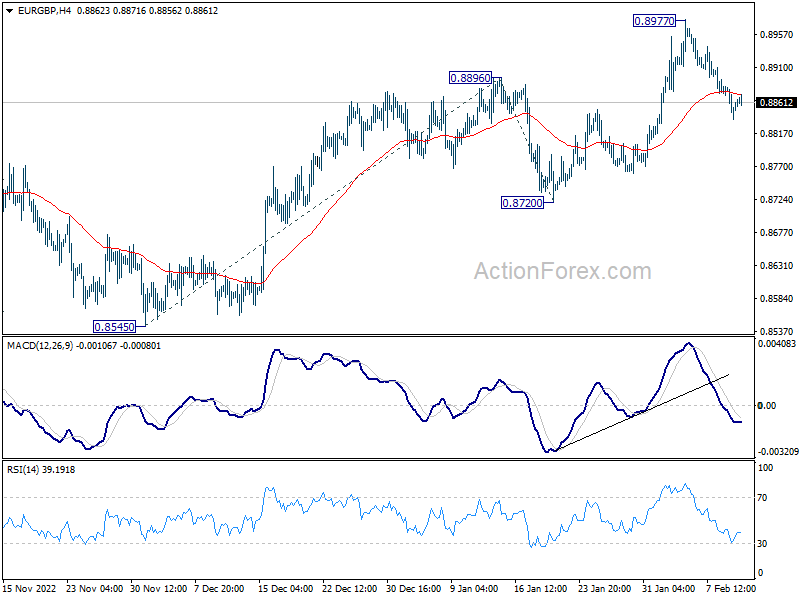
Intraday bias in EUR/GBP remains neutral for the moment. Further rise is expected as long as 0.8720 support holds. On the upside, break of 0.8977 will resume whole rise from 0.8545 to 100% projection of 61.8% projection of 0.8545 to 0.8896 from 0.8720 at 0.9071.
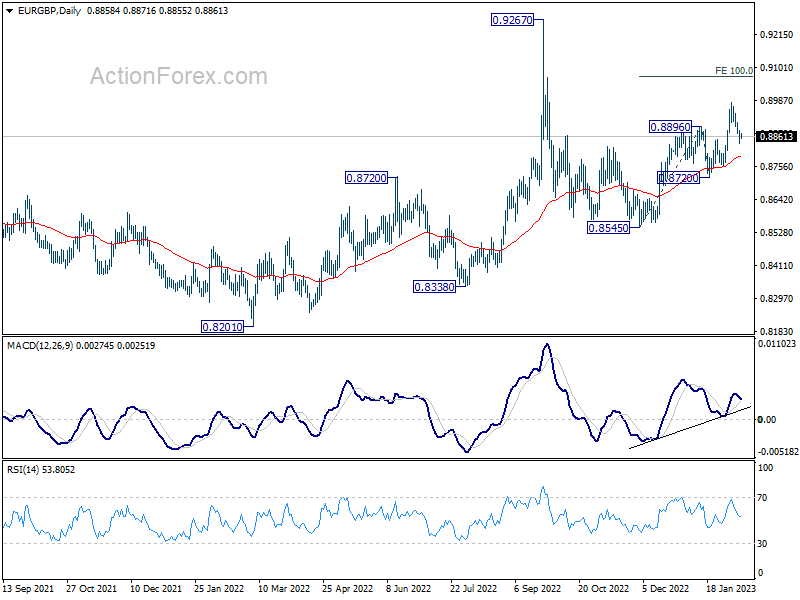
In the bigger picture, the notable support from 55 day EMA (now at 0.8780) retains near term bullishness. Break of 0.8896 should target 0.9267 (2022 high) and possibly above, to resume whole up trend from 0.8201 (2022 low). However, break of 0.8270 support and sustained trading below 55 day EMA will set the stage for 0.8545 and below.
EUR/JPY Daily Outlook
Daily Pivots: (S1) 140.79; (P) 141.06; (R1) 141.51; More....
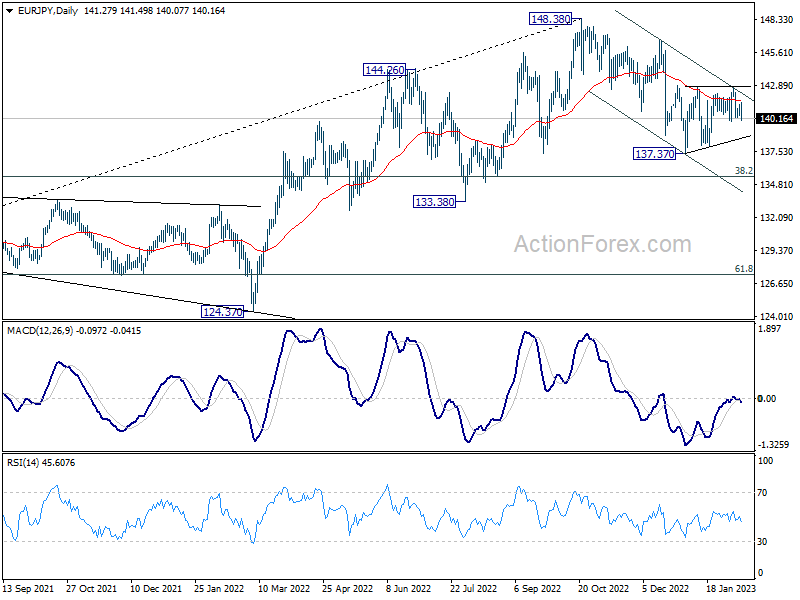
Intraday bias in EUR/JPY remains neutral as range trading continues. On the upside, decisive break of 142.84 will argue that the correction from 148.38 has completed at 137.37 already. Further rise would be seen to 146.71 resistance next. On the downside, firm break of 155.33 will resume the whole decline from 148.38 to 135.40 fibonacci level.
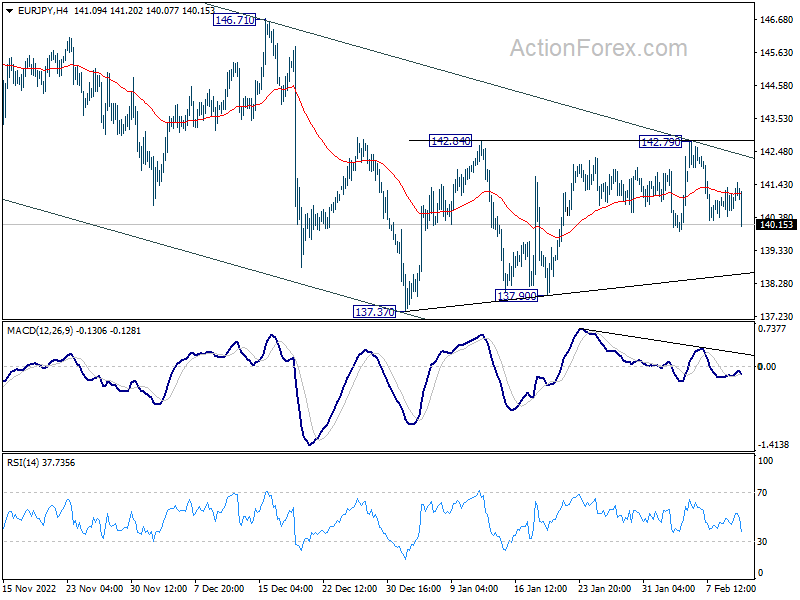
In the bigger picture, as long as 55 week EMA (now at 138.82) holds, larger up trend from 114.42 (2020 low) is still in progress for 149.76 long term resistance. However, firm break of 55 week EMA will bring deeper fall to 38.2% retracement of 114.42 to 148.38 at 135.40. Sustained break there will raise the chance of trend reversal, and target 61.8% retracement at 127.39.
GBP/JPY Daily Outlook
Daily Pivots: (S1) 158.70; (P) 159.11; (R1) 159.78; More...
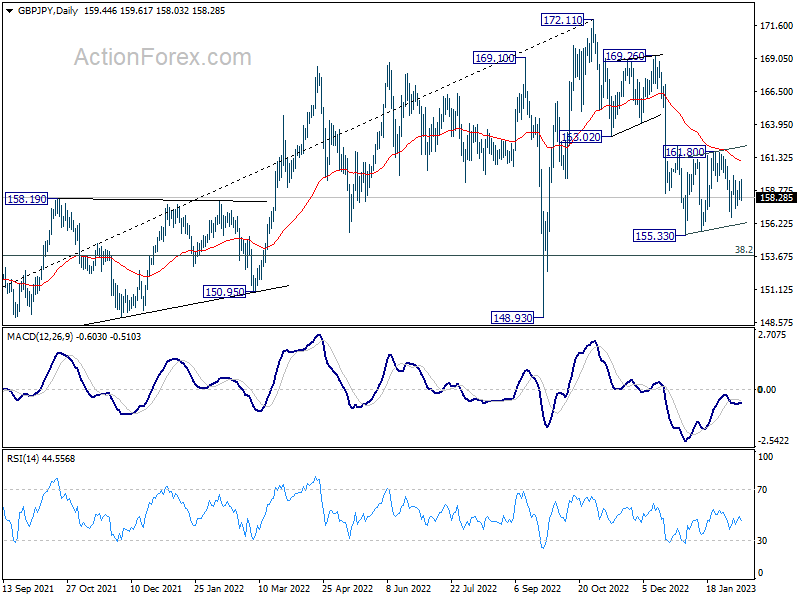
Intraday bias in GBP/JPY stays neutral and outlook is unchanged. On the downside, break of 155.33 low will resume the fall form 172.11 to 153.70 fibonacci level next. On the upside, sustained trading above 55 day EMA (now at 161.04) will turn bias to the upside, for stronger rise back to 169.26/172.11 resistance zone.
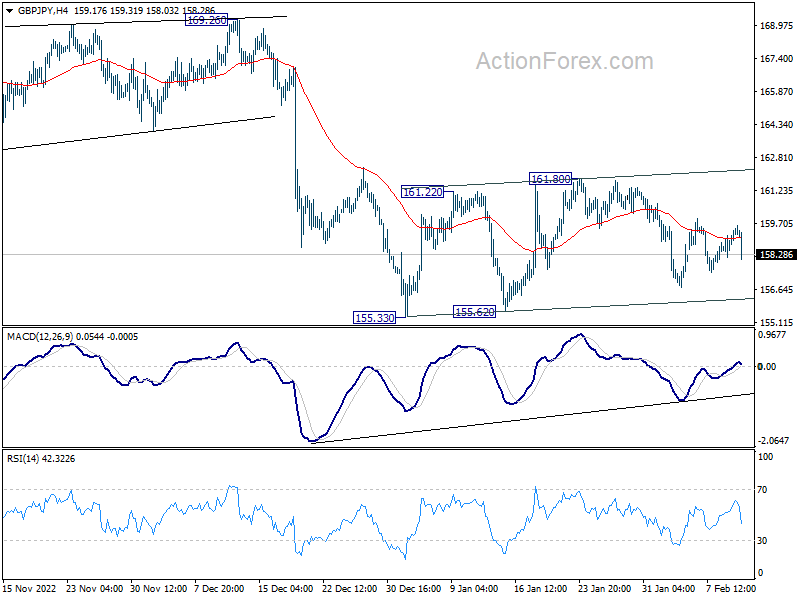
In the bigger picture, as long as 163.02 support turned resistance holds, decline from 172.11 medium term top is expected to continue to 38.2% retracement of 123.94 to 172.11 at 153.70. Sustained break there will raise the change of trend reversal and target 61.8% retracement at 142.34. Nevertheless, break of 163.02 support turned resistance will argue that the decline has completed, and retain medium term bullishness.