
Sample Category Title
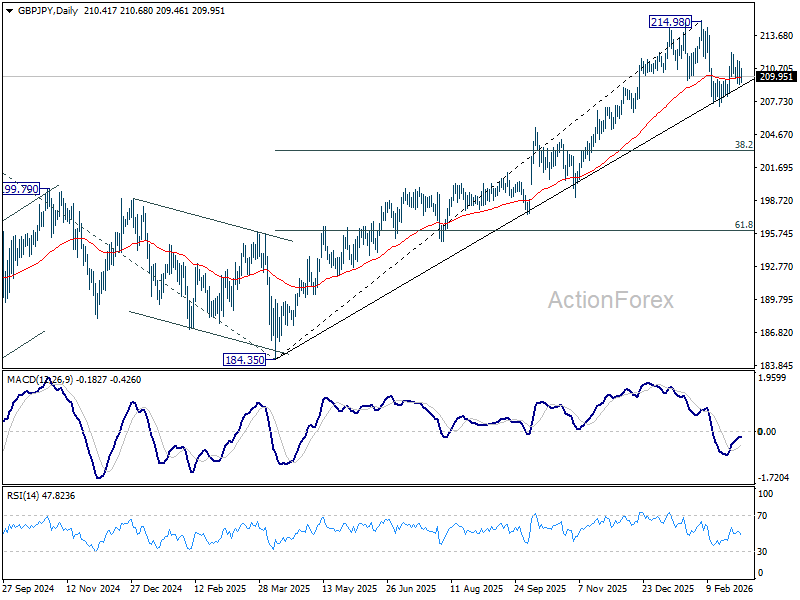
GBP/JPY Daily Outlook
Daily Pivots: (S1) 209.45; (P) 210.41; (R1) 211.59; More...
No change in GBP/JPY's outlook and intraday bias stays neutral at this point. Corrective fall from 214.98 should have completed at 207.20 already. On the upside, above 212.10 will resume the rebound from 207.20 to retest 214.98 high. For now, risk will stay on the upside as long as 207.20 holds.
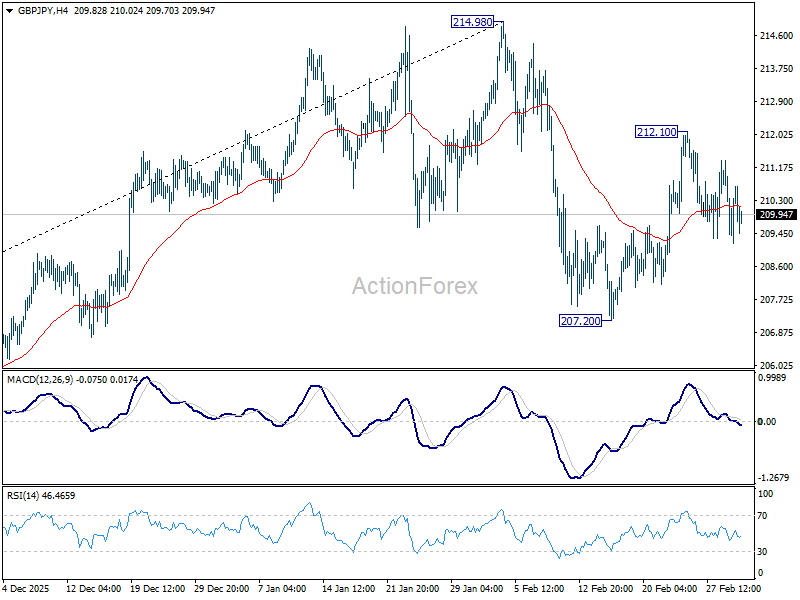
In the bigger picture, current development argues that price actions from 214.98 might be a near term consolidation pattern only. That is, larger up trend from 123.94 (2020 low) is still in progress. Firm break of 214.98 will target 61.8% projection of 148.93 (2022 low) to 208.09 (2024 high) from 184.35 at 220.90. On the downside, though, break of 207.20 will revive that case that it's already in a larger scale correction.
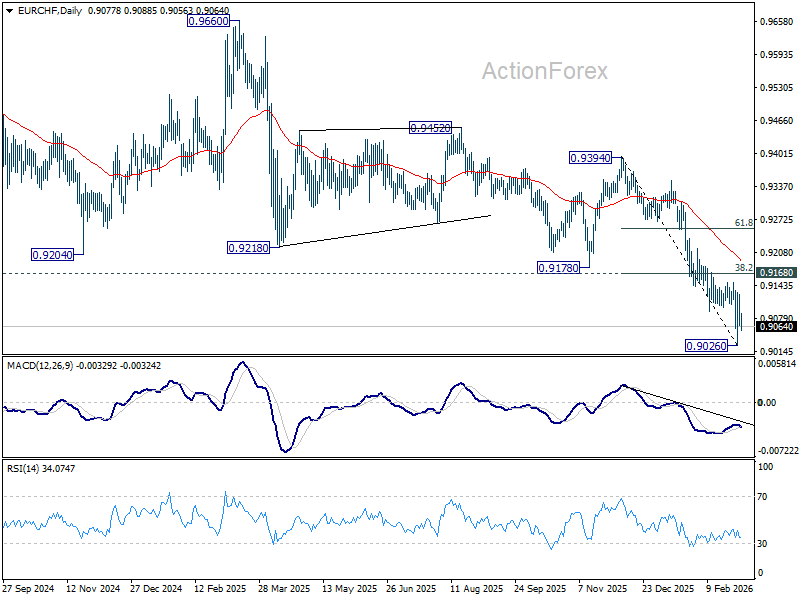
EUR/CHF Daily Outlook
Daily Pivots: (S1) 0.9056; (P) 0.9092; (R1) 0.9117; More....
Range trading continues in EUR/CHF and intraday bias stays neutral. Price actions from 0.9026 short term bottom are viewed as a consolidations pattern only. While stronger recovery cannot be ruled out, upside should be limited by 0.9168 cluster resistance (38.2% retracement of 0.9394 to 0.9026 at 0.9167). Another fall below 0.9026 to resume the larger down trend is expected at a later stage. However, decisive break of 0.9167/8 will bring stronger rebound to 55 D EMA (now at 0.9195) and possibly above.
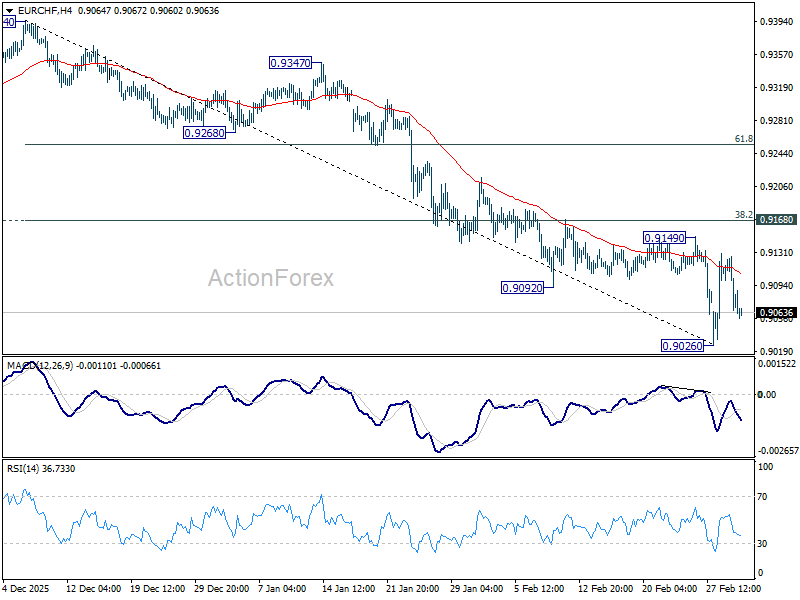
In the bigger picture, down trend from 0.9928 (2024 high) is still in progress. Next target is 61.8% projection of 1.1149 to 0.9407 from 0.9928 at 0.8851. Outlook will stay bearish as long as 0.9394 resistance holds, in case of rebound.
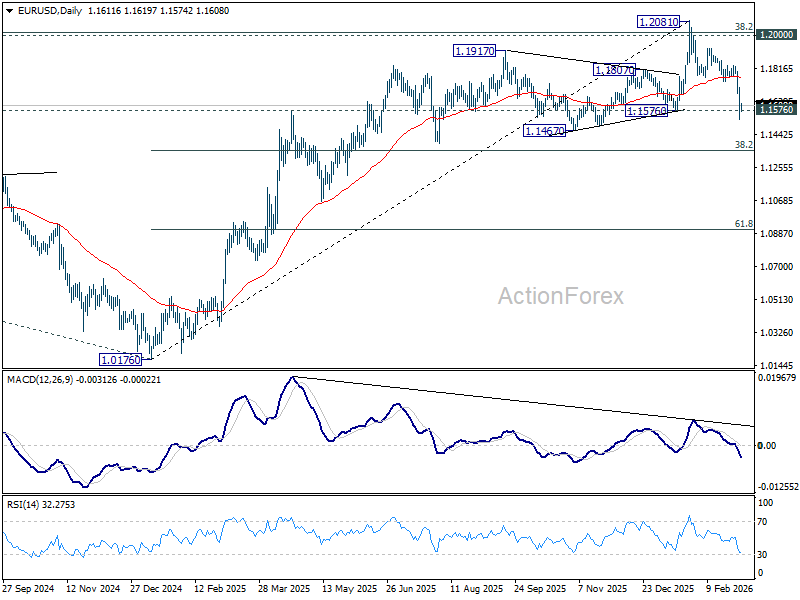
EUR/USD Daily Outlook
Daily Pivots: (S1) 1.1526; (P) 1.1617; (R1) 1.1703; More….
EUR/USD's fall fro 1.2081 is in progress and intraday bias remains on the downside. Sustained break of 1.1576 structural support would confirm rejection by 1.2 key psychological level. That should also confirm medium term topping on bearish divergence condition in D MACD. Further decline should be seen to 38.2% retracement of 1.0176 to 1.2081 at 1.1353 next. For now, risk will stay on the downside as long as 1.1740 support turned resistance holds, in case of recovery.
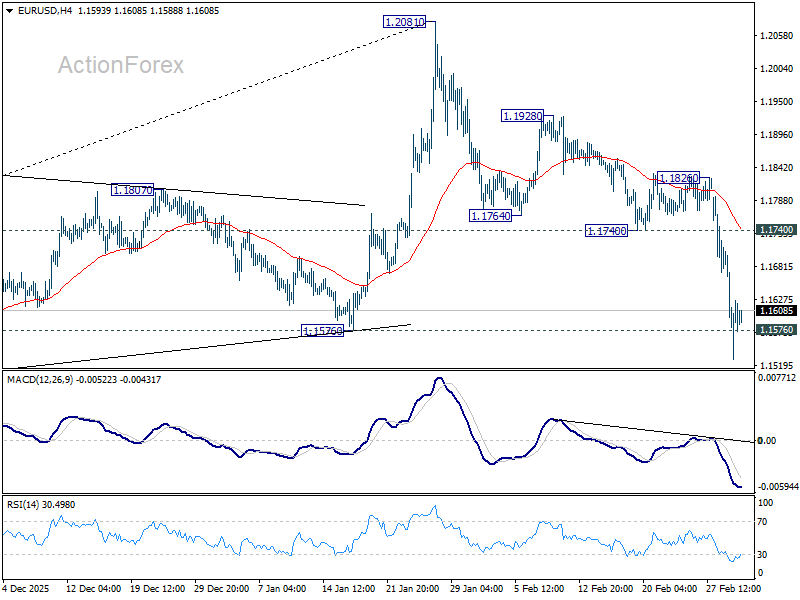
In the bigger picture, as long as 55 W EMA (now at 1.1494) holds, up trend from 0.9534 (2022 low) is still in favor to continue. Decisive break of 1.2 key psychological level will add to the case of long term bullish trend reversal. Next medium term target will be 138.2% projection of 0.9534 to 1.1274 from 1.0176 at 1.2581. However, sustained trading below 55 W EMA will argue that rise from 0.9534 has completed as a three wave corrective bounce, and keep long term outlook bearish.
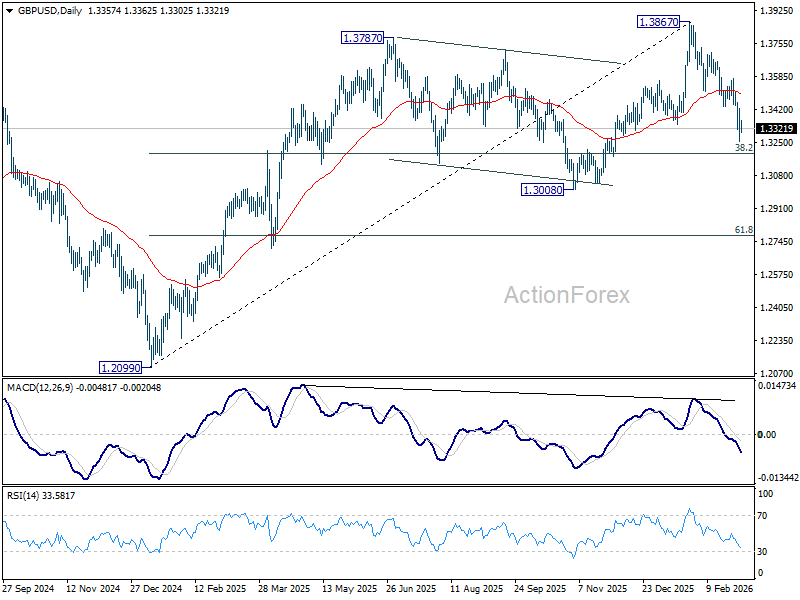
GBP/USD Daily Outlook
Daily Pivots: (S1) 1.3266; (P) 1.3345; (R1) 1.3438; More...
Intraday bias in GBP/USD remains on the downside at this point. Fall from 1.3867 should at least be correcting the rise from 1.2009. Deeper fall should be seen to 38.2% retracement of 1.2099 to 1.3867 at 1.3192. Sustained break there will pave the way to 1.3008 support. For now, risk will stay on the downside as long as 1.3574 resistance holds, in case of recovery.
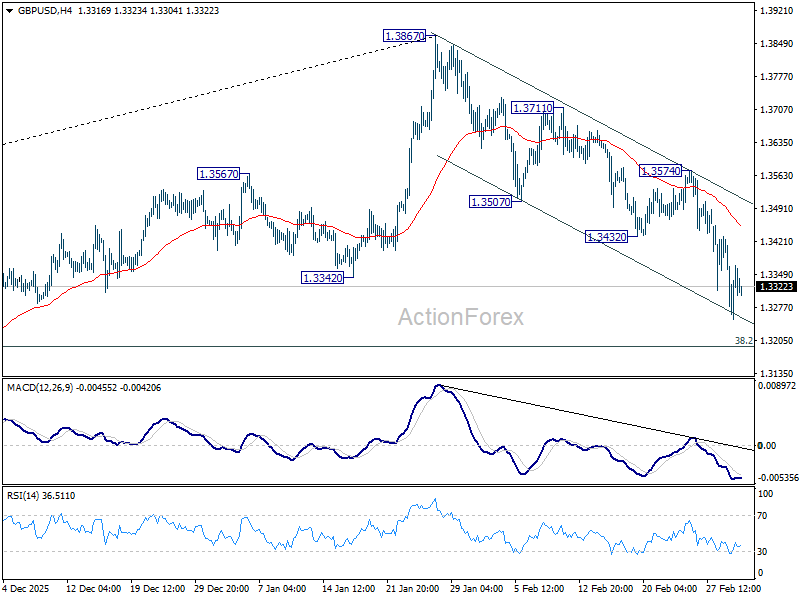
In the bigger picture, as long as 1.3008 support holds, rise from 1.3051 (2022 low) should still be in progress for 1.4284 key resistance (2021 high). Decisive break there will add to the case of long term bullish trend reversal. However, firm break of 1.3008 will raise the chance of medium term bearish reversal and target 1.2099 support next.
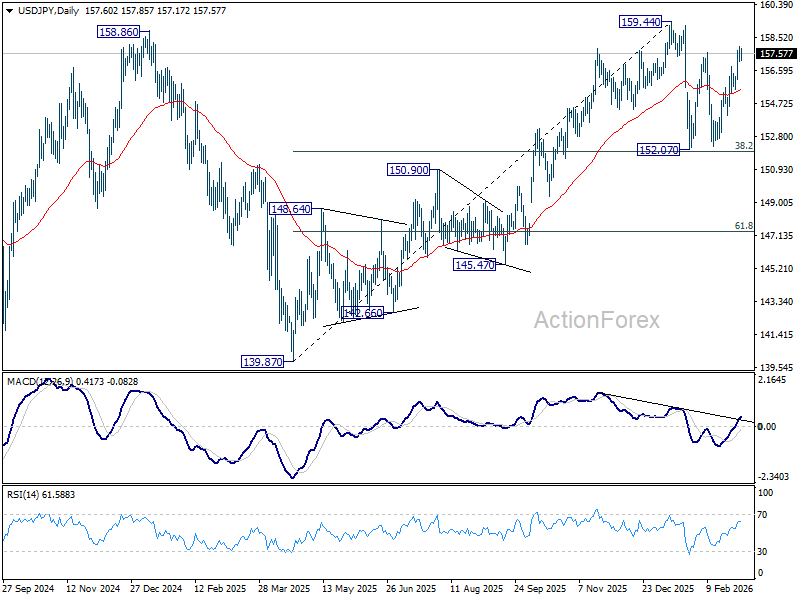
USD/JPY Daily Outlook
Daily Pivots: (S1) 157.24; (P) 157.60; (R1) 158.06; More...
Intraday bias in USD/JPY stays on the upside for the moment. Rise from 152.25 should now target a retest on 159.44 high. On the downside, below 156.81 minor support will turn intraday bias neutral first. Overall, price actions from 159.44 are viewed as a near term consolidation pattern. Outlook will remain bullish as long as 38.2% retracement of 139.87 to 159.44 at 151.96 holds.
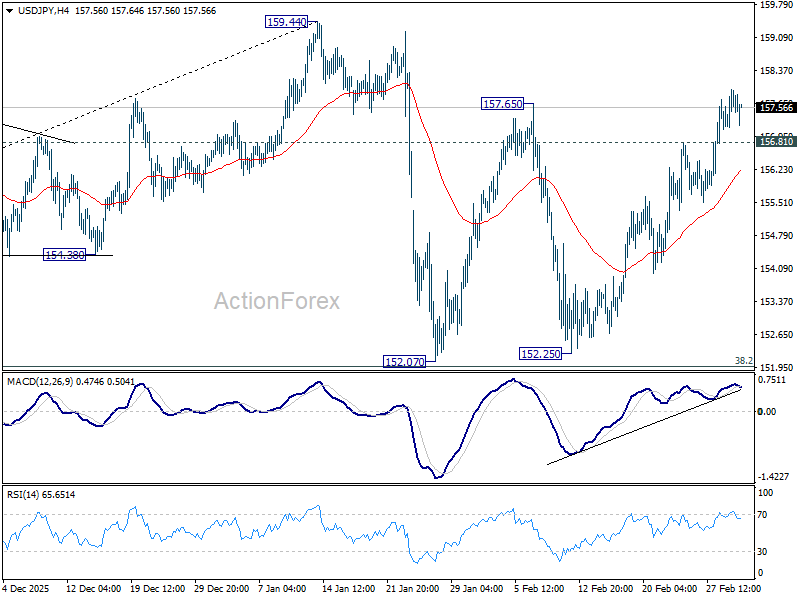
In the bigger picture, outlook is unchanged that corrective pattern from 161.94 (2024 high) should have completed with three waves at 139.87. Larger up trend from 102.58 (2021 low) could be ready to resume through 161.94. This will remain the favored case as long as 55 W EMA (now at 152.16) holds. However, sustained break of 55 W EMA will argue that the pattern from 161.94 is extending with another falling leg.
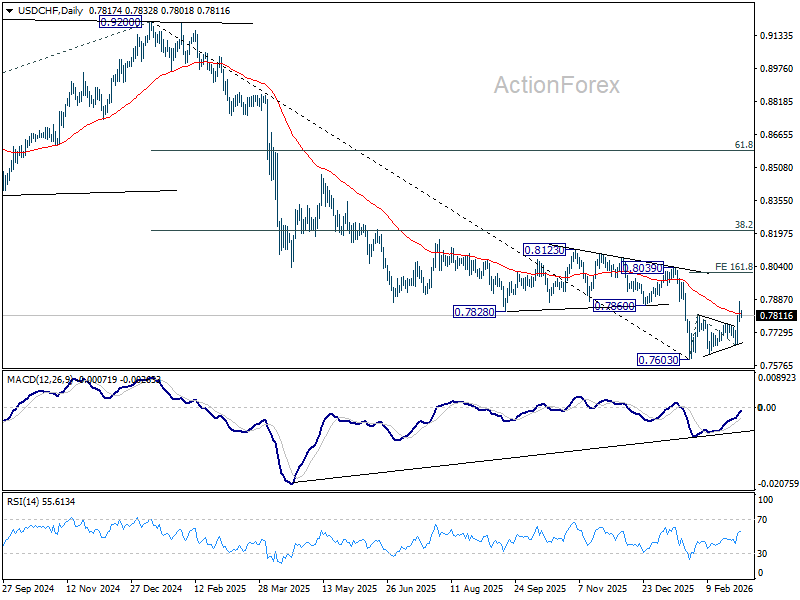
USD/CHF Daily Outlook
Daily Pivots: (S1) 0.7775; (P) 0.7827; (R1) 0.7870; More….
Intraday bias in USD/CHF stays mildly on the upside at this point. Rebound from 0.7603 is seen as correcting the whole fall from 0.9022. Further rise should be seen to 161.8% projection of 0.7603 to 0.7816 from 0.7671 at 0.8016. On the downside, though, below 0.7777 minor support will turn bias neutral again first.
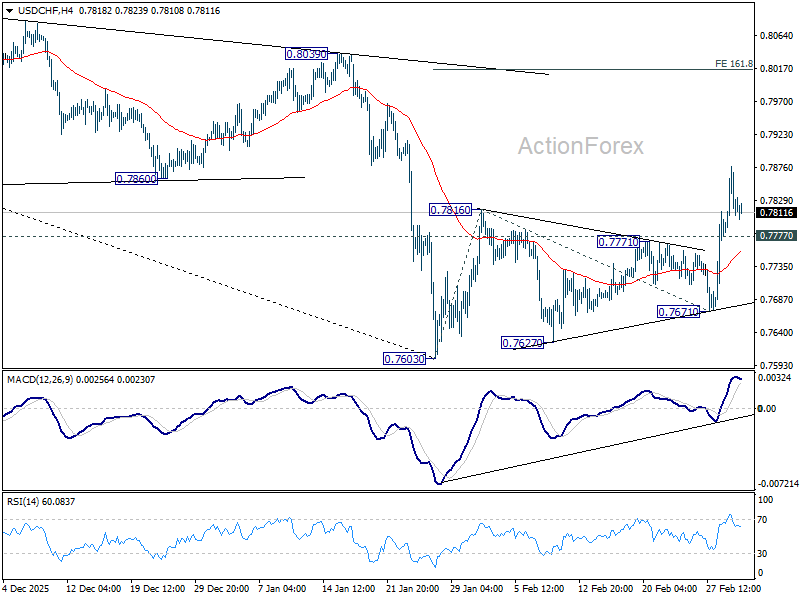
In the bigger picture, a medium term bottom could be in place at 0.7603 on bullish convergence condition in D MACD, Firm break of 0.8039 resistance will argue that it's at least correcting the down trend from 0.9002. Stronger rebound would then be seen to 38.2% retracement of 0.9200 to 0.7603 at 0.8213.
USD/CAD Daily Outlook
Daily Pivots: (S1) 1.3638; (P) 1.3696; (R1) 1.3738; More...
USD/CAD edged higher to 1.3751 but quickly retreated. Intraday bias stays neutral at this point. Strong resistance is still expected from 55 D EMA (now at 1.3726) to limit upside to complete the consolidation pattern from 1.3480. Below 1.3624 minor support will bring retest of 1.3480 low first. However, decisive break of 55 D EMA will bring stronger rebound to 1.3927 resistance instead.
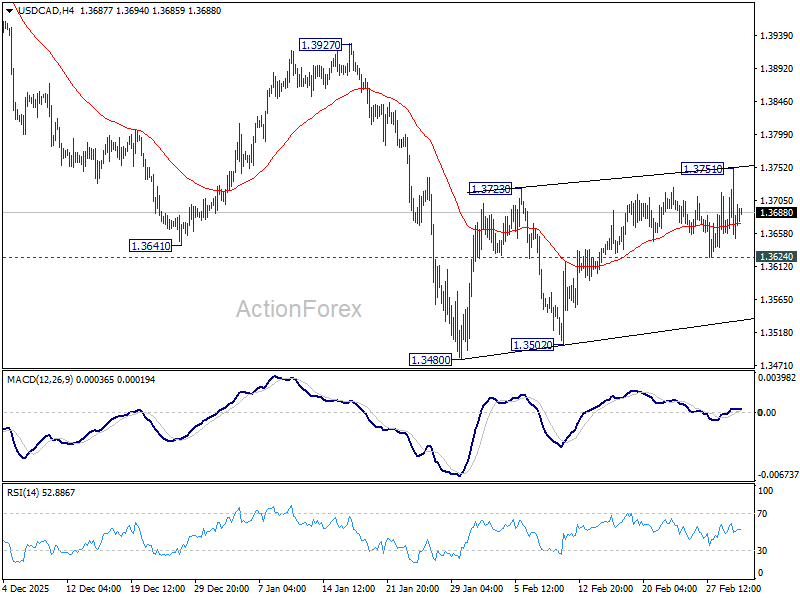
In the bigger picture, price actions from 1.4791 are seen as a corrective pattern to the whole up trend from 1.2005 (2021 low). Deeper fall could be seen as the pattern extends, to 61.8% retracement of 1.2005 to 1.4791 at 1.3069. For now, medium term outlook will be neutral at best, until there are signs that the correction has completed, or that a bearish trend reversal is confirmed.
AUD/USD Daily Report
Daily Pivots: (S1) 0.7048; (P) 0.7083; (R1) 0.7129; More...
AUD/USD accelerated lower, but stays above 0.6896 support. Intraday bias remains neutral at this point. Further rally is still in favor with 0.6896 support intact. On the upside, firm break of 0.7146 will resume resume larger up trend 0.7206 fibonacci level. However, firm break of 0.6896 will indicate that a larger scale correction is underway, and target 38.2% retracement of 0.5913 to 0.7146 at 0.6675.
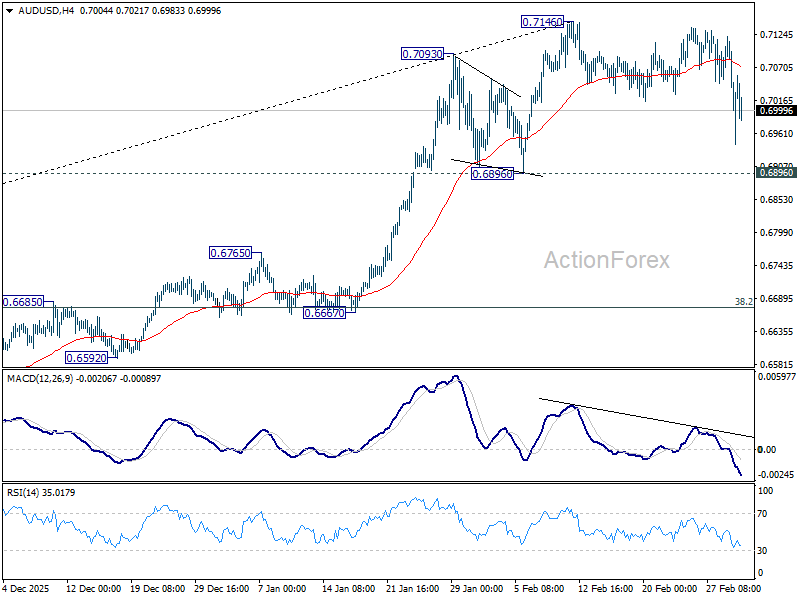
In the bigger picture, current development argues that rise from 0.5913 (2024 low) is reversing whole down trend from 0.8006 (2021 high). Further rally should be seen to 61.8% retracement of 0.8006 to 0.5913 at 0.7206. This will remain the favored case as long as 0.6706 resistance turned support holds, even in case of deep pullback.
Markets Rattled by Energy Crisis Fears, Fed Hike Risk and Forced Liquidations
Asian markets plunged into deep risk-off territory today as investors grappled with the escalating Middle East conflict and its growing economic consequences. Equity markets across the region extended losses for a third consecutive session, reflecting mounting fears that the crisis is evolving from a regional military confrontation into a broader global economic shock.
South Korea led the downturn, with the Kospi plunging more than -12% at one point before recovering slightly later in the session. Trading halts were triggered as volatility surged, marking the worst performance since 2024. Japan’s Nikkei also suffered heavy losses, falling more than -4%, while Hong Kong’s Hang Seng dropped around -2.7%. Selling pressure has been particularly intense in export-driven economies that are highly sensitive to disruptions in global trade and energy supply chains.
The widening military confrontation in the Middle East is now threatening to transform into a systemic economic crisis. While air strikes dominate the headlines, markets are increasingly focused on a more critical development: the effective closure of the Strait of Hormuz.
Seaborne traffic through the narrow waterway has collapsed as tankers either remain stranded or anchor offshore to avoid potential drone and missile attacks. What is unfolding is not merely a military blockade but an economic choke point for global energy markets.
The implications are particularly severe for Asia. Japan, South Korea and Taiwan rely on the Strait of Hormuz for close to 90% of their oil imports. With tanker flows disrupted, these economies are confronting an immediate energy security challenge that threatens both industrial output and consumer confidence.
Rising oil prices are also reshaping expectations for global monetary policy. The energy surge is forcing traders to reassess the Fed’s easing timeline as higher fuel costs risk reigniting inflation pressures. Markets that previously anticipated rate cuts as early as mid-2026 are now shifting those expectations further out. The possibility of a prolonged policy pause has become the base case as policymakers wait to assess the inflationary impact of the energy shock.
Recent Fed discussions also suggest policymakers are not entirely dismissing the possibility of further tightening if inflation proves stubborn. Minutes from the January meeting revealed that some officials supported language acknowledging that upward rate adjustments could still be appropriate if inflation remained above target. While an immediate rate hike remains unlikely, the mere reintroduction of that scenario into market thinking represents a significant shift from earlier expectations of a smooth easing cycle.
Meanwhile, the three-day slide in Asian equities has raised concerns about forced liquidations. In technical terms, sustained multi-day declines often trigger margin calls, compelling leveraged investors to sell assets and accelerating the downward spiral.
In currency markets, activity has stabilized somewhat but defensive positioning remains evident. Dollar stands as the strongest performer this week so far, benefiting from safe-haven demand. Loonie follows on the back of higher oil prices, while Yen holds third place.
At the other end of the spectrum, Euro remains the weakest major currency as markets treat it as a proxy for geopolitical stability in Europe and the Middle East. Kiwi and Aussie are also under pressure amid the broader risk-off environment, while Sterling and Swiss Franc sit in the middle of the pack.
In Asia, at the time of writing, Nikkei is down -4.03%. Hong Kong HSI is down -2.96%. China Shanghai SSE is down -1.45%. Singapore Strait Times is down -2.45%. Japan 10-year JGB yield is down -0.016 at 2.117. Overnight, DOW fell -0.83%. S&P 500 fell -0.94%. NASDAQ fell -1.02%. 10-year yield rose 0.008 to 4.056.
Australia Q4 GDP beats with 0.8% qoq growth, reinforcing RBA demand concerns
Australia’s economy expanded faster than expected in the fourth quarter, reinforcing concerns that domestic demand may still be running hotter than the RBA would like. GDP grew 0.8% qoq, beating forecasts of 0.7% and accelerating from the previous quarter’s 0.5% pace. On an annual basis, growth came in at 2.6% yoy, also above expectations of 2.2%.
The expansion was broad-based, with output rising in 17 of the economy’s 19 industries. Both public and private demand contributed equally to the result, each adding 0.3 percentage points to overall growth. Household activity also showed resilience, with discretionary spending increasing 0.4% during the quarter, helped by strong retail events such as Black Friday.
At the same time, households continued to rebuild financial buffers. The saving ratio climbed to 6.9%, the highest level in more than three years, while per capita GDP rose 0.9% yoy — its strongest reading since 2022.
The strength of the data places the RBA in a difficult position. Just a day earlier, Governor Michele Bullock warned that demand may be outpacing the economy’s capacity. The GDP figures appear to reinforce that view, suggesting the current 3.85% cash rate may not yet be restrictive enough to cool activity.
Japan PMI composite finalized at 53.9, firms pass rising costs to customers
Japan’s service sector maintained steady momentum in February, with the final PMI Services reading edging up to 53.8 from January’s 53.7. The figure marks the strongest level since May 2024 and signals continued expansion in business activity, supported by improving demand conditions.
The broader picture for the economy also strengthened. PMI Composite rose to 53.9 from 53.1, pointing to the fastest pace of private sector expansion in nearly three years.
According to Annabel Fiddes of S&P Global Market Intelligence, the services sector recorded its quickest rise in sales in almost two years, while manufacturing performance also remained robust.
At the same time, cost pressures intensified across the private sector. Input costs climbed at a historically sharp pace, but improving demand allowed businesses to pass those increases on to customers. Selling prices rose at the fastest rate in nearly twelve years, suggesting firms are regaining pricing power while inflationary pressures remain elevated.
China PMIs show two-speed economy as official data contracts
China’s February PMI data revealed a widening divide between official indicators and private surveys, highlighting the uneven nature of the country’s economic transition.
The official manufacturing PMI, released by the National Bureau of Statistics of China, slipped to 49.0 from January’s 49.3, missing expectations and marking a second consecutive month of contraction. Activity in services and construction also stayed weak, with the non-manufacturing PMI edging slightly up from 49.4 to 49.5.
However, private-sector surveys paint a starkly different picture. According to data compiled by RatingDog, manufacturing PMI surged from 50.3 to 52.1, its strongest level since December 2020. The services PMI jumped even more sharply, rising to 56.7, the highest reading in nearly three years.
This divergence suggests a “dual-track” economy emerging in China. State-dominated sectors tied to construction and traditional heavy industry appear to be cooling, while private, export-oriented firms are experiencing a resurgence in demand, particularly in higher-value manufacturing and technology-linked industries.
Part of the discrepancy may also reflect seasonal distortions around the Lunar New Year. Large state factories often shut down for extended periods during the holiday, while smaller and more flexible private firms tend to ramp up production quickly to capture early-year export orders.
The February data may therefore capture both the growing pains of China’s structural shift toward “new productive forces” and the short-term disruptions created by the holiday cycle.
Fed's Kashkari reconsiders rate-cut outlook after Middle East escalation
Minneapolis Fed President Neel Kashkari said the escalating conflict in the Middle East has significantly clouded the policy outlook, undermining earlier confidence that easing inflation would pave the way for rate cuts. Kashkari noted that he had entered 2026 expecting that cooling price pressures might justify a single reduction in interest rates.
However, the joint U.S.-Israel attack on Iran has introduced a potential new global shock. Policymakers and markets alike must now determine how severe the disruption might become and whether it will resemble a prolonged geopolitical conflict like Russia’s invasion of Ukraine or a more contained escalation.
Kashkari stressed that the key risk lies in inflation expectations. If headline inflation remains elevated for an extended period following years of already strong price growth, the Fed may need to remain cautious. In such a scenario, policymakers would have to carefully assess the persistence of inflation before moving toward any easing of monetary policy.
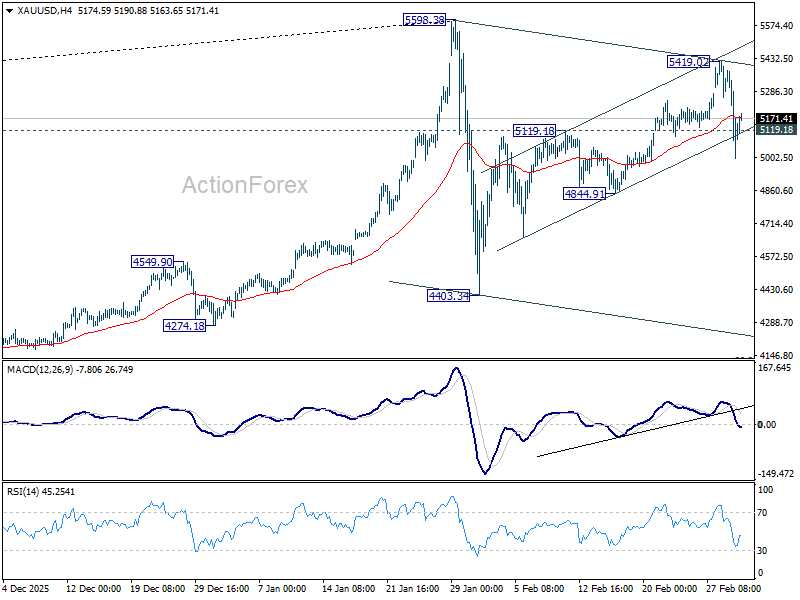
Gold falls as Fed repricing trumps war premium, second leg consolidation finished
Gold weakened sharply overnight as markets moved past the initial geopolitical shock of the widening Middle East conflict and began repricing the Federal Reserve outlook. The early safe-haven surge faded as investors reassessed the broader implications of the conflict, particularly the inflationary impact of surging oil prices.
The threat to the Strait of Hormuz has driven crude prices higher, but the implications for Gold are more complex than a simple risk-off rally. While geopolitical tensions typically support bullion, the resulting spike in energy costs also raises the prospect that global inflation could remain elevated for longer than previously expected.
Higher oil prices act as a direct challenge to the Fed’s disinflation narrative. Energy costs effectively operate as a tax on economic activity while simultaneously pushing headline inflation higher. As a result, traders have begun pushing back expectations for the next Fed rate cut from June or July toward September.
That shift implies a longer period of policy restraint as the Fed waits to assess how persistent the energy shock may prove. If inflation expectations begin to rise again, policymakers are likely to remain cautious, preferring to keep rates higher for longer until the second-round effects of oil prices become clearer.
In that environment, Gold faces increasing competition from Dollar. During periods of stress, investors often prioritize liquidity, and the greenback tends to benefit more directly from global risk aversion. With Dollar Index moving back toward the 100 level, Gold is facing renewed pressure from its inverse correlation with the currency.
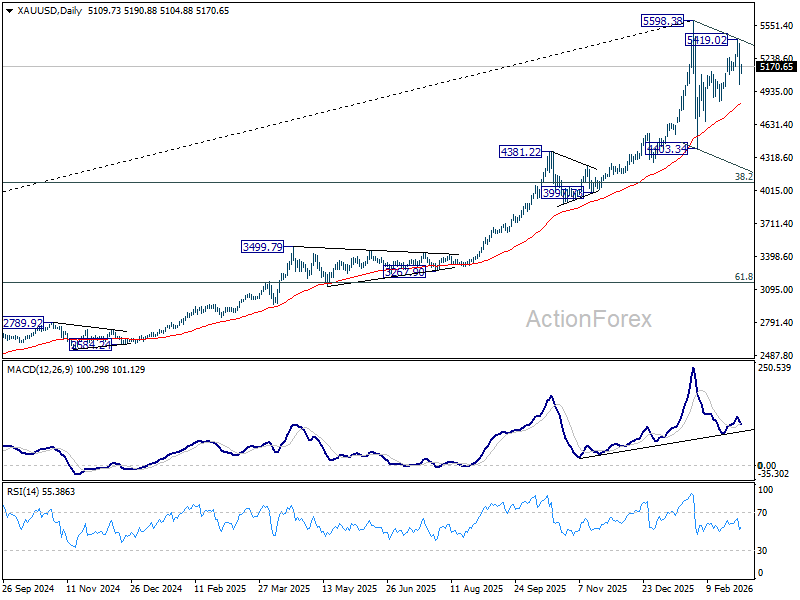
Technically, however, the current development remains consistent with our view. Price actions from 5598.38 record high are seen as a corrective pattern, with the first leg completed at 4403.34.
The current break of 5119.18 resistance turned support argues that the second leg from 4403.34 might have already completed at 5419.02 already. Risk will stay on the downside for 4844.91 support first. Firm break there should solidify this case and bring deeper decline back towards 4403.34.
However, break of 5419.02 will extend the rise with 4403.34 with on more upleg, and possibly with a retest of 5598.38 before completion.
AUD/USD Daily Report
Daily Pivots: (S1) 0.7048; (P) 0.7083; (R1) 0.7129; More...
AUD/USD accelerated lower, but stays above 0.6896 support. Intraday bias remains neutral at this point. Further rally is still in favor with 0.6896 support intact. On the upside, firm break of 0.7146 will resume resume larger up trend 0.7206 fibonacci level. However, firm break of 0.6896 will indicate that a larger scale correction is underway, and target 38.2% retracement of 0.5913 to 0.7146 at 0.6675.
In the bigger picture, current development argues that rise from 0.5913 (2024 low) is reversing whole down trend from 0.8006 (2021 high). Further rally should be seen to 61.8% retracement of 0.8006 to 0.5913 at 0.7206. This will remain the favored case as long as 0.6706 resistance turned support holds, even in case of deep pullback.
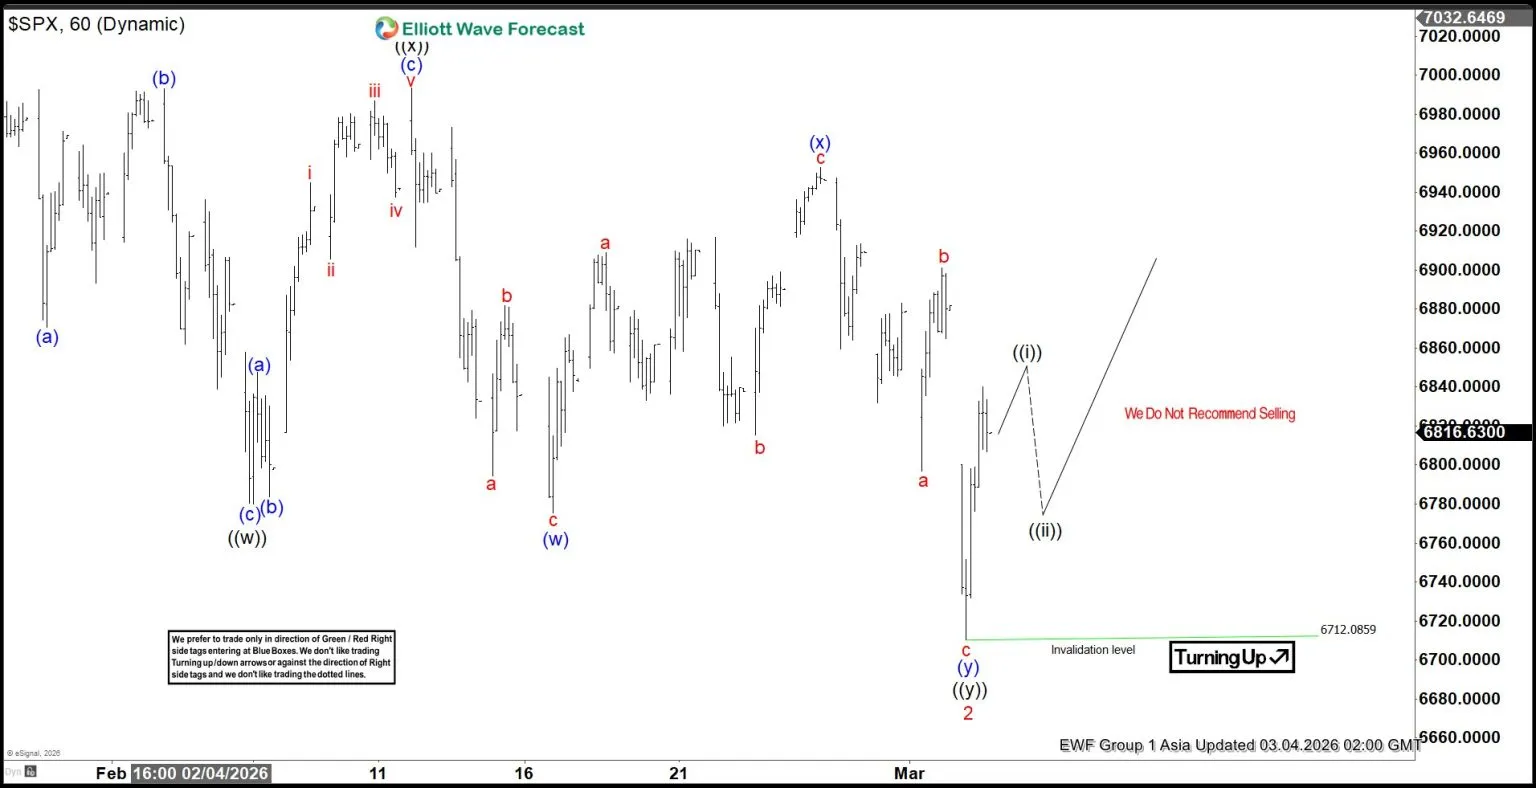
Elliott Wave Analysis SPX Targets Recovery in 3 Waves at Least
Short-term Elliott Wave analysis indicates that the rally to 7002.28 on January 28, 2026 marked the completion of wave 1. Following this advance, the market entered a corrective phase. The wave 2 pullback recently concluded at 6712, as illustrated in the one-hour chart. This decline corrected the cycle that began from the November 21, 2025 low, and its internal subdivisions unfolded in a double three structure, a common corrective pattern within Elliott Wave theory.
From the peak of wave 1, the first leg lower, wave ((w)), ended at 6780.13. A subsequent rally formed wave ((x)), which terminated at 6993.48. The final leg, wave ((y)), pushed lower and ended at 6712.08. This level aligns with the 100%–161.8% Fibonacci extension of wave ((w)), measured at 6629–6768, reinforcing its significance as a support zone.
With the correction complete, the Index has turned higher in wave 3. However, a decisive break above 7002.28 is required to fully confirm that the larger degree correction has ended. Until that level is exceeded, the possibility of a broader corrective structure remains. While the Index retains potential to extend toward new all-time highs, traders should remain cautious. The larger cycle from the April 2025 low is mature and could terminate at any time.
Therefore, strict risk management is essential when pursuing upside opportunities. In the near term, as long as the pivot at 6712.08 holds, expectations favor continued strength and further extension higher.
S&P 500 (SPX) 60-Minute Elliott Wave Chart
SPX Elliott Wave Video:
https://www.youtube.com/watch?v=v0LxmFhoZG8