Sample Category Title
EUR/USD Mid-Day Outlook
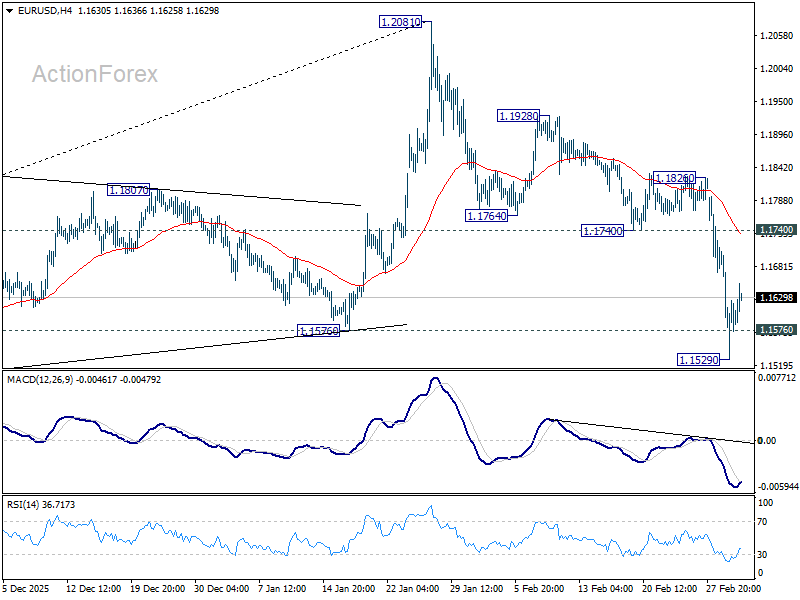
Daily Pivots: (S1) 1.1526; (P) 1.1617; (R1) 1.1703; More….
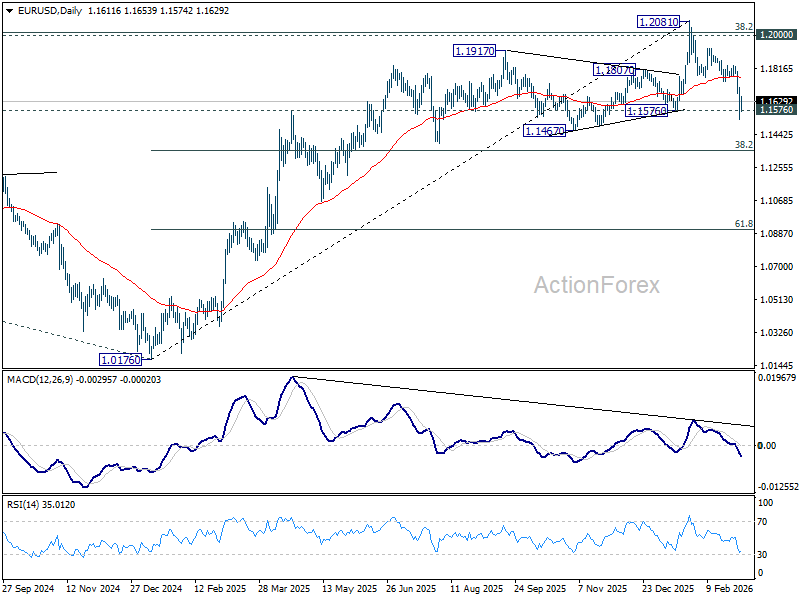
A temporary low should be formed at 1.1529 with current recovery. Intraday bias in EUR/USD is turned neutral first. On the downside, below 1.1529 will resume the fall from 1.2081. Sustained break of 1.1576 structural support would confirm rejection by 1.2 key psychological level. That should also confirm medium term topping on bearish divergence condition in D MACD. Further decline should be seen to 38.2% retracement of 1.0176 to 1.2081 at 1.1353 next. However, firm break of 1.1740 support turned resistance will revive near term bullishness, and bring stronger rebound back to retest 1.2081 high.
In the bigger picture, as long as 55 W EMA (now at 1.1494) holds, up trend from 0.9534 (2022 low) is still in favor to continue. Decisive break of 1.2 key psychological level will add to the case of long term bullish trend reversal. Next medium term target will be 138.2% projection of 0.9534 to 1.1274 from 1.0176 at 1.2581. However, sustained trading below 55 W EMA will argue that rise from 0.9534 has completed as a three wave corrective bounce, and keep long term outlook bearish.
Relief Rally Emerges as US Steps In to Stabilize Oil Flows
Global markets are attempting to recover from the shock of a brutal Asian session as trading moves into Europe. Major European indices have managed to stage a modest rebound, helped in part by strong policy signaling from the US aimed at stabilizing energy markets. However, the recovery remains fragile. The underlying risks tied to the widening Middle East conflict have not disappeared, and markets remain highly sensitive to developments in the Strait of Hormuz.
While oil prices have eased slightly from earlier spikes, the geopolitical premium remains firmly embedded in energy markets. WTI crude has retreated from its session highs but is still trading near 75, well above levels seen before the escalation . The persistence of this war premium suggests that traders remain cautious about the potential for further disruptions to global oil flows.
The threat to shipping routes has become the central economic concern. Tanker traffic through the Strait of Hormuz had plunged earlier in the week as vessels avoided the area amid escalating military risks. In response, the U.S. government has moved to reassure markets that energy supply lines will remain protected.
Treasury Secretary Scott Bessent confirmed that Washington will introduce a series of measures aimed at supporting the flow of oil through the Persian Gulf. One key initiative involves the U.S. International Development Finance Corporation providing insurance coverage for oil tankers and cargo vessels operating in the Gulf region. This measure is designed to prevent insurers from withdrawing coverage and paralyzing energy shipments.
The announcement follows remarks from President Donald Trump, who said the US could deploy naval escorts to protect tankers navigating the Strait of Hormuz if necessary. Together, these measures have acted as a financial “tourniquet” for global markets.
Yet the improvement in market mood is being counterbalanced by another source of uncertainty: trade policy. The U.S. administration confirmed that its recently announced global tariff measures will soon take effect. Bessent said the planned 15% global tariff will be implemented this week.
More importantly, the Office of the U.S. Trade Representative and the Commerce Department will conduct additional studies that could justify further trade restrictions. In around five months time, Bessent expected tariffs to be back to the level before they were struck down by the Supreme Court.
The combination of geopolitical risk and rising trade tensions is keeping investors cautious. U.S. equity futures are currently hovering near flat levels, suggesting that traders remain reluctant to take aggressive positions.
Currency markets reflect a similar sense of restraint. Most major currency pairs remain within the previous session’s ranges, indicating that volatility has cooled for now. Even so, Dollar continues to dominate as the preferred safe-haven asset this week. Canadian Dollar is the second-strongest performer, benefiting from higher oil prices, while Yen holds the third position. Euro remains the weakest major currency, while Swiss Franc and Kiwi follow close behind. Sterling and Aussie trade in the middle of the performance table.
In Europe, at the time of writing, FTSE is up 0.87%. DAX is up 1.63%. CAC is up 1.12%. UK 10-year yield is down -0.007 at 4.400. Germany 10-year yield is up 0.004 at 2.770. Earlier in Asia, Nikkei fell -3.61%. Hong Kong HSI fell -2.01%. China Shanghai SSE fell -0.98%. Singapore Strait Times fell -2.11%. Japan 10-year JGB yield fell -0.014 to 2.119.
US ADP jobs grow 63k, pay premium for job switchers falls
US private sector employment grew moderately in February, coming in stronger than market expectations. Figures from ADP showed payrolls increasing by 63k during the month, compared with forecasts of around 45k.
The increase was driven primarily by the services sector, which added 47k jobs, while goods-producing industries contributed 16k. Small companies accounted for most of the growth, adding 60k positions. Large firms increased employment by 10k, while medium-sized businesses saw payrolls decline by -7k.
Wage growth remained steady but showed signs of cooling momentum for job changers. Pay growth for job-stayers held at 4.5% yoy, while wage gains for those switching employers slowed slightly from 6.4% to 6.3%.
According to Nela Richardson, hiring picked up and wage gains remain solid overall, but job growth remains concentrated in a limited number of sectors and the pay premium for switching employers has fallen to a record low.
Eurozone PPI surges 0.7% mom in January as energy costs climb
Eurozone industrial producer prices rose sharply in January, signaling renewed upstream inflation pressures. According to data from Eurostat, PPI increased 0.7% mom, significantly above expectations of a 0.2% rise.
The increase was broad-based across industrial categories. Prices for intermediate goods climbed 1.0% mom, while energy prices rose 1.3%. Capital goods prices increased 0.6% and durable consumer goods rose 0.8%, while non-durable consumer goods was the only category to decline, slipping -0.2%. Excluding energy, total industry prices still rose 0.6% during the month.
Across the wider European Union, PPI increased 0.8% mom. Among member states, the largest increases were recorded in Estonia (+13.7%), Bulgaria (+7.1%), and Finland (+6.9%). In contrast, producer prices declined in several countries, including Cyprus (-0.9%), Czechia (-0.7%), and both Germany and Slovakia (-0.6%).
Eurozone services PMI finalized at 51.9 as Germany leads growth
Eurozone business activity strengthened modestly in February, with services providing continued support to the region’s fragile recovery. The final PMI Services reading came in at 51.9, up from January’s 51.6. PMI Composite index was finalized at 51.9, up from 51.3 in the previous month
Among the major economies, Germany led the expansion with a composite reading of 53.2, marking a four-month high. Italy followed with a reading of 52.1, while Spain registered 51.5 despite slipping to a nine-month low. Ireland also remained in expansion territory at 52.5. France remained the weakest performer, however, with a composite reading of 49.9, still slightly below the 50 threshold separating expansion from contraction.
According to Cyrus de la Rubia of Hamburg Commercial Bank, the data suggest the ECB may have little reason to consider additional rate cuts in the near term. He noted that service sector costs remained elevated in February, driven by higher wages as well as rising energy and transport expenses. Germany could increasingly become the growth engine of the eurozone, as expanding infrastructure and defence spending begin to support broader economic activity.
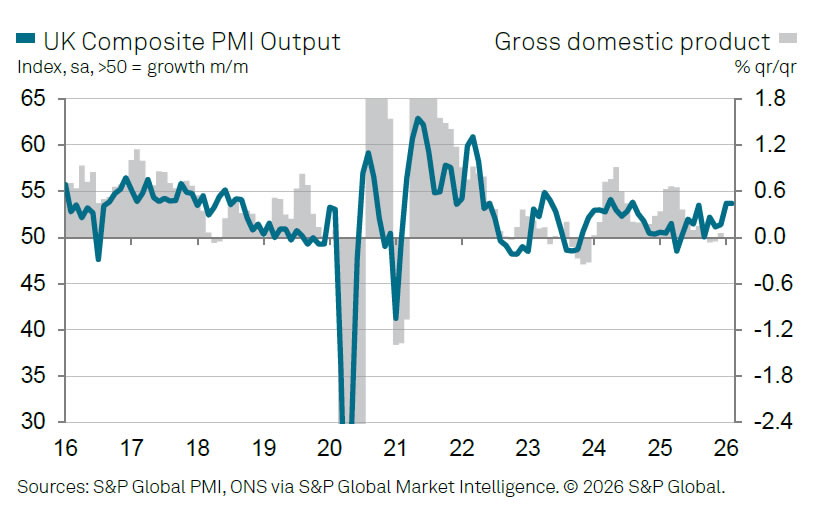
UK PMI composite finalized at 17-month high, cost pressures persist
The UK service sector continued to expand steadily in February, with final PMI Services reading coming in at 53.9, only slightly below January’s 54.0. PMI Composite index was unchanged at 53.7, maintaining the 17-month high reached at the start of the year.
According to Tim Moore of S&P Global Market Intelligence, service providers reported rising new business inflows and stronger sales pipelines, driven largely by domestic demand. Businesses cited improved spending from both companies and consumers within the UK, though export orders remained relatively subdued and growth in that segment eased to a three-month low.
Despite the improving activity backdrop, employment declined across the sector. Companies continued to cut jobs as part of efforts to boost productivity and offset rising costs. Firms widely cited higher payroll expenses as a key driver of input cost inflation, alongside increases in food and technology costs. These pressures led to another robust rise in prices charged by service providers, with inflation in selling prices remaining close to January’s five-month high.
Swiss CPI rises 0.6% mom in February, annual inflation holds at 0.1%
Switzerland’s consumer prices rose more than expected in February, offering a modest sign of price pressure despite still subdued annual inflation. Data from the Federal Statistical Office showed CPI increased 0.6% mom, slightly above the expected 0.5% gain.
Core CPI, which excludes fresh and seasonal products as well as energy and fuel, rose by 0.2% mom on the month. The monthly increase was largely driven by higher domestic prices, which climbed 0.6%, while imported product prices rose 0.8%.
According to the FSO, the monthly increase was mainly driven by higher housing rents and air transport costs. Prices also rose for hotels and package holidays, while declines in items such as berries and fruit and vegetable juices partly offset the increase.
On an annual basis, headline inflation remained very subdued but slightly stronger than anticipated. CPI held steady at 0.1% yoy, slightly above expectations of a mild -0.1% yoy contraction. Core CPI edged down from 0.5%. Domestic prices accelerated modestly from 0.5% to 0.6%. Meanwhile, imported prices continued to decline, falling further from -1.5% to -1.6%.
Australia Q4 GDP beats with 0.8% qoq growth, reinforcing RBA demand concerns
Australia’s economy expanded faster than expected in the fourth quarter, reinforcing concerns that domestic demand may still be running hotter than the RBA would like. GDP grew 0.8% qoq, beating forecasts of 0.7% and accelerating from the previous quarter’s 0.5% pace. On an annual basis, growth came in at 2.6% yoy, also above expectations of 2.2%.
The expansion was broad-based, with output rising in 17 of the economy’s 19 industries. Both public and private demand contributed equally to the result, each adding 0.3 percentage points to overall growth. Household activity also showed resilience, with discretionary spending increasing 0.4% during the quarter, helped by strong retail events such as Black Friday.
At the same time, households continued to rebuild financial buffers. The saving ratio climbed to 6.9%, the highest level in more than three years, while per capita GDP rose 0.9% yoy — its strongest reading since 2022.
The strength of the data places the RBA in a difficult position. Just a day earlier, Governor Michele Bullock warned that demand may be outpacing the economy’s capacity. The GDP figures appear to reinforce that view, suggesting the current 3.85% cash rate may not yet be restrictive enough to cool activity.
Japan PMI composite finalized at 53.9, firms pass rising costs to customers
Japan’s service sector maintained steady momentum in February, with the final PMI Services reading edging up to 53.8 from January’s 53.7. The figure marks the strongest level since May 2024 and signals continued expansion in business activity, supported by improving demand conditions.
The broader picture for the economy also strengthened. PMI Composite rose to 53.9 from 53.1, pointing to the fastest pace of private sector expansion in nearly three years.
According to Annabel Fiddes of S&P Global Market Intelligence, the services sector recorded its quickest rise in sales in almost two years, while manufacturing performance also remained robust.
At the same time, cost pressures intensified across the private sector. Input costs climbed at a historically sharp pace, but improving demand allowed businesses to pass those increases on to customers. Selling prices rose at the fastest rate in nearly twelve years, suggesting firms are regaining pricing power while inflationary pressures remain elevated.
China PMIs show two-speed economy as official data contracts
China’s February PMI data revealed a widening divide between official indicators and private surveys, highlighting the uneven nature of the country’s economic transition.
The official manufacturing PMI, released by the National Bureau of Statistics of China, slipped to 49.0 from January’s 49.3, missing expectations and marking a second consecutive month of contraction. Activity in services and construction also stayed weak, with the non-manufacturing PMI edging slightly up from 49.4 to 49.5.
However, private-sector surveys paint a starkly different picture. According to data compiled by RatingDog, manufacturing PMI surged from 50.3 to 52.1, its strongest level since December 2020. The services PMI jumped even more sharply, rising to 56.7, the highest reading in nearly three years.
This divergence suggests a “dual-track” economy emerging in China. State-dominated sectors tied to construction and traditional heavy industry appear to be cooling, while private, export-oriented firms are experiencing a resurgence in demand, particularly in higher-value manufacturing and technology-linked industries.
Part of the discrepancy may also reflect seasonal distortions around the Lunar New Year. Large state factories often shut down for extended periods during the holiday, while smaller and more flexible private firms tend to ramp up production quickly to capture early-year export orders.
The February data may therefore capture both the growing pains of China’s structural shift toward “new productive forces” and the short-term disruptions created by the holiday cycle.
EUR/USD Mid-Day Outlook
Daily Pivots: (S1) 1.1526; (P) 1.1617; (R1) 1.1703; More….
A temporary low should be formed at 1.1529 with current recovery. Intraday bias in EUR/USD is turned neutral first. On the downside, below 1.1529 will resume the fall from 1.2081. Sustained break of 1.1576 structural support would confirm rejection by 1.2 key psychological level. That should also confirm medium term topping on bearish divergence condition in D MACD. Further decline should be seen to 38.2% retracement of 1.0176 to 1.2081 at 1.1353 next. However, firm break of 1.1740 support turned resistance will revive near term bullishness, and bring stronger rebound back to retest 1.2081 high.
In the bigger picture, as long as 55 W EMA (now at 1.1494) holds, up trend from 0.9534 (2022 low) is still in favor to continue. Decisive break of 1.2 key psychological level will add to the case of long term bullish trend reversal. Next medium term target will be 138.2% projection of 0.9534 to 1.1274 from 1.0176 at 1.2581. However, sustained trading below 55 W EMA will argue that rise from 0.9534 has completed as a three wave corrective bounce, and keep long term outlook bearish.
US ADP jobs grow 63k, pay premium for job switchers falls
US private sector employment grew moderately in February, coming in stronger than market expectations. Figures from ADP showed payrolls increasing by 63k during the month, compared with forecasts of around 45k.
The increase was driven primarily by the services sector, which added 47k jobs, while goods-producing industries contributed 16k. Small companies accounted for most of the growth, adding 60k positions. Large firms increased employment by 10k, while medium-sized businesses saw payrolls decline by -7k.
Wage growth remained steady but showed signs of cooling momentum for job changers. Pay growth for job-stayers held at 4.5% yoy, while wage gains for those switching employers slowed slightly from 6.4% to 6.3%.
According to Nela Richardson, hiring picked up and wage gains remain solid overall, but job growth remains concentrated in a limited number of sectors and the pay premium for switching employers has fallen to a record low.
Dollar Restores Confidence by Force
- The dollar follows successes on the international stage.
- Europe risks facing stagflation.
The US dollar is proving to remain king among safe-haven assets. At the same time, growing demand for financing in the American currency is pushing the USD index higher. The euro, on the other hand, is suffering from fears of a return of the energy crisis in Europe. Gas prices have jumped to €65 per megawatt hour. This is a long way from the peak of €345 in 2022, but the longer the conflict in the Middle East lasts, the more problems there will be for the economy.
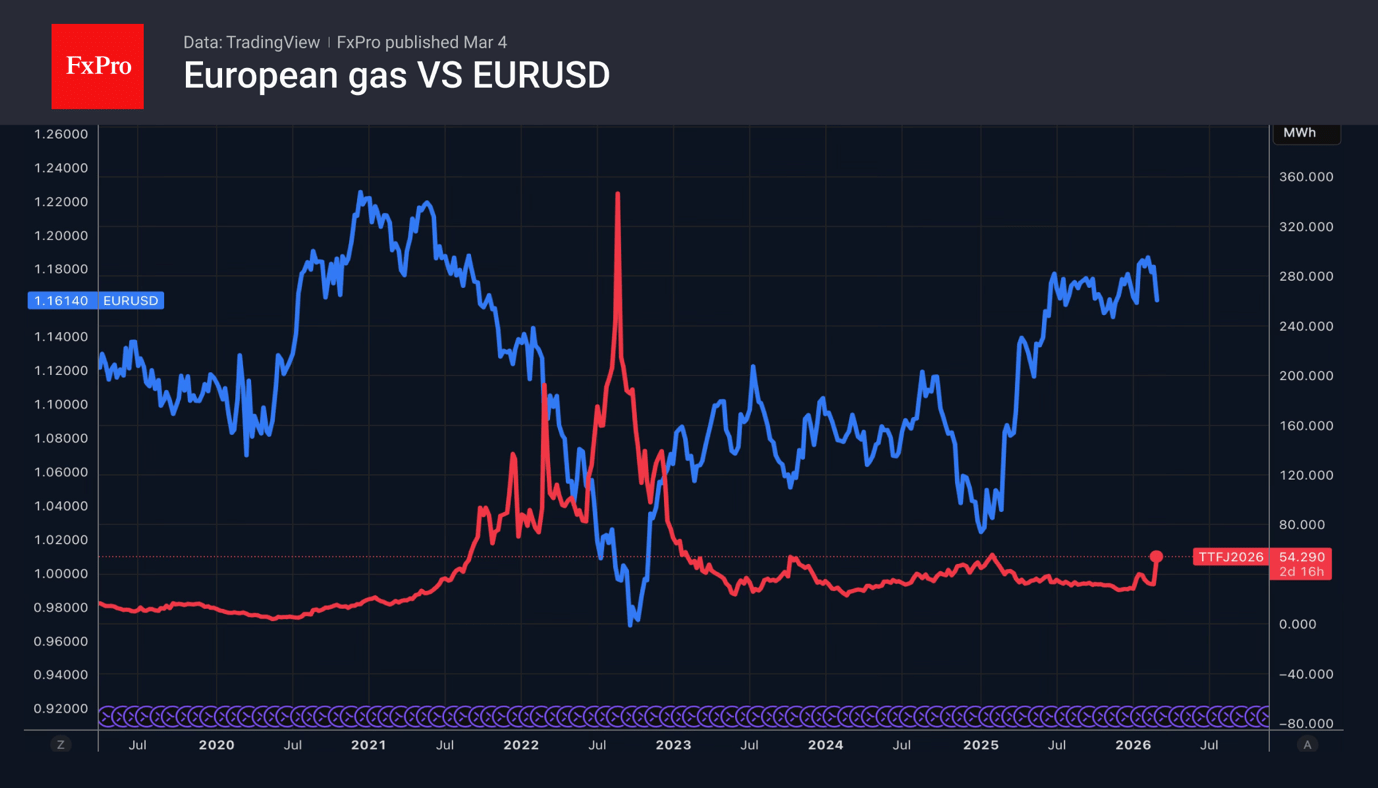
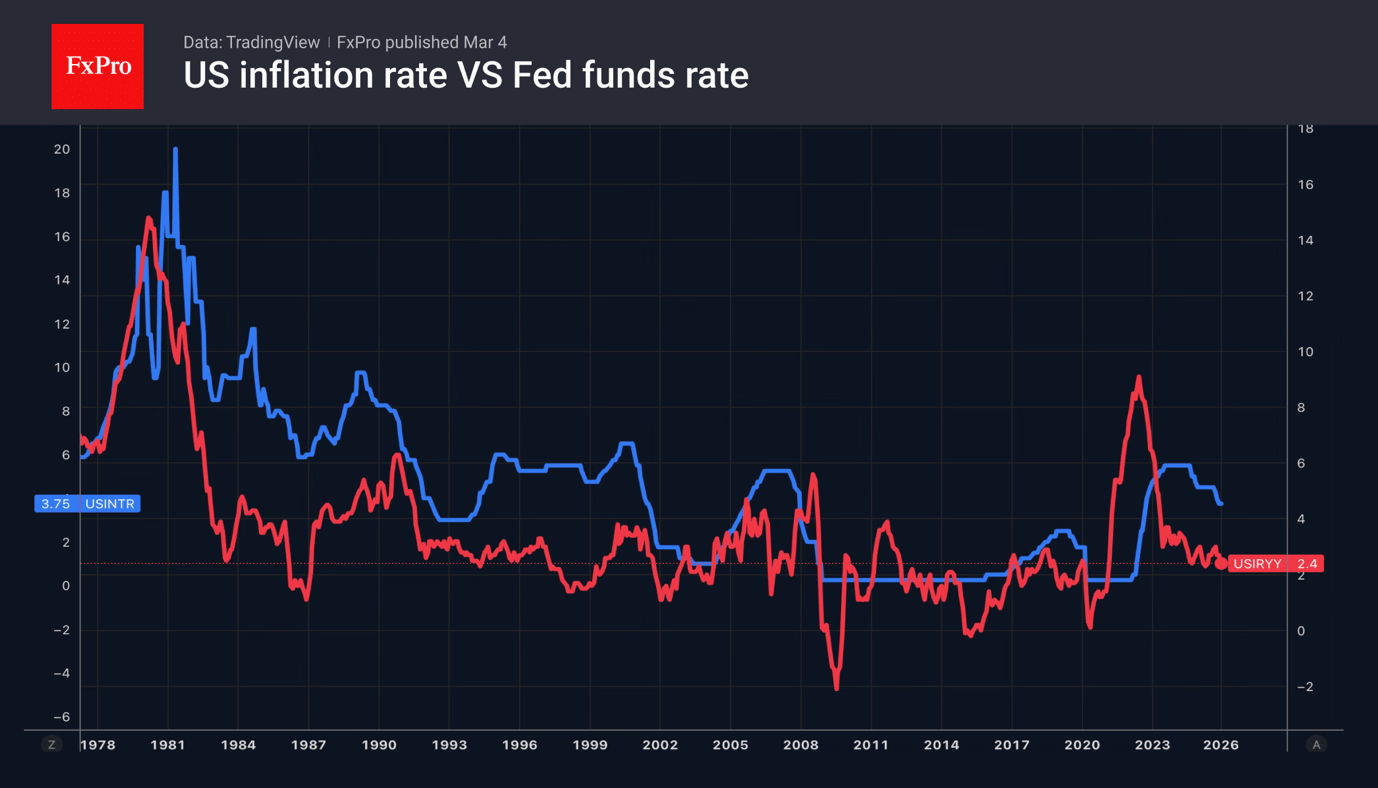
Capital Economics estimates that maintaining gas prices at current levels will add 0.5 percentage points to inflation. In February, i.e. even before the war in Iran began, consumer prices accelerated from 1.7% to 1.9% y/y, while producer prices rose by 0.7% in a month, against average forecasts of 1.7% and 0.2%, respectively. The ECB is once again facing a situation in which inflation is accelerating, and the economy is losing momentum.
The US dollar, on the other hand, is reaping the benefits of the return of American exceptionalism to the markets. The United States is a net exporter of energy commodities, so its economy will be less affected by the surge in oil prices.
Even if the surge in inflation proves to be temporary, it will almost certainly force the Fed to extend its pause in policy easing. The chances of a federal funds rate cut in June have fallen to 37%. The futures market is pricing in less than a 60% probability of cuts in 2026, down from more than 70% a week ago.
High demand for the US dollar is undermining gold’s position. The precious metal saw its worst daily sell-off since late January. One of the key drivers of its rally in 2025 and February was the undermining of confidence in the US currency due to the uncertainty of Donald Trump’s policies and the associated debasement trade.
Macquarie notes that the greenback tends to strengthen when the United States interacts successfully abroad and demonstrates leadership. Thus, the First Gulf War in 1990-1991 was followed by a decade of success for the USD. After the US failures in the war on terror in the 2000s, the US dollar began to lose ground. The fall in EURUSD and gold proves that the greenback is regaining investor confidence.
Gold Regains Traction After Tuesday’s Drop, Larger Bullish Structure Intact Above $5,000
Gold price edged higher on Wednesday (up 1.6% in Asian / European trading) after falling over 4% on Tuesday.
Stronger US dollar on increased safe-haven demand and fading prospects of Fed rate cuts, pressured yellow metal, although Wednesday’s recovery, which retraced around 50% of the previous day’s drop, suggests that losses are likely to be short-lived.
Psychological $5000 support (reinforced by daily Kijun-sen) contained Tuesday’s drop, pointing to a healthy correction of the upleg from $4402 (Feb 2 low) and keeping larger bulls in play.
Gold is expected to continue to shine as geopolitical situation (one of metal’s key drivers) remains very fragile with threats of further escalation.
In such scenario, global uncertainty is expected to deepen and further fuel safe-haven demand from the central banks, as well as individual and institutional investors.
Technical picture on daily chart has improved as MA’s returned to full bullish configuration, positive momentum strengthens and the price action remains underpinned by the daily cloud.
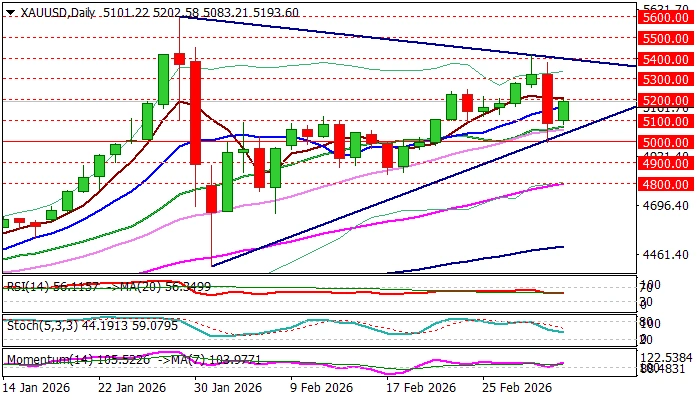
However, bulls need to clear significant barriers at $5200 zone (psychological / daily Tenkan-sen / 50% retracement of $5419/$4996 bear-leg), to confirm fresh bullish signal and shift near-term focus towards next targets at $5257 (Fibo 61.8%), $5300/19 (psychological / Fibo 76.4%) and $5400/19 (psychological / daily triangle upper boundary / Monday’s peak).
Broken ascending 10DMA offers immediate support at $5170, ahead of $5100 (session low / psychological), $5048 (trendline support), guarding $5000 breakpoint.
Res: 5207; 5257; 5319; 5400
Sup: 5170; 5100; 5048; 5000
Price of Silver Recovering After Two-Day Decline
As can be seen on the XAG/USD chart, the price of silver is recovering after forming yesterday’s low below the $79 level. The price per ounce has already exceeded $86 today (+10% in less than 24 hours!).
Volatility in the silver market is being driven by fluctuations in the US dollar, as well as military action in the Middle East, which is fuelling concerns about a prolonged regional conflict. According to media reports:
- → Yesterday, Israel carried out a strike on a building where religious figures had gathered to elect a new Supreme Leader.
- → Following the death of Ali Khamenei, he was succeeded by his son Mojtaba Khamenei. Although some sources consider him the leading candidate (no official statements have yet been made), this has raised concerns that the new Iranian leadership may continue existing policies — increasing uncertainty over the outcome of the conflict.
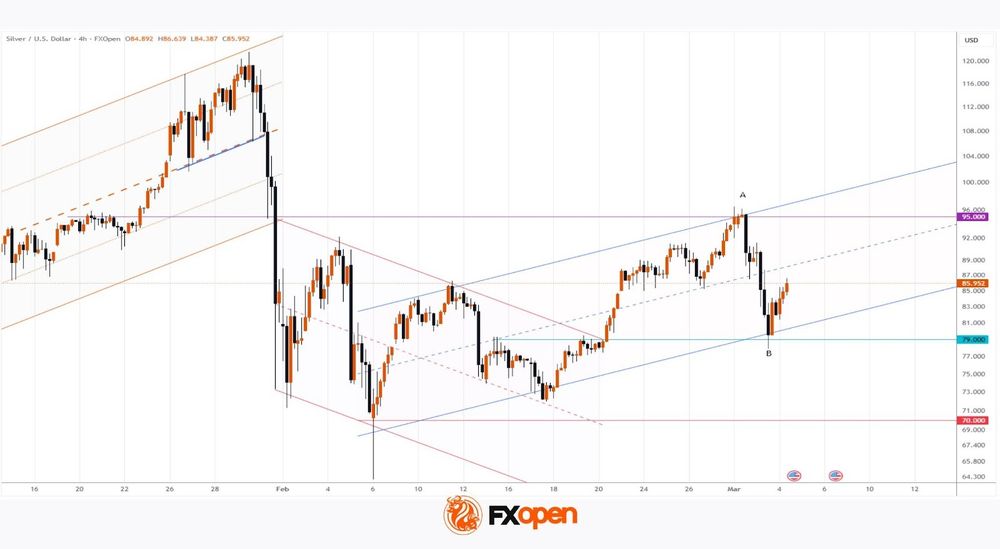
On 20 February, when analysing the XAG/USD chart, we:
- → highlighted the importance of the $95 resistance level;
- → suggested that the price of silver could consolidate above the breakout level of the descending channel around $79 (shown in red), reinforced by the psychological $80 mark.
Indeed, our assumptions were reflected in the formation of a zigzag pattern, with a bearish reversal at the A peak and a bullish reversal at yesterday’s low B. Notably, these and other key extremes make it possible to outline the contours of an upward trajectory (shown in blue).
It is possible that the upward movement observed this morning will continue during the US trading session, allowing XAG/USD to reach the blue median line. Price action at that point may provide important clues — if the median does not show signs of resistance, this may be interpreted as an indication of further upside potential.
Start trading commodity CFDs with tight spreads (additional fees may apply). Open your trading account now or learn more about trading commodity CFDs with FXOpen.
This article represents the opinion of the Companies operating under the FXOpen brand only. It is not to be construed as an offer, solicitation, or recommendation with respect to products and services provided by the Companies operating under the FXOpen brand, nor is it to be considered financial advice.
Crypto Outperformed Stocks in Tuesday’s Recovery
Market Overview
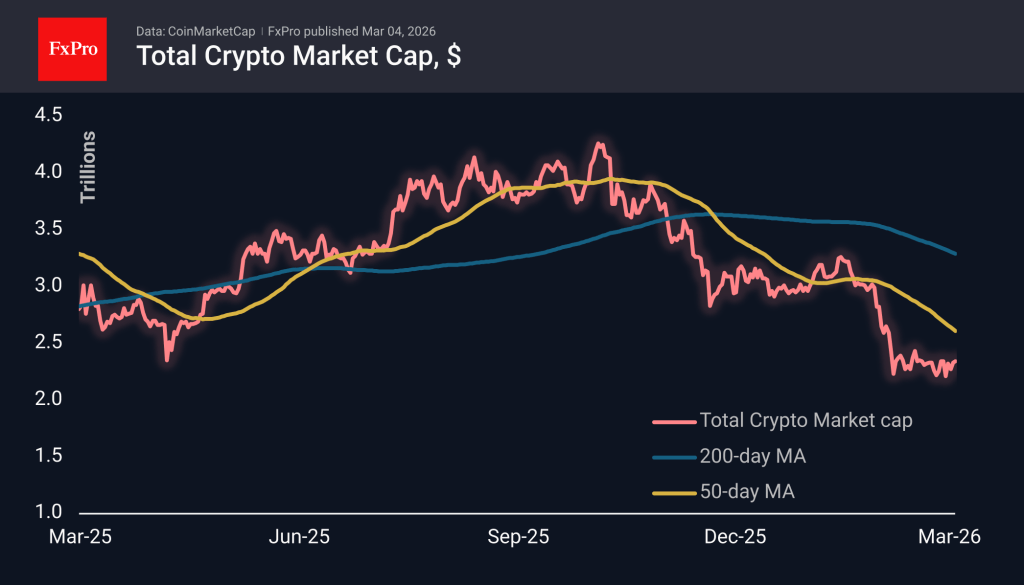
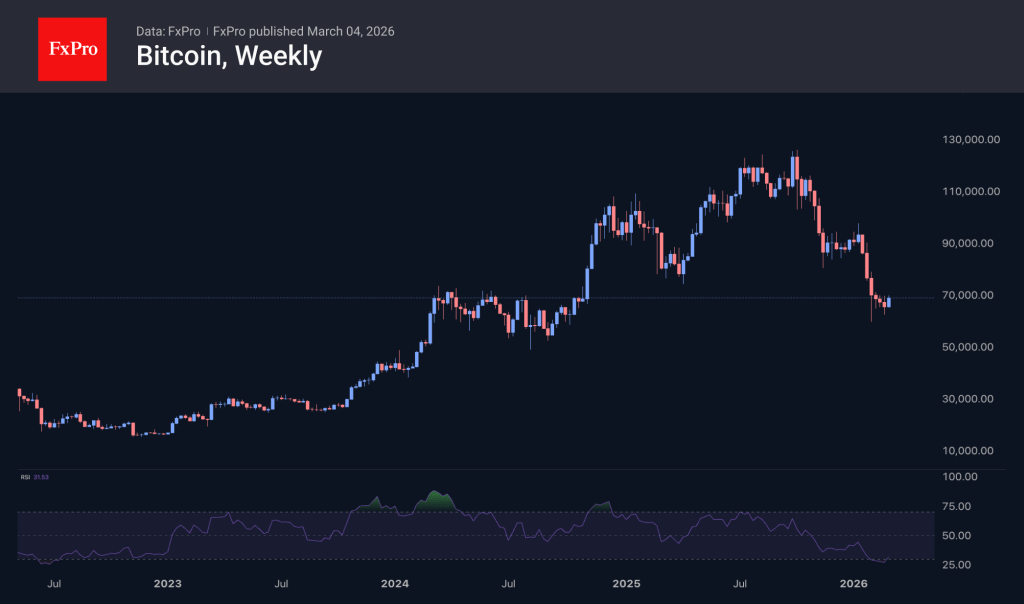
The crypto market cap changed slightly over the past 24 hours, amounting to $2.34T compared to $2.33T the day before. But this is a victory for cryptocurrencies, given the impressive sell-off those financial markets and gold experienced the day before. The US Nasdaq100 lost more than 2.5% intraday but recovered more than half of its losses by the close. At the same time, cryptocurrencies remained unaffected by this turbulence. Perhaps some traders are looking at crypto as a safe haven.
Bitcoin looked more resilient on Tuesday than the US indices. At the start of the European trading session, Bitcoin broke through the resistance of recent weeks, soaring 6% to $71.7K in five hours. Moreover, looking at the intraday dynamics, one can see a sequence of higher local lows. On weekly timeframes, the RSI index has begun to rise from oversold territory. We still consider the situation too fragile to say that the bottom has been reached. Bitcoin is vulnerable due to the increased volatility of stock indices, which is forcing institutional investors to reduce their leverage.
News Background
The London Crypto Club expects that the military operation by the US and Israel against Iran could be a catalyst for Bitcoin’s growth. In the event of a protracted war, investors will start buying the first cryptocurrency as a ‘hedge against the collapse of existing economic and political structures.’
Bitcoin is forming a price bottom and will begin to grow slowly this year, according to VanEck. However, 10x Research warns that there are no signs of an exit from the global bearish trend yet, despite the inflow of funds into ETFs and the disappearance of the asset’s discount on the Coinbase exchange.
Mining company Core Scientific will sell all 2,537 BTC it owns by the end of the first quarter. The funds will be used to increase liquidity and finance its AI strategy, according to its annual report.
Mining company Riot Platforms reported record annual revenue for 2025. Its revenue nearly doubled in 12 months due to a strategic shift towards artificial intelligence infrastructure.
Payment company Visa and infrastructure stablecoin platform Bridge will introduce stablecoin cards in more than 100 countries. Launched in 2025, the product is already operational in 18 countries, with transactions available at more than 175 million points of sale.
USD/JPY to Quickly Return to Growth: Momentum Favours the US Dollar
USD/JPY paused briefly midweek after a series of solid gains, currently trading at 157.59. The Japanese currency remains under pressure from a strengthening US dollar amid concerns that a prolonged conflict in the Middle East could keep energy prices elevated and heighten inflation risks.
The market has also revised its expectations for Federal Reserve rate cuts, shifting the likelihood of a reduction from July to September. Amid escalating geopolitical tensions, the dollar has emerged as a primary safe-haven asset, particularly as the US-Israel military operation against Iran enters its fifth phase.
US President Donald Trump suggested that the strikes could lead to a change of power in Iran. However, any new regime might prove equally problematic, underscoring the uncertainty surrounding the conflict’s outcome.
Japanese Finance Minister Satsuki Katayama reiterated that currency interventions remain a potential tool to support the yen. According to her, authorities are monitoring exchange rate dynamics with heightened urgency and are coordinating their actions with the US.
Technical Analysis
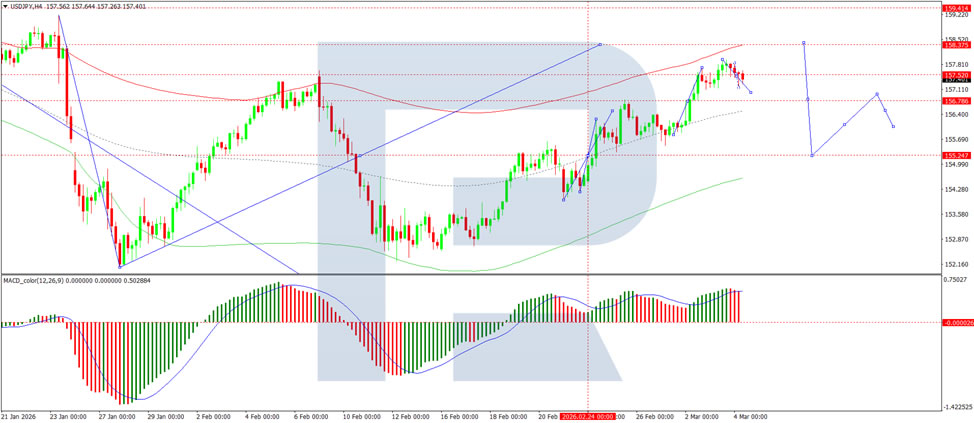
On the H4 USD/JPY chart, the market is forming a consolidation range around 157.00, which is currently extending to 157.92. A decline to test the 157.00 level from above is expected today. Following this, a potential growth leg towards 158.06 is likely. Technically, this scenario is supported by the MACD indicator, whose signal line is well above the zero line and pointing firmly downward.
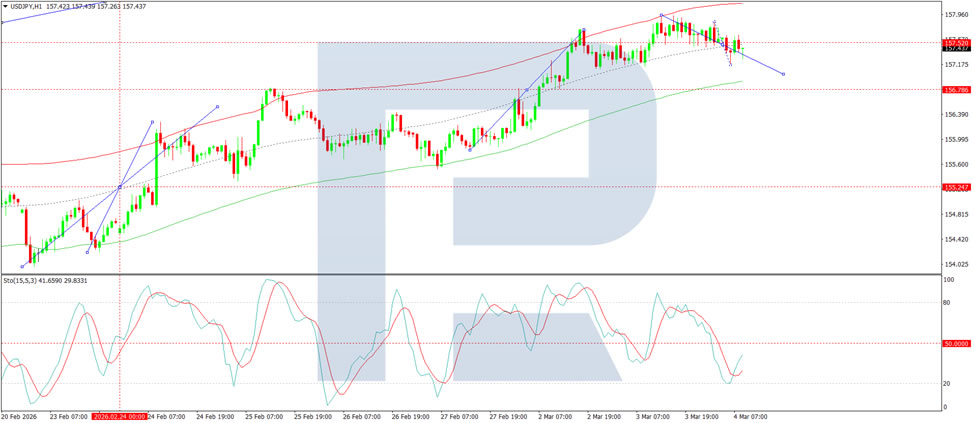
On the H1 chart, USD/JPY is forming a downward wave pattern, targeting the 157.00 level, with a possible extension to 156.66, and further growth towards 158.38 anticipated thereafter. Technically, this scenario is confirmed by the Stochastic oscillator, with its signal line above the 20 level and pointing firmly downward.
Conclusion
USD/JPY’s brief consolidation appears temporary, with the broader trend favouring further upside for the dollar. Geopolitical tensions in the Middle East have reinforced the dollar’s safe-haven status, pushing back expectations for Fed rate cuts and creating a supportive backdrop for the pair. Despite verbal intervention warnings from Japanese officials, the technical outlook suggests USD/JPY is poised to resume its upward trajectory once the current correction runs its course.
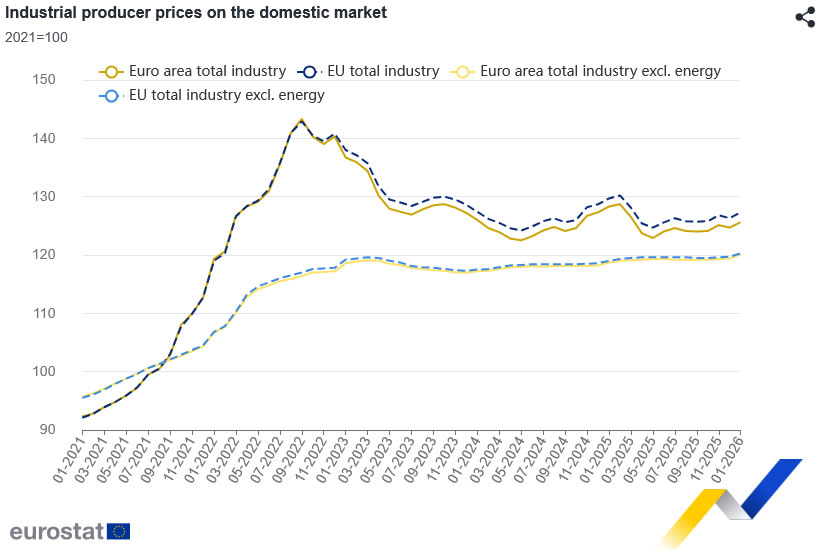
Eurozone PPI surges 0.7% mom in January as energy costs climb
Eurozone industrial producer prices rose sharply in January, signaling renewed upstream inflation pressures. According to data from Eurostat, PPI increased 0.7% mom, significantly above expectations of a 0.2% rise.
The increase was broad-based across industrial categories. Prices for intermediate goods climbed 1.0% mom, while energy prices rose 1.3%. Capital goods prices increased 0.6% and durable consumer goods rose 0.8%, while non-durable consumer goods was the only category to decline, slipping -0.2%. Excluding energy, total industry prices still rose 0.6% during the month.
Across the wider European Union, PPI increased 0.8% mom. Among member states, the largest increases were recorded in Estonia (+13.7%), Bulgaria (+7.1%), and Finland (+6.9%). In contrast, producer prices declined in several countries, including Cyprus (-0.9%), Czechia (-0.7%), and both Germany and Slovakia (-0.6%).
UK PMI composite finalized at 17-month high, cost pressures persist
The UK service sector continued to expand steadily in February, with final PMI Services reading coming in at 53.9, only slightly below January’s 54.0. PMI Composite index was unchanged at 53.7, maintaining the 17-month high reached at the start of the year.
According to Tim Moore of S&P Global Market Intelligence, service providers reported rising new business inflows and stronger sales pipelines, driven largely by domestic demand. Businesses cited improved spending from both companies and consumers within the UK, though export orders remained relatively subdued and growth in that segment eased to a three-month low.
Despite the improving activity backdrop, employment declined across the sector. Companies continued to cut jobs as part of efforts to boost productivity and offset rising costs. Firms widely cited higher payroll expenses as a key driver of input cost inflation, alongside increases in food and technology costs. These pressures led to another robust rise in prices charged by service providers, with inflation in selling prices remaining close to January’s five-month high.