
Sample Category Title
USD/CHF Daily Outlook
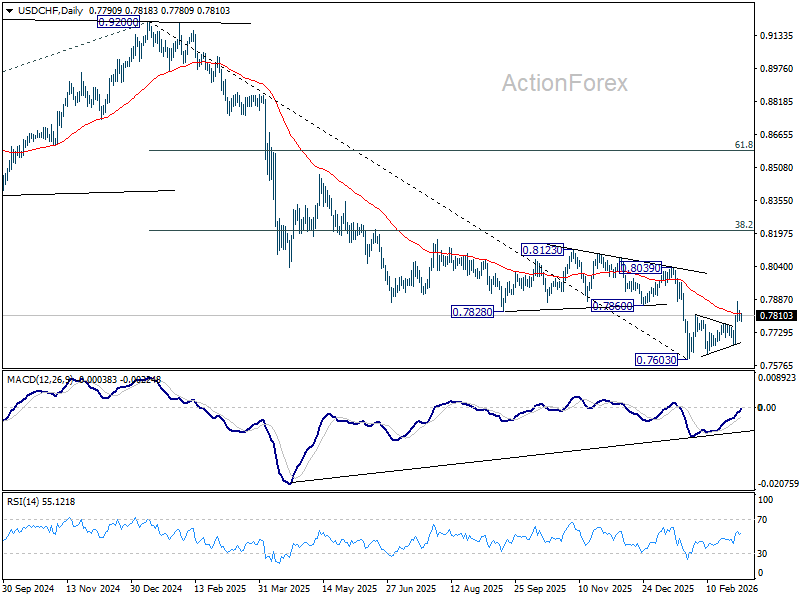
Daily Pivots: (S1) 0.7765; (P) 0.7812; (R1) 0.7838; More….
Intraday bias in USD/CHF remains neutral for the moment, and more consolidations could be seen below 0.7877 temporary top first. Further rise is expected as long as 0.7671 support holds. Rebound from 0.7603 is seen as correcting the whole fall from 0.9022. Above 0.76877 will target 0.8039 resistance next.
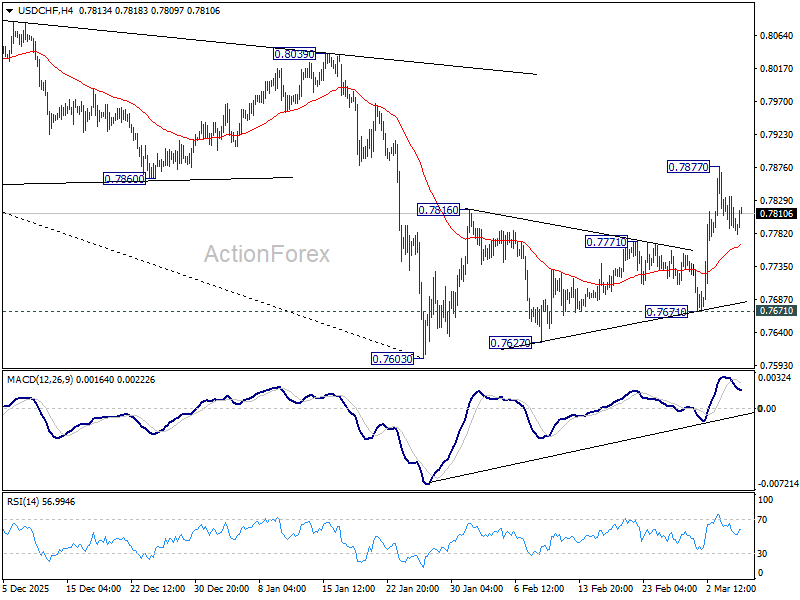
In the bigger picture, a medium term bottom could be in place at 0.7603 on bullish convergence condition in D MACD, Firm break of 0.8039 resistance will argue that it's at least correcting the down trend from 0.9002. Stronger rebound would then be seen to 38.2% retracement of 0.9200 to 0.7603 at 0.8213.
AUD/USD Daily Report
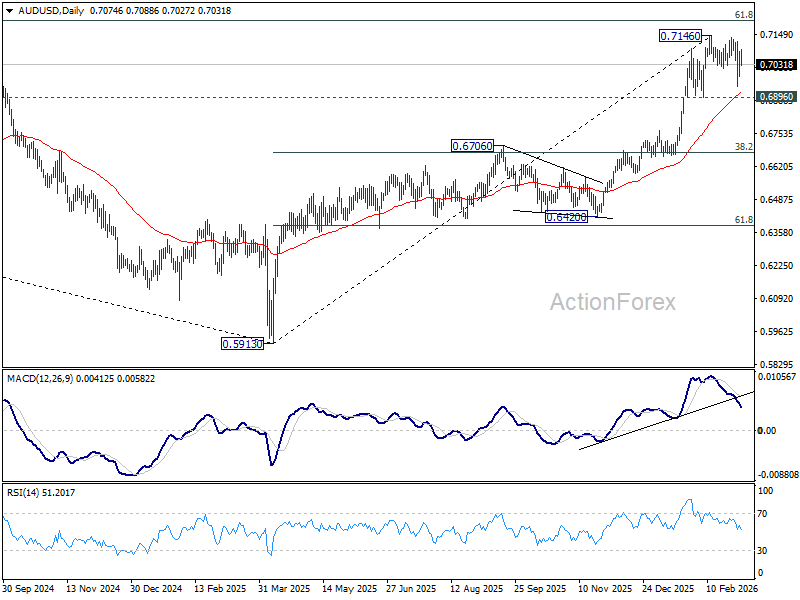
Daily Pivots: (S1) 0.7012; (P) 0.7049; (R1) 0.7112; More...
AUD/USD rebounded notably but stays in established range below 0.7146. Intraday bias remains neutral and more consolidations could be seen. Further rally is still in favor with 0.6896 support intact. On the upside, firm break of 0.7146 will resume resume larger up trend 0.7206 fibonacci level. However, firm break of 0.6896 will indicate that a larger scale correction is underway, and target 38.2% retracement of 0.5913 to 0.7146 at 0.6675.
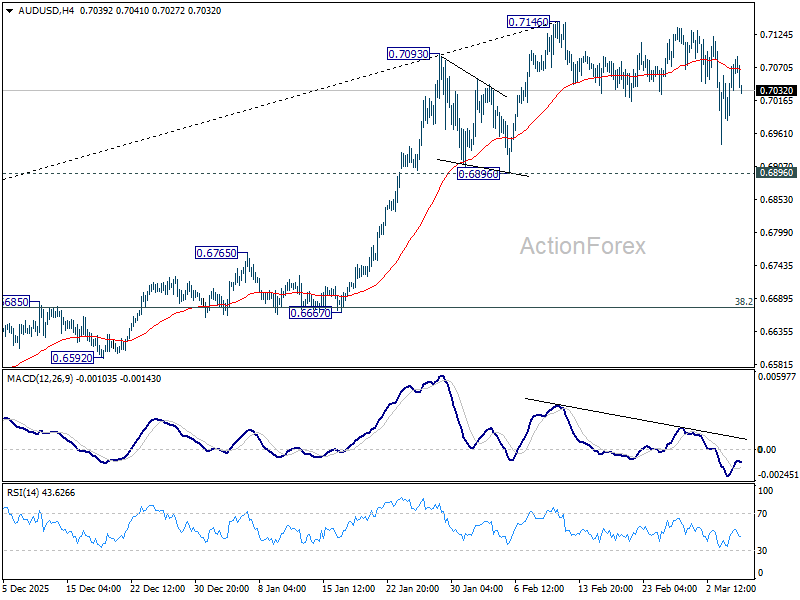
In the bigger picture, current development argues that rise from 0.5913 (2024 low) is reversing whole down trend from 0.8006 (2021 high). Further rally should be seen to 61.8% retracement of 0.8006 to 0.5913 at 0.7206. This will remain the favored case as long as 0.6706 resistance turned support holds, even in case of deep pullback.
USD/CAD Daily Outlook
Daily Pivots: (S1) 1.3613; (P) 1.3657; (R1) 1.3686; More...
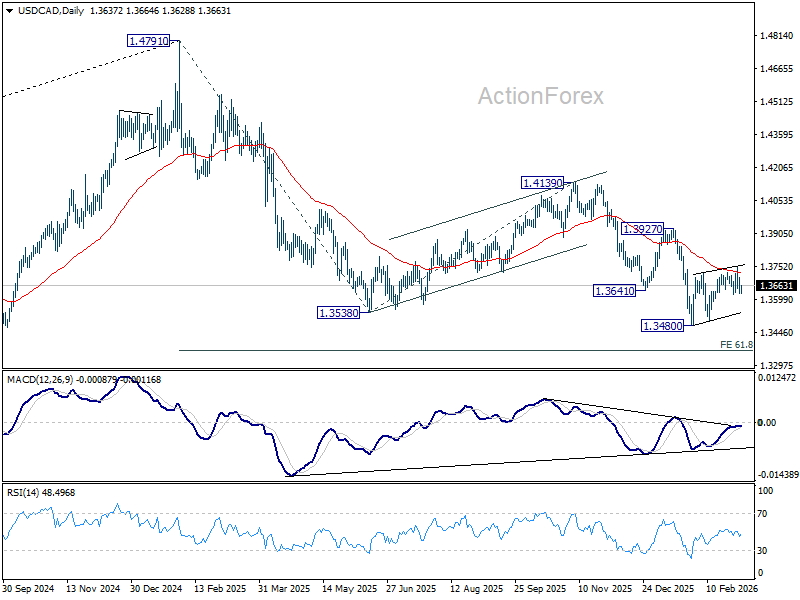
Intraday bias in USD/CAD remains neutral for the moment, and outlook is unchanged. Strong resistance is still expected from 55 D EMA (now at 1.3721) to limit upside to complete the consolidation pattern from 1.3480. Below 1.3624 minor support will bring retest of 1.3480 low first. However, decisive break of 55 D EMA will bring stronger rebound to 1.3927 resistance instead.
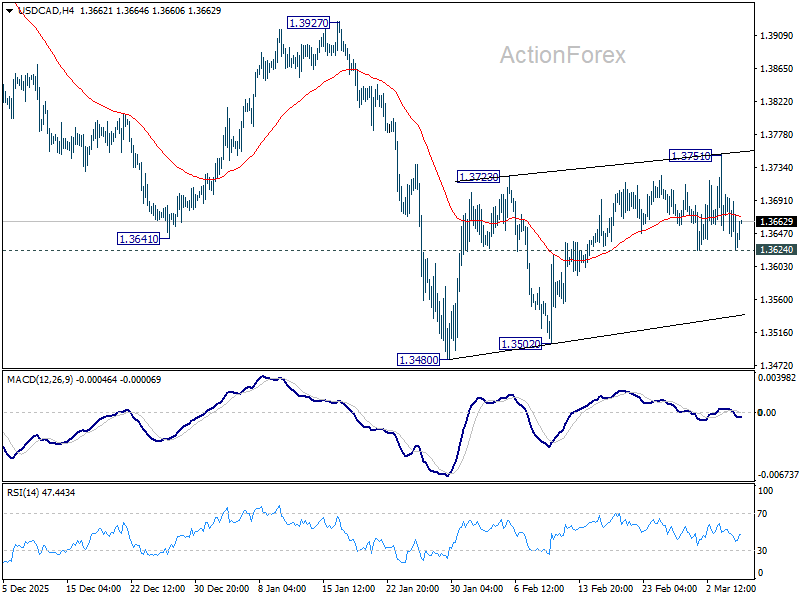
In the bigger picture, price actions from 1.4791 are seen as a corrective pattern to the whole up trend from 1.2005 (2021 low). Deeper fall could be seen as the pattern extends, to 61.8% retracement of 1.2005 to 1.4791 at 1.3069. For now, medium term outlook will be neutral at best, until there are signs that the correction has completed, or that a bearish trend reversal is confirmed.
From Panic to Repricing: Markets Adjust to New Geopolitical Reality
Global markets entered a transitional phase as investors moved from outright panic toward cautious observation. After several sessions of heavy selling triggered by the escalation of Middle East conflicts, equities staged a meaningful relief rally during the Asian session. The rebound largely followed the pattern seen on Wall Street overnight, where U.S. equities managed a late-session recovery after earlier losses.
South Korea’s Kospi led the rebound, surging more than 10% after suffering its worst single-day collapse on record the previous session, when it plunged roughly 12%. Japan’s Nikkei also joined the recovery, climbing more than 2% as sentiment improved across regional markets. Despite the strong rebound, the move should not yet be interpreted as a definitive bullish turn. Instead, it reflects a classic relief rally after a period of panic-driven liquidation, as markets transition from shock toward a more measured assessment of the evolving geopolitical situation.
Investors appear to be gradually accepting that the Middle East conflict may not be resolved quickly. Rather than focusing on worst-case scenarios, markets are beginning to price in a baseline expectation that tensions could persist for some time. Paradoxically, this shift from uncertainty to a more defined outlook can stabilize markets. While prolonged conflict implies higher energy prices and potential supply chain disruptions, having a clearer framework allows investors to evaluate risks more systematically.
Adding to the improved tone were reports suggesting possible diplomatic backchannels between the United States and Iran. Although a formal ceasefire remains far from certain, even the suggestion that negotiations might be taking place has helped calm market nerves.
Nevertheless, the energy market continues to signal that the geopolitical problem is far from resolved. WTI crude remains elevated near the 78 level, reflecting the persistent war premium embedded in oil prices. For now, the key threshold appears to be the psychological 80 level. As long as oil prices remain contained below that mark, investors may interpret the situation as manageable rather than the start of a broader global energy crisis.
Sentiment has also been supported by solid economic data. In particular, February’s strong ISM Services reading suggests the U.S. economy may be regaining momentum at the start of the year, reinforcing the narrative of continued economic resilience. While stronger data reduces the likelihood of near-term Fed rate cuts, markets appear comfortable with that trade-off. Investors are viewing robust growth as a sign that the economy can withstand higher interest rates for longer.
Currency markets reflect this cautious stabilization. Dollar remains the strongest performer of the week, followed by Loonie. At the other end of the spectrum, Euro, Swiss Franc, and New Kiwi lag behind, while Sterling and the Aussie sit near the middle of the performance table. Overall, FX markets indicate that conditions are no longer deteriorating, but they are not yet signaling a clear risk-on environment.
In Asia, at the time of writing, Nikkei is up 2.33%. Hong Kong HSI is up 1.02%. China Shanghai SSE is up 0.97%. Singapore Strait Times is up 0.81%. Japan 10-year JGB yield is up 0.043 at 2.161. Overnight, DOW rose 0.49%. S&P 500 rose 0.78%. NASDAQ rose 1.29%. 10-year yield rose 0.024 to 4.080.
China’s new growth target reflects strategic economic transition
Chinese Premier Li Qiang unveiled Beijing’s economic priorities for the year during the annual government work report at the National People's Congress, setting the country’s GDP growth target at 4.5% to 5%. The range represents a slight step down from the “around 5%” goal used in the past three years.
The introduction of a target range rather than a single figure signals a more flexible policy approach. By allowing growth to fluctuate between 4.5% and 5%, policymakers are granting themselves greater room to manage domestic challenges without the pressure of hitting a rigid numerical target.
Those challenges remain significant. China’s economy continues to grapple with a prolonged property sector downturn, persistent industrial overcapacity, and uneven domestic demand. Against that backdrop, the leadership appears increasingly focused on stability rather than aggressive expansion.
The new target also highlights Beijing’s strategic shift toward “high-quality” growth. Instead of pursuing rapid expansion through debt-fueled infrastructure or property stimulus, policymakers are emphasizing technology development, advanced manufacturing, and consumption as the core engines of growth.
Other policy targets announced in the report reinforce this balanced approach. Inflation is projected to run around 2%, reflecting authorities’ efforts to guard against deflation risks. The unemployment rate is expected to remain below 5.5%, while the fiscal deficit is set at 4% of GDP, suggesting a somewhat more proactive fiscal stance to support economic activity.
Despite the significance of the policy signals, market reaction was relatively muted. Hong Kong equities showed little immediate response to the announcement, with trading largely influenced by global risk sentiment rather than domestic policy developments. The rebound in the Hang Seng Index during the session appeared to follow the stabilization seen in US markets overnight after the steep selloff earlier in the week triggered by escalating tensions in the Middle East.
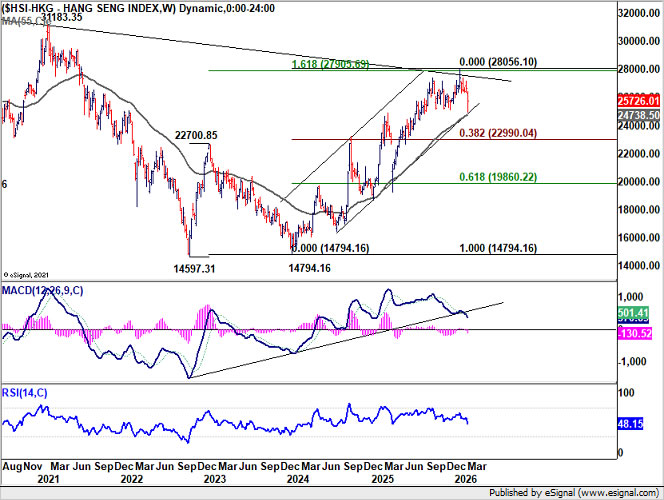
Technically, however, risks of a deeper medium-term correction in Hong Kong equities are building. The HSI recently faced rejection near the 28,000 resistance zone, where a multi-year downtrend line converges with a 161.8% projection level near 161.8% projection of 14,597 to 22,700 from 14,794, at 27905.
The index is currently attempting to hold support around the rising channel floor and the 55 W EMA near 24,738. However, decisive break below that region could open the way for a pullback to 38.2% retracement of 14,7946 to 28,056 at 22,990 at least.
Fed’s Beige Book: Employment stable, price growth seen slowing ahead
The Fed’s latest Beige Book survey showed the US economy expanding at a modest pace, though growth was uneven across regions. Overall activity increased at a “slight to moderate pace” in seven of the twelve Districts, while five districts reported flat or declining conditions, up from four in the previous report.
Consumer spending rose only "slightly" overall, with some districts reporting continued weakness. Several regions noted that sales were restrained by economic uncertainty, greater price sensitivity among consumers, and reduced spending by lower-income households. Employment conditions were broadly stable, with seven districts reporting no meaningful change in hiring.
Manufacturing activity showed somewhat stronger momentum. Eight districts reported growth in factory output, with contacts citing rising new orders and stronger demand linked to data center construction and related energy infrastructure investments.
Meanwhile, price pressures continued to build moderately, driven by rising costs for insurance, utilities, energy and raw materials. Tariffs were cited by nine districts as contributing to higher input costs, although many firms said they were reluctant to fully pass these increases on to customers due to heightened price sensitivity. On balance, firms expected prices to rise at a "somewhat slower pace" in the near term.
USD/CAD Daily Outlook
Daily Pivots: (S1) 1.3613; (P) 1.3657; (R1) 1.3686; More...
Intraday bias in USD/CAD remains neutral for the moment, and outlook is unchanged. Strong resistance is still expected from 55 D EMA (now at 1.3721) to limit upside to complete the consolidation pattern from 1.3480. Below 1.3624 minor support will bring retest of 1.3480 low first. However, decisive break of 55 D EMA will bring stronger rebound to 1.3927 resistance instead.
In the bigger picture, price actions from 1.4791 are seen as a corrective pattern to the whole up trend from 1.2005 (2021 low). Deeper fall could be seen as the pattern extends, to 61.8% retracement of 1.2005 to 1.4791 at 1.3069. For now, medium term outlook will be neutral at best, until there are signs that the correction has completed, or that a bearish trend reversal is confirmed.
WTI Crude Oil Rally Gains Steam, Traders Eye Fresh Highs
Key Highlights
- WTI Crude Oil prices started a strong increase above $72.00.
- A key bullish trend line is forming with support at $74.65 on the 4-hour chart of XTI/USD.
- Gold is now facing resistance near $5,320 and $5,350.
- EUR/USD took a major hit and declined below 1.1650.
WTI Crude Oil Price Technical Analysis
WTI Crude Oil prices started a steady increase above $70.00 against the US Dollar. The price settled above $72.50 to enter a positive zone.
Looking at the 4-hour chart of XTI/USD, the price cleared the $75.00 resistance, the 100 simple moving average (red, 4-hour), and the 200 simple moving average (green, 4-hour). The price even spiked above $77.50.
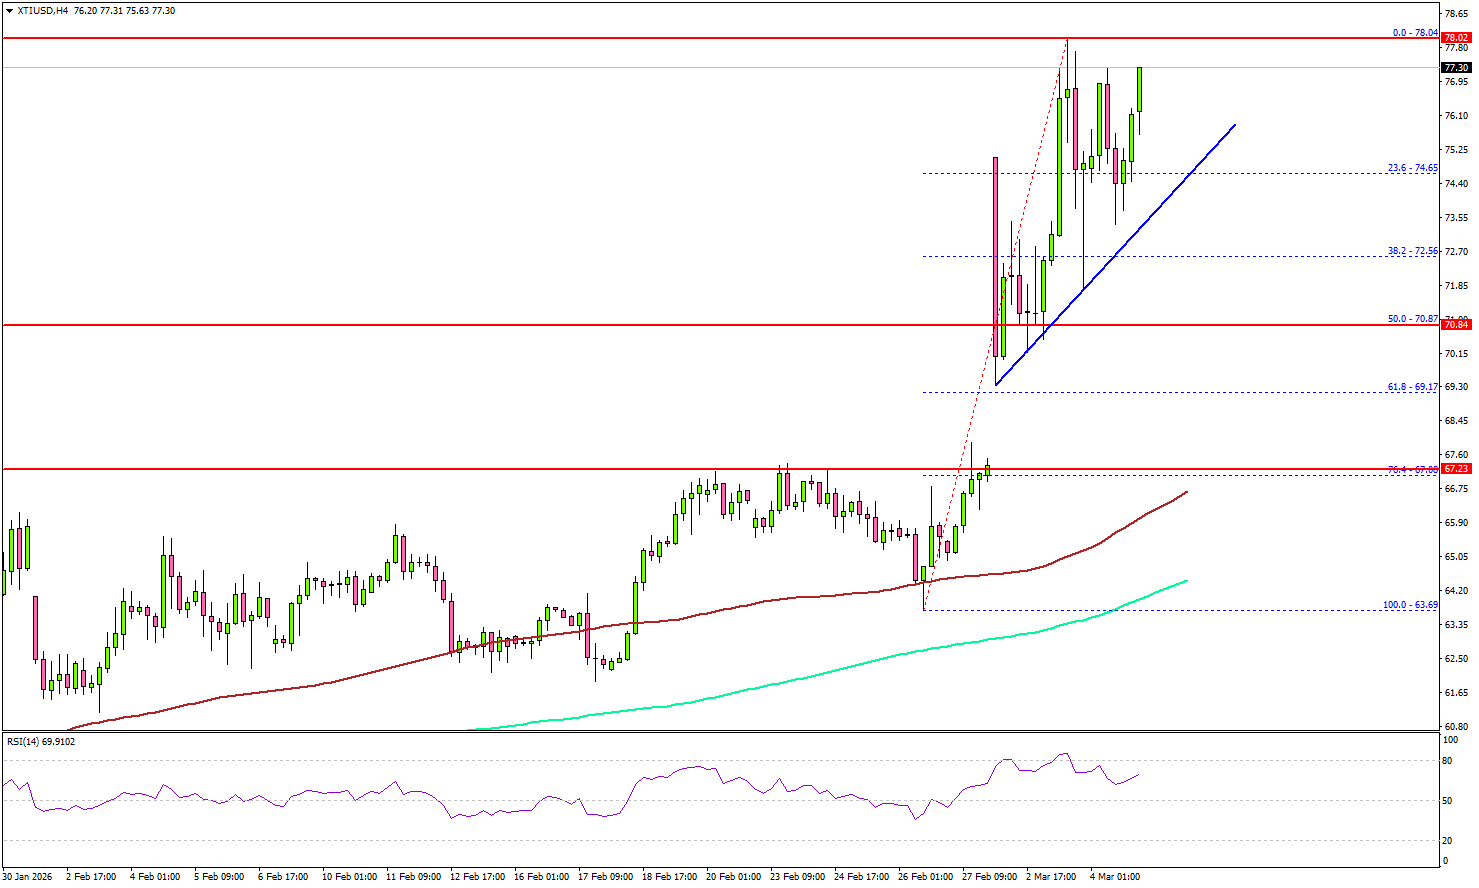
A high was formed at $78.04, and the price is still aiming for more gains. On the upside, immediate resistance is near the $78.00 level. The first key hurdle for the bulls could be $78.80. A close above $78.80 might send Oil prices toward $80.00. Any more gains might call for a test of $82.00 in the near term.
On the downside, the first major support sits near the $75.00 zone. There is also a key bullish trend line forming with support at $74.65.
The next support could be $72.50, below which the price could dive and test $70.00. A daily close below $70.00 could open the doors for a larger decline. In the stated case, the bears might aim for a drop toward the 100 simple moving average (red, 4-hour) at $66.50.
Looking at Gold, the bulls remained in action, but the price seems to be facing strong resistance near the $5,320 level.
Economic Releases to Watch Today
- US Import Price Index for Jan 2026 (MoM) – Forecast +0.1%, versus +0.2% previous.
- US Initial Jobless Claims - Forecast 215K, versus 212K previous.
China’s new growth target reflects strategic economic transition
Chinese Premier Li Qiang unveiled Beijing’s economic priorities for the year during the annual government work report at the National People's Congress, setting the country’s GDP growth target at 4.5% to 5%. The range represents a slight step down from the “around 5%” goal used in the past three years.
The introduction of a target range rather than a single figure signals a more flexible policy approach. By allowing growth to fluctuate between 4.5% and 5%, policymakers are granting themselves greater room to manage domestic challenges without the pressure of hitting a rigid numerical target.
Those challenges remain significant. China’s economy continues to grapple with a prolonged property sector downturn, persistent industrial overcapacity, and uneven domestic demand. Against that backdrop, the leadership appears increasingly focused on stability rather than aggressive expansion.
The new target also highlights Beijing’s strategic shift toward “high-quality” growth. Instead of pursuing rapid expansion through debt-fueled infrastructure or property stimulus, policymakers are emphasizing technology development, advanced manufacturing, and consumption as the core engines of growth.
Other policy targets announced in the report reinforce this balanced approach. Inflation is projected to run around 2%, reflecting authorities’ efforts to guard against deflation risks. The unemployment rate is expected to remain below 5.5%, while the fiscal deficit is set at 4% of GDP, suggesting a somewhat more proactive fiscal stance to support economic activity.
Despite the significance of the policy signals, market reaction was relatively muted. Hong Kong equities showed little immediate response to the announcement, with trading largely influenced by global risk sentiment rather than domestic policy developments. The rebound in the Hang Seng Index during the session appeared to follow the stabilization seen in US markets overnight after the steep selloff earlier in the week triggered by escalating tensions in the Middle East.
Technically, however, risks of a deeper medium-term correction in Hong Kong equities are building. The HSI recently faced rejection near the 28,000 resistance zone, where a multi-year downtrend line converges with a 161.8% projection level near 161.8% projection of 14,597 to 22,700 from 14,794, at 27905.
The index is currently attempting to hold support around the rising channel floor and the 55 W EMA near 24,738. However, decisive break below that region could open the way for a pullback to 38.2% retracement of 14,7946 to 28,056 at 22,990 at least.
Fed’s Beige Book: Employment stable, price growth seen slowing ahead
The Fed’s latest Beige Book survey showed the US economy expanding at a modest pace, though growth was uneven across regions. Overall activity increased at a “slight to moderate pace” in seven of the twelve Districts, while five districts reported flat or declining conditions, up from four in the previous report.
Consumer spending rose only "slightly" overall, with some districts reporting continued weakness. Several regions noted that sales were restrained by economic uncertainty, greater price sensitivity among consumers, and reduced spending by lower-income households. Employment conditions were broadly stable, with seven districts reporting no meaningful change in hiring.
Manufacturing activity showed somewhat stronger momentum. Eight districts reported growth in factory output, with contacts citing rising new orders and stronger demand linked to data center construction and related energy infrastructure investments.
Meanwhile, price pressures continued to build moderately, driven by rising costs for insurance, utilities, energy and raw materials. Tariffs were cited by nine districts as contributing to higher input costs, although many firms said they were reluctant to fully pass these increases on to customers due to heightened price sensitivity. On balance, firms expected prices to rise at a "somewhat slower pace" in the near term.
NFP Preview: Jobs to Drive Volatility Amid “Operation Epic Fury” & Implications for DXY, Dow Jones
- Market expectations call for a significant deceleration in job growth (58k–65k), with sticky Average Hourly Earnings (+0.4% m/m) being the "danger zone" for potential stagflation.
- A strong NFP (> 100k) could see DXY rise toward 100.40 as rate cuts are priced out; a weak NFP (< 50k) could push DXY down toward 98.00 on bets of a Fed pivot.
- Dow Jones (DJIA) Implications, a moderate, "Goldilocks" number (70k–90k) would support equities, while a "Stagflation" shock (low jobs, high wages) or negative NFP would likely trigger a fresh sell-off.
Markets are gearing up for the March NFP release and yet focus ahead of the meeting is largely focused on the situation in the Middle East. Despite this, the upcoming Non-Farm Payrolls (NFP) report remains the fundamental "north star" for the Federal Reserve.
Here is your preview for the March 6 jobs report and its expected impact on the markets.
The Macro Backdrop: War and AI reality checks
The market narrative has shifted violently this week. The "AI honeymoon" period of early 2026 met a jarring reality as President Trump signaled that "Operation Epic Fury", the joint US-Israeli military campaign against Iran could be a protracted engagement.
With the Strait of Hormuz facing potential blockades and Brent crude surging into the $80s, the "low-hire, low-fire" labor regime is being tested by a new inflation shock channel: energy.
The immediate focus for Friday is whether the cooling labor market will provide the Fed enough cover to cut rates despite these rising inflationary risks.
NFP Consensus and Key Data Points
Market expectations for the data (to be released March 6) suggest a significant deceleration from the previous month’s surprise strength:
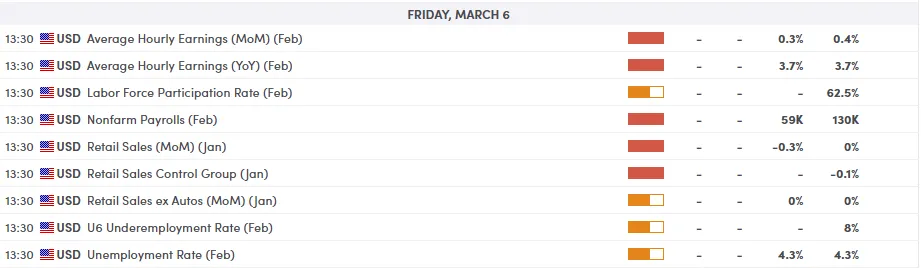
- NFP Headline Forecast: 58k – 65k (Down from January’s 130k).
- Unemployment Rate: Expected to hold steady or edge up to 4.4%.
- Average Hourly Earnings: Forecasted at +0.4% m/m. This is the "danger zone" for the Fed; sticky wage growth combined with high oil prices creates a stagflationary headache.
- The "ADP Bellwether": Wednesday's ADP private payrolls came in at 63k, slightly beating the 50k estimate. However, a downward revision to the previous month’s figures dampened any bullish dollar sentiment, setting a cautious stage for Friday.
For all market-moving economic releases and events, see the MarketPulse Economic Calendar. (click to enlarge)
Implications for the US Dollar Index (DXY)
The DXY has been oscillating near the 99.50 resistance level, buoyed by safe-haven flows due to the Iran conflict.
- Bullish Scenario (NFP > 100k): A surprise beat would likely be interpreted as a sign of economic resilience. Traders would price out a March rate cut, potentially propelling the DXY toward the 100.40 barrier. In a "war economy," a strong labor market allows the Fed to keep rates high to fight energy-driven inflation.
- Bearish Scenario (NFP < 50k): A significant miss would validate the "hard landing" fears. The DXY could retreat toward the 98.00 support level as markets bet the Fed will be forced to pivot to support the economy, despite the geopolitical noise.
US Dollar Index (DXY) Daily Chart, March 4, 2026
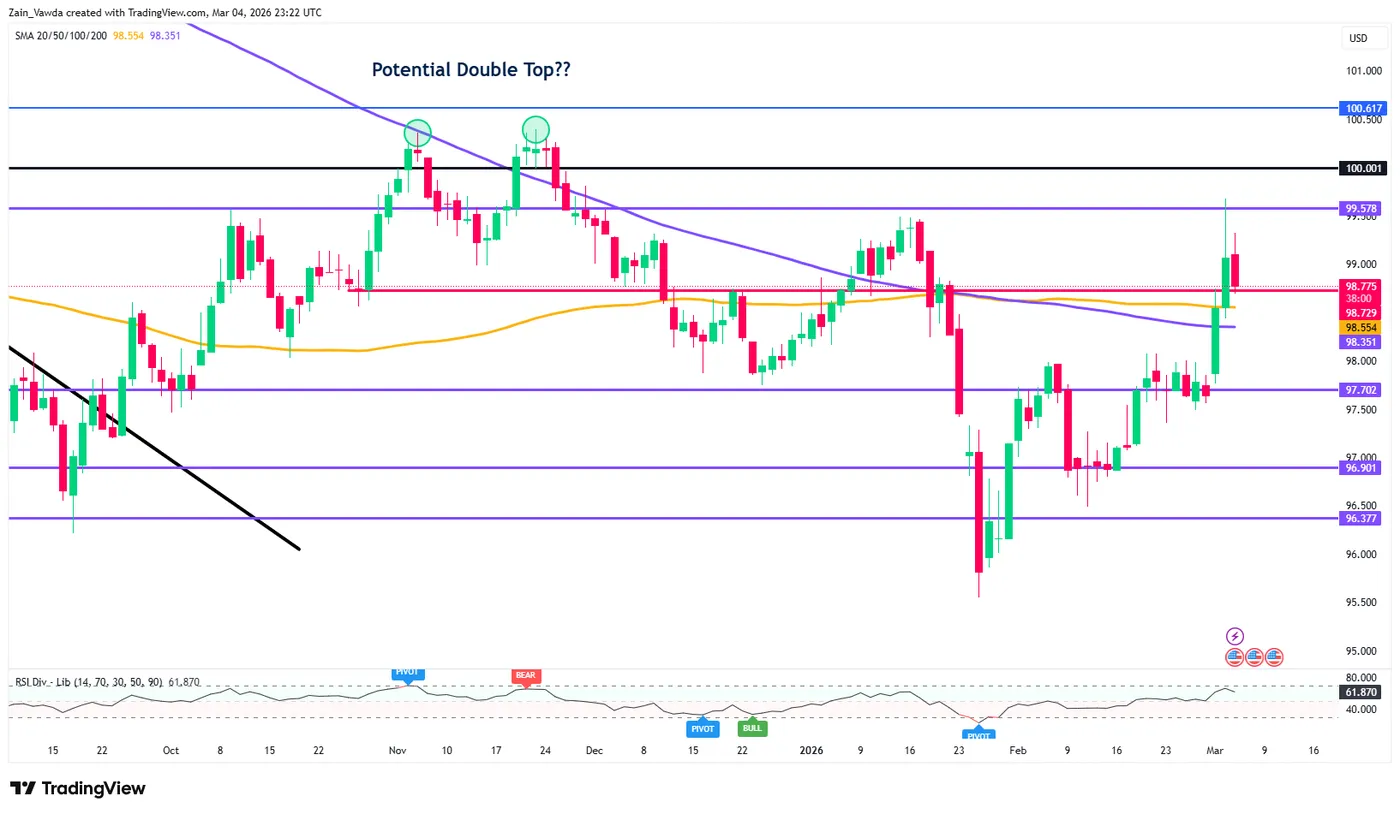
Source: TradingView (click to enlarge)
Implications for the Dow Jones (DJIA)
The Dow has recently endured a "tailspin," including a 1,200-point intraday slide earlier this week. It currently hovers around the 48,500 mark.
- The "Goldilocks" Outcome (70k – 90k): Equities would likely cheer a moderate number. It would suggest the economy is cooling enough to justify future easing without signaling a total collapse in consumer demand. This could see the Dow reclaim the 49,000 handle.
- The "Stagflation" Shock (Low Jobs + High Wages): If payrolls miss (under 50k) but wage growth remains hot (+0.5% or higher), the Dow could face a fresh sell-off. This scenario traps the Fed: they cannot cut rates to help the economy because wages and oil are fueling inflation.
- The "Recession" Fear (Negative NFP): Any print near zero or negative would likely trigger a flight from equities into bonds and gold, as the narrative shifts from "geopolitical volatility" to "fundamental economic decay."
Dow Jones Daily Chart, March 4, 2026
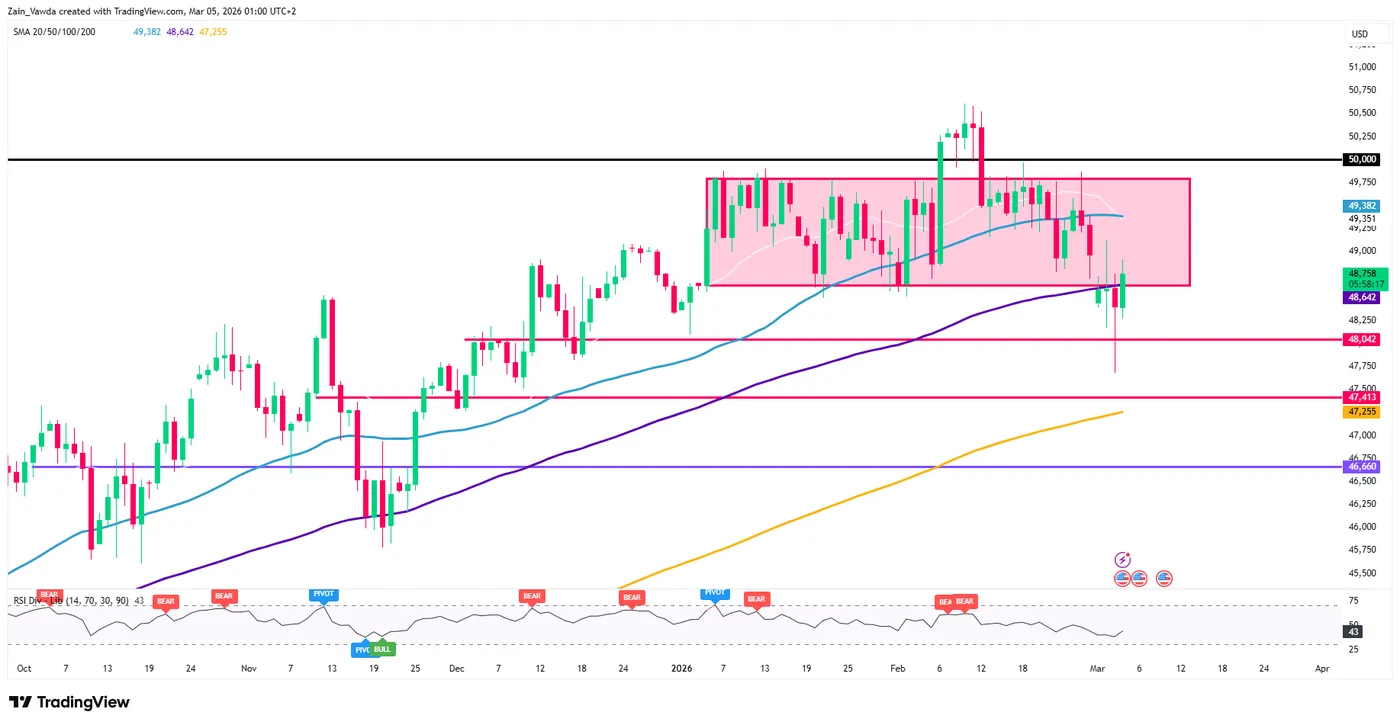
Source: TradingView (click to enlarge)
The market will try to determine if the American worker is strong enough to withstand both the "Epic Fury" of geopolitics and the quiet encroachment of AI on traditional roles.
Gold (XAU/USD) Marks a Double Top Despite Iran Conflict – Below $5,000 Soon?
Gold bulls have long been waiting for geopolitical troubles to justify the metal's record prices.
However, markets often play rough games with high expectations, as we recently saw with Nvidia and Microsoft earnings. This aligns with the adage "Buy the rumor, sell the news."
Similar profit-taking moves have previously occurred in silver, platinum, and palladium, so investors might have thought gold would be exempt, given its reputation as a true safe-haven.
However, the recent unexpected market behavior in relation to geopolitical conflict is surprising. Despite ongoing tensions and heavy military activity in the Middle East, stocks actually rallied after Trump assured the protection of the Strait of Hormuz.
Risk assets are decidedly rebounding, with cryptocurrencies surging to monthly highs as well as global Stock Markets; This proves how unusual these war flows have been.
So, why are safe havens selling off?
The US Department of Defense has certainly demonstrated its capabilities to rapidly damage key Iranian positions, alongside the Israeli Air Force.
Investors fear a prolonged conflict in the Middle East, so the idea of shorter operations is providing a sense of relief, as reflected in the market.
Investors also just received yet another report of US economic strength with another beat in Services PMI (56.1 vs 53.5 estimates), along with firming Private ADP Employment. Difficult to justify metal-boosting rate cuts with such solid data.
Friday will provide more clarity on that aspect with the monthly NFP data for February; Expect this one to rock Market expectations again!
Let’s conduct a multi-timeframe analysis of gold, as its recent price action has formed a double top. Will this signal the start of a real downtrend?
Gold (XAU/USD) Multi-timeframe analysis
Weekly Chart
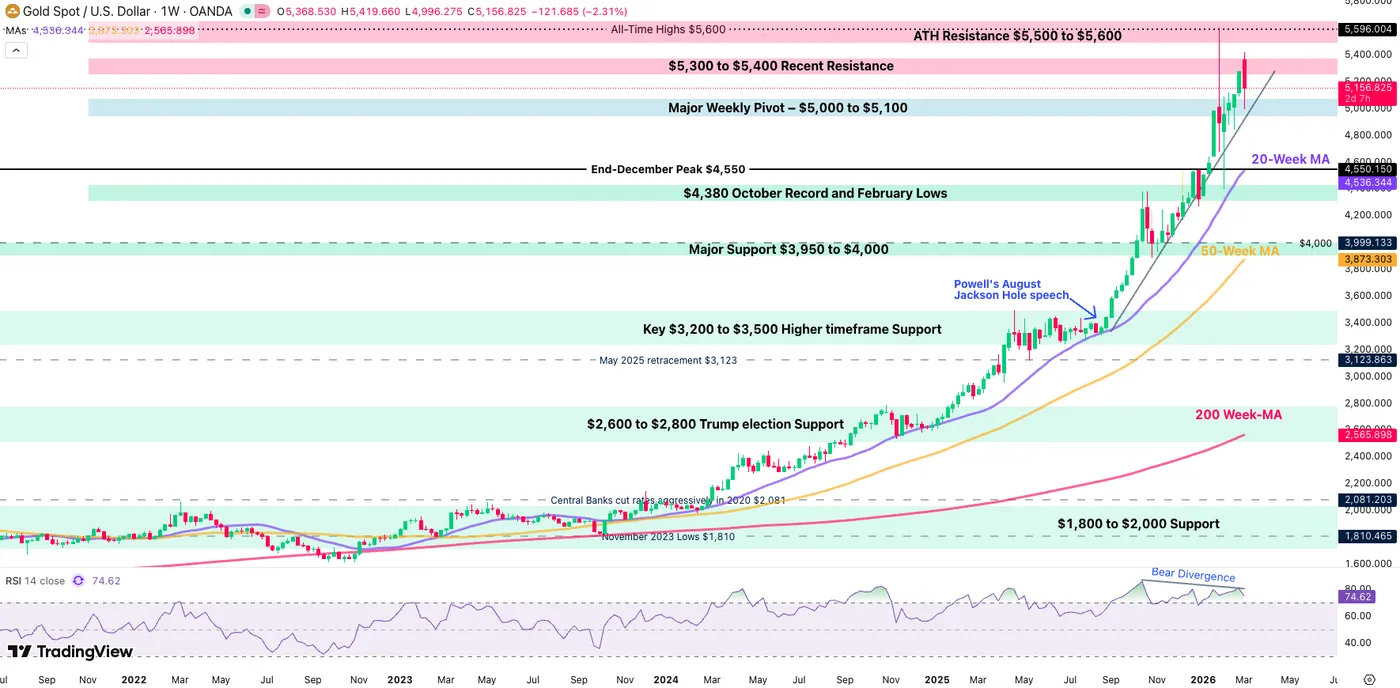
Gold Weekly Chart, March 4, 2026, Source: TradingView
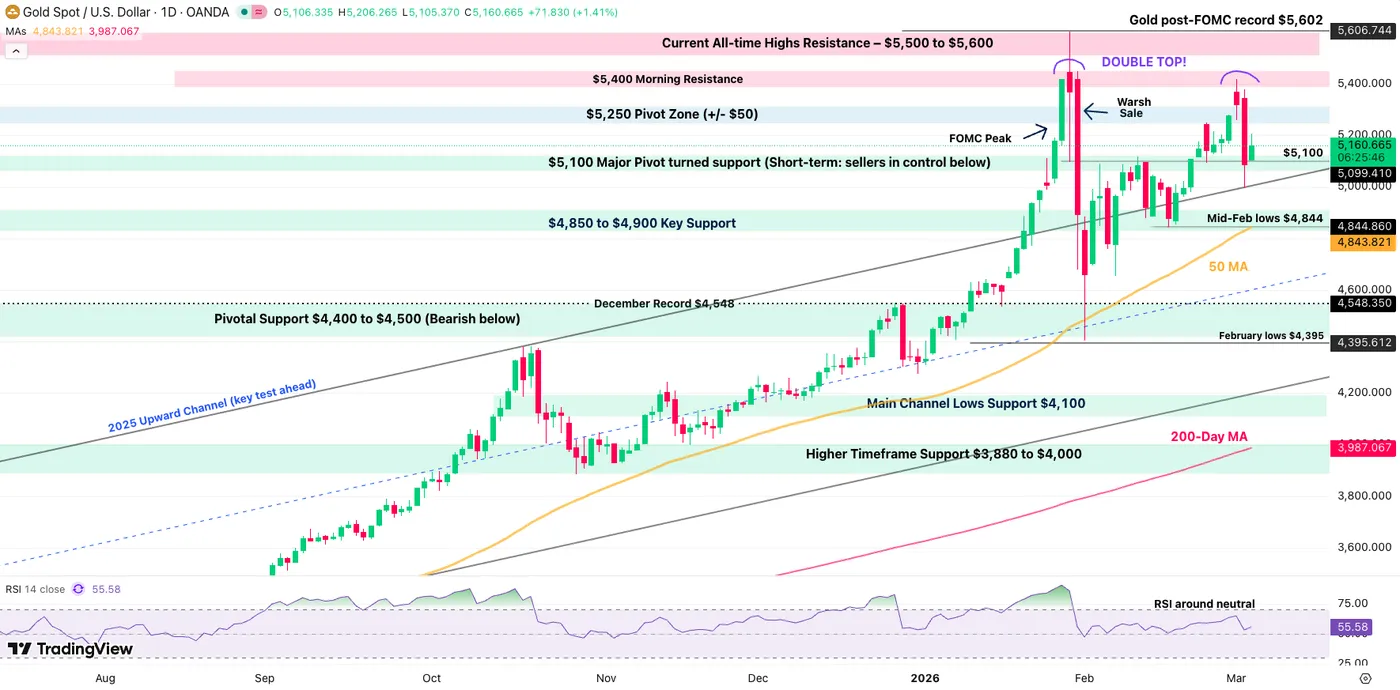
Gold is now facing high-importance hurdles ahead.
After failing to regain its January $5,600 top despite the fundamental shift, sellers could now take the upper hand. This could particularly be the case when looking at the Weekly RSI forming a bearish divergence.
However, a counter-argument could maintain demand for Gold – Remaining above its Key weekly pivot zone, particularly above $5,100, proves that the action can still remain in balance on the higher timeframe.
Any break lower will also see streaks of support, with the most immediate major support a the December highs around $4,550.
Gold Daily Chart
Gold Daily Chart, March 4, 2026, Source: TradingView
Gold sends out a more gloomy picture on the Daily timeframe, with the two recent bearish candles located at relative spikes forming a double-top.
While today's small rebound shows hesitancy, looking forward, as long as bulls can't manage to overtake the $5,379 highs from yesterday, technicals point to downside ahead.
Crossing back below $5,100 would allow sellers to re-take control of the short-term action, hinting at a retest of the mid-Feb lows ($4,844).
Breaking this level would then mark an official re-entry within the 2025 bull channel – $4,200 is its current lower bound (however it remains far from now).
Levels of interest for Gold trading:
Support Levels:
- $5,100 Major Pivot turned support (Short-term: sellers in control below – Testing)
- $4,850 to $4,900 Key Support (Mid-Feb Lows)
- Pivotal Support and December record $4,400 to $4,500 (Bearish below)
- Channel lows $4,200
Resistance Levels:
- $5,250 Pivot Zone (+/- $50)
- $5,400 Wartime Resistance
- Current All-time Highs Resistance – $5,500 to $5,600
Gold 4H Chart
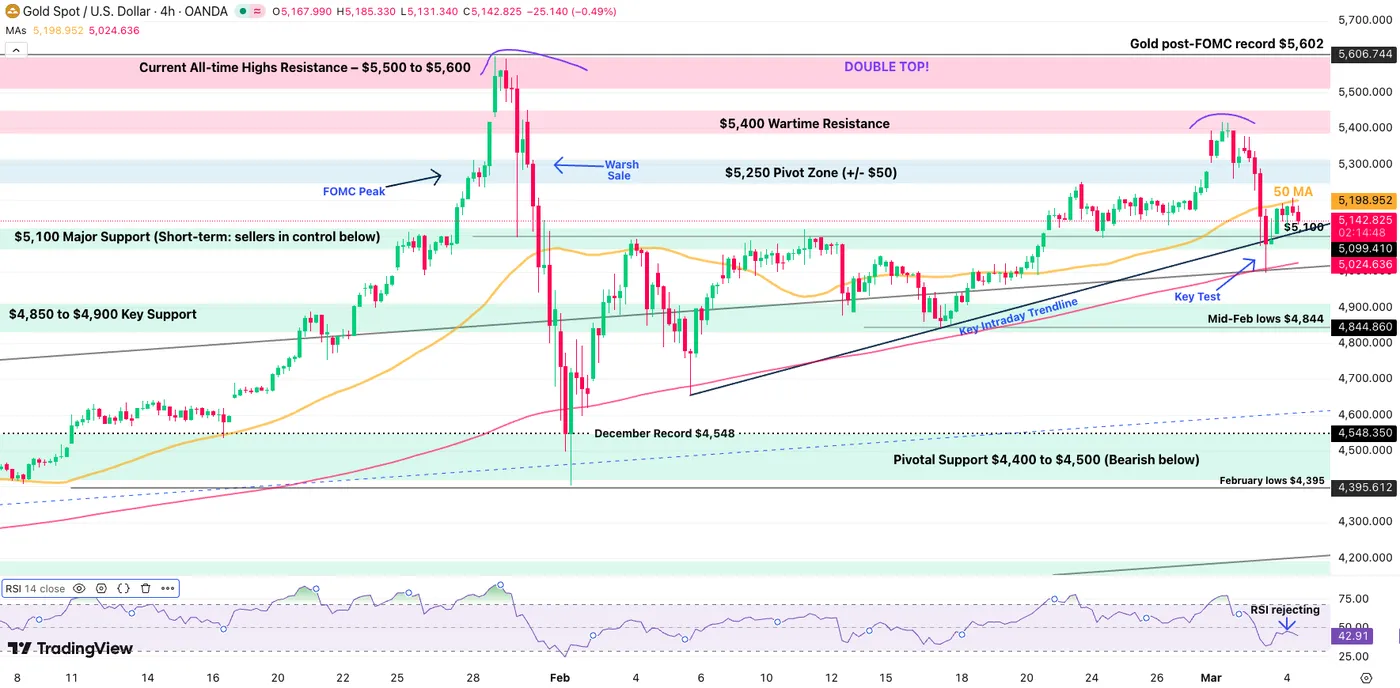
Gold 4H Chart, March 4, 2026, Source: TradingView
Gold is now rejecting its intraday key 50-period moving average acting as resistance.
A key test of the upward trendline will provide a last chance for bulls to re-take the short-term hand, before the double top materializes into a more consequential correction.
Watch for a break and 4H close below $5,100.
Safe Trades!
Fearless Markets are exploding higher – Dow Jones & US Index Outlook
- US Stock Benchmarks absolutely smash previous days selling with huge rallies today.
- Since Trump's security pledge in the Middle East, Stocks have been exploding.
- Exploring Technical Levels for the Dow Jones, Nasdaq and S&P 500.
Global Stock Indexes remain undefeated, and no war nor Capital Market trouble seems to be providing damage in their ever-resilient rise.
No analyst or traders could have predicted such a resilient behavior from Investors amid the ongoing heavy War currently ongoing in the Middle East.
US and Israeli armies are certainly striking rough blows to the Islamic regime's military capacities; Recent communication from both the US President and Secretary of War are reassuring Participants in the fact that the ongoing conflict has low probabilities of repeating mistakes seen in Iraq or Afghanistan: A prolonged and damaging war, without much to count for it.
As expressed in our week-opening analysis, two of the most anxiety-prone elements in this war are how long it takes, and how heavy of an impact it has on Oil prices.
For now, the length of the war is projected to be lasting around 4 to 5 weeks – this still has the potential to change, but current updates sound optimistic.
On Oil, the commodity has somewhat stabilized in the $72 to $75 range (WTI). Yes, ships are scared to pass through Strait of Hormuz but the outlook isn't so grim right now with multiple reports of a damaged Iranian Navy.
Any explosion in Oil prices or complication in operations has the potential to dampen mood significantly – Black Gold is certainly the most volatility-prone element of them both.
Another element helping Equities is this morning's streak of positive US data, including a strong beat on US Services PMIs and ADP private employment.
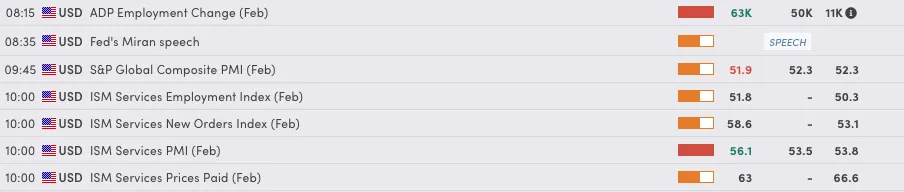
US Data this morning – MarketPulse Economic Calendar
This also tags along with strong rebounds in Global Stock Indexes, also starkly rebounding today with the Nikkei closing up 2% and European Benchmarks up about the same.
Let's spot if this move has the potential to last by diving into today’s mid-session charts and key trading levels for the major US indexes: the Dow Jones, Nasdaq, and S&P 500.
Current Session's Stock Heatmap
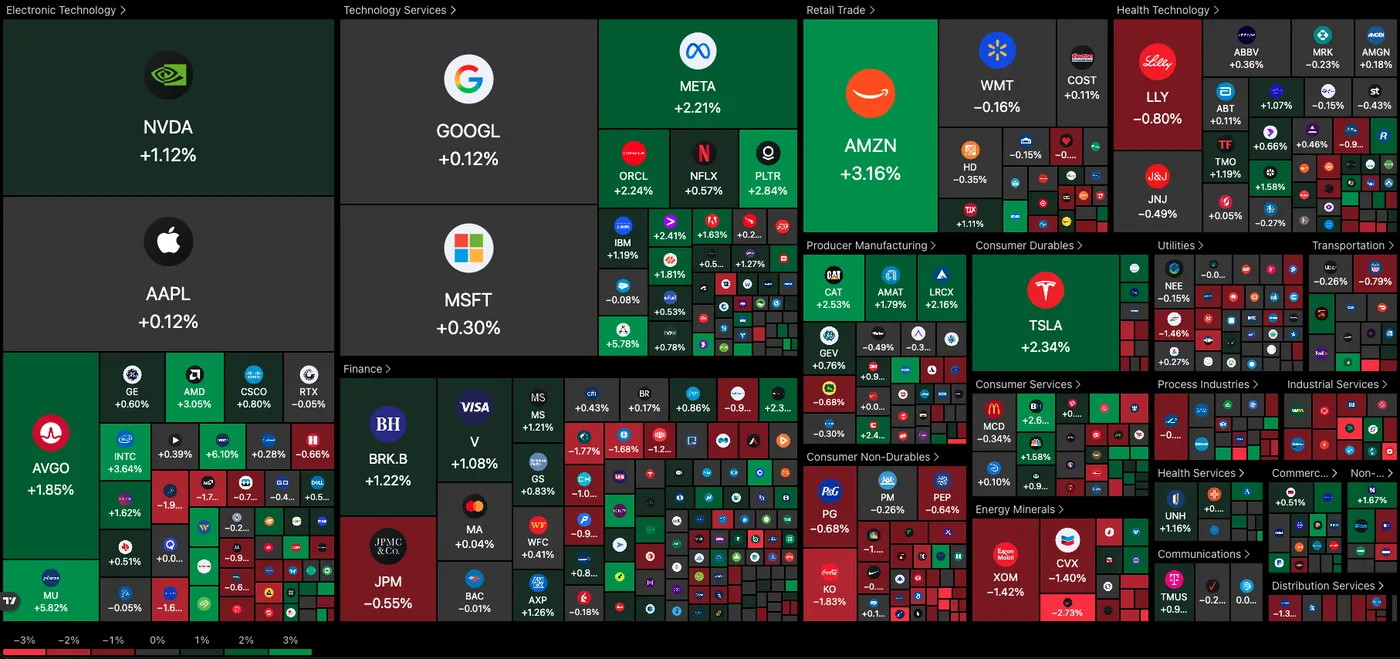
Current picture for the Stock Market (11:24 A.M. ET) – Source: TradingView – March 4, 2026
Defensive Blue Chips, traditionals and Energy Stocks are now seeing rejection as Wall Street turns a new rush towards Tech.
High-beta semiconductors and softwares are marking a decent recovery in the past week and leading Equities in their resilient run – They could indeed sustain less damage from any effect from a prolonged war; Actually, they would mostly benefit from high information flows and military need for technologies!
Dow Jones 4H Chart and Trading Levels
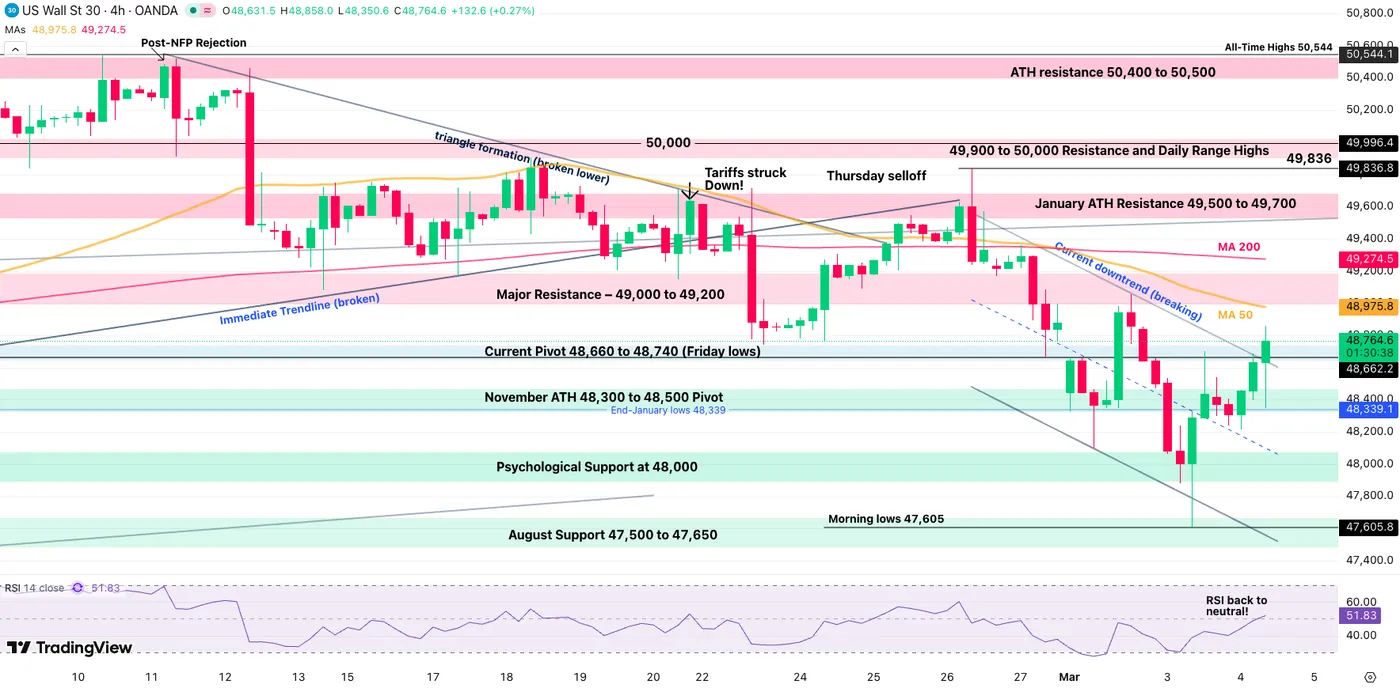
Dow Jones (CFD) 4H Chart – March 4, 2026 – Source: TradingView
The DJIA is now breaking out of its descending channel but will face key hurdles at the 49,000 resistance zone and its 4H 50-period Moving Average just below (48,975).
The morning rally is nothing short of impressive, but some profit-taking seems to be going through as traders look for quick-trades amid ongoing uncertainty – And that is certainly a way to protect trading accounts!
- Rejecting the 4H MA would mark a rough stall in the middle of the range, indicative of further potential downside ahead.
- Breaking back above however relaunches hopes for an all-time high run!
Dow Jones technical levels for trading:
Resistance Levels
- 4H 50-period MA – 48,975
- 49,000 to 49,250 Key psychological resistance
- January ATH Resistance 49,500 to 49,700
- Index All-Time highs 50,512
Support Levels
- November ATH 48,300 to 48,500 Morning Support
- Psychological Pivot at 48,000
- August Support 47,500 to 47,650
- 47,000 Next Main support
- 45,000 psychological level (Main Support on higher timeframe)
Nasdaq 4H Chart and Trading Levels
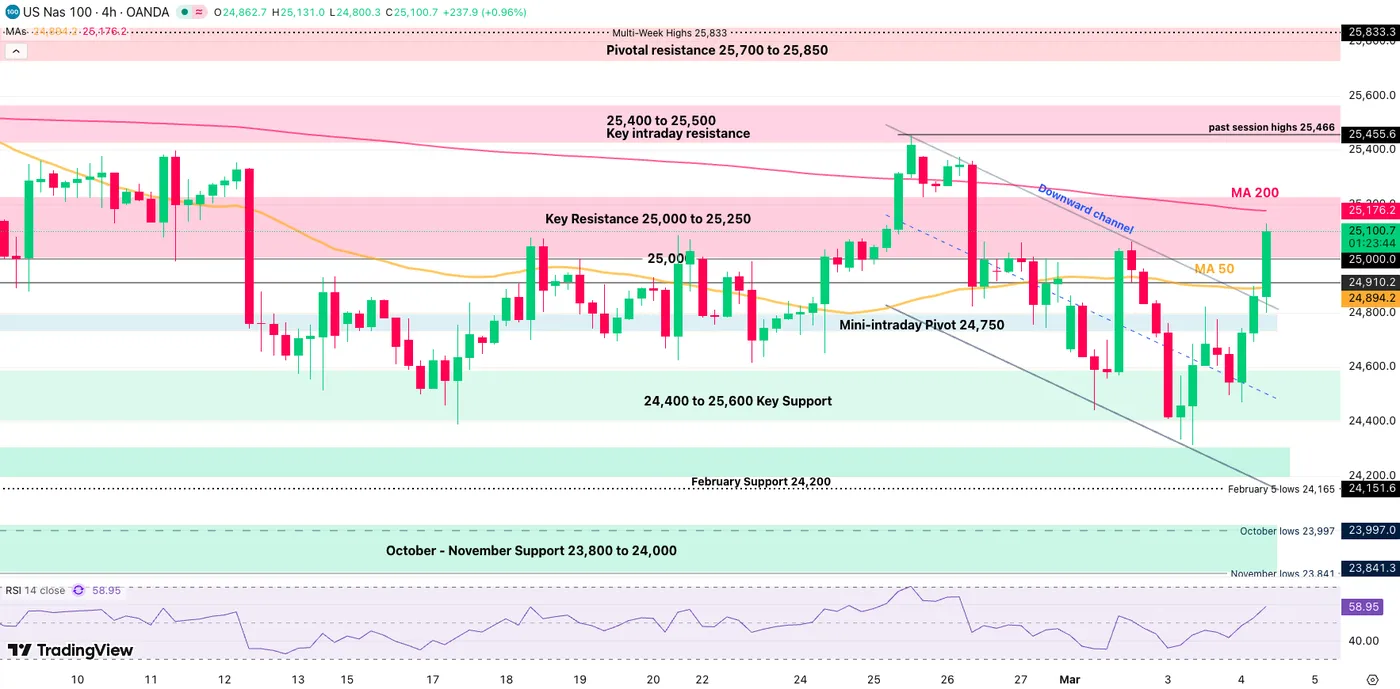
Nasdaq (CFD) 4H Chart – March 4, 2026 – Source: TradingView
Nasdaq is indeed flexing its muscles by rebounding back above the key 25,000 level and bulls are not letting the Index correct.
Breaking the 200-period MA (25,170) would confirm the breakout and should hint at a swift run towards 25,500 – This stands as long as sentiment remains positive.
Keep a close eye on the tech sector!
Nasdaq technical levels of interest:
Resistance Levels
- 4H 200-period MA 25,170
- Key Resistance 25,000 to 25,170 (testing)
- 25,400 to 25,500 Key intraday resistance
Support Levels
Mini-intraday Pivot 24,750
- 24,400 to 25,600 Key Support (Range Support)
- February Support 24,150 to 24,300 – Morning lows
- October - November Support 23,800 to 24,000
- Early 2025 ATH at 22,000 to 22,229 Support
S&P 500 4H Chart and Trading Levels
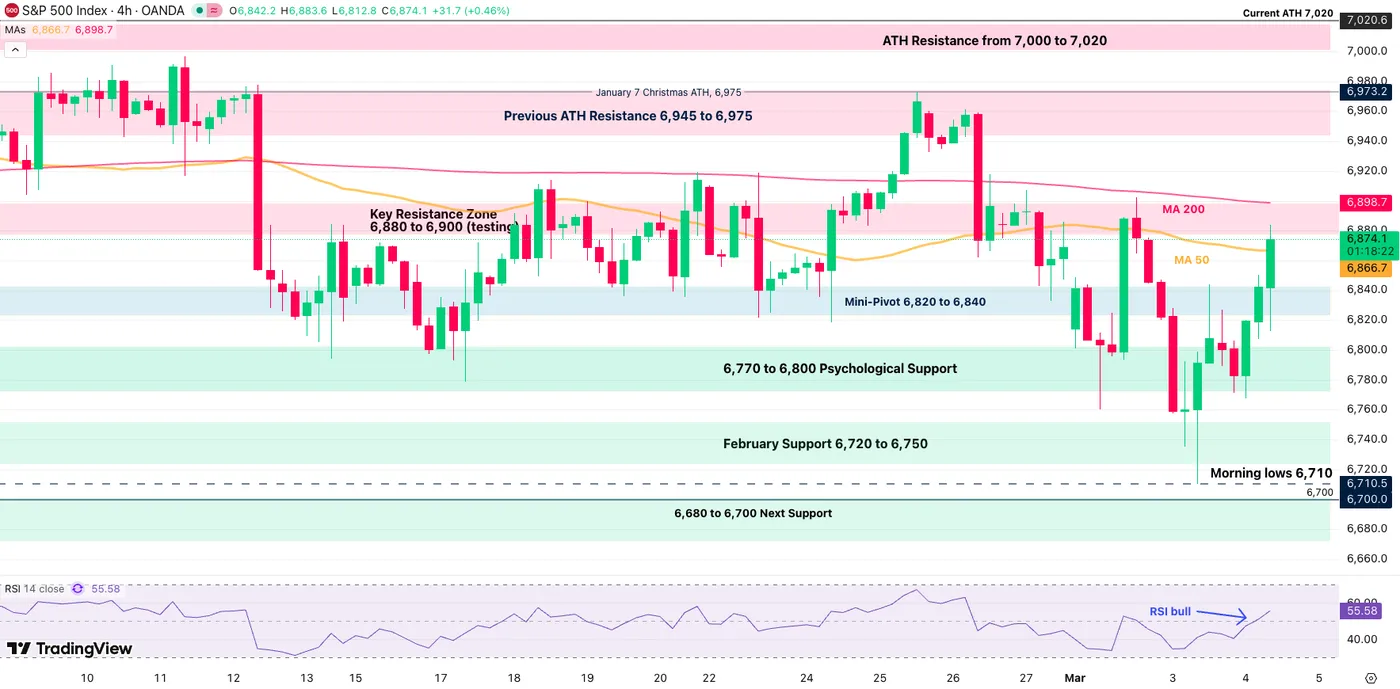
S&P 500 (CFD) 4H Chart – March 4, 2026 – Source: TradingView
The S&P 500 confirms its powerful range yet again, and will now face a strong test at the 6,900 Mid-Range resistance.
Closing back above would point to a quick test of the 6,950 resistance.
Rejecting it however could easily retest previous session's trough at 6,710.
S&P 500 technical levels of interest:
Resistance Levels
- Key Resistance Zone 6,880 to 6,900 (testing)
- Previous ATH Resistance 6,945 to 6,975
- Current ATH 7,020
- All-time High Resistance 7,000 to 7,020 (range highs)
Support Levels
- Mini-Pivot 6,820 to 6,840
- 6,770 to 6,800 Psychological Support
- Previous day lows 6,710
- February lows 6,710 to 6,730
- 6,680 to 6,700 Next Support
- 6,400 Major psychological support
Safe Trades and keep a close eye on the US-Iran developments!