Sample Category Title
EUR/USD Chart Analysis: Pair Trades Near Yearly Lows
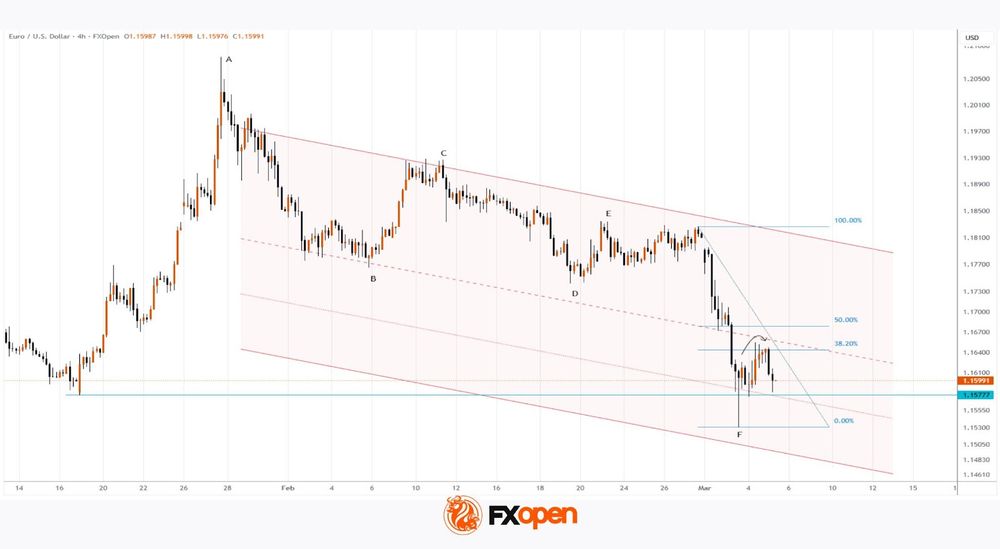
On 3 March, the EUR/USD pair fell below the January low (around 1.15777), establishing the lowest level of the year. As of today, 5 March, the chart shows signs of a continuation of bearish momentum.
On one hand, demand for the USD as a “safe-haven currency” remains elevated amid the ongoing military conflict in the Middle East.
On the other hand, the euro is under pressure because:
→ rising energy prices put the European Union at a disadvantage;
→ traders may be cautious ahead of today’s ECB news (Lagarde’s speech is scheduled for 20:00 GMT+3).
Technical Analysis of the EUR/USD Chart
On 19 February, we:
- → noted that bears held a certain advantage during February;
- → highlighted lower highs and lower lows at points A-B-C;
- → suggested a potential bearish scenario.
Since then, the downward movement has developed into a sequence A-B-C-D-E-F. Analysing the key patterns on the EUR/USD chart now allows us to construct a descending channel.
In this context, yesterday’s bearish reversal (indicated by the arrow) is noteworthy, as it occurred:
- → in the 0.382–0.5 Fibonacci zone, indicating a weak recovery;
- → below the channel median, which acted as resistance.
Considering the above, it is reasonable to state that bears remain in control. Forex traders should not rule out further declines in EUR/USD towards a new yearly low (and a test of the lower boundary of the channel).
However, the long lower shadow at point F suggests aggressive demand around the psychological level of 1.15000, and market sensitivity to Middle East news could rapidly change sentiment.
Trade over 50 forex markets 24 hours a day with FXOpen. Take advantage of low commissions, deep liquidity, and spreads from 0.0 pips (additional fees may apply). Open your FXOpen account now or learn more about trading forex with FXOpen.
This article represents the opinion of the Companies operating under the FXOpen brand only. It is not to be construed as an offer, solicitation, or recommendation with respect to products and services provided by the Companies operating under the FXOpen brand, nor is it to be considered financial advice.
ECB officials split between caution and baseline calm on war risks
ECB policymakers signaled caution today as they assessed the potential economic fallout from the escalating conflict involving Iran. While acknowledging the risk that higher energy prices could complicate the inflation outlook, officials indicated that the situation does not yet warrant a shift in monetary policy.
ECB Vice President Luis de Guindos said the bank’s "baseline" scenario assumes the conflict will prove "short-lived". However, he warned that a longer war could begin to influence inflation expectations, particularly if energy prices remain elevated for an extended period.
Finnish Governing Council member Olli Rehn took a more cautious stance, warning against assuming a quick resolution. He noted that the conflict had already had "quite some escalation", and could create a difficult macroeconomic combination of higher inflation and weaker growth across the Eurozone
At the same time, French Governing Councile member Francois Villeroy de Galhau emphasized that the current situation does not justify a rate hike. Speaking to French radio, the central bank will continue to monitor developments carefully and assess policy decisions on a meeting-by-meeting basis.
Chart Alert: DAX’s Dead Cat Bounce May Have Ended, Watch 24,000 Downside Trigger
Key takeaways
- European equities have weakened sharply, with the Euro STOXX 50 falling 6% over two days before a modest rebound, while the DAX remains down 4.3% since 27 February amid heightened geopolitical tensions.
- Ongoing conflict involving Iran and military actions authorised in the United States Senate risk prolonging Middle East energy disruptions, potentially raising energy costs for the European Union and weighing on regional equities.
- Technically, the DAX appears to be forming a bearish flag below 24,350, suggesting Wednesday’s rebound may be a “dead cat bounce”; a break below 24,000 could trigger further downside toward the 23,750–23,290 support zone.
European stock markets have underperformed against their US peers at the start of this week, from Monday, 2 March 2026, to Tuesday, 3 March 2026, where the Euro STOXX 50 plummeted by 6%, recording its worst 2-day decline since early April 2025, when US President Trump unveiled his global US reciprocal tariffs.
On Wednesday, 4 March, the European equities managed to stage a comeback due to “bargain hunting”. The German DAX managed to end Wednesday’s session with a gain of 1.7%, with a similar magnitude seen in the Euro STOXX 50.
DAX is still in the red despite Wednesday’s rally
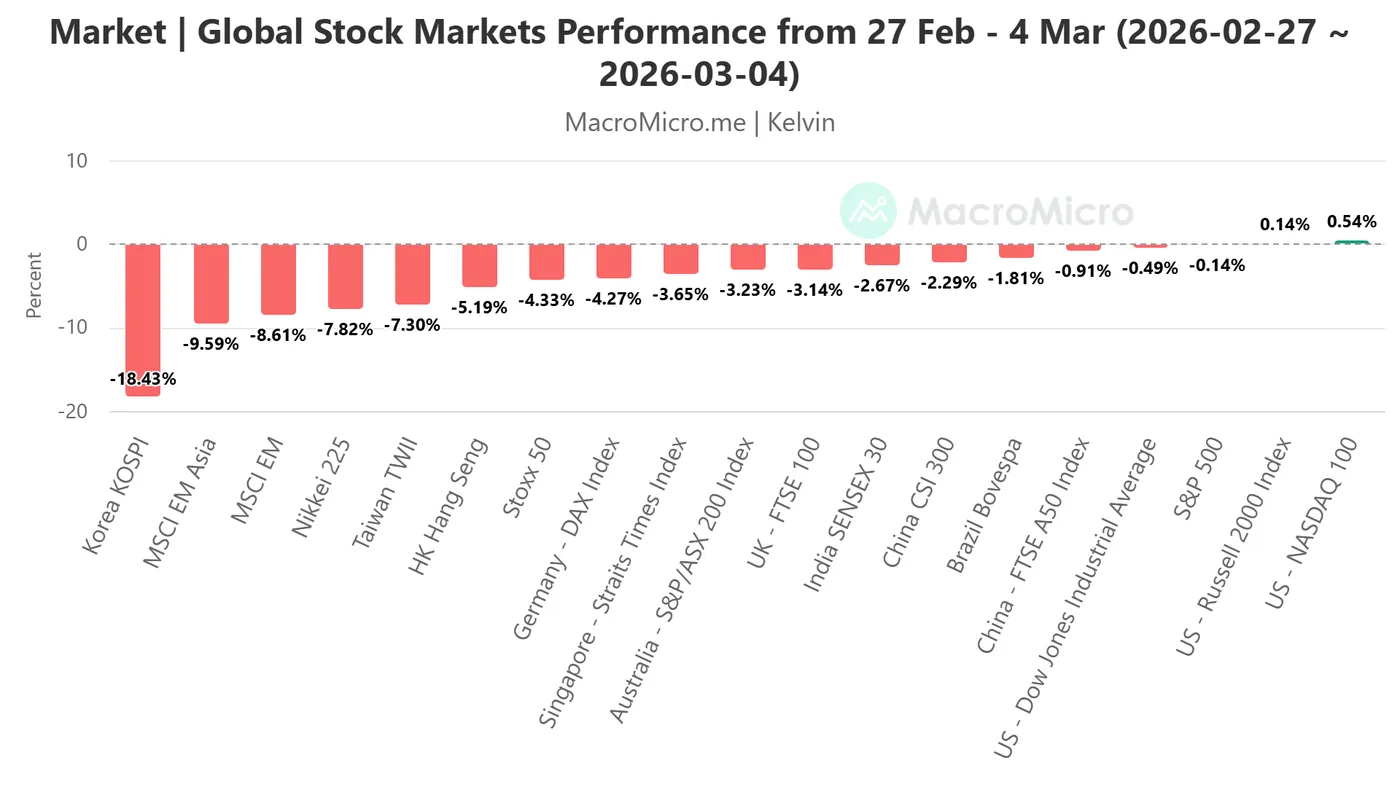
Fig. 1: Key global stock indices performances from 27 Feb 2026 to 4 Mar 2026 (Source: MacroMicro)
Overall, the European stock markets are still trading in the red since last Friday, 27 February till Wednesday, 4 March, where the German DAX recorded an accumulated loss of 4.3%, and fared better than several key Asia Pacific and Emerging Asia stock markets; South Korea’s KOSPI (-18.45), Japan’s Nikkei 225 (-7.8%), Taiwan’s TWI (-7.3%), and Hong Kong’s Hang Seng Index (-5.2%) (see Fig. 1).
The European Union economy is dependent on the Middle Eastern liquefied natural gas, which accounted for approximately 3.5% to 3.8% of the EU's total gas supply in 2025.
The US-Iran war is still showing no signs of de-escalation, and the US Senate has cleared the way for President Donald Trump to continue military attacks on Iran in a vote.
Press briefings from the White House so far have offered little clarity on a potential endgame to the conflict, leaving the risk of prolonged oil and gas supply disruptions in the Middle East elevated. Such uncertainty could amplify energy price pressures and inflict near-term economic strain on the European Union, in turn detrimental to European stock markets.
Let’s now decipher the short-term (1 to 3 days) trajectory of the German DAX from a technical analysis perspective.
DAX – Formation of “bearish flag” below 24,350
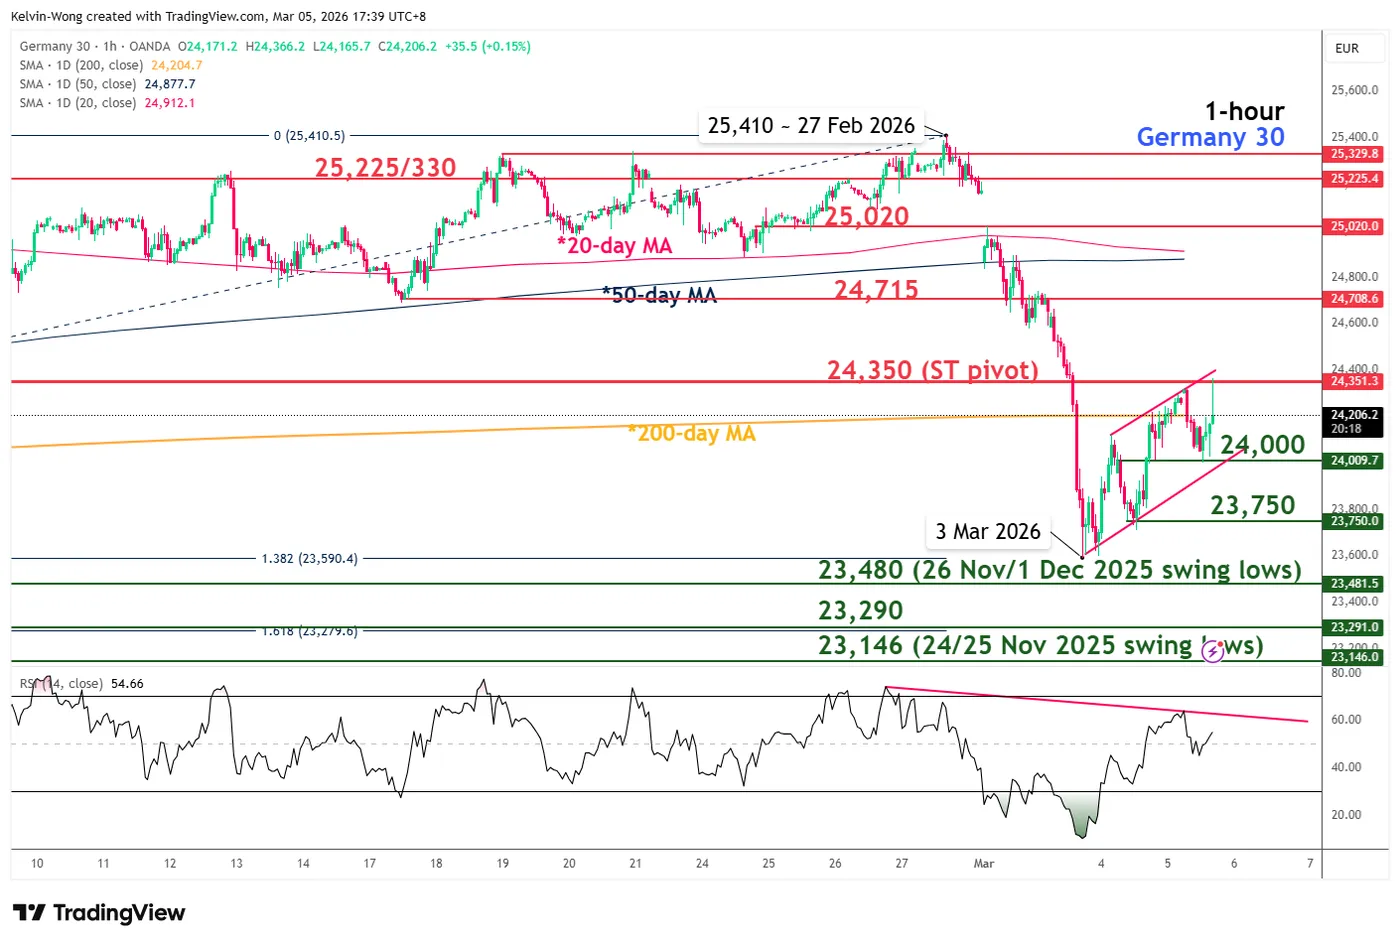
Fig. 2: Germany 30 CFD index minor trend as of 5 Mar 2026 (Source: TradingView)
Watch the 24,350 key short-term pivotal resistance (also the 38.2% Fibonacci retracement of the steep decline from 27 February 2026 high to 3 March 2026 low), and a break below 24,000 (lower boundary of the “bearish flag” exposes the next intermediate supports at 23,750, 23,480, and 23,290 (a Fibonacci extension level) (see Fig. 2).
However, a clearance and an hourly close above 24,350 invalidates the bearish scenario for a further squeeze up towards the next intermediate resistances at 24,715 and 25,020.
Key elements to support the bearish bias on DAX
- The 3.2% rally (low to high) seen on the Germany 30 CFD index (a proxy of the DAX futures) from the 3 March 2026 low of 23,592 has formed a potential minor “bearish flag” configuration, which suggests a “dead cat bounce” within a downtrend phase.
- The recent rally has stalled at the 200-day moving average.
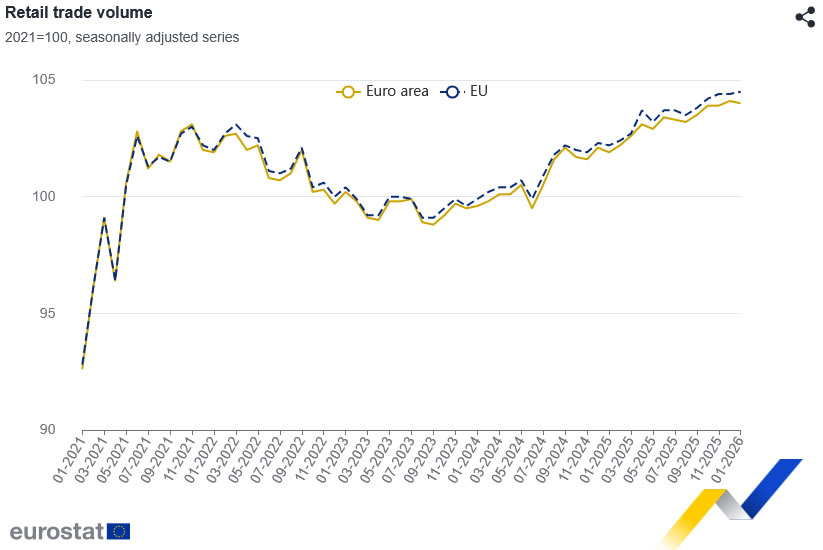
Eurozone retail sales slip -0.1% mom in January as non-food spending weakens
Eurozone retail sales slipped -0.1% mom in January, falling short of expectations for a 0.2% increase. Looking at the breakdown, spending on food, drinks and tobacco rose 0.3%, providing the only notable source of support. However, this was more than offset by declines in other categories.
Non-food retail sales (excluding fuel) dropped -0.2% in Eurozone, while automotive fuel sales fell sharply by -1.1%, reflecting both weaker mobility demand and softer energy consumption after the holiday period.
Across the broader EU, retail sales also declined -0.1% mom. The strongest increases were recorded in Estonia (+4.4%), Latvia (+2.8%), and Portugal (+2.0%), while the steepest declines were seen in Slovakia (-3.5%), Slovenia (-1.9%), and Croatia (-1.3%).
GBP/USD: Market Not Expecting BoE Rate Cut in March
GBP/USD contracted to 1.3350 on Thursday, with the pound remaining under pressure and trading near three-month lows.
Pressure on the dollar has eased over the past 24 hours following reports that Iran has offered to discuss terms for a potential end to the conflict. According to The New York Times, representatives of the Iranian Ministry of Intelligence made contact with the CIA through intermediaries, just one day after the commencement of joint US-Israel attacks. However, Israeli authorities have advised Washington not to respond to this proposal just yet.
Investors are also weighing the impact of rising energy prices on the Bank of England’s (BoE) future policy. With inflationary risks rising, expectations of an imminent rate cut have diminished significantly.
The market now assigns only a 20% probability of a BoE rate cut this month, a sharp decline from around 75% just a week ago.
Meanwhile, the UK’s Office for Budget Responsibility (OBR) has downgraded its economic growth forecast for 2026 to 1.1%, down from the previously anticipated 1.4%. However, the outlook for 2027 and 2028 remains more optimistic, with annual growth projected at around 1.6%. A gradual decline in government borrowing and inflation is also expected.
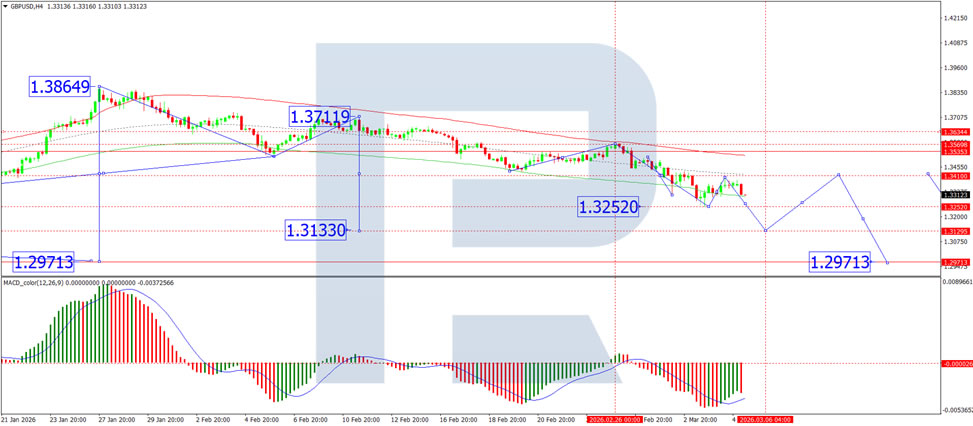
Technical Analysis
On the H4 GBP/USD chart, the market is forming a wide consolidation range around the 1.3326 level, currently extending up to 1.3393. A decline to 1.3131 is expected in the near term. Following this correction, a new consolidation phase is likely. An upside breakout would pave the way for the wave to extend to 1.3410, while a downside breakout would suggest further movement towards 1.2971. This scenario is confirmed by the MACD indicator, which shows its signal line below the zero line and pointing firmly downwards.
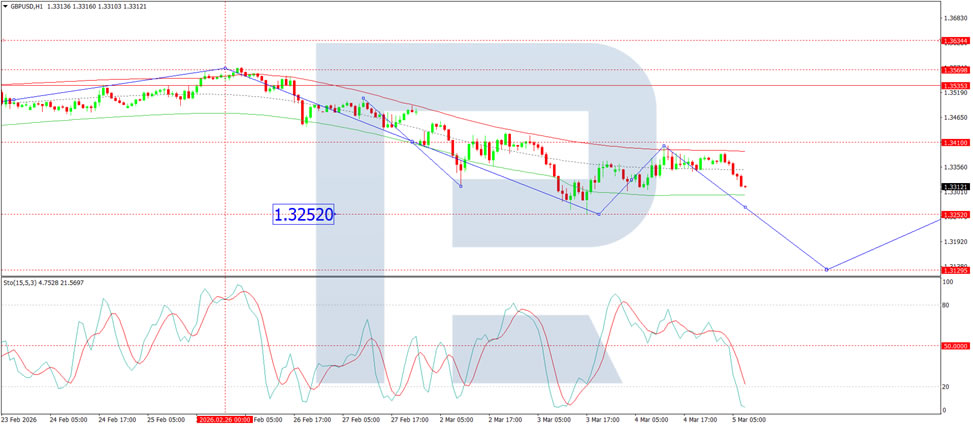
On the H1 chart, the market has formed a compact consolidation range around the 1.3333 level. A downside breakout has initiated a wave structure extending to 1.3266. If this level is breached, further downside potential towards 1.3125 is possible. This scenario is supported by the Stochastic oscillator, whose signal line is below the 50 level and pointing firmly downwards.
Conclusion
GBP/USD remains under pressure, with shifting central bank expectations and geopolitical developments driving price action. The dramatic reversal in BoE rate-cut probabilities – from 75% to just 20% in a week – reflects growing concerns about inflation driven by rising energy prices. While tentative diplomatic signals from Iran have temporarily eased dollar strength, the technical outlook for the pair remains decidedly bearish, with further downside anticipated in the near term.
Platinum Surges to Record High: Elliott Wave Signals Ongoing Support
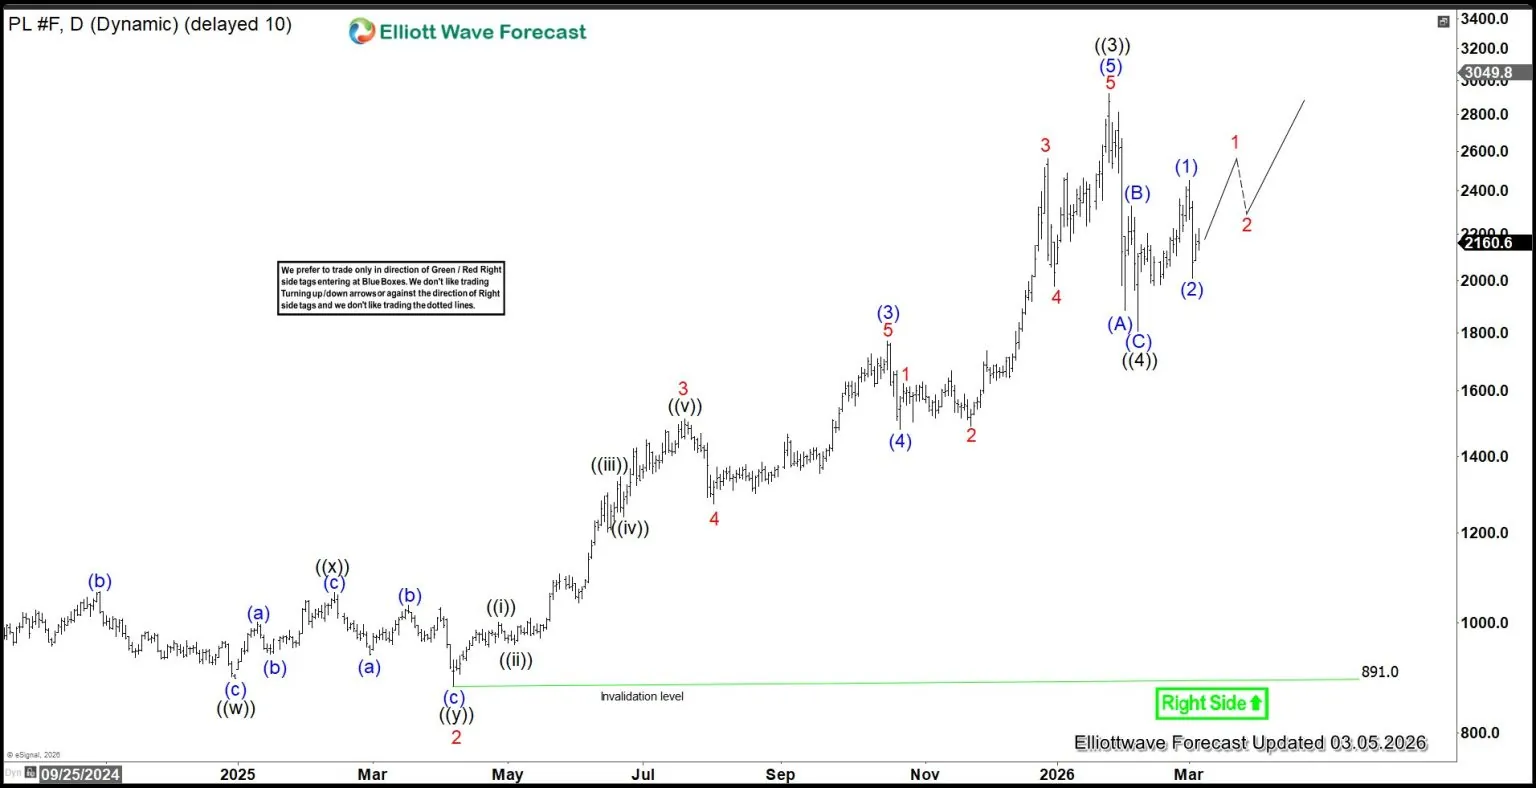
Platinum (PL) broke to new all-time highs late last year, signaling the potential start of a secular bullish market in the years ahead. In this article, we examine the long-term outlook for the metal and its evolving Elliott Wave structure.
Platinum (PL) Monthly Elliott Wave Chart
The monthly Platinum chart shows the metal has broken out to new all-time highs, reinforcing a bullish outlook. Platinum remains in a multi-year secular uptrend. The rally from January 1992 to the March 2008 peak completed wave ((I)) at 2308.8. This was followed by a corrective zigzag decline to 563, marking the end of wave ((II)). From that low, the metal resumed higher and has now broken into fresh highs with an impulsive internal structure.
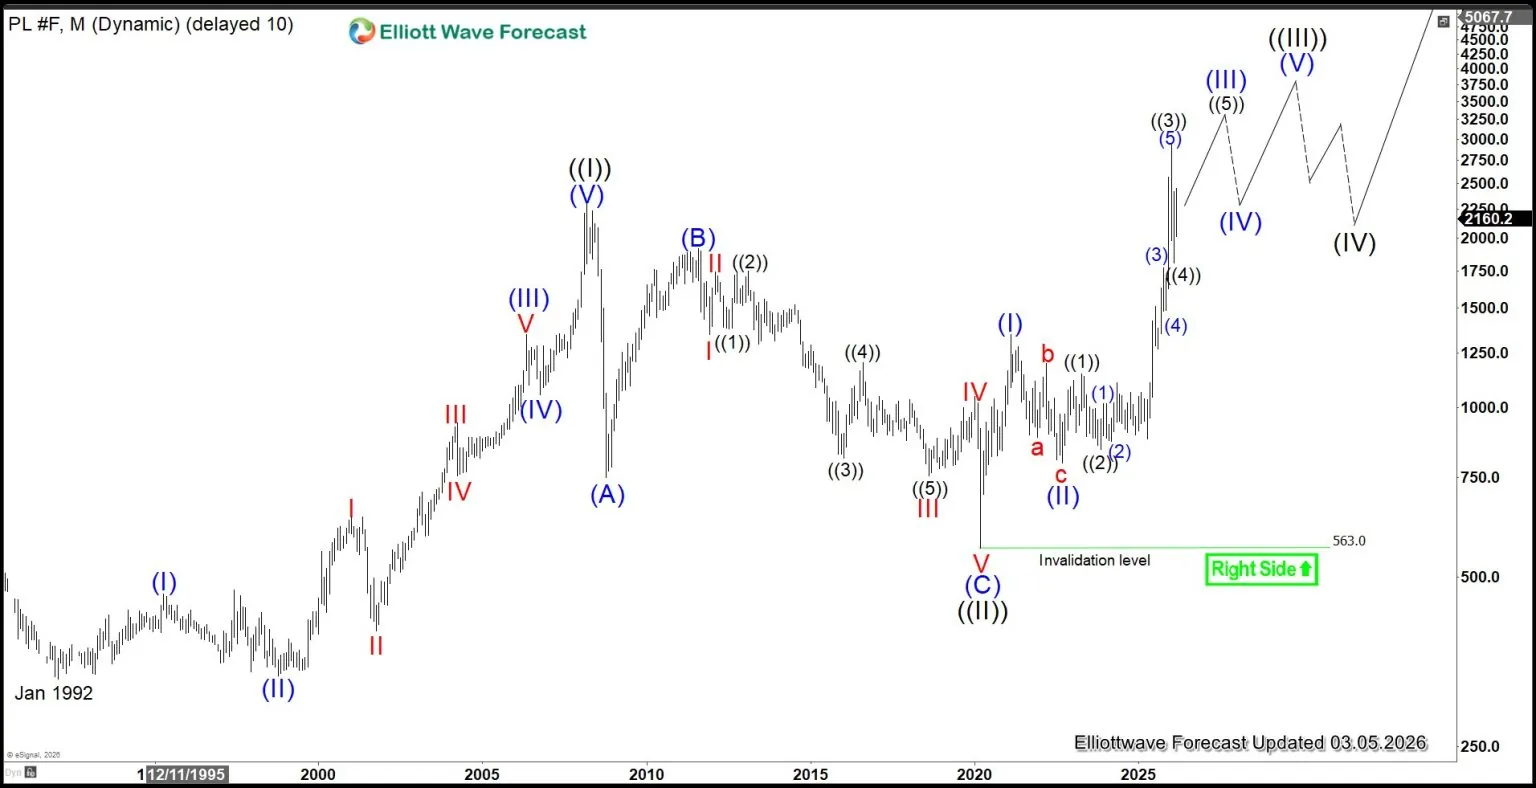
From wave ((II)), wave (I) ended at 1348.2, while the subsequent pullback in wave (II) bottomed at 796.8. Platinum then advanced within wave (III), which is expected to extend one more leg before completion. As long as the metal holds above 563.8, corrective dips should continue to find support in three- or seven-swing structures, setting the stage for further upside.
Platinum (PL) Daily Elliott Wave Chart
The daily Platinum chart shows that the rally to 2925 completed wave ((3)). The subsequent pullback in wave ((4)) is proposed to have ended at 1806. However, the metal must break above the wave ((3)) high to rule out the possibility of a double correction. In the near term, as long as the pivot at the 891 low remains intact, the outlook stays bullish with dips expected to hold in three- or seven-swing corrections. If Platinum fails and breaks below 1806, the next support zone in a potential double correction lies between 662 and 1344, where buyers are anticipated to re-emerge.
Platinum (PL) Elliott Wave Video
https://www.youtube.com/watch?v=BiAIf_FqxAc
BTC/USD Analysis: Bitcoin Price Consolidates Above $70,000
On 20 February, in the note “BTC/USD Analysis: Are the Bulls Stirring?”, we outlined a broad descending channel and highlighted early signs of increasing demand near the $65,600 level.
Subsequent price action provided further grounds to suggest that, following the dramatic decline in Bitcoin’s price from its all-time high in October 2025 to the February low around $60,000, market sentiment has begun to shift. This was reflected in the fact that two attempts by the bears to resume the downward movement (as indicated by the arrows) were unsuccessful.
It is possible that the easing of bearish pressure gave bulls greater confidence at the beginning of March, resulting in notable progress. Yesterday, Bitcoin reached its highest level in a month.
Technical Analysis of the BTC/USD Chart
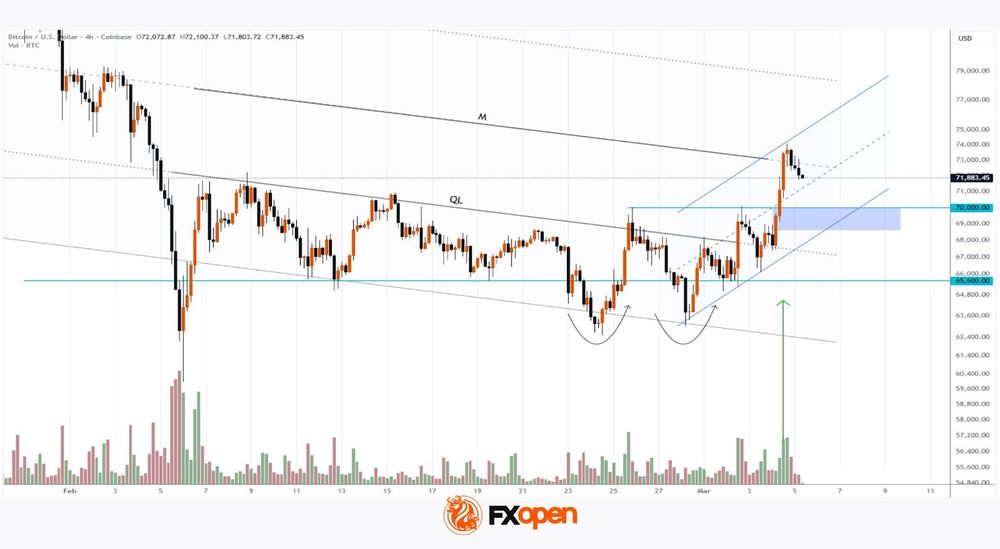
As shown on the chart, the bullish impulse at the start of March led to a breakout above the QL resistance line, as well as the psychological $70,000 level.
From a bearish perspective:
- → classic indicators added to the chart are showing signs of overbought conditions;
- → the median line (M) of the previously constructed channel may act as significant resistance.
From a bullish perspective:
- → rising trading volumes (highlighted by the arrow) represent a positive signal;
- → a sequence of higher highs and higher lows allows for the construction of a local ascending channel (shown in blue);
- → Bitcoin’s price behaviour following the early February panic resembles an Accumulation phase in Wyckoff methodology. If so, the early March rally may represent a Jump Over The Creek (JOC) pattern, signalling a potential transition into the Mark-Up phase.
Considering the above, it is reasonable to expect the formation of a pullback on the Bitcoin chart — for example, a move towards testing the support zone around the psychological $70,000 level.
FXOpen offers the world's most popular cryptocurrency CFDs*, including Bitcoin and Ethereum. Floating spreads, 1:2 leverage — at your service (additional fees may apply). Open your trading account now or learn more about crypto CFD trading with FXOpen.
*Important: At FXOpen UK, Cryptocurrency trading via CFDs is only available to our Professional clients. They are not available for trading by Retail clients. To find out more information about how this may affect you, please get in touch with our team.
This article represents the opinion of the Companies operating under the FXOpen brand only. It is not to be construed as an offer, solicitation, or recommendation with respect to products and services provided by the Companies operating under the FXOpen brand, nor is it to be considered financial advice.
Trading Remains Very Much Headline-Based
Markets
German Bunds for the first time this week gained yesterday, halting a downward spiral triggered by rising inflation risks in wake of the Iranian conflict. The front end outperformed, shedding up to 2.5 bps. Longer maturities were still up by 1.5 bps. Treasuries similarly entered calmer waters but underperformed vs Bunds in the wake of a much better than expected services ISM. The headline surged to a 3.5 year high of 56.1 (from 53.8 and vs 53.5 expected) on new orders growing significantly faster (58.6 from 53.1) and employment picking up (51.8 from 50.3). The price component eased from 66.6 to 63, a one year low. US yields rose between 3 (30-yr) and 4.4 (3-yr) bps. Risk sentiment was outright positive with geopolitical concerns, at least temporarily, moving to the background. Energy is probably the best gauge. Gas prices not only fully pared a 15% higher open, they finished 10% lower compared to Tuesday’s close. Oil prices in Asian dealings neared the $85 barrier only to end around $81.4. The jury remains out on whether it had something to do with the Trump administration’s assurances to keep energy trade flowing in the Strait of Hormuz or a later-denied-by-Iran report that the country indirectly contacted the CIA to discuss terms for ending the war. We’re in any case wary for oil (and gas) prices to drop significantly so long the war rages. Oil storage sites in key producers such as Iraq are filling up rapidly, leading them to cut or even completely halt production. The daily détente in energy prices caused relief in stock markets too, particularly in Europe. The EuroStoxx50 rose 1.7%. Wall Street added up to 1.3% (Nasdaq). It’s this risk-on mood that prevented the US dollar from benefiting from favourable yield differentials. Earlier haven flows reversed, pushing the greenback marginally lower against the euro. EUR/USD held north of 1.16. DXY dipped back below the 99 barrier. USD/JPY’s mid-February ascent hit resistance around 158. Sterling tread water around EUR/GBP 0.87.
Trading remains very much headline-based in the current circumstances. This morning is another case in point. The Iranian commander of the military ground forces said that the country hasn’t closed the Strait of Hormuz. They “don’t believe in [that] at all.” It prompted an intraday pullback in oil prices. They were again headed for the $85 barrier but are now trading around $83.5. Concerns about supply are now also triggering preservation measures by China, which told its biggest refiners to suspend diesel and gasoline exports. We continue to look at these markets to gauge overall market sentiment. Stock futures suggest a 0.5% lower open in Europe later. The US dollar recoups some of yesterday’s losses. EUR/USD hovers just north of 1.16 with an upward sloping trendline acting as support.
News & Views
The National Bank of Poland yesterday reduced its policy rate by 25 bps to 3.75%. The Bank saw inflation further declining in January to 2.2% Y/Y from 2.4% in December. The NBP also took notice of a decline in core inflation over the previous year. The decision to cut the policy rate also was supported by new macro-economic projections. The NBP sees inflation over the period 2026-2028 (middle of the 50% probability forecasting range) respectively at 2.25% (from 2.95% in the previous forecast), 2.4% (from 2.6%) and 2.55% in 2028. Growth forecasts for the period were upwardly revised to respectively 3.9% (from 3.65%) and 2.9% (from 2.6%). The 2028 estimate is set at 2.95%. Governor Glapinski indicated in February that the NBP could cut the policy rate further if the new forecasts wouldn’t show any worrying signals. However, over the previous days markets had doubted the rate cut as global volatility jumped sharply and as the zloty declined due to the conflict in the Middle East. In this respect, the policy statement only briefly mentions that energy commodity prices have risen recently and that global activity and inflation is subject to uncertainty, in particular the geopolitical situation. Markets will look for additional guidance at the press conference of governor Glapinski this afternoon. The 2-y Polish swap rate yesterday eased 5.5 bps (to 3.735%). The zloty intraday after the decision hardly lost any ground an closed the day even stronger at EUR/PLN 4.27 from 4.2875.
At the presentation of the annual report of the National Bank of Belgium (NBB), governor Wunsch indicated that additional measures of € 3-4 bln that the government intends to take to bring the Belgian budget deficit back in line with the EU trajectory won’t be enough. The measures would bring the deficit below 5% of GDP. However, the NBB governor indicated that the government should bring the deficit to 4% which is sees as more sustainable, considering extra measures necessary for defense, rising costs of aging and higher interest rate costs. In this scenario an extra budget effort of €11 bln might be necessary.
EUR/JPY Daily Outlook
Daily Pivots: (S1) 182.38; (P) 182.81; (R1) 183.23; More...
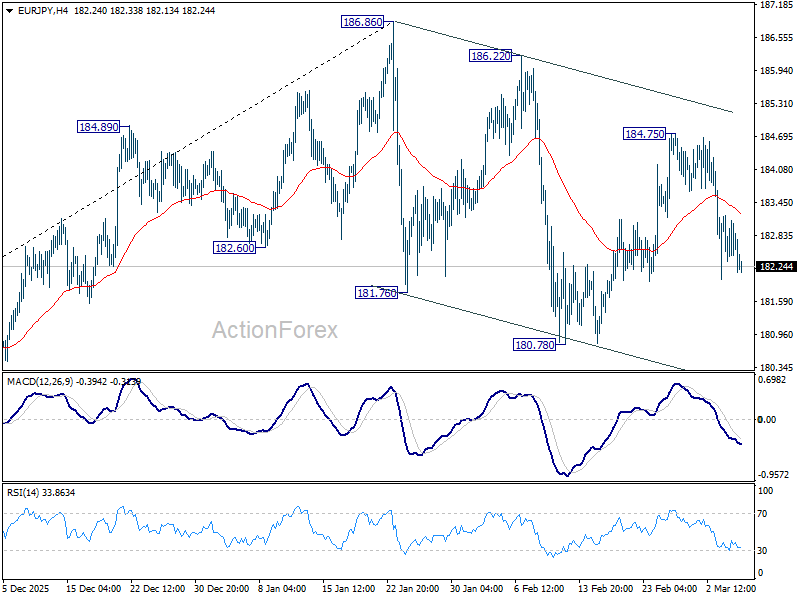
Intraday bit in EUR/JPY remains neutral for the moment. On the upside, break of 184.75 will target 186.86 high. Firm break there will resume larger up trend. However, break of 180.87 support will argue that fall from 186.86 is at least correcting whole rise from 154.77, and turn near term outlook bearish.
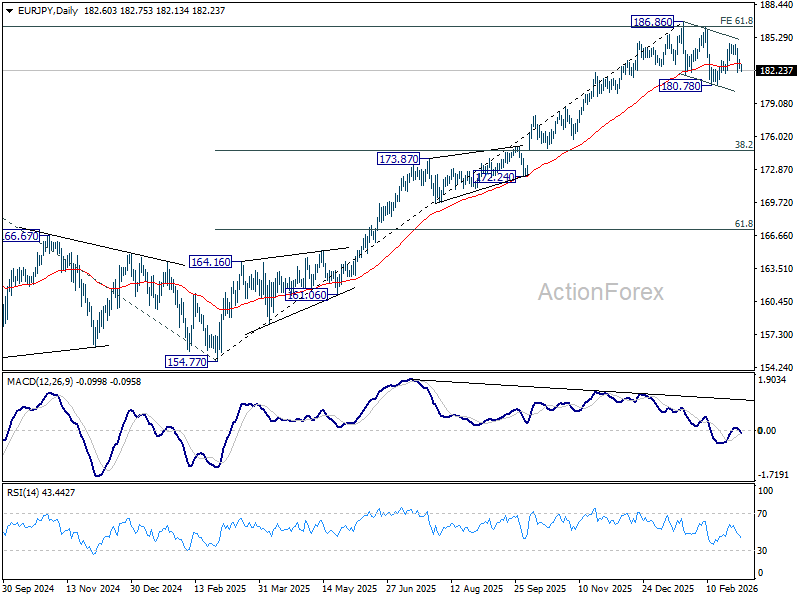
In the bigger picture, current development suggests that price actions from 186.86 are merely a near term corrective pattern. In other words, the long term up trend is still in progress. Firm break of 186.86 will pave the way to 78.6% projection of 124.37 (2022 low) to 175.41 (2025 high) from 154.77 at 194.88 next. This will now remain the favored case as long as 180.78 support holds.
GBP/JPY Daily Outlook
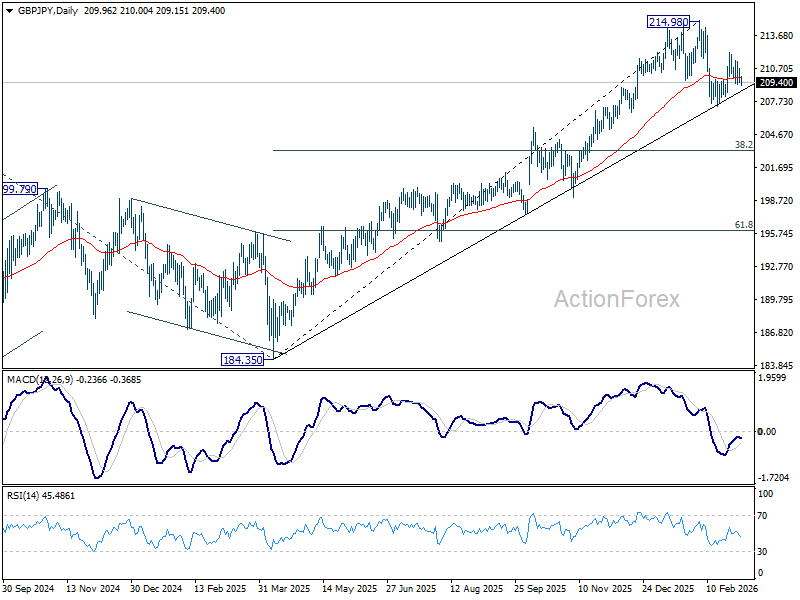
Daily Pivots: (S1) 209.44; (P) 210.07; (R1) 210.65; More...
Intraday bias in GBP/JPY remains neutral for the moment. Corrective fall from 214.98 should have completed at 207.20 already. On the upside, above 212.10 will resume the rebound from 207.20 to retest 214.98 high. For now, risk will stay on the upside as long as 207.20 holds.
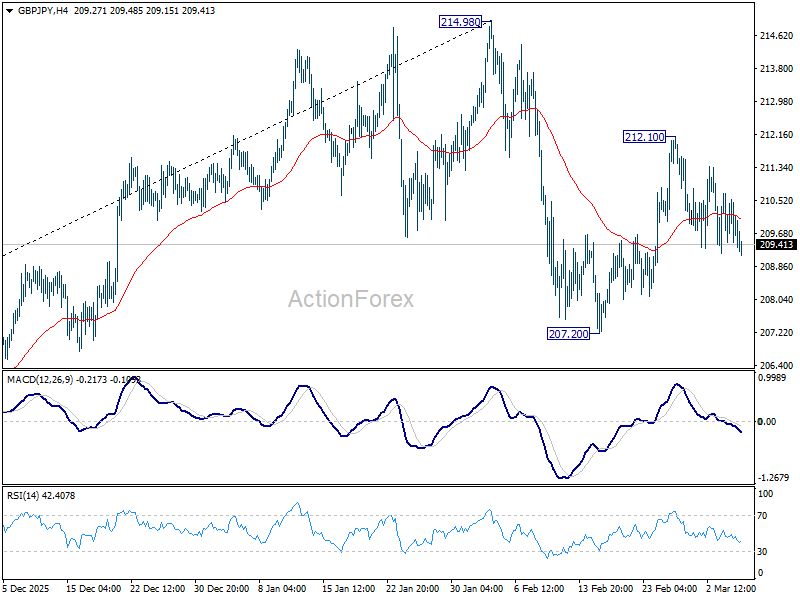
In the bigger picture, current development argues that price actions from 214.98 might be a near term consolidation pattern only. That is, larger up trend from 123.94 (2020 low) is still in progress. Firm break of 214.98 will target 61.8% projection of 148.93 (2022 low) to 208.09 (2024 high) from 184.35 at 220.90. On the downside, though, break of 207.20 will revive that case that it's already in a larger scale correction.