
Sample Category Title
Middle East Conflict Presents Two-Sided Risks for RBNZ
While the lift in oil prices has raised concerns about inflation and the risk of monetary policy tightening in many countries, we view the risks facing the RBNZ as two-sided given the economy's weak starting point.
New hostilities in the Middle East, which have led to a sharp increase in the prices of crude oil and petroleum, have caused markets to worry about the potential for a protracted lift in inflation and tighter policy from the world’s inflation-targeting central banks. We think that such an outcome is less likely in New Zealand, where a starting point of spare capacity means less risk of second-round effects from a temporary rise in petrol prices. Indeed, given that starting point , it would be folly to entirely rule out scenarios that could lead to further policy easing. This might occur if the conflict led to a severe downward revision to the outlook for global growth and commodity prices, dampening New Zealand’s fledging recovery and posing downside risks to the medium-term inflation outlook. In the meantime, faced with two-sided uncertainty, we think that the RBNZ will become even more wedded to the “on hold” stance communicated at last month’s meeting.
The main driver of domestic and international financial markets over the past week has been the attack on Iran by the US and Israel, and Iran’s retaliation targeting both Israel and US interests across multiple other nations in the region. The most enduring market impact to date has been on the price of crude oil and other key energy products. For example, at the time of writing, Brent crude has increased by $13/bbl to $85/bbl. This increase is on top of the rise seen through January and February as market participants began to anticipate this conflict. The increase in the price of refined petroleum has been even larger, with refiners’ margins also widening as usually happens when crises trigger worries about refinery capacity.
Elsewhere, safe-haven flows back to the US dollar have seen the risk-sensitive NZ dollar fall about 2% to just below 0.5900, compounding the local currency impact of higher US dollar energy prices. Global equity prices are slightly lower and term interest rates slightly higher – the latter reflecting concerns about the potential impact of higher oil prices on inflation and central bank policy.
As discussed earlier this week in a joint report with our Australian colleagues, the economic impact on New Zealand will depend on the duration of the military conflict, and the associated disruption and damage caused to international supply chains. If the conflict is resolved relatively quickly – say within the next month or so – with little damage to energy infrastructure, the economic implications for New Zealand and elsewhere could be negligible. However, a protracted conflict, especially one resulting in significant disruptions to oil supply and/or significant negative impacts on financial asset prices, could have more material downside impacts on New Zealand and its major trading partners. This would be especially so if the stresses created by the conflict were to expose other perceived economic and financial vulnerabilities across the global economy (e.g. risks associated with private credit, AI investment and associated asset valuations or China’s domestic economy).
In terms of direct exposure to the Middle East region, New Zealand has little trade with Iran. However, New Zealand’s exports to the Middle East have grown to exceed $3bn in the past year – the majority being dairy products sent to Saudi Arabia and the United Arab Emirates. Ongoing conflict would create logistical difficulties for exporters attempting to get product to the region and would increase the cost of doing business. There will also be an impact on traded services. The closure of airspace in the Middle East is impacting the movement of people as well as goods. Inbound tourism would be negatively impacted if important gateway airports to New Zealand, such as Dubai and Doha, were to remain largely closed for an extended period. Some people may be reluctant to travel through the region for a period even once the current conflict ends.
Direct imports from the Middle East region amounted to just over $1bn over the past year, led by imports of fertiliser. Since the closure of the Marsden Point refinery, New Zealand’s supply of petroleum products is mostly sourced from refineries in South Korea and Singapore. However, those refineries rely significantly on crude oil sourced from the Middle East and transported through the Strait of Hormuz. In the event of a prolonged conflict that cuts crude supply to refineries, this leaves New Zealand exposed to potential supply disruptions as well as higher prices. Our onshore inventory of refined petroleum products is very low in absolute terms and relative to global peers. The issues could move beyond a simple question of costs towards that of physical availability and the need to prioritise use. Such disruptions would raise the economic cost to New Zealand.
As a rough guide, a $USD10 increase in the price of oil adds around 11c/litre to domestic pump prices (assuming no change in the NZ dollar). If that sort of move in oil prices was sustained, it would directly and quickly add 0.1 to 0.2ppts to the CPI. However, the large increase in refining margins means the inflationary impact of the recent rise in oil prices could be significantly larger. At current levels, the combined impact of higher oil prices and refining margins could see pump prices for 91 unleaded rising to around $2.85/ltr. If sustained, that would directly add around 0.5ppts to annual inflation this year.
Moreover, a sustained oil price rise would likely pass through to local transport and other costs, leading to an additional CPI impact over time. Such increases tend to be around 30% of the direct impact of higher fuel prices, so could add a further 0.1 to 0.2ppts to annual inflation (those such effects take longer to manifest than changes in oil prices).
The impact of those increases in fuel and transportation costs could compounded by disruptions to global supply chains, which could impact the availability of some productive inputs or consumer goods, both here and in other regions. Such disruptions would further add to domestic cost pressures. However, the impact on consumer prices would also depend on the strength of domestic demand. In sectors where demand is already soft, increases in costs could result in pressure on firms’ margins, rather than significant increases in output prices.
Provided there was no significant damage to energy infrastructure, most of the above effects would unwind once the conflict was resolved and oil prices returned to pre-conflict levels. But should there be damage and/or ongoing instability in the region even after the current conflict ends, oil prices could remain elevated for an extended period. Supply chain impacts could also be prolonged depending on the nature of the damage caused during the period of kinetic fighting and the impact on risk preferences of insurers for example.
So, what does this mean for the RBNZ? In many respects it is too soon to tell given uncertainty about the likely duration of the conflict and what damage and disruption might be caused, especially to key energy infrastructure. But the RBNZ’s standard approach is to look through a near-term lift in inflation caused by higher oil prices, where that lift reflects a supply shock (due to geopolitical events or other temporary disruptions). In part this is due to the accompanying downside risks for growth, which could pose downside risks to inflation beyond the near-term (higher domestic petrol prices will reduce household disposable incomes, depressing demand elsewhere in the economy). It also reflects the expectation that any monetary policy response to a temporary inflation shock would only impact the economy after the shock had already passed, thus serving to amplify the cycle in inflation.
That said, the RBNZ will be mindful of the risk of a further uplift in inflation expectations should inflation remain in the upper part the RBNZ’s target band for an extended period, especially with the post-Covid surge in inflation still front of mind for many households and businesses. Given the current level of spare capacity in the New Zealand economy, we think there is less risk of a meaningful lift in inflation expectations than would otherwise be the case. However, the risk is not negligible. For this reason, the RBNZ will also likely be reluctant to ease policy further even if the outlook for the economy were to weaken materially.
But it would be folly to entirely rule out the possibility of further policy easing if the impact on the global economic outlook and export commodity prices was to prove severe. In the past, the more serious episodes of Middle East tensions have sometimes led to large falls in business confidence and output. While we are not expecting that this time, those downside risks can’t be ruled out.
In the near term, faced with such two-sided uncertainty, we think that the RBNZ will likely become even more wedded to the “on hold” stance that it communicated at last month’s meeting. As the conflict plays out, the RBNZ will assess how this is impacting the economic outlook and the medium-term path of inflation. Fortunately for the RBNZ, it will not have to publish updated forecasts until the next Monetary Policy Statement in late May. However, RBNZ Governor Breman is scheduled to give an address to a Business NZ CEO Forum on 24 March, touching on the current economic outlook. This might provide some insight into the RBNZ’s early thinking. We expect the RBNZ to communicate a more dovish message compared to current market pricing, which this week has been leaning towards a greater chance of the OCR being hiked sooner than December.
USD/JPY Stays Firm as Traders Await US NFP Catalyst
Key Highlights
- USD/JPY gained pace for a move above 156.00 and 156.50.
- A major rising channel is forming with support at 156.75 on the 4-hour chart.
- EUR/USD remains at risk of more downsides below 1.1600.
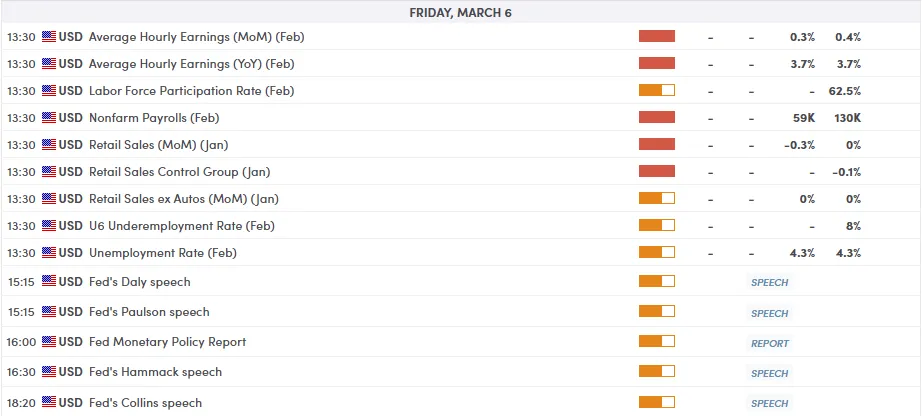
- The US nonfarm payrolls could change by 59K in Feb 2026.
USD/JPY Technical Analysis
The US Dollar remained supported above 155.00 against the Japanese Yen. USD/JPY extended its increase above 156.50 and 157.20.
Looking at the 4-hour chart, the pair settled above 156.50, the 100 simple moving average (red, 4-hour), and the 200 simple moving average (green, 4-hour). The pair traded as high as 157.97 before there was a minor pullback.
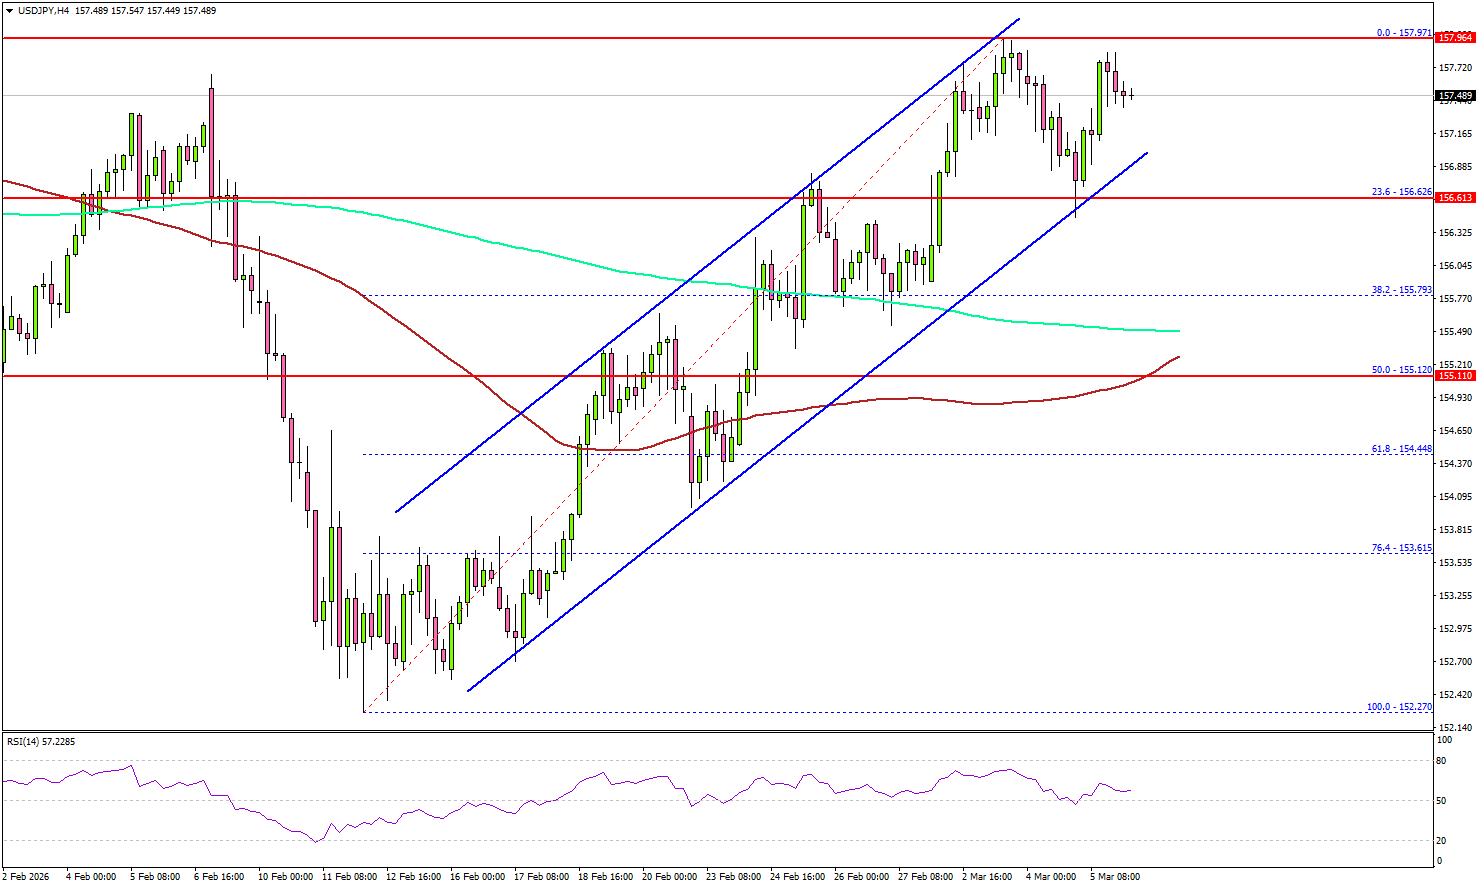
The pair found support at 156.50. There is also a major rising channel forming with support at 156.75. On the upside, the pair is now facing sellers near 158.00.
The first major resistance sits at 158.80. A close above 158.80 could open the doors for more gains. In the stated case, the bulls could aim for a move to 160.00. If there is a fresh pullback, the pair might find bids near 157.20.
The first major area for the bulls might be near the channel support at 156.75. A downside break below the channel could send the pair toward 155.75. The main support sits at 155.00, below which the pair might gain bearish momentum. In the stated case, it could even revisit 152.00 in the coming days.
Looking at EUR/USD, the pair started a fresh decline below 1.1600, and there are chances of more losses in the near term.
Upcoming Key Economic Events:
- US nonfarm payrolls for Feb 2026 – Forecast 59K, versus 130K previous.
- US Unemployment Rate for Feb 2026 - Forecast 4.3%, versus 4.3% previous.
WTI Oil crosses 80 after White House timeline uncertainty, 84.3 now key
Crude oil has entered a new phase of the geopolitical crisis. WTI crude officially broke above the 80 per barrel level, marking both an important psychological milestone and its highest level since mid-2024. The move reflects a shift in market perception—from treating the Middle East conflict as a temporary geopolitical flare-up to pricing a more sustained disruption to global energy flows.
The latest "bullish nudge" came from comments of White House press secretary Karoline Leavitt, who said the Trump administration has no timeline for when commercial shipping through the Strait of Hormuz will be safe again. When asked about reopening the critical waterway, Leavitt declined to commit to any timeframe, saying the situation is still being “actively calculated” by both the Department of War and the Department of Energy.
For energy markets, the absence of a timeline was itself the message. Traders had been looking for signals that military operations were close to stabilizing the shipping route. Instead, the administration’s remarks suggested that the roughly 20 million barrels of oil that normally transit the Strait of Hormuz each day may remain effectively off the market for an extended period.
Equally important was the implication that restoring commercial shipping is not currently the immediate priority. Leavitt’s wording suggested that U.S. strategy may still be focused on degrading Iranian military infrastructure rather than quickly reopening the sea lanes for tankers. That interpretation reinforced fears that the disruption could persist longer than previously assumed.
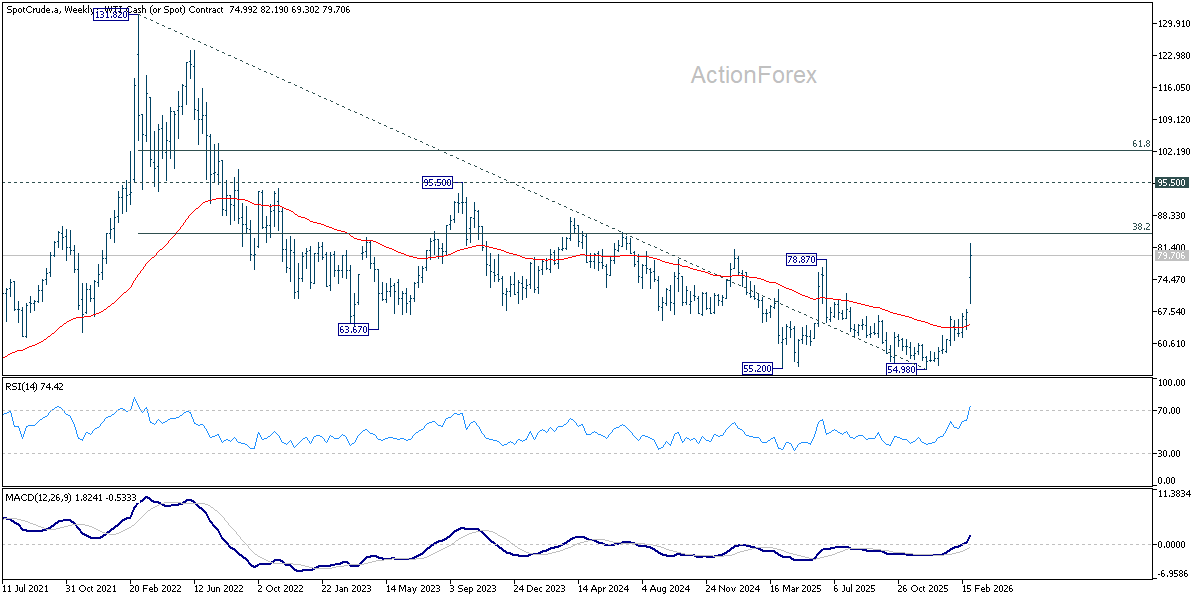
Technically, the latest rally has also triggered an important chart development. WTI’s break above the key resistance level at 78.87 could confirm the completion of a medium-term double bottom pattern formed around the 55.20 and 54.98 lows. That structure suggests the multi-year downtrend from the 2022 peak at 131.82 may be reversing.
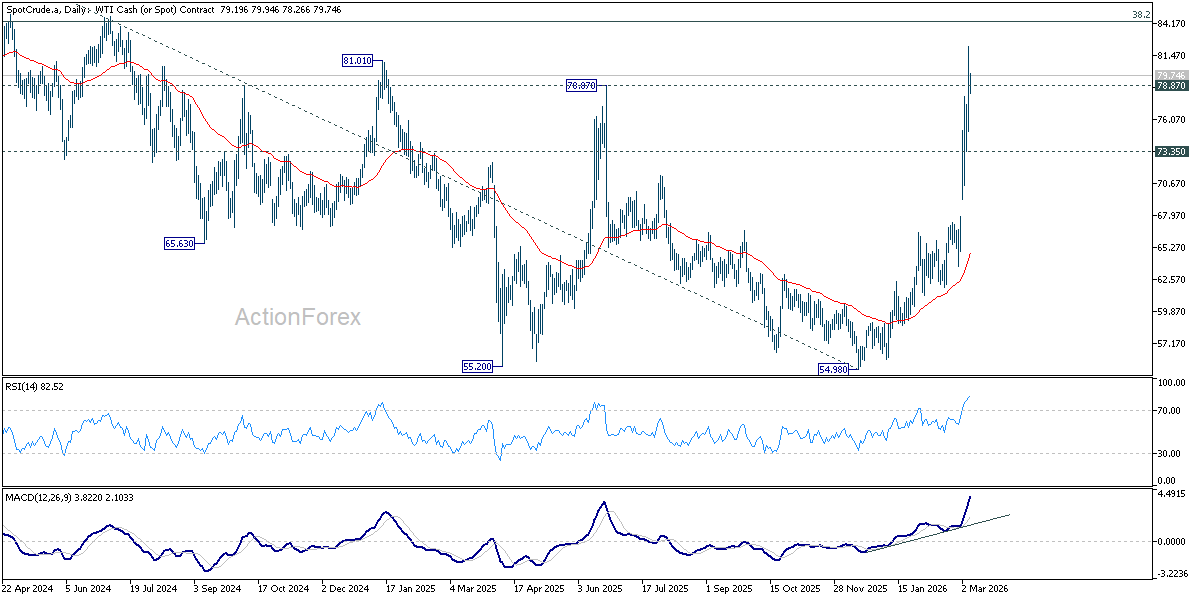
If that interpretation holds, attention now turns to the next major technical level of 38.2% retracement of 131.82 to 54.98 at 84.33. A decisive break above that level would strengthen the case that crude has entered a broader up trend rather than simply experiencing a war-driven spike.
That could trigger further upward acceleration to 95.50 structural resistance or even further to 61.8% retracement at 102.46.
Still, the rally remains sensitive to shifts in geopolitical expectations. A drop below 73.35 support level would signal stabilization in some form. Oil prices may then enter a consolidation phase while waiting for further developments in the conflict.
Fed’s Barkin: Inflation fight not over amid strong data and war risks
Richmond Fed President Thomas Barkin cautioned that the Fed need to reassess its policy risks as recent economic data and geopolitical developments complicate the inflation outlook. In remarks to Bloomberg Television overnight, Barkin highlighted that stronger job growth and persistently elevated inflation readings could challenge earlier assumptions about the trajectory of price pressures.
He noted that last year’s rate cuts were justified largely by concerns that the labor market was weakening while inflation risks were fading. However, :the data that's come in over the last couple months suggests it has moved in the other direction," he said.
At the same time, the ongoing conflict between the U.S. and Iran could further intensify inflation risks through higher energy prices. With recent run of stronger inflation readings, "that certainly puts pause to any conclusion that we're done fighting this," he emphasized.
Cliff Notes: Known and Unknown Risks
Key insights from the week that was.
In Australia, GDP rose 0.8% in Q4. While this fell short of our revised forecast of 1.1%, it was still a robust result which, together with recent revisions, lifted the annual growth pace to 2.6% – the strongest outcome since Q1 2023. Today’s note from Chief Economist Luci Ellis provides a succinct summary of the key takeaways from the Q4 report.
One component of demand worth highlighting here is consumer spending, having surprised to the downside in Q4 with a meagre 0.3% gain. Temporary factors look to be a partial explanation, particularly for electricity spending – milder weather and a larger impact from state electricity rebates saw volumes and prices drop. Additionally, our estimate of non-tourism spending offshore, based on card activity, was much stronger than the estimates provided by the ABS, although future revisions could see these difference narrow. Overall, consumer spending is best characterised as steadying rather than slowing, with a relatively solid outlook for disposable incomes and savings to provide a cushion against higher interest and tax payments.
Cotality data also points to further, albeit more modest, wealth gains, home prices reported to have risen 0.6% nationally in February, with affordability constraints primarily impacting Sydney and Melbourne. While dwelling approvals fell by –7.2% in January, the pipeline remains robust and should help alleviate tight supply over time. For more detail and forecasts on the housing market, see our latest Housing Pulse.
Outside of domestic demand, inventories were a meaningful contributor to growth in Q4, adding +0.3ppts, but net exports a modest detractor (–0.1ppt). On external demand, partials released ahead of GDP showed the current account balance recorded its widest deficit in a decade at –$22.1bn in Q4, largely owing to stronger import volumes and price effects – a trend that looks to have persisted in January’s goods trade.
Offshore, the focus was on the escalating conflict in the Middle East. Over the past week, the US and Israel have undertaken targeted military actions against Iran. The Supreme Leader Ayatollah Ali Khamenei was killed along with several other senior leaders. Iran has retaliated against US assets in the region, Israel and some other infrastructure across the Middle East. For the world more broadly, the main risks surround energy supply through the Strait of Hormuz and the shutting down of sea/air freight and passenger flights through the region. The US has offered to guard ships travelling along the Strait of Hormuz and to insure them to mitigate transit risks. Earlier in the week, we undertook an initial estimate of the potential cost to the Australian and New Zealand economies of three potential scenarios for the conflict.
In the US meanwhile, the ISM services PMI provided a slight reprieve, the headline index increasing 2.3pts to 56.1, a high back to mid-2022. New orders gained 5.5pts in the month, but employment a more modest 1.5pts, while the prices paid component eased back to now be modestly below the 5-year average. Comments from respondents suggest demand for data centres and continued resilience in consumer spending are benefitting the sector. Manufacturing conditions remain soft, the headline ISM manufacturing index broadly unchanged in the month. New orders lost momentum, and the employment index remained sub-50. The prices paid component points to cost pressures, however, rising back to its highest level since mid-2022.
Late in the week in Asia, guidance from China’s annual National People’s Congress implied quality growth and stability will be authorities’ focus in 2026. The overall growth target was lowered from “around 5.0%” to “around 4.5-5%”, and the Central Government fiscal target kept at 4% of GDP. The top three priorities focus on improving domestic industries and technologies, aided by a 7.0% annual increase in research and development spending throughout the decade. Boosting domestic demand was the fourth most important priority, but little policy detail was offered here. On the housing market, authorities are still aiming to ‘stabilise’ the sector – this applies to prices and construction activity. We believe pro-active stimulus is necessary to achieve growth of around 4.5% this year and to ward off downside risks for the years to come. This is most likely to take the form of additional funding for local governments and financial sector initiatives to turn the housing market. For consumption, confidence is key. An improvement here will require evidence of greater job creation and broad, sustained gains for wealth.
Lastly, Japanese Financial Statement data for Q4 2025 indicates that conditions are likely to warrant another rate hike by the Bank of Japan in 2026. Profitability rose 4.7%yr, putting operating margins at their highest level since the 1960s. This was mostly the result of businesses in the services sector which have been aided by the tourism boom post-COVID. That said, most industries have experienced a persistent uptrend in profitability since the pandemic – this will ensure nominal wage increases can continue in 2026. Investment growth is also strong, 7.3%yr, particularly in the services sector. Reports suggest much of the investment is to counteract labour shortages.
The Good, the Bad and the Simply Perplexing
Australia’s economy is in a cyclical upswing, and the latest quarterly accounts suggest there is more supply capacity than some feared. Public sector programs continue to absorb resources, while consumer spending is not as strong as we thought.
- This week’s national accounts confirm that Australia is in a cyclical upswing that is becoming more broadly based. This is good news: much of the strength is in activities that invest in Australia’s future. Data revisions also imply that supply capacity is better than many observers feared, and more in line with our existing view.
- The bid for resources by the public sector remains robust and possibly overlaps with the needs coming from growing business and housing investment. Consistent with this, the income tax burden on households has returned to high levels. Households are also facing higher petrol prices while the war in the Middle East continues.
- The Q4 consumption data were a puzzle, slower than we or the RBA expected. Some of the miss looks to be noise that reverses next quarter and some may be measurement issues that get revised later. Based on what we know now, though, it seems that the anticipated private sector recovery is more about investment (both business and housing) than consumption. The consumer will be reined in until the current inflation pulse subsides.
Every quarter, the ABS runs the ruler over the economy, and we learn something about the underlying activity pulse, now and in the past. The story is usually a mixed bag of positive and negative news, and some results are simply perplexing. This quarter was no different.
The good
Australia is in a cyclical upswing that is becoming more broadly based. In the quarter, solid growth was seen across a range of both public and private demand. Business investment is looking positive even as the lumpy timing of buying in data centre equipment versus building the actual data centre induces volatility in the components. While the external sector detracted from growth overall, minerals export volumes bounced after a long period of relative stability. Factor in higher commodity prices across many key exports and the income (and tax revenue) boost from this source is material.
This is an unambiguously good thing. Growth had been lacklustre for much of the post-pandemic period, even with the ramp-up in the care economy. And stronger dwelling investment means more housing supply. Overall, we see the composition of recent and near-term growth as being consistent with investing in Australia’s future.
Supply capacity is better than many observers feared. As one of my old bosses used to say, most changes to your view come from revisions to history. His observation was especially pertinent in the Q4 accounts. While growth in the quarter lagged our final estimate, the previous three quarters were each revised up slightly. As well as meaning that our year-ended growth forecast was on the money, the material cumulative revision implies that the inflation seen recently occurred alongside stronger growth than previously understood. This inherently implies that supply capacity was higher and growing faster than previous data releases implied. We have long believed that Australia can grow sustainably faster than 2%; this week’s data is evidence in favour of our view and against the slow-trend hypothesis.
Productivity growth at 1.0%yr (and even higher at 1.5%yr in the market sector as mining productivity bounced back) is well above the RBA’s February forecast. Commentators pointing to the flat quarterly result for productivity growth in Q4 as evidence of ongoing stagnation ignore the prospects for further data revisions in future releases, given their recent pattern. That view also ignores the inherent volatility of these imperfectly measured data, as well as the vagaries of measurement in the non-market sector.
The bad
The public sector continues to expand its share of the economy. While infrastructure spending has been rolling over as projects complete, other realms of public spending remain robust. The ‘handover’ from public to private spending was less complete than we initially thought. This becomes a particular issue if the spending calls on resources that the private sector is also competing for. As we have previously highlighted, much of the private sector investment has been in ‘structural’ areas such as energy transition and data centres that are not simply responses to consumer demand and thus will be resilient to consumer weakness. They also lean heavily on construction capacity that public programs such as Housing Australia and the Brisbane Olympics also seek to draw on.
A large public sector is not inherently bad. Many of the spending initiatives, including on disability and social care, address important needs and create opportunities for the people helped. They have probably supported the labour force participation of others as well. However, all this support must be funded. One of the other features of the Q4 national accounts is that taxation as a share of household income rose over 2025, reversing almost all the reduction from the Stage 3 tax cuts. This is again a material drag on household disposable incomes and spending. Given that many Australian households are very lightly taxed, a rising tax burden on the rest has distributional implications.
Separate to the national accounts, there is a war on. The hostilities in the Middle East have closed the Strait of Hormuz and damaged Qatari LNG production. Global oil prices have spiked and local petrol prices have also risen significantly; we recently released some scenario analysis on how this might play out for inflation and growth in Australia and New Zealand. A key point is that global gas prices as well as oil prices are being affected. There is an export and tax revenue fillip for Australia from this that will cushion the cost shock.
Inflation expectations in Australia remained relatively well anchored through the post-pandemic inflation surge. The RBA even assumes this will continue when it forecasts inflation or assesses the tightness of the labour market. Thus, while it would be nervous, knowing that petrol prices are very salient for household beliefs about inflation, it should be keeping this risk in perspective and not act on a possibility that expectations might lift.
The simply perplexing
A comprehensive, interlinked data set such as the national accounts will always throw up some puzzles. We were surprised that the consumption data were not stronger in the December quarter. Some of the miss was likely noise, relating to weather effects on actual electricity consumption and the mapping from total vehicle sales to sales to households. But there is also a notable gap between our estimates of non-tourism spending offshore, such as online shopping, gaming and gambling, based on customer card spending, and the ABS’s estimates based on other sources. This is an area where the data revisions my old boss used to warn about might come into play at some point.
The bottom line
The anticipated private sector recovery is underway, but it is more about investment than household consumption. The consumer will again be reined in by restrictive monetary policy and rising tax burdens until the current inflation pulse subsides.
EUR/USD: NFP Looms as 1.1578 Support Faces Critical Test
- The pair is under pressure, trading below 1.1600 due to geopolitical tensions (Middle East conflict, Iran leadership) and the ECB's "persistent uncertainty" which prevents the Euro from decoupling from the US Dollar's strength.
- The highly anticipated US Nonfarm Payrolls (NFP) report tomorrow is expected to cause significant volatility, with a strong reading cementing Dollar dominance.
- The immediate future hinges on the 1.1578 support level.
EUR/USD finds itself at a critical technical and fundamental juncture. After a volatile week defined by a "flight to safety," the pair has broken back below the psychological 1.1600 barrier.
What is driving EUR/USD price action?
One could almost call EUR/USDs conundrum as a ‘tale of two tensions’. The pair is navigating through a mix of geopolitical anxiety and central bank caution.
The European Central Bank (ECB) published its meeting accounts today. While the Governing Council expressed confidence that inflation is trending toward target, they emphasized "persistent uncertainty."
This cautious rhetoric suggests the ECB is in no rush to pivot aggressively, but it also fails to provide the hawkish spark the Euro needs to decouple from the Dollar’s strength.
Add to this the escalating conflict in the Middle East and you have a cocktail for explaining the slide in EUR/USD.
Looking at the latest from the Middle East, according to reporting from Axios, President Trump has asserted that he must be personally involved in the process of selecting Iran’s next leader. While acknowledging that Mojtaba Khamenei is currently the most likely individual to succeed the Supreme Leader, the President characterized such an outcome as unacceptable.
This is likely to keep tensions high and a peace deal or ceasefire out of reach which would continue to lend support to the US Dollar and drag EUR/USD lower.
NFP & jobs data tomorrow
Recent US economic indicators, including a strong ISM Services PMI (56.1) and steady private payroll data, continue to paint a picture of US economic outperformance. This "American exceptionalism" keeps the Federal Reserve's policy path looking more robust compared to its European counterpart.
Tomorrow though will bring the highly anticipated NFP release. As the most significant labor market data point of the month, a strong reading could cement the Dollar's dominance, while a miss might provide the Euro the breathing room it needs to stage a relief rally.
For all market-moving economic releases and events, see the MarketPulse Economic Calendar. (click to enlarge)
What comes next for EUR/USD?
The immediate future of EUR/USD hinges on whether the 1.1578 support level can hold on a daily closing basis.
The Bearish Case: If the pair closes below 1.1578, technical analysts warn of a "deeper slide" toward 1.1500. Such a move would likely be triggered by a renewed surge in oil prices (potentially toward $100/bbl) or a further escalation in regional hostilities.
A test of the 1.1450 level will be intriguing. This has been a multi-year pivot level for EUR/USD and if this holds, it may present an opportunity for position traders.
The Bullish Case: For a meaningful recovery, the Euro must reclaim its 200-day moving average near 1.1670. A break above this level would signal that the broader uptrend remains intact and could trigger a wave of technical buying back toward 1.1800.
EUR/USD Four-Hour Chart, January 6, 2026
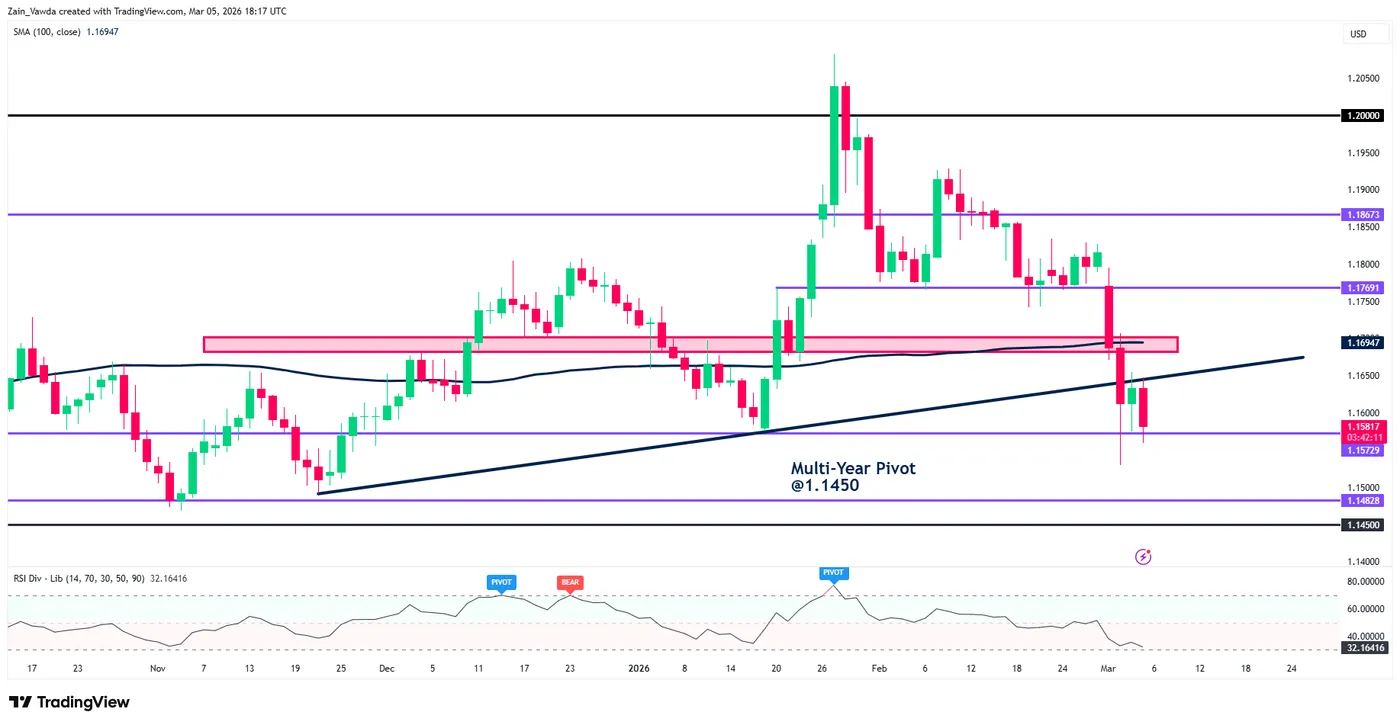
Source:TradingView.com
For now, EUR/USD remains in a "wait-and-see" mode, pinned between geopolitical headlines and looming US data. Traders should remain cautiously optimistic only if 1.1580 holds; otherwise, the path of least resistance remains to the downside.
Canadian Dollar Loves Conflict – Has CAD Reached a Long-Term Bottom?
The Canadian Dollar had been a victim of a rough stretch since the beginning of Trump's second term.
Isolated by its historic neighbor amid US First policies, the Canadian Economy had been taking a sustained hit, leading to an accelerated cooling. The Land of Maple Syrup is known to be highly cyclical. Structurally, it tends to be dependent on commodity prices, global trade, and particularly on the US, which harshly pumped the brakes.
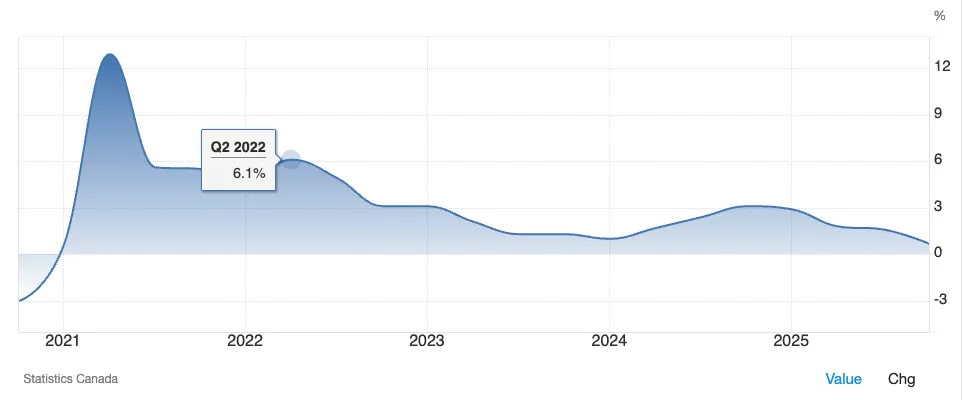
Canadian GDP Growth since end 2020 – Courtesy of Trading Economics
This phenomenon got accelerated by the historic Canadian mortgage structure: Variable loans are particularly affected when rates rise, compared to the typical 30-year fixed rates offered in the US.
Hence, after the 2 years of ultra-low rates during COVID policies, the Bank of Canada hikes sent the hypersonic economy into a rock-hard wall.
Add to this a general productivity restructuring, as massive waves of immigration saw another brutal stop; business confidence and investment stalled suddenly over the past few years – this shows up particularly in GDP per capita in Canada, which has remained broadly unchanged since 2012.
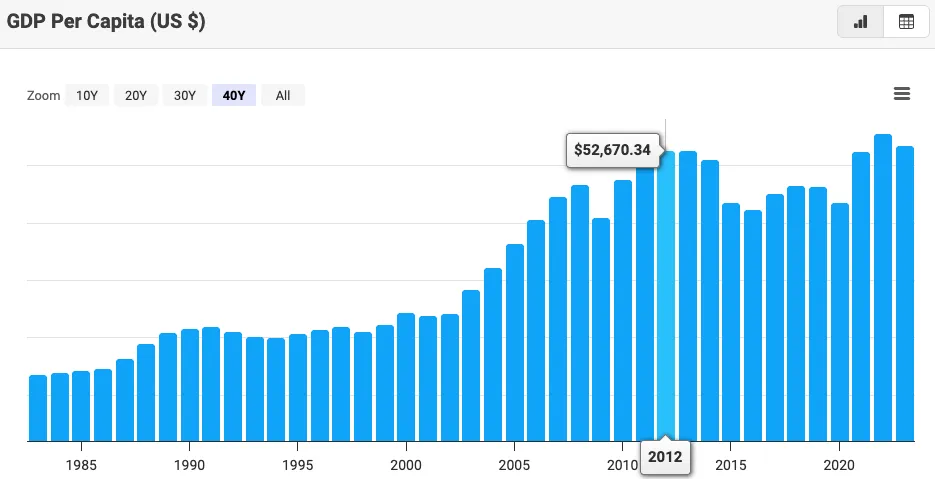
Canadian GDP per Capita since 1985 – Courtesy of Macro Micro
But there is light at the end of the tunnel. After years of questioning within Canada's natural Liberal party, Justin Trudeau stepped aside for Mark Carney, who has since cast doubt on some political issues.
Since his ascension to power in March 2025, Carney and his party have brought three Conservatives into their ranks. Conservatives are going through their own crisis with internal trouble and separatist causes in Alberta. The Liberal Party is now three seats away from a majority in the House of Commons.
But that's just politics. Even if the Canadian economy remains deeply strained from the latest rounds of US Policies, Carney has begun a new wave of international trade deals with India, China, and Europe – The rise of the "Middle power".
Canada's manoeuvre options were thin, with the trilateral USMCA deal in limbo, but its capacities are slowly increasing.
What is of traders' interest is how all of this relates to the Loonie.
After reaching 16-year lows against the Euro, 22-year troughs against the USD, and a new nadir against the Swiss Franc, the Canadian Dollar is forging a sharp turn, supported by higher petroleum and gold prices.
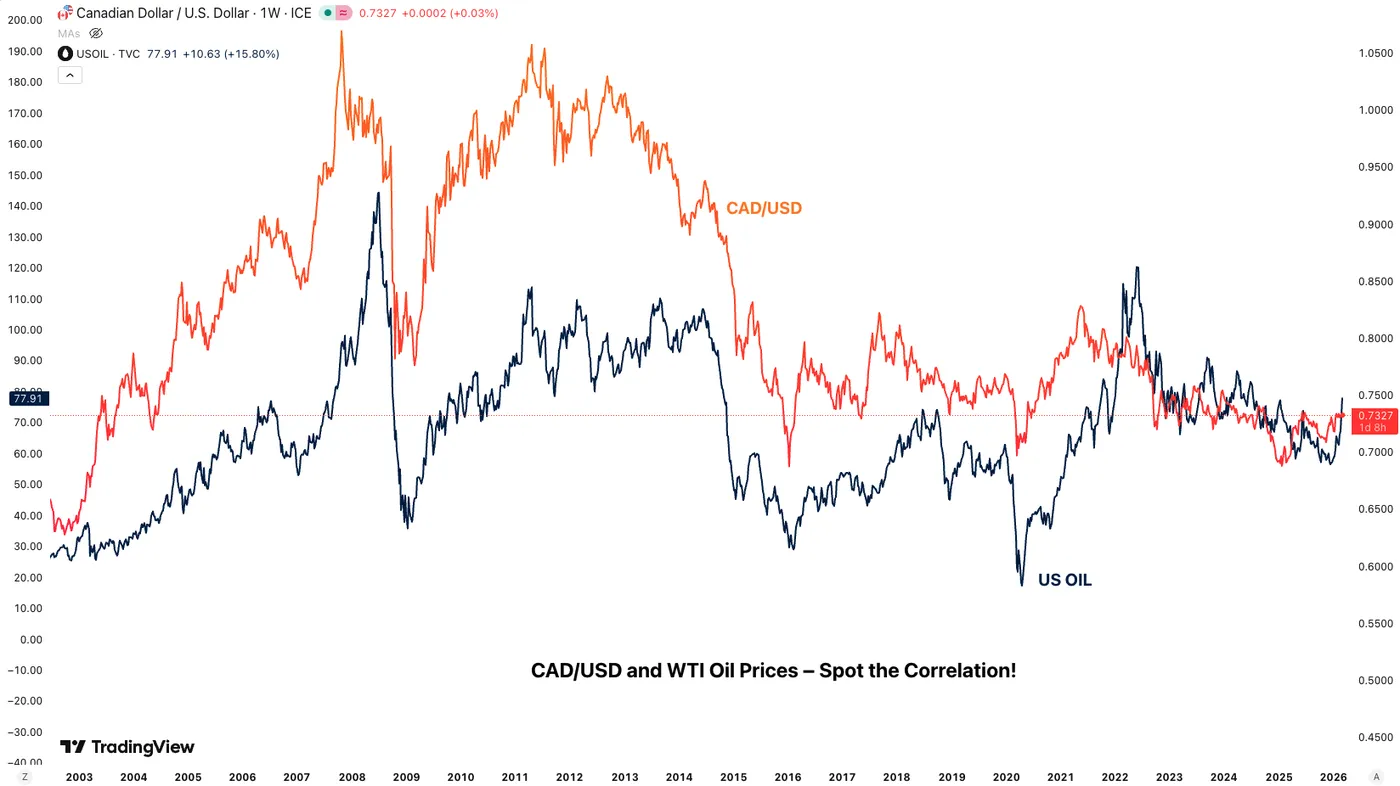
Canadian Dollar and Oil Tight Correlation – Source: TradingView
While its economy remains crippled by structural factors, Markets are forward-looking, and traders should do the same, so let's ask a simple question.
Have we seen a long-term bottom in the Canadian Dollar?
Let's dive into the weekly charts for USD/CAD, CAD/CHF, and EUR/CAD to see if we can get some clues from higher-timeframe technical analysis.
Canadian Dollar 3-Pair Weekly Timeframe Analysis
USD/CAD Weekly Chart and Major Levels
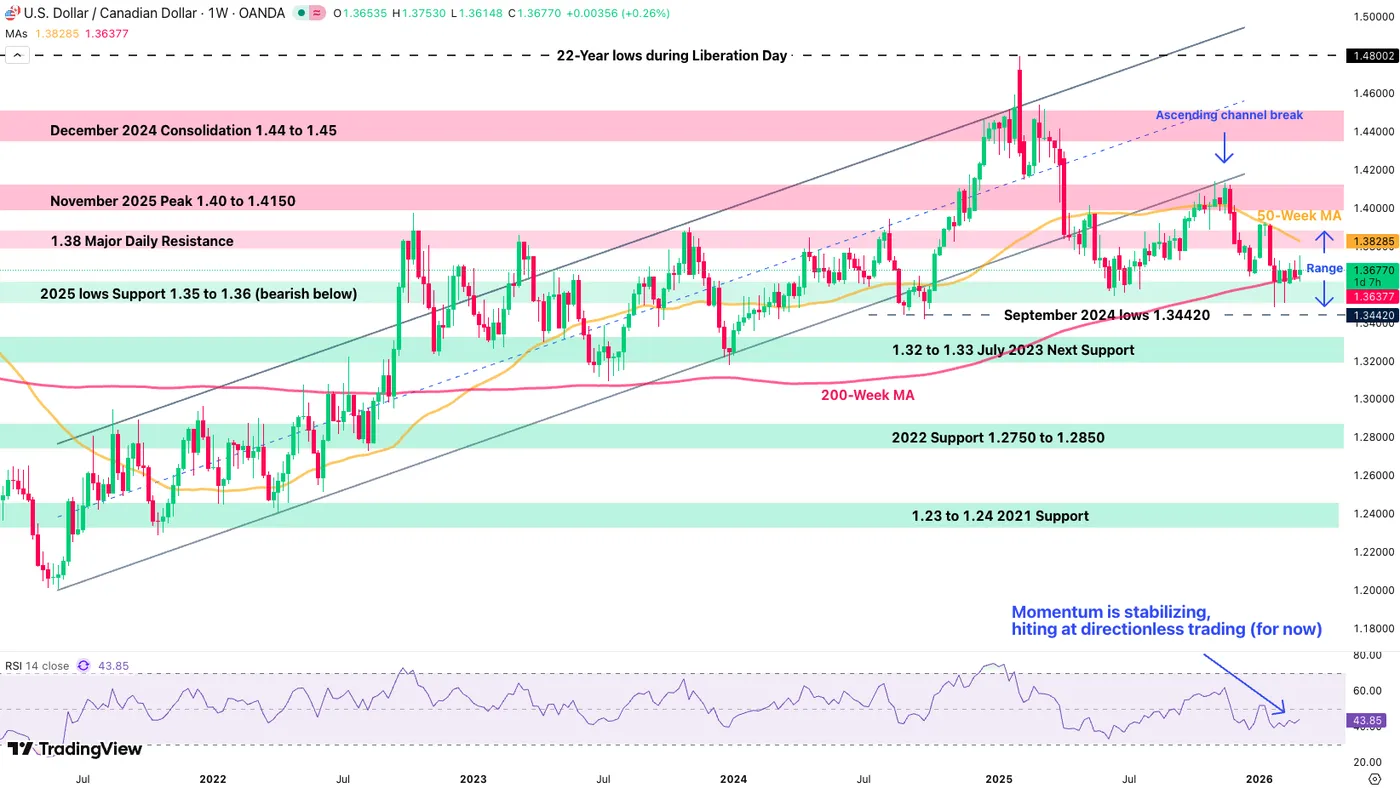
USD/CAD Weekly Chart, March 5, 2026 – Source: TradingView
USD/CAD has now officially broken its 2021 long-term uptrend – But such rarely signify immediate U-turns.
The Major North American pair is currently ranging between 1.35 and 1.38, stabilized by its 200-Week Moving Average (1.36378).
The consolidation isn't looking to be break on the immediate outlook, but keep these two breakout zones in mind:
- Breaking and closing on the week below 1.35 would hint at further downside in the pair.
- Rebounding a closing above its 50-Week MA (1.3830) could lead to a retest of 1.40 (lower odds)
USD/CAD Higher timeframe levels
Resistance Levels:
- 1.38 Major Daily Resistance & 50-Week MA (1.3830)
- 2026 highs 1.39288
- November 2025 Peak 1.40 to 1.4150
- December 2024 Consolidation 1.44 to 1.45
Support Levels:
- 200-Week MA 1.36378
- 2025 lows Support 1.35 to 1.36 (bearish below)
- September 2024 lows 1.34420
- 1.32 to 1.33 July 2023 Next Support
CAD/CHF Weekly Chart and Major Levels
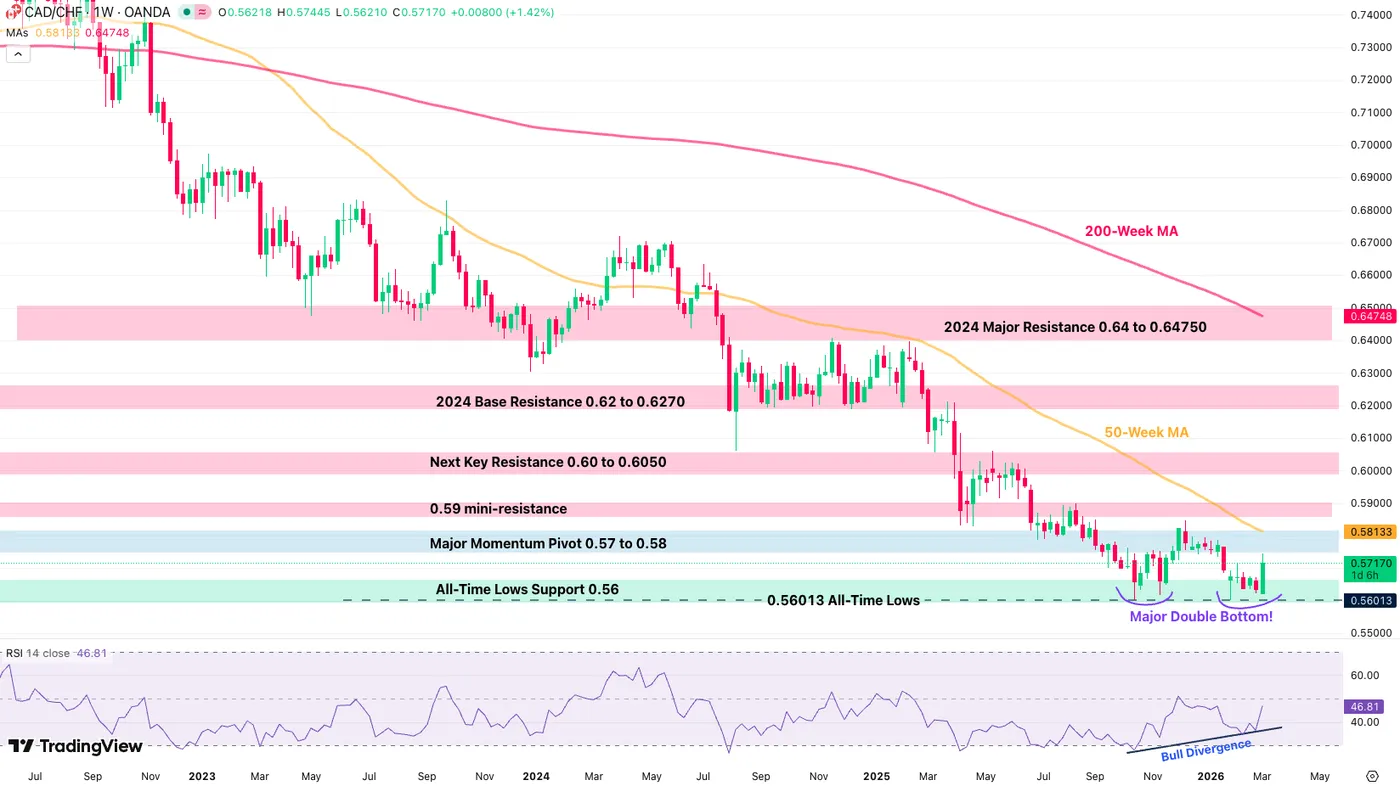
CAD/CHF Weekly Chart, March 5, 2026 – Source: TradingView
The Canadian Dollar has lost more than 25% of its value against the CHF since 2022 – But this trend looks to be reverting.
Contrarily to the more rangebound USD/CAD, momentum is taking a significant shift towards a rebounding trend after a weekly double-bottom and supported by a weekly bullish divergence.
The 50-Week MA will be the upcoming target for bulls who are attempting to grab control – Closing above it may easily relaunch the pair towards 0.60.
CAD/CHF Higher timeframe levels
Resistance Levels:
- Major Momentum Pivot 0.57 to 0.58 (50-Week MA 0.58133)
- 0.59 mini-resistance
- Next Key Resistance 0.60 to 0.6050
- 2024 Base Resistance 0.62 to 0.6270
- 2024 Major Resistance 0.64 to 0.64750 (200-Week MA)
Support Levels:
- All-Time Lows Support 0.56
- 0.56013 All-Time Lows
- Next Psychological Support 0.55
EUR/CAD Weekly Chart and Major Levels
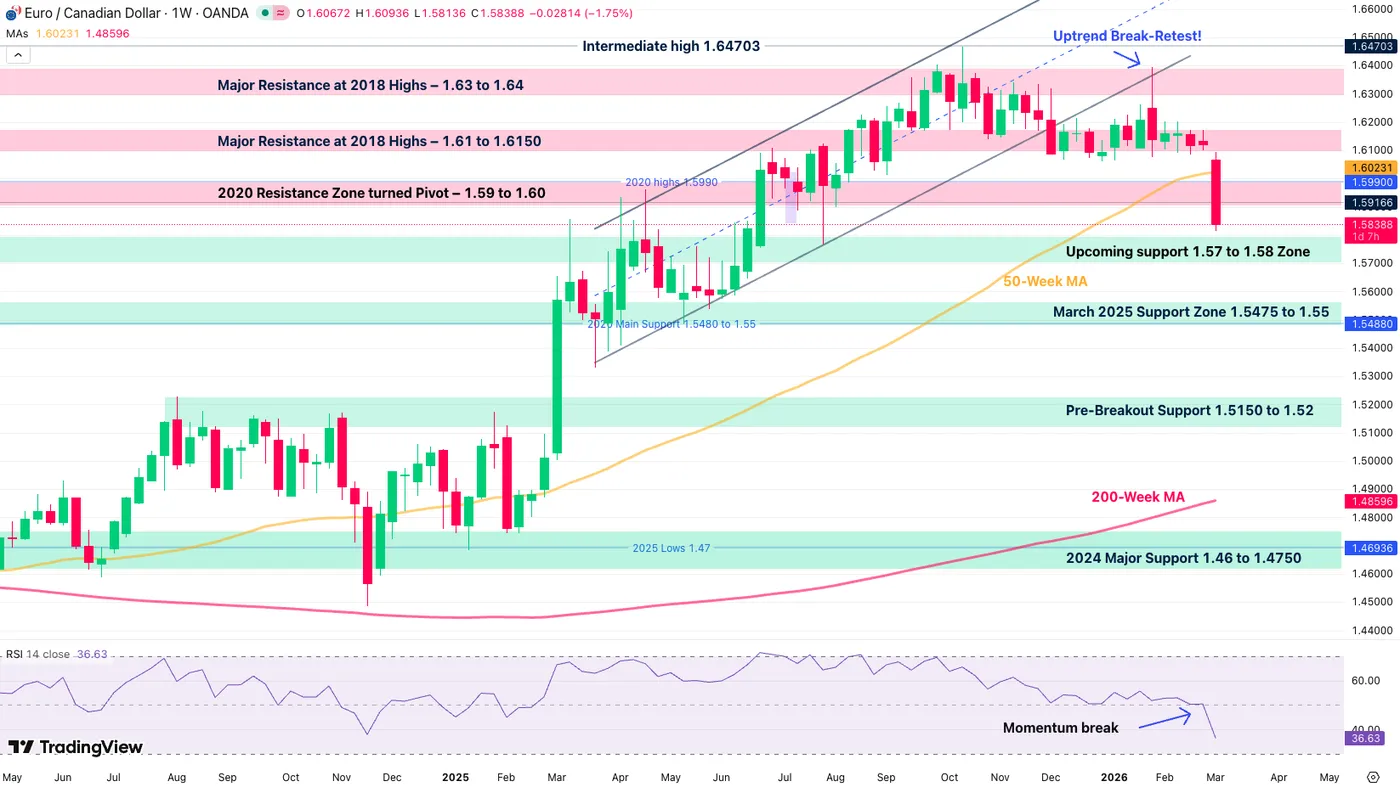
EUR/CAD Weekly Chart, March 5, 2026 – Source: TradingView
EUR/CAD is also seeing a significant shift in its trend throughout this week's break lower.
Now falling below its 50-Week Moving Average and crossing back below the significant 1.60 psychological level, sellers should remain in control all the way towards the 1.57 - 1.58 Major Support.
- Mean reversion there could assist a re-entry for further downside, particularly if prices retake the 1.59 level.
- Watch for selling acceleration on a weekly close below 1.57.
EUR/CAD Higher timeframe levels
Resistance Levels:
- 2020 Resistance Zone – 1.59 to 1.60
- 50-Week MA 1.6020
- Major Resistance at 2018 Highs – 1.61 to 1.6150
- Major Resistance at 2018 Highs – 1.63 to 1.64
- 16-Year high 1.64703
Support Levels:
- Upcoming support 1.57 to 1.58 Zone
- March 2025 Support Zone 1.5475 to 1.55
- Pre-Breakout Support 1.5150 to 1.52
- 2024 Major Support 1.46 to 1.4750
Eco Data 3/6/26
| GMT | Ccy | Events | Act | Cons | Prev | Rev |
|---|---|---|---|---|---|---|
| 08:00 | CHF | Foreign Currency Reserves (CHF) Feb | 710B | 712B | ||
| 10:00 | EUR | Eurozone GDP Q/Q Q4 F | 0.20% | 0.30% | 0.30% | |
| 13:30 | USD | Retail Sales M/M Jan | -0.20% | -0.20% | 0.00% | |
| 13:30 | USD | Retail Sales ex Autos M/M Jan | 0.00% | 0.00% | 0.00% | |
| 13:30 | USD | Nonfarm Payrolls Feb | -92K | 65K | 130K | 126K |
| 13:30 | USD | Unemployment Rate Feb | 4.40% | 4.30% | 4.30% | |
| 13:30 | USD | Average Hourly Earnings M/M Feb | 0.40% | 0.30% | 0.40% | |
| 15:00 | USD | Business Inventories Dec | 0.10% | 0.10% | 0.10% | 0.00% |
| 15:00 | CAD | Ivey PMIFeb | 56.6 | 51.2 | 50.9 |
| 08:00 | CHF |
| Foreign Currency Reserves (CHF) Feb | |
| Actual | 710B |
| Consensus | |
| Previous | 712B |
| 10:00 | EUR |
| Eurozone GDP Q/Q Q4 F | |
| Actual | 0.20% |
| Consensus | 0.30% |
| Previous | 0.30% |
| 13:30 | USD |
| Retail Sales M/M Jan | |
| Actual | -0.20% |
| Consensus | -0.20% |
| Previous | 0.00% |
| 13:30 | USD |
| Retail Sales ex Autos M/M Jan | |
| Actual | 0.00% |
| Consensus | 0.00% |
| Previous | 0.00% |
| 13:30 | USD |
| Nonfarm Payrolls Feb | |
| Actual | -92K |
| Consensus | 65K |
| Previous | 130K |
| Revised | 126K |
| 13:30 | USD |
| Unemployment Rate Feb | |
| Actual | 4.40% |
| Consensus | 4.30% |
| Previous | 4.30% |
| 13:30 | USD |
| Average Hourly Earnings M/M Feb | |
| Actual | 0.40% |
| Consensus | 0.30% |
| Previous | 0.40% |
| 15:00 | USD |
| Business Inventories Dec | |
| Actual | 0.10% |
| Consensus | 0.10% |
| Previous | 0.10% |
| Revised | 0.00% |
| 15:00 | CAD |
| Ivey PMIFeb | |
| Actual | 56.6 |
| Consensus | 51.2 |
| Previous | 50.9 |
Sunset Market Commentary
Markets
As bombings in the Middle-East continue, markets jump from headline to headline in search of something that might structurally change current dynamics. Today’s early focus went to Iran’s state-run Islamic Republic News Agency (IRNA). They said that deputy foreign minister Takht-Ravanchi commented in an interview with MS NOW on recent nuclear negotiations. The nation’s stockpile of highly enriched uranium “is the result of our practical achievements and that we are ready to get rid of it, provided we get something good in return”. Rewatching the interview, we couldn’t retrace those quotes. He did say that Iran is in defensive mode and that it didn’t had any contact with the US (or any other nation for that matter) since the start of the war. The IRNA article temporarily stopped the test of the $85/b area in Brent crude, but the correction lower didn’t went far. In the same vein, algo trading briefly lifted European stock markets into positive daily territory only to succumb those profits as the US trading session gained traction. The trade-weighted dollar spiked lower on the headlines, but that move won’t make it in this week’s highlights. Next talking points were an Iranian drone attack on Azerbaijan’s Naxcivan enclave which only broadened the conflict, Qatar reporting more missiles and drones being fired from Iran, UK PM Starmer confirming that UK jets were in the skies last night over Jordan and Qatar and the WSJ reporting that ship insurers are willing to work with US President Trump on the Straight of Hormuz cover. US defence secretary Hegseth will give a new press briefing later today.
The recap above highlights low visibility on the near or longer term developments in the conflict which Israeli and US officials say might last for weeks. In this context we err on the side of higher energy prices, weighing on both stocks and bonds and making USD the by default winner in FX space. For the record some levels which are prone to the developing story. EUR/USD holds around 1.16, so above first support at 1.1573. European and US equity indices currently lose about 0.5% with the EuroStoxx50 failing to really get away from the 5800 support area. The German yield curve bear flattens with yields adding between 3.7 bps (30-yr) and 10.2 bps (2-yr) with Minutes of the previous ECB meeting suggesting that the current policy rate allows enough flexibility to react to shocks. Current patience should not be mistaken for being hesitant to act or being asymmetric. The market implied probability of a September rate hike is now 50%. German Bunds and UK Gilts underperform US Treasuries today.
News & Views
Swedish inflation fell short of expectations in February. The CPIF headline gauge (using a fixed interest rate) eased from 2% to 1.7% vs 1.8% expected with the monthly pace coming in at 0.6%. Core CPIF missed the annual bar by the same margin with the 1.4% the lowest outcome since August 2021. The Riksbank itself had penciled in a much lower 1.3% in the December projections for the overall figure while expecting core inflation at 1.7%. Sweden’s central bank kept the policy rate unchanged at 1.75% during the end-January policy meeting and expects it to remain at that level for some time to come. We do not think today’s inflation numbers throw the Riksbank off-track. Sweden’s economy grew at a solid pace at the end of last year despite the large amount of (geopolitical) uncertainty, the central bank said, with household consumption continuing to rise and the labour market showing increasingly clear signs of improvement. With risks since this week clearly tilted to the upside, the Riksbank has every reason to wait things out. The CPI print barely left a dent in SEK. EUR/SEK is trading a tad higher in the 10.68 area.
UK CFOs in the Bank of England monthly Decision Maker Panel lowered their year-ahead inflation expectations by 0.1 ppt to 3.1% in the three months to February, the lowest since February 2025. The 3-year gauge inched lower similarly, to 2.8%. They reported annual wage growth at 4.3% (-0.1 ppt) and expected wages to grow 3.6% (unchanged) in the year ahead, implying a 0.7 ppt cooldown over the next 12 months. Annual employment growth was -0.2%, which was less of a contraction than the -0.5% in the three months to January. Expectations for employment growth over the next year improved slightly, rising by 0.3 ppts to 0.1%. It’s the first positive reading since August of last year. In terms of the central bank rate, the three-month ahead expectations indicator stood at 3.5% with the year- and three-year series printing at 3.2% and 3.1% respectively. It should be noted that the survey was conducted between Feb 6 and Feb 20, before the recent sharp increase in energy prices.