
Sample Category Title
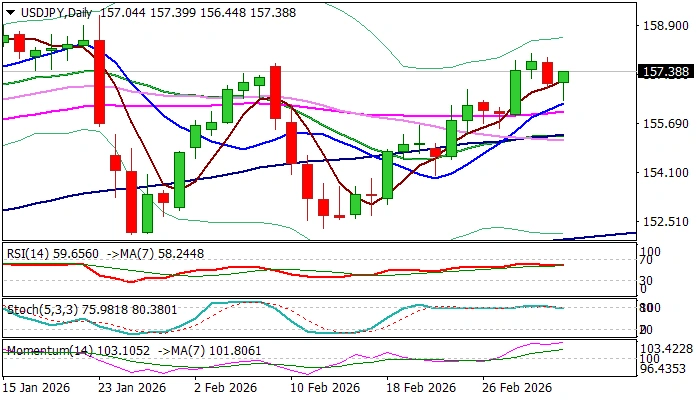
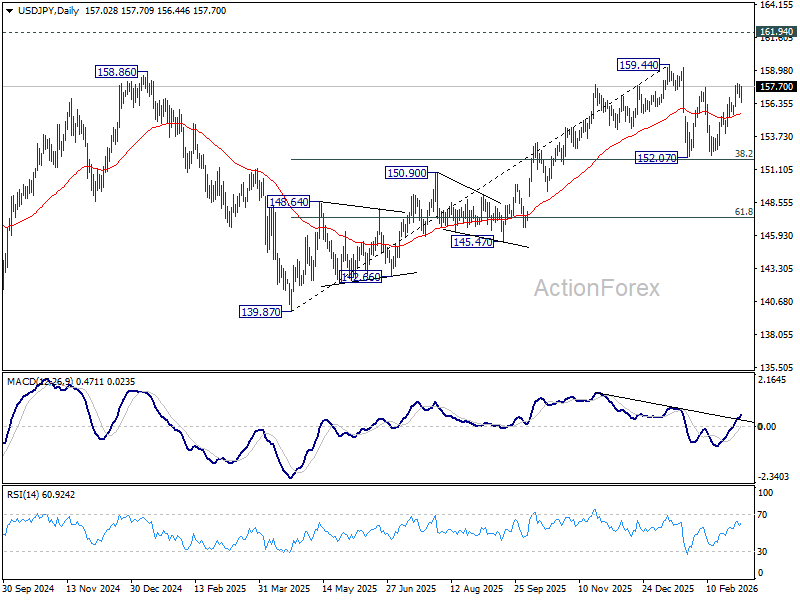
USD/JPY: Larger Bulls Gain Traction After Limited Pullback
USDJPY strengthened on Thursday after a pullback from new multi-week high (157.96, hit on Mar 3) was contained by rising 10DMA (156.34).
Thursday’s action has so far been shaped in a Hammer candle that signals potential end of a shallow correction (157.96/156.44).
Overall structure remains firmly bullish on daily chart, supported by strong positive momentum and multiple bull-crosses of daily MA’s (in bullish configuration), contributing to signals of bullish continuation of the upleg from 152.26 (Feb 12 low) following violation of key barrier at 157.65 (former top of Feb 9).
The notion is supported by strengthening dollar on increased safe-haven demand and fading expectations for Fed rate cuts, as deepening geopolitical crisis threatens of boosting inflation.
Bulls look for retest and clear break of Tuesday’s peak at 157.96 that would confirm fresh bullish signal and a double bottom at 152.11/26) and expose targets at 159.22/45 (tops of Jan 23/14).
Initial supports lay at 156.62/34 (Fibo 23.6% of 152.26/157.96 / 10DMA), followed by 155.98 (daily Tenkan-sen) and more significant 155.79 (Fibo 38.2%/top of thin daily cloud) which should contain potential dips and keep larger bulls in play.
Res: 157.65; 157.89; 158. 90; 159.22.
Sup: 156.62; 156.34; 155.98; 155.79.
Crypto: An Encouraging Rebound in a Bear Market
Market Overview
The crypto market cap rose 4.8% to $2.45 trillion, then climbed to $2.50 trillion at the end of the day on Wednesday, a four-week high. This is a strong indication of a base forming and a reversal to growth. The capitalisation level is approaching the 50-day moving average, below which it has been steadily trading since the end of January. Consolidation above this line could be an additional signal of a reversal to growth.
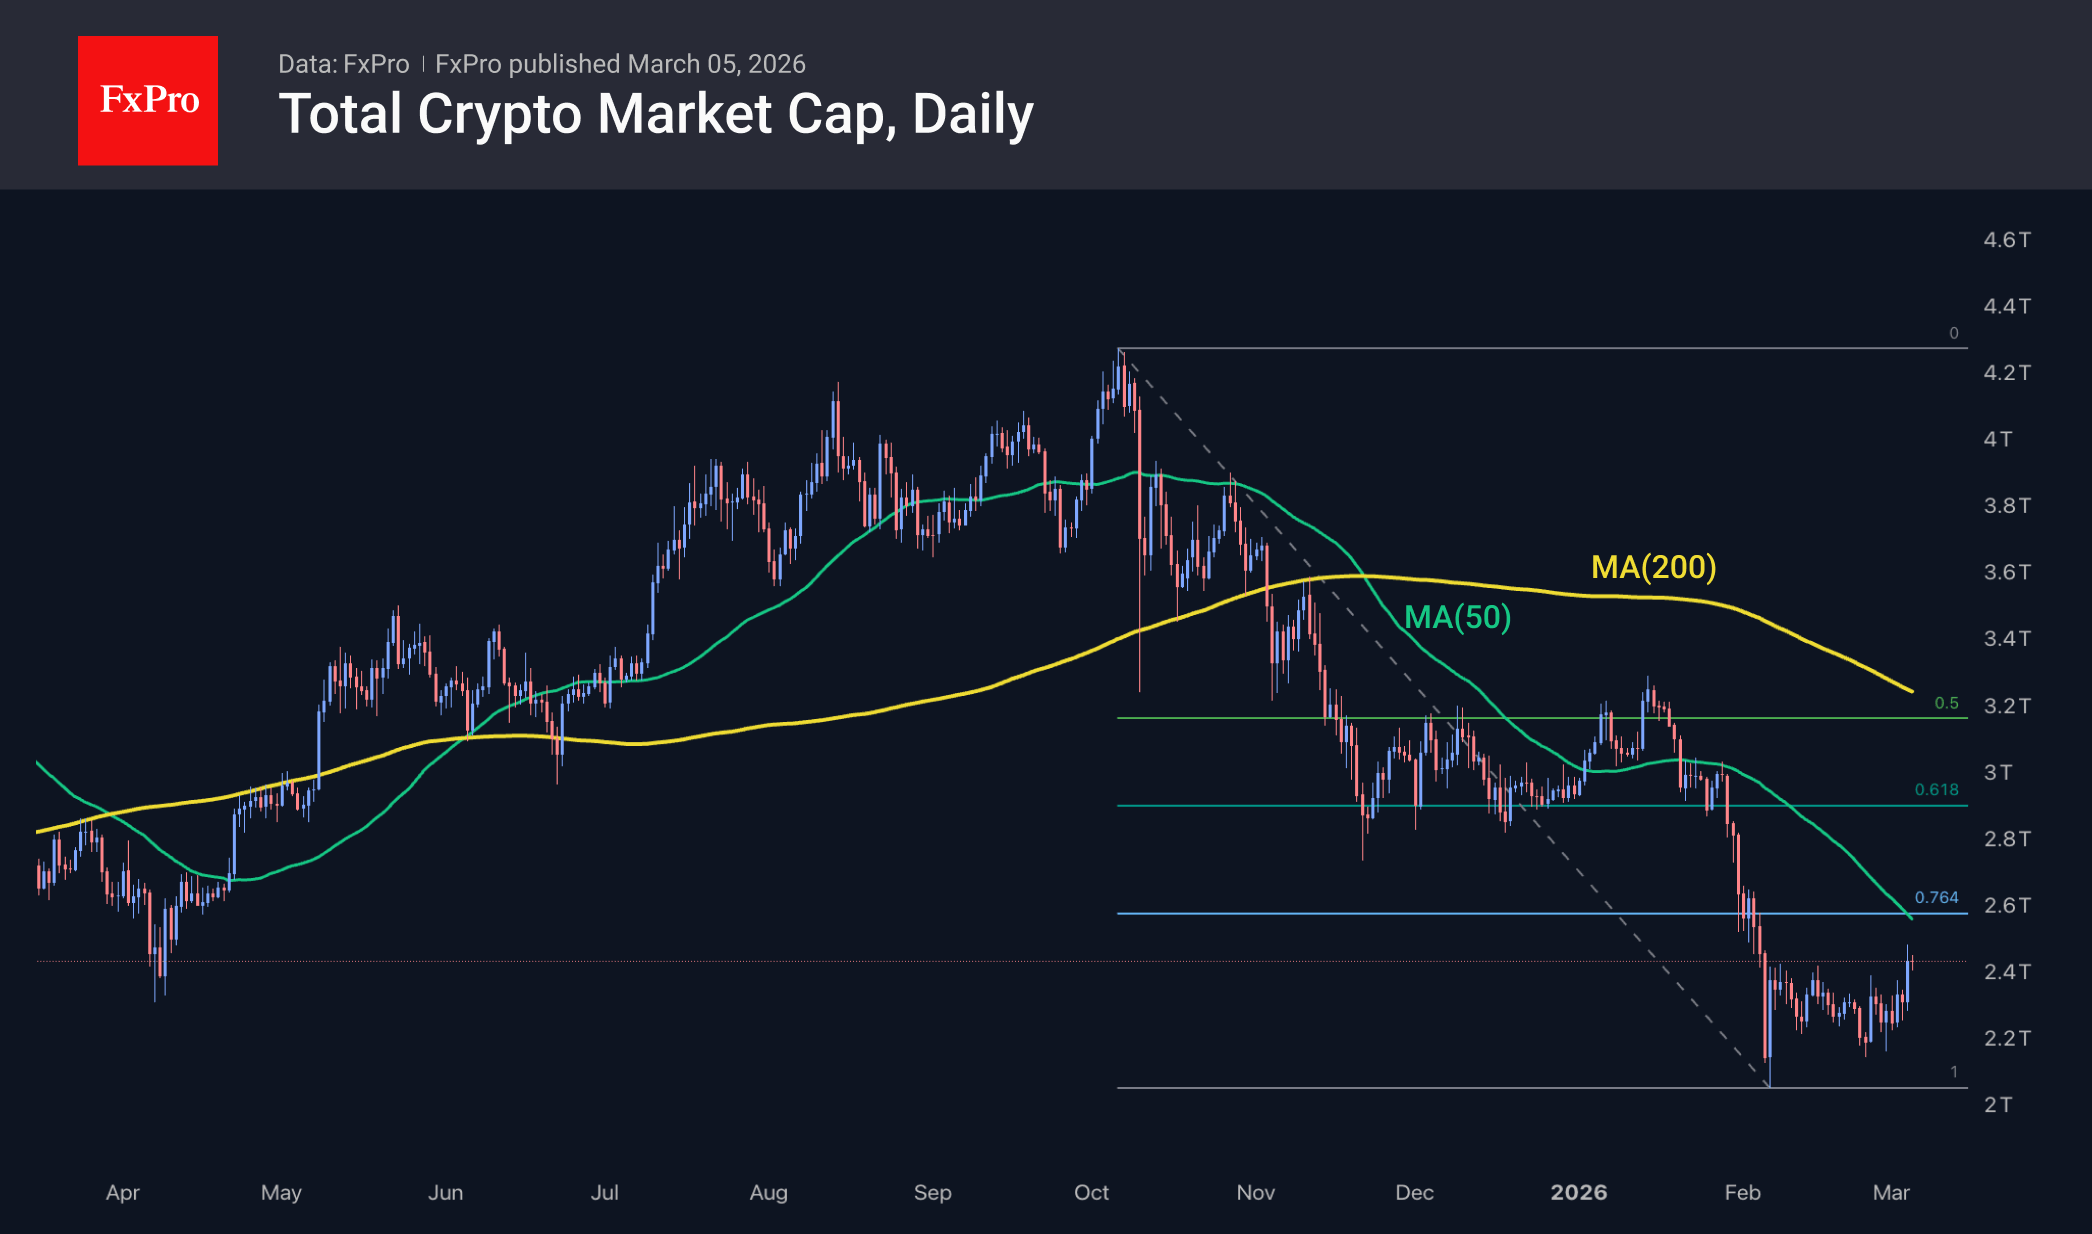
On the other hand, this may be just a corrective rebound, as the typical Fibonacci correction range suggests a rebound to $2.53T for the decline since January and to $2.92T as part of a technical recovery from the entire decline since the October peak. Thus, despite the encouraging momentum, this may be nothing more than a rebound in a bear market.
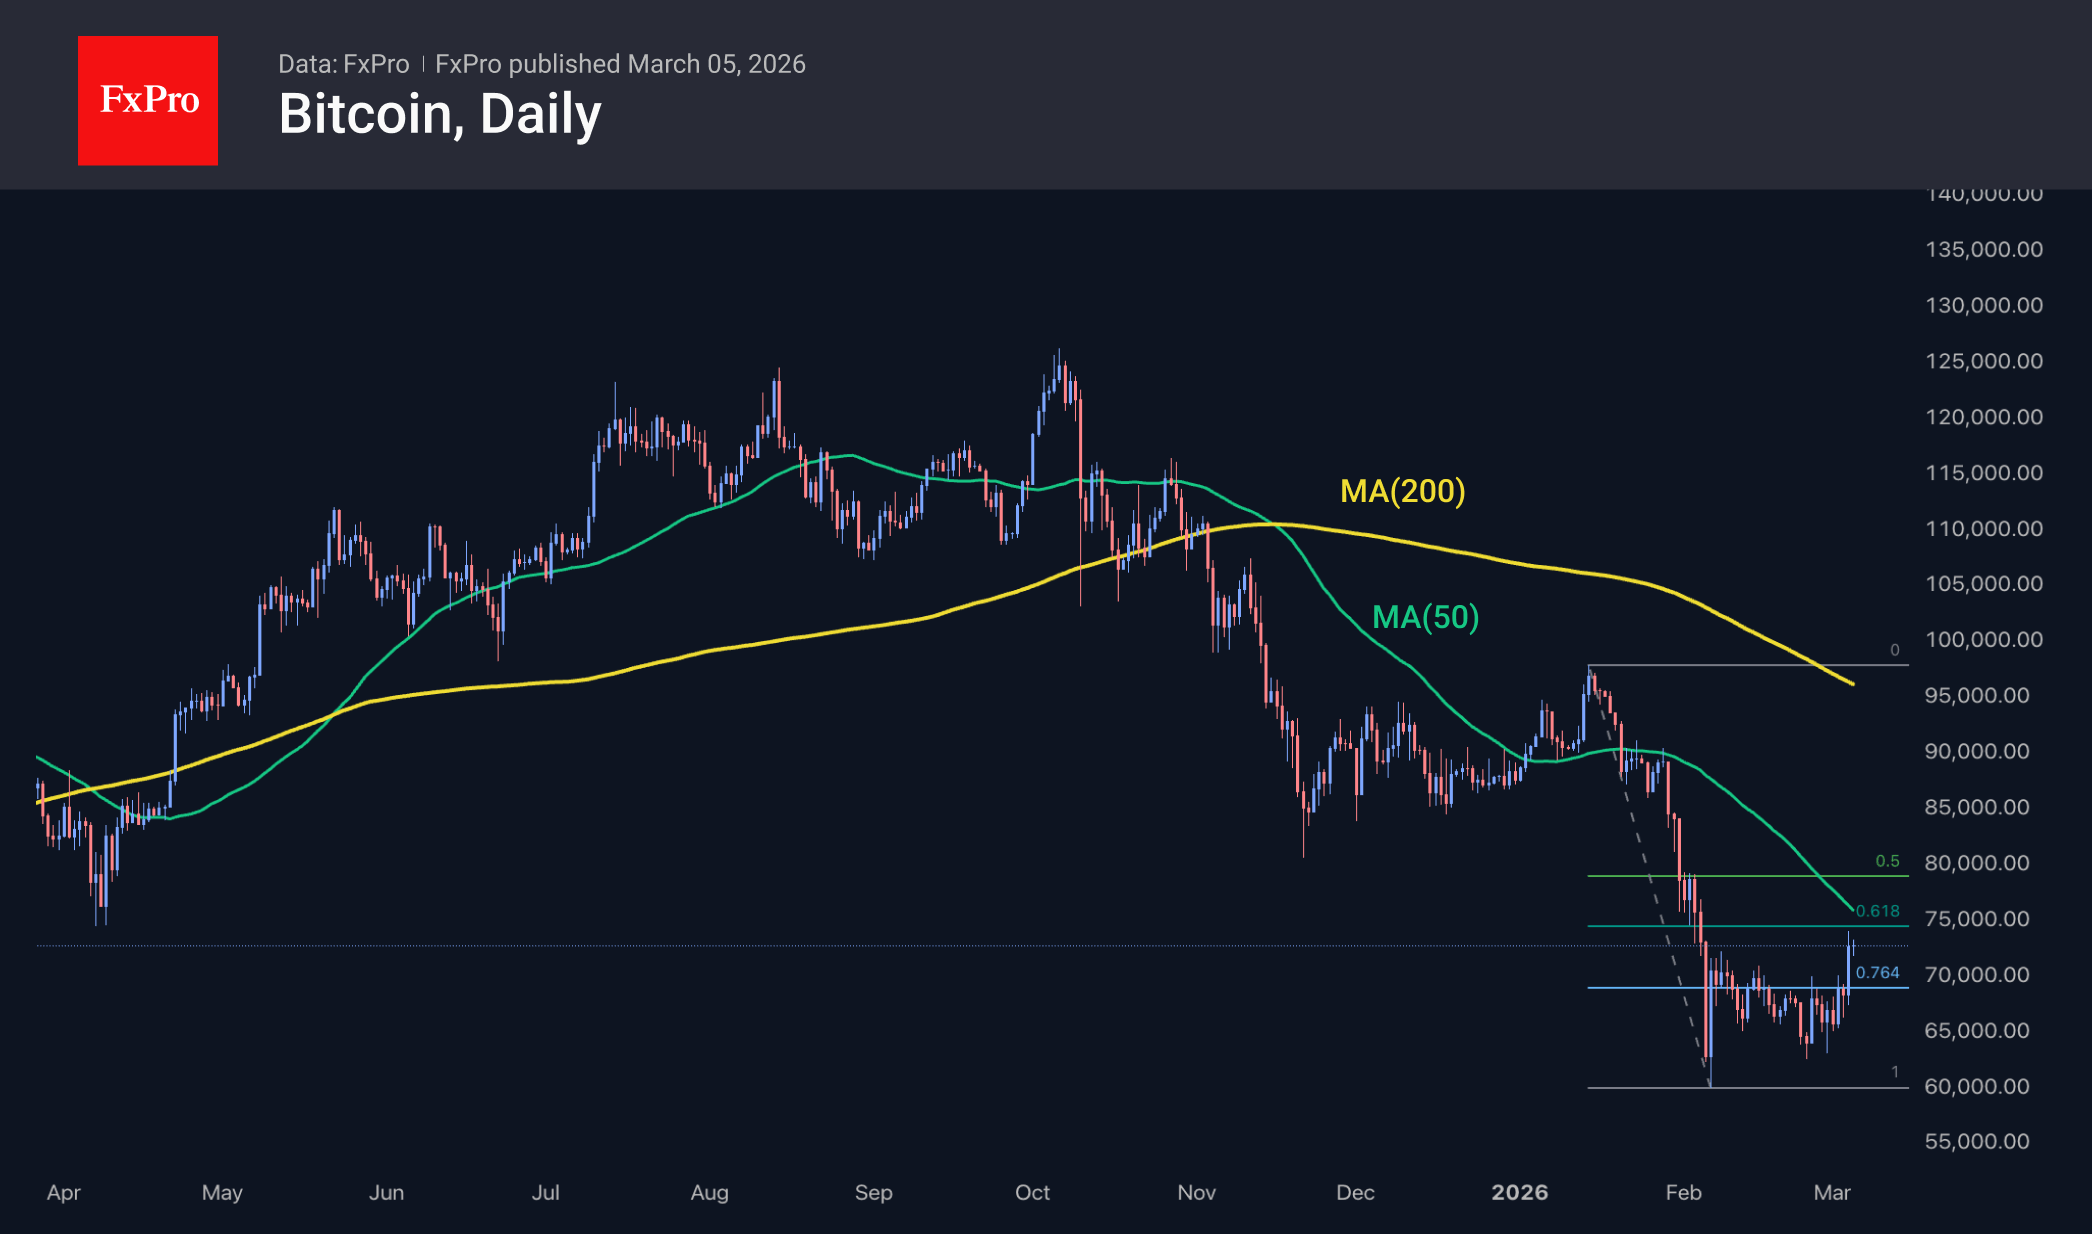
Bitcoin rose to $74K, breaking through the resistance area of the last four weeks with an encouraging surge. We attribute the magnitude of the short squeeze to the confidence of bears who pulled their stops too close to the market price. The recovery lost momentum near the 61.8% level of the January-February decline and just short of the 50-day moving average. Simply put, the bulls still have to convince the community that the bear market is over.
News Background
Bitcoin jumped above $74K on Wednesday, to its highest level in a month, amid active inflows into US spot Bitcoin ETFs, totalling $1.4 billion over the last five trading sessions.
After five months of decline, Bitcoin has entered the third deepest oversold zone in its history, according to K33 Research. Historically, after such a bear market, the average 90-day return has been 62% (with a 78% probability).
The Kraken crypto exchange was the first to gain access to the US Federal Reserve’s payment system. Now, the crypto exchange’s subsidiary bank can use the central bank’s payment infrastructure alongside other American banks.
According to BitcoinTreasuries, public mining companies are selling off their cryptocurrency reserves en masse. The proceeds are being used to create infrastructure for artificial intelligence.
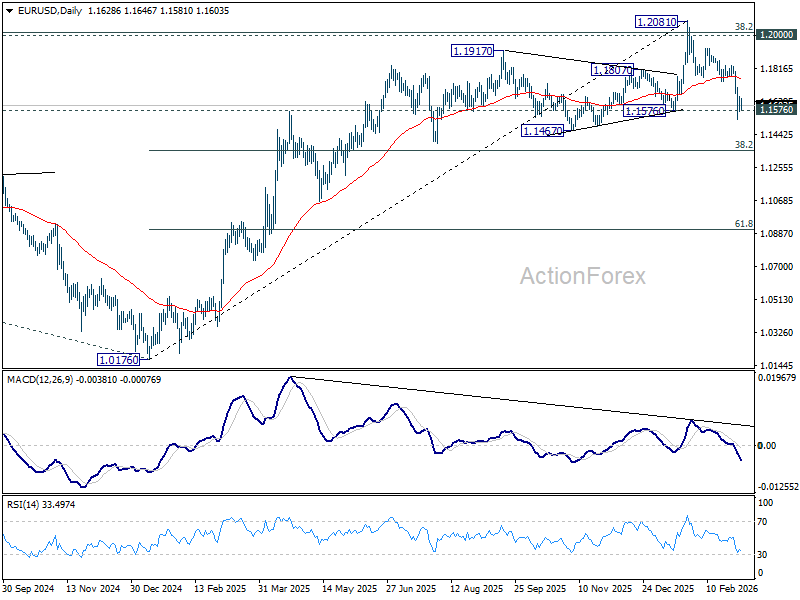
EUR/USD Mid-Day Outlook
Daily Pivots: (S1) 1.1590; (P) 1.1622; (R1) 1.1670; More….
EUR/USD is staying in consolidations above 1.1529 temporary low and intraday bias stays neutral. On the downside, below 1.1529 will resume the fall from 1.2081. Sustained break of 1.1576 structural support would confirm rejection by 1.2 key psychological level. That should also confirm medium term topping on bearish divergence condition in D MACD. Further decline should be seen to 38.2% retracement of 1.0176 to 1.2081 at 1.1353 next. However, firm break of 1.1740 support turned resistance will revive near term bullishness, and bring stronger rebound back to retest 1.2081 high.
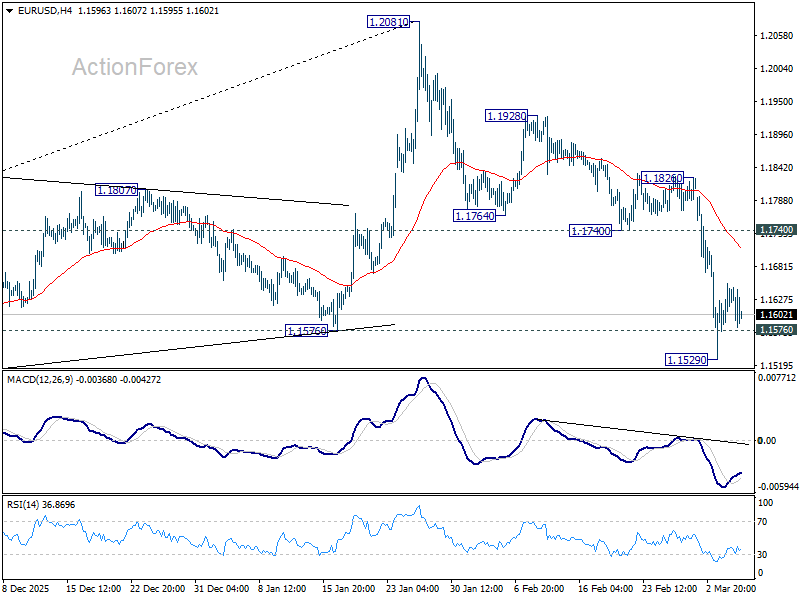
In the bigger picture, as long as 55 W EMA (now at 1.1494) holds, up trend from 0.9534 (2022 low) is still in favor to continue. Decisive break of 1.2 key psychological level will add to the case of long term bullish trend reversal. Next medium term target will be 138.2% projection of 0.9534 to 1.1274 from 1.0176 at 1.2581. However, sustained trading below 55 W EMA will argue that rise from 0.9534 has completed as a three wave corrective bounce, and keep long term outlook bearish.
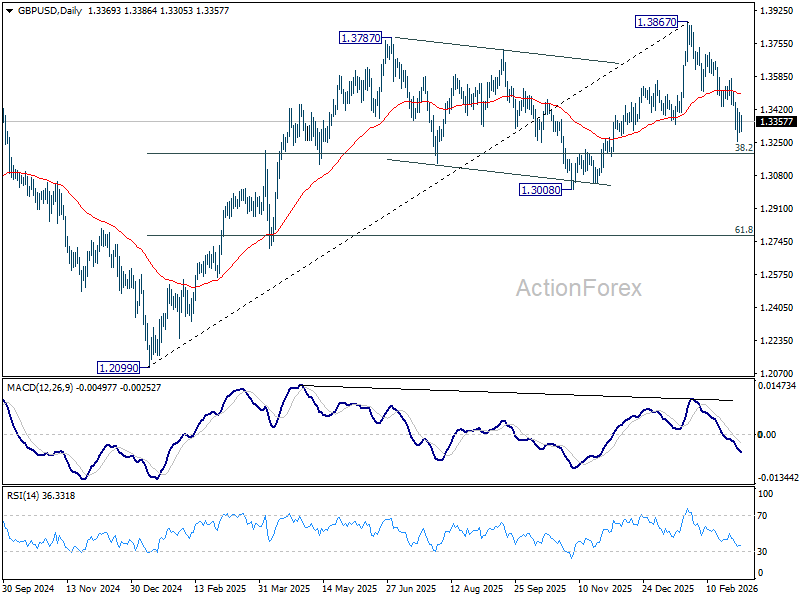
GBP/USD Mid-Day Outlook
Daily Pivots: (S1) 1.3318; (P) 1.3361; (R1) 1.3417; More...
GBP/USD is staying in consolidations above 1.3252 temporary low and intraday bias stays neutral. Fall from 1.3867 should at least be correcting the rise from 1.2009. Below 1.3252 will target 38.2% retracement of 1.2099 to 1.3867 at 1.3192. Sustained break there will pave the way to 1.3008 support. For now, risk will stay on the downside as long as 1.3574 resistance holds, in case of recovery.
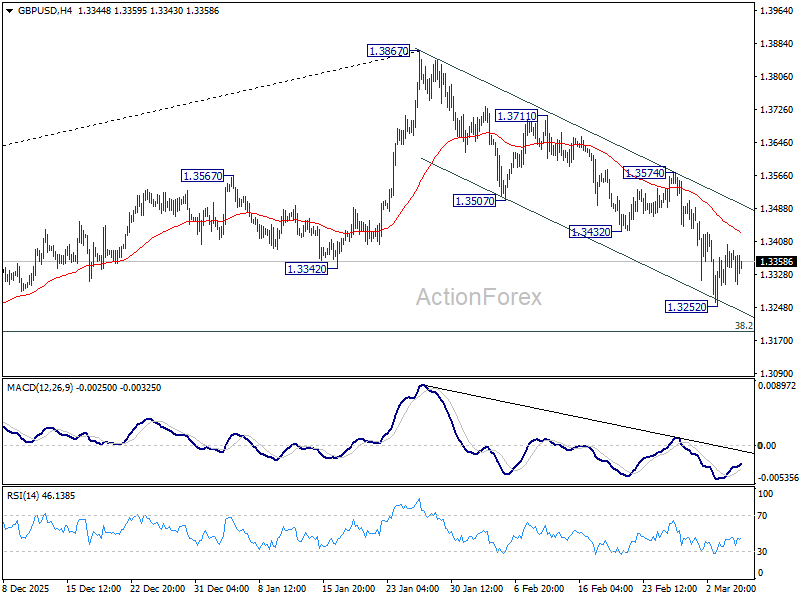
In the bigger picture, as long as 1.3008 support holds, rise from 1.3051 (2022 low) should still be in progress for 1.4284 key resistance (2021 high). Decisive break there will add to the case of long term bullish trend reversal. However, firm break of 1.3008 will raise the chance of medium term bearish reversal and target 1.2099 support next.
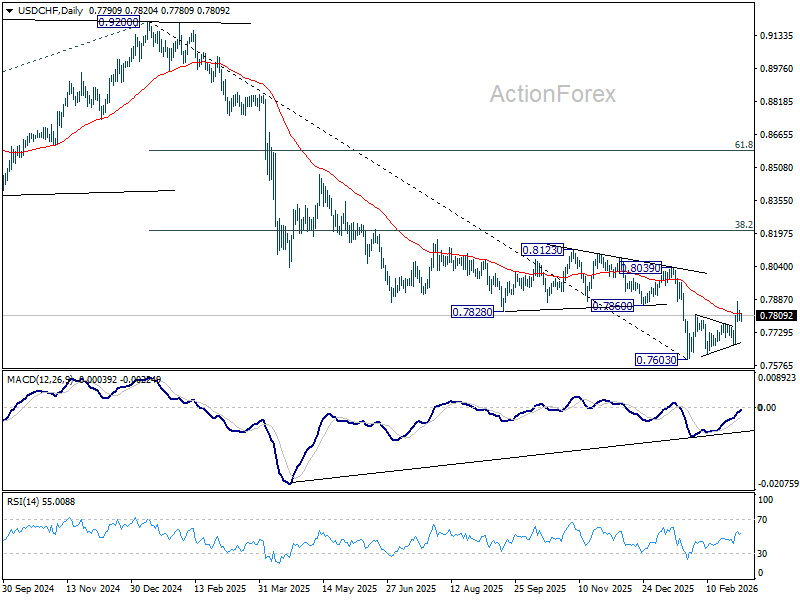
USD/CHF Mid-Day Outlook
Daily Pivots: (S1) 0.7765; (P) 0.7812; (R1) 0.7838; More….
No change in USD/CHF's outlook and intraday bias remains neutral. More consolidations could be seen below 0.7877 temporary top first. Further rise is expected as long as 0.7671 support holds. Rebound from 0.7603 is seen as correcting the whole fall from 0.9022. Above 0.76877 will target 0.8039 resistance next.
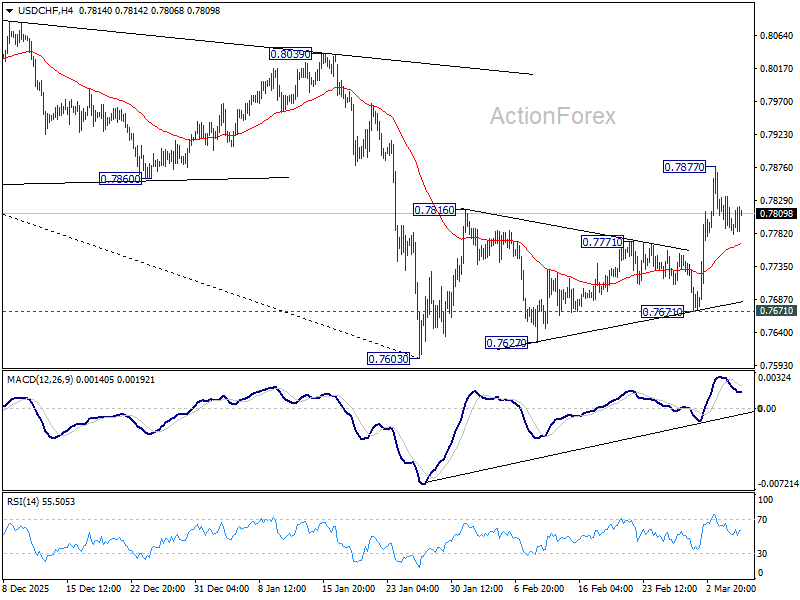
In the bigger picture, a medium term bottom could be in place at 0.7603 on bullish convergence condition in D MACD, Firm break of 0.8039 resistance will argue that it's at least correcting the down trend from 0.9002. Stronger rebound would then be seen to 38.2% retracement of 0.9200 to 0.7603 at 0.8213.
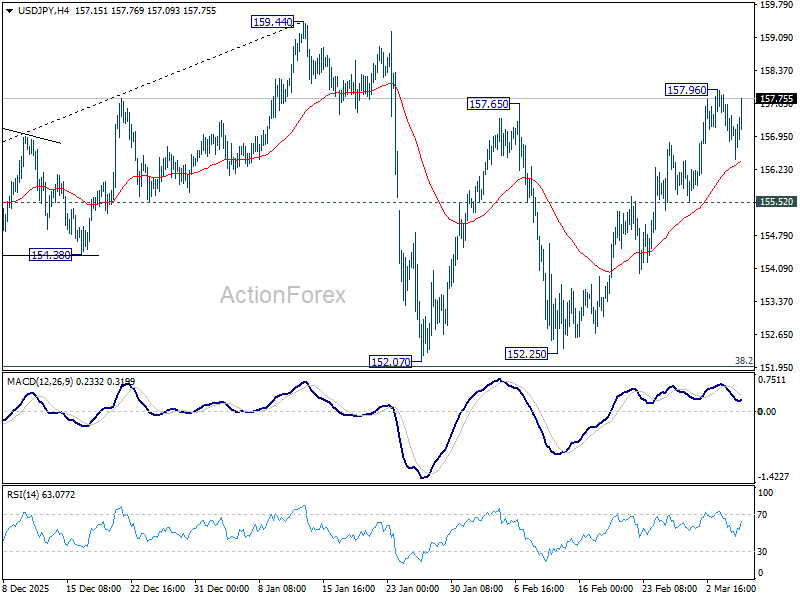
USD/JPY Mid-Day Outlook
Daily Pivots: (S1) 156.64; (P) 157.26; (R1) 157.65; More...
USD/JPY recovered ahead of 55 4H EMA, but stays below 157.96 temporary top so far. Intraday bias stays neutral first. On the upside, above 157.96 will extend the rebound from 152.25 to retest 159.44 high. On the downside, though, break of 155.52 will bring deeper fall back to 152.07/152.25 support zone. Overall, price actions from 159.44 are viewed as a near term consolidation pattern. Outlook will remain bullish as long as 38.2% retracement of 139.87 to 159.44 at 151.96 holds.
In the bigger picture, outlook is unchanged that corrective pattern from 161.94 (2024 high) should have completed with three waves at 139.87. Larger up trend from 102.58 (2021 low) could be ready to resume through 161.94. This will remain the favored case as long as 55 W EMA (now at 152.16) holds. However, sustained break of 55 W EMA will argue that the pattern from 161.94 is extending with another falling leg.
Dollar Firm While Traders Wait for War Clarity and US Jobs Data
Global markets have shifted into a cautious pause after the relief rally that began on Wall Street yesterday and carried through the Asian session. The initial wave of panic selling earlier in the week has subsided, but investors are not yet ready to push risk assets decisively higher. Instead, trading activity has slowed as markets wait for clarity on two major uncertainties.
The first unknown remains the Middle East conflict. The key debate is whether the current military campaign will remain a short, concentrated operation or evolve into a prolonged confrontation. The outcome carries significant implications not just for geopolitics but also for the global inflation outlook.
Supporters of the “short war” scenario argue that the strategy of leadership decapitation and infrastructure degradation has severely damaged Iran’s ability to coordinate sustained military operations. In this view, the weakening of centralized command structures could eventually force either a rapid collapse in resistance or a relatively quick regime transition.
Others, however, warn that such optimism may underestimate Iran’s military doctrine. The country’s “Mosaic Defense” system deliberately decentralizes authority across multiple regional commands designed to operate independently. Even without direct coordination from Tehran, these autonomous cells could continue to wage asymmetric warfare.
For financial markets, the distinction between these scenarios is crucial. If the conflict remains contained to a few weeks, the current spike in oil prices may be treated as a temporary shock. Energy costs would rise briefly before stabilizing, allowing central banks to look through the inflation impact.
However, a prolonged confrontation could generate a much more problematic dynamic. Persistent disruptions to energy flows and shipping routes would likely produce a structural cost-push inflation cycle, complicating the policy outlook for central banks already grappling with fragile disinflation trends.
While geopolitics dominates the headlines, markets are also preparing for another major catalyst: the upcoming US Non-Farm Payrolls report. Following stronger-than-expected ADP private payroll data, expectations for a weak labor report have diminished significantly. This shift has already pushed market pricing for Fed rate cuts further into the future. Investors have scaled back bets on easing in the first half of 2026, reflecting confidence that the US economy remains resilient despite elevated interest rates.
The real risk for markets, however, lies in the wage component of the report. A strong jobs number combined with rising average hourly earnings could signal that inflation pressures remain persistent, particularly if energy prices remain elevated due to the geopolitical situation. In such a scenario, the Fed could face a renewed inflation risk. That environment would likely push policymakers toward an extended policy pause—and potentially even reopen the debate about whether the next move might eventually be another rate hike.
In currency markets, positioning reflects this cautious environment. Loonie is now the strongest performer this week, supported by elevated oil prices, followed by Dollar and Yen. At the other end of the spectrum, the Euro sits at the bottom of the rankings, followed by Swiss Franc and New Kiwi, while Sterling and the Aussie occupy the middle ground.
In Europe, at the time of writing, FTSE is down -0.17%. DAX is down -0.18%. CAC is down -0.26%. UK 10-year yield is up 0.078 at 4.454. Germany 10-year yield is up 0.065 at 2.822. Earlier in Asia, Nikkei rose 1.90%. Hong Kong HSI rose 0.28%. China Shanghai SSE rose 0.64%. Singapore Strait Times rose 0.70%. Japan 10-year JGB yield rose 0.039 at 2.158.
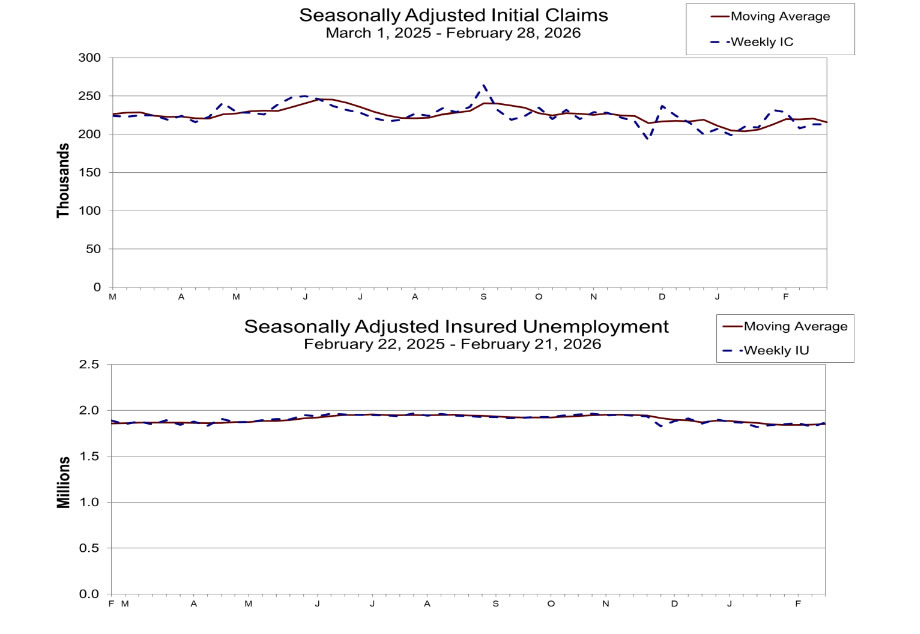
US initial jobless claims unchanged at 213k, vs exp 215k
US initial jobless claims were unchanged at 213k in the week ending February 28, slightly below expectation of 215k. Four-week moving average of initial claims fell -5k to 215k. Continuing claims rose 46k to 1,868k in the week ending February 21. Four-week moving average of continuing claims rose 7k to 1,852k.
ECB officials split between caution and baseline calm on war risks
ECB policymakers signaled caution today as they assessed the potential economic fallout from the escalating conflict involving Iran. While acknowledging the risk that higher energy prices could complicate the inflation outlook, officials indicated that the situation does not yet warrant a shift in monetary policy.
ECB Vice President Luis de Guindos said the bank’s "baseline" scenario assumes the conflict will prove "short-lived". However, he warned that a longer war could begin to influence inflation expectations, particularly if energy prices remain elevated for an extended period.
Finnish Governing Council member Olli Rehn took a more cautious stance, warning against assuming a quick resolution. He noted that the conflict had already had "quite some escalation", and could create a difficult macroeconomic combination of higher inflation and weaker growth across the Eurozone
At the same time, French Governing Council member Francois Villeroy de Galhau emphasized that the current situation does not justify a rate hike. Speaking to French radio, the central bank will continue to monitor developments carefully and assess policy decisions on a meeting-by-meeting basis.
Eurozone retail sales slip -0.1% mom in January as non-food spending weakens
Eurozone retail sales slipped -0.1% mom in January, falling short of expectations for a 0.2% increase. Looking at the breakdown, spending on food, drinks and tobacco rose 0.3%, providing the only notable source of support. However, this was more than offset by declines in other categories.
Non-food retail sales (excluding fuel) dropped -0.2% in Eurozone, while automotive fuel sales fell sharply by -1.1%, reflecting both weaker mobility demand and softer energy consumption after the holiday period.
Across the broader EU, retail sales also declined -0.1% mom. The strongest increases were recorded in Estonia (+4.4%), Latvia (+2.8%), and Portugal (+2.0%), while the steepest declines were seen in Slovakia (-3.5%), Slovenia (-1.9%), and Croatia (-1.3%).
China’s new growth target reflects strategic economic transition
Chinese Premier Li Qiang unveiled Beijing’s economic priorities for the year during the annual government work report at the National People's Congress, setting the country’s GDP growth target at 4.5% to 5%. The range represents a slight step down from the “around 5%” goal used in the past three years.
The introduction of a target range rather than a single figure signals a more flexible policy approach. By allowing growth to fluctuate between 4.5% and 5%, policymakers are granting themselves greater room to manage domestic challenges without the pressure of hitting a rigid numerical target.
Those challenges remain significant. China’s economy continues to grapple with a prolonged property sector downturn, persistent industrial overcapacity, and uneven domestic demand. Against that backdrop, the leadership appears increasingly focused on stability rather than aggressive expansion.
The new target also highlights Beijing’s strategic shift toward “high-quality” growth. Instead of pursuing rapid expansion through debt-fueled infrastructure or property stimulus, policymakers are emphasizing technology development, advanced manufacturing, and consumption as the core engines of growth.
Other policy targets announced in the report reinforce this balanced approach. Inflation is projected to run around 2%, reflecting authorities’ efforts to guard against deflation risks. The unemployment rate is expected to remain below 5.5%, while the fiscal deficit is set at 4% of GDP, suggesting a somewhat more proactive fiscal stance to support economic activity.
USD/JPY Mid-Day Outlook
Daily Pivots: (S1) 156.64; (P) 157.26; (R1) 157.65; More...
USD/JPY recovered ahead of 55 4H EMA, but stays below 157.96 temporary top so far. Intraday bias stays neutral first. On the upside, above 157.96 will extend the rebound from 152.25 to retest 159.44 high. On the downside, though, break of 155.52 will bring deeper fall back to 152.07/152.25 support zone. Overall, price actions from 159.44 are viewed as a near term consolidation pattern. Outlook will remain bullish as long as 38.2% retracement of 139.87 to 159.44 at 151.96 holds.
In the bigger picture, outlook is unchanged that corrective pattern from 161.94 (2024 high) should have completed with three waves at 139.87. Larger up trend from 102.58 (2021 low) could be ready to resume through 161.94. This will remain the favored case as long as 55 W EMA (now at 152.16) holds. However, sustained break of 55 W EMA will argue that the pattern from 161.94 is extending with another falling leg.
US initial jobless claims unchanged at 213k, vs exp 215k
US initial jobless claims were unchanged at 213k in the week ending February 28, slightly below expectation of 215k. Four-week moving average of initial claims fell -5k to 215k.
Continuing claims rose 46k to 1,868k in the week ending February 21. Four-week moving average of continuing claims rose 7k to 1,852k.
ECB Minutes: Rates seen steady for extended period, but outlook fragile
The account of the February policy meeting of the ECB revealed a broadly stable but "fragile" outlook for the Eurozone economy. Policymakers maintained that growth remained resilient and inflation was still projected to hover around the 2% target, but emphasized that "significant risks and uncertainties" continued to cloud the outlook.
Members stressed the need to monitor not only major risks but also “subtle trends” that could gradually derail the projected inflation path. Particular attention will be paid to wage dynamics and services inflation, which remain key gauges of underlying price pressures. The upcoming March staff projections are expected to provide further clarity, especially following recent "downward surprises" in both inflation data and growth momentum.
Financial conditions and external developments were also highlighted as important factors. Policymakers said bank lending conditions, exchange rate movements, trade diversion effects, and consumption trends will all need to be closely watched to assess the "risks of a more pronounced or prolonged undershooting of the inflation target."
Against this backdrop, the accounts suggested that interest rates could "remain at their current levels for an extended period" if incoming data does not significantly alter the baseline outlook. While the near-term dip in inflation has long been anticipated, some members warned that risks are increasingly tilted to the downside, reinforcing the need for vigilance to prevent a sustained undershooting of the ECB’s inflation target.
(ECB) Monetary policy accounts
Account of the monetary policy meeting of the Governing Council of the European Central Bank held in Frankfurt am Main on Wednesday and Thursday, 4-5 February 2026
5 March 2026
1. Review of financial, economic and monetary developments and policy options
Financial market developments
Ms Schnabel started her presentation by noting that, since the Governing Council’s previous monetary policy meeting on 17-18 December 2025, geopolitical uncertainty had spiked and trade policy uncertainty had rebounded briefly to summer 2025 levels. Stock market volatility had, however, edged up only slightly, far less than during previous stress episodes, while bond market volatility had hardly reacted to the risk shocks and had continued its downward trajectory. Investor risk appetite had also remained largely unaffected by the recent turbulence, and risk appetite indices for the euro area and the United States stood near their highest level since the global financial crisis of 2008.
Two factors explained the overall contained market reaction. The first factor had been a change in the reaction to risk-off shocks, with investors appearing to be increasingly looking through the noise. Whereas the US tariff announcement on 2 April 2025 had triggered sharp corrections across asset markets as investors rebalanced away from riskier and US dollar-denominated assets into safer non-US dollar-denominated assets, the 17 January 2026 tariff threat linked to the United States’ interest in Greenland had led to only short-lived corrections across equity and bond markets. The only asset classes that had exhibited similar two-week reactions to the two episodes had been gold and the US dollar’s effective exchange rate. In January 2026, investors had maintained a risk-on stance while increasingly hedging against tail risks by reallocating towards precious metals and gradually reducing their exposures to US dollar-denominated assets. High-frequency investment-flow data showed that euro area-domiciled investment funds had recently reduced their relative exposures to US assets. Since the Governing Council’s December meeting, euro area-domiciled funds investing in US bonds and equities had attracted smaller inflows than funds investing in western European bonds and equities. Such flow dynamics, in combination with increased hedging of US dollar exposures, had contributed to the recent sharp depreciation of the dollar in nominal effective terms against a broad set of currencies, including the euro. The euro had appreciated by 1% against the US dollar since the previous meeting, while, in nominal effective terms, it had depreciated by 0.3% over the same period, showing that its rise against the US dollar had been driven entirely by dollar weakness rather than euro strength.
Looking in more detail at the drivers and risks affecting the EUR/USD exchange rate, the exchange rate had decoupled further from interest rate differentials. In other words, the weakening of the US dollar had not been driven primarily by monetary policy expectations. Most of the euro’s appreciation since December 2025 had been explained by risk shocks, which had been dollar-negative, as they had emanated predominantly from the United States itself. Euro area and US monetary policy had had a smaller and, on net, broadly neutral impact on the exchange rate.
The second factor explaining the contained market fallout from US actions had been the continued resilience of the global economy. Incoming macroeconomic data had mostly surprised on the upside over the past six months, in both the euro area and the United States, reflecting the robust and stronger than expected growth momentum on both sides of the Atlantic.
Euro area inflation fixings, which were linked to the Harmonised Index of Consumer Prices (HICP) excluding tobacco, had been revised up since the Governing Council’s December monetary policy meeting. After some fluctuations for the first half of 2026, largely reflecting energy-related base effects, inflation fixings currently hovered around 1.8% for the second half of 2026. This corresponded to roughly 1.9% when allowing for an estimate of the tobacco component. A decomposition of the upward revision to 2026 inflation fixings showed that higher oil prices and higher industrial metal prices were the main contributors to the substantial increase (of up to 30 basis points) in inflation compensation. By contrast, the appreciation of the euro against the US dollar had had only a modest dampening effect on the market’s inflation outlook.
Uncertainty around the ECB’s policy rate trajectory had remained low. Expectations for ECB policy rates had eased slightly versus levels at the time of the previous monetary policy meeting. The ECB was expected to keep rates unchanged in 2026 and possibly in 2027. A full 25 basis point rate hike was priced in only for early 2028. Meanwhile, the expected policy rate path in the United States had been revised up slightly over the near term.
The small downward revision in the expected policy rate path in the euro area had been transmitted along the curve to long-term risk-free rates. Spillovers from the United States had played a limited role over recent weeks, while global risk shocks had put slight upward pressure on long-term rates.
The benign macroeconomic and risk environment had been reflected in strong equity prices. Since December 2025, euro area equities had outperformed the S&P 500, supported by a sharp rally in EU defence stocks amid rising geopolitical tensions. In contrast, tariff-sensitive sectors had continued to underperform, showing that markets were differentiating among sectors despite risk appetite being at multi-decade highs.
Euro area fixed income markets had also benefited from the improved euro area growth narrative and strong risk sentiment. Ten-year sovereign bond spreads over overnight index swap rates had narrowed further across most countries, with Germany the notable exception. A decomposition of five-year sovereign bond yield movements since early 2025 had further underscored rising confidence in the euro area. While higher risk-free rates over the course of 2025 had exerted upward pressure on yields, this effect had been counterbalanced higher convenience premia associated with holding euro area sovereign bonds for many jurisdictions and by a compression in credit risk premia. In euro area corporate bond markets, spreads had also narrowed further, with investment grade spreads achieving a new record low and high-yield corporate spreads standing at their lowest level since 2017.
Considering the implications of recent market developments for overall financial conditions, the new ECB staff Macro-Finance Financial Conditions Index (“Macro-Finance FCI”) for the euro area showed that the overall improvement in risk sentiment had contributed to more favourable financial conditions across the euro area. The easing had been driven mainly by higher risk asset prices, but also by lower real rates, while the euro nominal effective exchange rate – considered in the Macro-Finance FCI – had not had a significant effect.
Ms Schnabel then turned to money market developments. Since the Eurosystem had started to reduce its balance sheet in November 2022, reserves had declined substantially. Abundant reserves explained why repo rates in the euro area remained close to the rate on the ECB’s deposit facility.
As balance sheet normalisation progressed, it would be important to identify the drivers of repo rate movements and isolate market plumbing issues from signals of less ample reserves. Once reserves became less ample, banks could borrow either in the money market, which redistributed reserves, or through standard refinancing operations, which would add additional reserves to the financial system. Market-based funding had remained more attractive at most maturities than funding via the Eurosystem’s standard refinancing operations at the rate on its main refinancing operations. This explained why banks had so far made only limited use of the standard refinancing operations.
The global environment and economic and monetary developments in the euro area
Mr Lane then went through the latest economic, monetary and financial developments in the global economy and the euro area.
Starting with inflation developments in the euro area, Mr Lane noted that the incoming information continued to support the Governing Council’s December assessment that inflation should stabilise at its 2% target in the medium term. Regarding near-term developments, the December inflation projection had non-energy inflation decelerating from 2.5% in 2025 to 2.2% in 2026 and headline inflation running below target owing to negative energy inflation. Indeed, HICP headline inflation had declined to 1.7% in January, from 2.0% in December, with energy inflation dropping to -4.1% from -1.9%, while non-energy inflation had eased to 2.3% from 2.4%. In terms of the components of non-energy inflation, food inflation had risen from 2.5% to 2.7% but core inflation – excluding both food and energy – had edged down by 0.1 percentage points to 2.2%. While there had been a small uptick in goods inflation to 0.4%, this had been more than offset by services inflation slowing from 3.4% to 3.2%.
Indicators of underlying inflation had changed little over recent months and remained consistent with the Governing Council’s 2% medium-term target. Looking ahead, the expected moderation in wage pressures suggested a further, although gradual, decline in services inflation.
Forward-looking indicators for negotiated wage growth pointed to further wage moderation in 2026. The ECB wage tracker including smoothed one-off payments indicated that negotiated wage growth would ease to 2.4% in 2026, markedly below its 2025 rate of 3.2%. The incoming information from surveys also indicated that labour cost pressures should ease further. At the same time, the wage drift had exceeded expectations in the third quarter of 2025, so it would be important to monitor this component of compensation per employee.
Most measures of longer-term inflation expectations continued to stand at around 2%, supporting the stabilisation of inflation around the Governing Council’s target. Respondents to the latest Survey of Professional Forecasters and the latest Survey of Monetary Analysts expected inflation to average 1.8% in 2026, 2.0% in 2027 and 2.0% over the longer term. Market-based measures of inflation compensation continued to suggest that inflation would remain below target in the coming three years.
Turning to the latest developments in global activity, global GDP growth looked to be stronger than expected in the third and fourth quarters of 2025. Global import growth was decelerating and was expected to remain below the historical average in the near term, with trade growth especially weak outside the high-tech sectors.
Exchange rate developments had been quite volatile since the Governing Council’s December meeting. The euro had appreciated slightly against the US dollar but was broadly stable in nominal effective terms. According to the latest data, the EUR/USD exchange rate stood close to the assumption underlying the December Eurosystem staff projections, indicating that there had not been a sustained movement relative to the projections.
There had also been a lot of volatility in energy commodity markets. Since the December monetary policy meeting, oil prices had risen by 10%. However, the forward curve for oil prices – and for gas prices – continued to slope downwards. Compared with the December Eurosystem staff projections, oil prices were expected to be 5.3% higher in 2026, 2.9% higher in 2027 and 1% higher in 2028, reflecting an upward movement that was a lot less strong than the spot increase in prices. Gas prices had increased markedly by 32% since the previous meeting, as cold weather in Europe had led to a rapid drawdown of inventories. Compared with the December projection, gas price futures stood 14.5% higher for 2026, but 1.5% lower for 2027 and 4.7% lower for 2028. Global food commodity prices had declined by 7% since the December meeting but, at the end of January 2026, they still stood around 50% higher than their 2020 level.
The euro area economy remained resilient in a challenging global environment. It had grown by 0.3% in the fourth quarter of 2025 – 0.1 percentage points above the December projection – after 0.3% in the third quarter. Growth was mainly driven by services, notably in the information and communication sector. Manufacturing was also resilient, despite headwinds from global trade and geopolitical uncertainty. Surveys indicated that this economic momentum had carried over into January, with the Purchasing Managers’ Index (PMI) indicators for services activity and manufacturing output both remaining above the expansion threshold, at 51.6 and 50.5 respectively. Activity in the construction sector was also picking up, supported by public investment.
Domestic demand was expected to continue supporting GDP growth in the near term, in line with the Governing Council’s December assessment. Growing labour incomes, together with a lower household saving rate, should continue to bolster private consumption. Business investment should also strengthen further, and surveys indicated that firms were increasingly investing in new digital technologies. Government spending on defence and infrastructure should also contribute to domestic demand, while the share of research and development in defence spending in the euro area continued to be very low.
At the same time, the external environment remained challenging, as higher tariffs and a stronger euro weighed on euro area exports. The level of exports in the three months to November had been broadly similar over the same period one year before. Excluding chemicals, euro area exports to the United States had declined by 5.6% on average in the three months to November relative to the same window in 2024, suggesting that the impact of higher tariffs was starting to materialise. Exports to other destinations were also subdued. The PMI indicators for new export orders for both manufacturing and services remained in contractionary territory, and shipping indicators had declined markedly over the three months to November.
Unemployment had stood at 6.2% in December, after 6.3% in November, although demand for labour had cooled further. The job vacancy rate had fallen to 2.2% in the third quarter, returning to pre-pandemic levels. The employment PMI had declined to 49.9 in January, and respondents to the latest Consumer Expectations Survey had also reported higher expectations of an increase in the unemployment rate during the course of the year.
Market rates had come down since the Governing Council’s last monetary policy meeting, while trade and geopolitical tensions had temporarily increased financial market volatility. Looking through the volatility, overall financing costs had changed little relative to the December meeting. Bank lending rates for firms had ticked up to 3.6% in December, as had the cost of issuing market-based debt. The average interest rate on new mortgages had again held steady at 3.3% in December.
Bank lending had continued to increase gradually, but there were signs of tightening credit standards for loans to firms. Both lending to firms and mortgage lending had grown by 3.0% on a yearly basis in December, while corporate bond issuance had risen by 3.4%. According to the latest euro area bank lending survey, demand for loans from firms was up slightly in the fourth quarter, especially to finance inventories and working capital. At the same time, credit standards for business loans had tightened again, although this tightening was particularly high in the car industry. Some tightening in lending conditions for businesses was also indicated by the findings of the Survey on the Access to Finance of Enterprises in the euro area. By contrast, demand for housing loans had kept rising and credit standards for those loans had eased slightly.
Monetary policy considerations and policy options
Based on this assessment, Mr Lane proposed that the Governing Council keep the three key ECB interest rates unchanged. Relative to the December meeting, the incoming information continued to support the Governing Council’s assessment that inflation should stabilise at its 2% target in the medium term. In terms of the surrounding risks, the evolution of risks was broadly in line with the Governing Council’s December risk assessment. Its data-dependent and meeting-by-meeting approach continued to be appropriate in the uncertain environment, thereby retaining optionality in relation to the future rate path.
2. Governing Council’s discussion and monetary policy decisions
Economic, monetary and financial analyses
Regarding the economic analysis, members broadly agreed with the assessment provided by Mr Lane in his introduction. Global growth had remained resilient, surprising to the upside in the third quarter of 2025. Global PMIs continued to be in expansionary territory and suggestive of a broad-based pick-up across sectors, thereby confirming positive momentum in global growth. Global growth was expected to remain stable over the current year and next, at slightly over 3%. However, global trade data had shown a clear deceleration in the second half of 2025. World trade growth was expected to decline substantially in 2026 owing to the adverse impact of tariffs and high policy uncertainty, before bouncing back somewhat in 2027.
The euro had appreciated 1% against the US dollar since the Governing Council’s previous monetary policy meeting, supported by a shift in investor sentiment. The US dollar had faced downward pressure owing to renewed tariff threats by the US Administration – later withdrawn – tied to its interest in Greenland, with investors seeking shelter in the euro and other major currencies in view of rising geopolitical and tariff uncertainties. However, the euro’s nominal effective exchange rate was slightly lower than at the time of the previous meeting. Therefore, it was argued that recent exchange rate moves would have no material impact on the inflation outlook.
While it was acknowledged that the euro had, overall, been stable in recent months, it was pointed out that its nominal effective exchange rate had plateaued after appreciating nearly 20% compared with early 2020. The real effective exchange rate of the euro had also appreciated over the past year and stood at levels somewhat higher than over the last ten years but well below its historical peak. Despite their relative stability since the December meeting, it was argued that exchange rate developments over a longer horizon stretching back to last spring were still best described as showing a significant appreciation of the euro. Moreover, it was argued that forward markets implied potential further downward pressure on the US dollar.
With respect to the question of how the exchange rate affected the economic outlook, analysis in the December Eurosystem staff projections had shown that exchange rate movements had a significant multi-year effect on both inflation and output. The assessment of the impact of the exchange rate on the economic outlook had not been affected much by the limited exchange rate moves since the Governing Council’s previous meeting. However, the impact from the significant and persistent appreciation of the euro in the second quarter of 2025, which had already been embedded in the projections, was expected to play out over three years and to peak after one year. Therefore, the peak disinflation effect had not yet been reached. It was also suggested that the impact of a US dollar-specific appreciation of the euro would be larger than implied by its weight in the nominal effective exchange rate. This was because the US dollar was an international vehicle currency used to invoice and settle international trade and financial transactions.
In this context, it was important to understand what the drivers of the seemingly permanent appreciation of the euro over the past year were. The appreciation had occurred in roughly two steps. The first came after the announcement of the German fiscal package in March 2025, with the second following the US tariff announcement in April 2025. The German fiscal package had increased confidence in the euro area, as it would allow for more public investment, supporting potential output growth. In a similar vein, a new equilibrium in which the euro played an increasing role as a safe haven currency would ultimately lead to a stronger euro exchange rate, at least during the transition to such an equilibrium. In addition, a stronger role as a safe haven currency should imply an upward impact on the euro during times of crisis, such as the recent tariff threats. Nevertheless, it was argued that, regardless of the underlying drivers of the strength of the euro, exporters had still become less competitive in terms of the nominal exchange rate. Compared with the United States, the euro area was also much more of a global trading region. This meant that the economy was more sensitive to exchange rate fluctuations, which could present new challenges if the euro started to move relatively more from shifts in risk sentiment than from macroeconomic developments.
Regarding commodity prices, oil prices had increased notably since the start of the year. Gas prices had also increased markedly, as cold weather in Europe had led to a rapid drawdown of inventories, and therefore warranted close monitoring. In the largest euro area economy, which was more dependent on gas than a number of other euro area economies (where nuclear power was more prevalent), gas storage stood at around 30% of total storage capacity. This was about 25 percentage points below the historical average for this time of year. The International Energy Agency considered the 30% storage threshold as critical to avoid supply constraints in the event of colder than usual weather. However, weather conditions were expected to improve over the coming weeks, lowering households’ demand for gas, and so gas storage levels were not expected to decline much further. It was also argued that liquefied natural gas supply now acted as a backstop, although it was pointed out that much of this supply was from the United States and Qatar. Overall, the developments were a reminder that gas storage levels needed to be built up in the spring and summer in preparation for next winter. In this context, it was pointed out that storage levels were partly influenced by decisions of private companies, which were sensitive to prices in the forward market, and this did not necessarily create the right incentives to increase storage given a flat futures curve for gas.
The “second China shock” – referring to the country’s increased global presence in more advanced products and technologies – was also widely highlighted as a major challenge for the euro area economy and its competitiveness. There was growing evidence that China was becoming Europe’s main competitor in both domestic and external markets. In domestic markets, China’s increasing competitiveness was reflected in the scale and scope of its exports to the euro area. China had also been building a commercial distribution network that was becoming popular among euro area consumers and meant that it had become easier for Chinese products to penetrate euro area retail markets.
Since the United States had removed its “de minimis” duty exemption on goods from China in the middle of last year, low-value imports from China into the United States had dropped significantly. From July 2026, the EU would also impose a duty on small value imports from China, so a similar outcome could be expected in the euro area. Nevertheless, the impact on overall euro area inflation was expected to be negligible. Trade barriers would not, however, protect euro area exporters in third-country markets, where Chinese competition was also fierce. Moreover, competition from other Asian economies could present similar challenges for the euro area. Therefore, it was argued that a durable solution to the euro area’s competitiveness challenges required long-lasting structural reforms to make the economy more productive.
Regarding the economic impact of the “second China shock”, it was noted that there was plenty of existing evidence. Cheaper intermediate and final goods from China – subsidising the euro area via low-cost imports – were invariably found to be good for Europe in most macroeconomic models on account of the support given to real incomes. However, several caveats were raised with respect to the argument that lower import prices would unequivocally raise real incomes and welfare in Europe. First, in the event of abnormally low pricing and certain key European sectors such as the steel industry disappearing, lower import prices in the short term would lead to more market power for Chinese companies and could ultimately result in higher import prices for Europe. The impact of the earlier China shock on US manufacturing, particularly in the Rust Belt region, was a case in point. From this perspective, it was acknowledged that available models struggled to capture the lasting impact from the disappearance of key industries. This was where economic history and political economy considerations needed to complement the results from macroeconomic models. Second, a sustained phase of low inflation due to rising volumes of cheap Chinese imports had the potential to push the euro area back into a liquidity trap, and this would have adverse implications for euro area aggregate demand and welfare. Third, since Europe was unable to protect its export markets, lower Chinese prices still implied European job losses and therefore a decline in income for part of the European workforce. More generally, it was suggested that European entrepreneurs were worried about the economic impact of Chinese competition.
Geopolitical risks had risen again from already elevated levels. The main pillars of the global geopolitical landscape had been changing rapidly, and not in the EU’s favour. Given that events in the geopolitical sphere were highly unpredictable and could therefore be seen as surrounded by radical, or “Knightian”, uncertainty, it was argued that it was not straightforward to take pre-emptive action in response to them. It was also argued that spikes in geopolitical uncertainty often faded away and did not necessarily weigh on activity. In this context, it was suggested that financial markets and economic agents had learnt to look through geopolitical uncertainties, dampening their impact on macroeconomic outcomes. At the same time, recent weeks had shown that the high degree of uncertainty and unpredictability that had characterised 2025 had continued into 2026, and this would probably persist for a lengthy period.
With regard to economic activity, members concurred with the assessment presented by Mr Lane. The euro area economy had grown by 0.3% in the fourth quarter of 2025, according to Eurostat’s preliminary flash estimate. Growth had mainly been driven by services, notably in information and communication technology. Manufacturing had been resilient despite the headwinds from global trade and geopolitical uncertainty. Momentum in construction had been picking up, in part supported by public investment.
The resilience of the economy was good news. Incoming data had further strengthened confidence in the growth momentum of the euro area economy, with stronger than expected growth in the fourth quarter of 2025 and positive signals from surveys. These data pointed to a recovery in manufacturing and construction, while services, especially in information and communication technology, remained the main driver of growth. Given the current high level of uncertainty, it was argued that it was especially valuable to focus on hard data, so the higher than expected GDP growth in the fourth quarter should be seen as a particularly important data point. However, while the euro area economy had grown by 1.5% over the course of 2025, which was a good outcome, it was noted that when the fastest growing country in the euro area was excluded, the economy had only grown by 1%.
PMI indicators suggested that solid growth had continued at the turn of the year, while in January the European Commission’s Economic Sentiment Indicator had recorded its highest level since 2022. Available country data suggested that domestic demand had continued to grow strongly, more than compensating for weak export growth. Overall, there were good reasons to be confident that the euro area economy would continue to grow robustly, and the remarkable resilience of the economy in the face of geopolitical shocks was highlighted. In this context, it was suggested that the current economic situation could be described in “Goldilocks” terms.
It was argued that there were some upside risks to the December staff projections for growth, in part in view of repeated upward revisions in past projection rounds. Robust investment growth and greater spending on technology could boost demand by more than expected and foster productivity growth. The largest euro area economy might grow more strongly than expected if fiscal spending materialised faster and if the multipliers turned out to be higher than assumed. In this context, it was observed that there had been positive signals from this economy, including a surprisingly strong pick-up in factory orders in December. It remained to be seen whether fiscal consolidation in the euro area would take place as projected in the outer years of the projection horizon. Moreover, it was argued that strengthening economic ties with Asia and Latin America through newly concluded trade agreements might eventually more than compensate for export losses resulting from US tariffs, but it was also pointed out that these trade agreements would take quite some time to show in the growth figures, in part in view of implementation lags. It was asserted that European governments were showing growing determination to implement reforms that might foster and increasingly strengthen the Single Market. The resilience of the euro area economy, together with signs of greater cohesion, had the potential to change the world’s perception of Europe. In this light, the appreciation of the euro over the past year could be seen as a sign of confidence, reflecting a stronger global role of both the euro area and the euro. Finally, it was stated that the current resilience of euro area growth could foster confidence, giving rise to a virtuous cycle, as households consumed more and firms increased their investment.
At the same time, several concerns were raised about the growth outlook, and it was observed that the latest Survey of Monetary Analysts suggested that risks to growth were increasingly veering to the downside. Uncertainty continued to be pervasive and could prompt cautious behaviour among households and firms. External headwinds, such as lingering trade tensions, global financial market volatility and geopolitical uncertainties, including those associated with Iran, Greenland and Cuba, might weigh on domestic demand and undermine the recent growth momentum. In this context, it was observed that sentiment indicators for households and firms were still muted compared with hard data. For companies, international competitiveness challenges were probably another reason why sentiment was not improving in line with the hard data. Potential output growth in the euro area also remained subdued, despite some signs of improved productivity growth. In addition, the economic effect of major policy changes often only became visible with a significant lag, as had been the case with the impact of Brexit on the UK economy, so the worst effects of the recent trade and geopolitical tensions could still be to come. There were therefore no grounds for complacency, and while the economic outlook might be in a good place it should certainly not be seen as being in a comfortable place.
The drivers of growth had shifted to domestic demand, while the external environment remained challenging owing to higher tariffs and the stronger euro over the past year. The effects of these two factors on activity had been expected to materialise with a lag, but they were now starting to become visible in the incoming data. When the pharmaceutical sector was excluded, exports to the United States had fallen significantly. In addition, the rotation away from net exports made the economic outlook more dependent on domestic demand, implying that it had become more sensitive to changes in economic sentiment.
Turning to the components of domestic demand, private consumption was expected to be bolstered by increasing labour incomes and a decline in the household saving rate. Moreover, it was argued that rising consumer confidence pointed to robust growth in private consumption over the period ahead. However, while consumer confidence was improving, it remained subdued and there had not been a consumption boom so far. It was also highlighted that private consumption in the euro area had underperformed relative to disposable income in recent years, possibly owing to structural factors, such as expectations of higher taxes and lower welfare spending in the future, as well as to high uncertainty and low confidence. Despite the overall resilience of the labour market, the perceived risk of unemployment – possibly related to corporate bankruptcies, which were still at record high levels in some countries – seemed to be prompting some households to constrain their spending. In this context, there was a need to carefully monitor how uncertainty was affecting the behaviour of households who were holding a large stock of savings. It was also suggested that households might not yet be used to the new price level and therefore continued to be reluctant to consume in the same way as before the inflation surge. In this regard, it was noted that disposable income available for consumption should be adjusted for capital losses on the real value of household financial wealth, by applying the “Hicksian adjustment” of wealth. Real household financial wealth had declined by about 15% in 2022 relative to the previous year, owing to the unexpected increase in inflation and to valuation effects associated with rising interest rates. Assuming that households would aim to replenish the real value of their financial wealth, this implied that the ratio of consumption to disposable income should be more than 2 percentage points below its usual level. As a result, the saving rate could continue to be elevated and weak consumption patterns might persist. However, it was highlighted that this had been captured in the staff projections and the saving rate was projected to decline only gradually as real wealth rose again.
Business investment had continued to grow robustly, with strong momentum in intangible and digital investment. It was expected to strengthen further, and surveys indicated that firms were increasingly investing in new digital technologies. While these developments were welcome, it was important to avoid complacency. There was evidence that the construction of data centres had remained weak and the euro area was lagging behind the United States, which raised the question of whether energy constraints might be dampening construction given the high energy consumption of data centres. In this context, it was suggested that developments should be monitored using a variety of information sources, such as the issuance of data centre-related building permits, land purchase transactions and more anecdotal evidence. In this regard, recent information from the fourth largest euro area economy suggested that a boom in data centre construction over the coming decade should not be excluded.
Looking at a broad range of indicators, housing investment had been showing growing momentum since the start of the policy rate easing cycle. Building permit issuance was increasing and this was an important leading indicator for construction activity. Residential property investment had picked up strongly in the euro area’s fourth largest economy. More generally, construction had recovered from its latest contraction in several countries, although the extent of recovery differed. While some countries continued to experience labour shortages, there were generally still enough workers to accommodate new construction orders. The differences across housing markets were also reflected in large cross-country variation in the growth of house prices, which could pose concerns in countries where house prices were growing rapidly. Large price changes were being amplified in some countries by zoning restrictions, for example resulting from the need to protect the environment against excess nitrogen deposition.
Government spending on defence and infrastructure should also contribute to domestic demand. Indeed, there were initial signs that fiscal spending was already supporting the euro area’s largest economy. In this context, a question was raised regarding how to understand the economic impact of higher public spending in that economy. While it would take some time for the impact to show in GDP growth, a positive effect was already expected in the course of the year, with a bigger one in 2027. Ideally, the fiscal package would be complemented with additional structural measures at the European level to leverage its overall impact on the euro area economy.
The labour market continued to support household incomes, even though demand for labour had cooled further. The unemployment rate had stood at 6.2% in December, after 6.3% in November. However, the labour market had been softening for a while. A question was raised regarding the extent to which this was a normalisation of labour hoarding or a signal of more persistent weakness, which might be relevant for wage growth and inflation. Labour hoarding was indeed likely to diminish as a result of the resilience of growth, while the latest staff projections saw unemployment remaining low and even declining slightly further. Taking a longer-term perspective, unemployment had fallen from 9% to almost 6% and now stood below estimates of the non-accelerating inflation rate of unemployment (NAIRU). This suggested that the labour market was continuing to put upward pressure on wages and inflation, even though wage growth now seemed to be slowing. At the same time, it was pointed out that the labour market needed to be sufficiently tight to deliver nominal wage growth of between roughly 2% and 3%, which was necessary for inflation to remain close to target. It was also observed that the labour force had recently been expanding with the addition of foreign workers, which had probably helped to alleviate labour shortages. However, this trend might not continue, given changing attitudes towards migration across Europe. It was also important to deepen the understanding of the potential effects of demographic factors on the labour force. The impact on employment of investment in artificial intelligence had to be monitored closely, as such technologies often involved significant frontloading of job creation but could potentially cause job losses in the future, especially if the economy entered a downturn.
Given rising economic challenges, the need for structural reforms was more critical than ever, as it remained to be seen whether artificial intelligence, digitalisation and public investment would boost productivity sufficiently. Unfortunately, progress with such reforms had been limited and slow so far, at both the European and national levels. Against this backdrop, members stressed the urgent need to strengthen the euro area and its economy in the present geopolitical context. Governments should prioritise sustainable public finances, strategic investment and growth-enhancing structural reforms. Unlocking the full potential of the Single Market remained crucial. It was also vital to foster greater capital market integration by completing the savings and investments union and the banking union to an ambitious timetable, and to rapidly adopt the Regulation on the establishment of the digital euro. In this context, members agreed to prepare a checklist of key reforms in five areas that could help to make Europe more competitive, improve productivity, enhance growth and support the transmission of monetary policy in a manner conducive to more economic activity and better welfare for people. This checklist would be sent to all EU leaders, the President of the European Commission and the President of the European Council in advance of their meeting on 12 February to examine competitiveness reforms.
Against this background, members assessed that the euro area continued to face a volatile global policy environment. A renewed increase in uncertainty could weigh on demand. A deterioration in global financial market sentiment could also dampen demand. Further frictions in international trade could disrupt supply chains, reduce exports and weaken consumption and investment. Geopolitical tensions, in particular Russia’s unjustified war against Ukraine, remained a major source of uncertainty. By contrast, planned defence and infrastructure spending, together with the adoption of productivity-enhancing reforms and the adoption of new technologies by euro area firms, might drive up growth by more than expected, including through positive effects on business and consumer confidence. New trade agreements and a deeper integration of the European Single Market could also boost growth beyond current expectations.
With regard to price developments, members concurred with the assessment presented by Mr Lane in his introduction. Members welcomed the fact that inflation had continued to hover around 2% in recent months. However, the decline in inflation in January had been greater than expected, although the outcome had been close to market pricing. While detailed data were not yet available, it was conjectured that the repricing of services in January had been weaker than expected. The decline in inflation in January had also been due to a sharp drop in energy inflation, which had been broadly anticipated. Given the recent volatility and increase in energy commodity prices, caution was called for before drawing strong conclusions from this single data point. In addition, it was argued that interpreting the January outcome was likely to be complicated because of changes in the consumption basket, annual repricing and some temporary factors that might reverse over time. It was also noted that upside effects from owner-occupied housing costs, which were not included in the HICP, remained significant, adding around 15 basis points to inflation in late 2025.
Lower than expected services inflation in January was welcomed, as it was the first downside surprise for a long time. Indeed, the slower than expected decline in services inflation in the second half of 2025 was one reason why the staff projection for inflation in 2026 had been revised up from 1.6% in June to 1.7% in September and 1.9% in December. Therefore, the downside surprise in headline inflation should not be given undue emphasis. However, goods inflation had also surprised to the downside and its evolution warranted close attention, particularly in relation to trade diversion of Chinese goods.
The recent fast and strong expansion of Chinese exports to the euro area and the decline in Chinese import prices had now started to become visible in euro area consumer prices. Since the end of 2023 euro area imports of Chinese goods had increased substantially in value terms. As import prices had declined and the euro had appreciated, the increase in volume terms was even larger. This reflected the “second China shock”, and it could explain why goods inflation had been subdued recently and had been lower than expected in January. At the same time, the evidence suggested that the pass-through of falling import prices to euro area consumer prices had so far been relatively muted on average.
While prices for imports from China had declined significantly, questions were raised regarding the extent to which this was being driven by the appreciation of the euro and how it would ultimately affect consumer prices in the context of higher European tariffs on some Chinese goods. It was argued that the decline in import prices was much greater than could be attributed to the effects of a stronger euro. As import prices were measured at the border, they did not include the impact of higher tariffs. However, tariffs on Chinese imports had only increased for a few sectors so far, implying that an overall downward impact on euro area consumer prices was still expected. In terms of the overall impact on inflation of the diversion of Chinese trade to the euro area and the past appreciation of the euro, it was probably fair to describe the developments in goods inflation thus far as a crystallisation of the December staff projections. At the same time, it was argued that disinflationary pressures from China might be persistent. In particular, the “second China shock” was partly rooted in weak domestic demand in China, which was expected to continue to drag down its GDP growth in 2026 and 2027 and was, if anything, getting weaker, partly owing to the country’s housing crisis. In addition, as declining prices for imported goods worked their way around the euro area economy, second-round effects could eventually weigh on euro area services inflation as well.
The recent decline in services inflation was in line with a further moderation in wage growth. While the ECB wage tracker suggested a further deceleration in wage growth in 2026, wage growth was expected to level out thereafter, which was consistent with meeting the inflation target. However, the contribution to overall wage growth from payments over and above the negotiated wage component remained uncertain. In this context, wage developments warranted continued close monitoring, in part to gauge whether the December upward revisions to the staff projections for compensation per employee were turning out to be correct. It was also important to monitor corporate profits closely, as higher profits could potentially contribute to greater persistence of services inflation. Finally, it was noted that the stronger than expected economy would probably put upward pressure on some components of inflation, because domestic demand would be greater if incomes were higher. Consistent with this, while wage-intensive services inflation had continued to decline, inflation in prices for leisure activities, such as tourism, had recently increased.
Most measures of longer-term inflation expectations continued to stand at around 2%, supporting the stabilisation of inflation around target. Professional forecasters surveyed in the latest Survey of Professional Forecasters and analysts participating in the latest Survey of Monetary Analysts both expected inflation to average 1.8% in 2026, 2.0% in 2027 and 2.0% over the longer term. However, while risks to inflation reported in the Survey of Monetary Analysts were still seen as broadly balanced overall, analysts now saw inflation returning to target somewhat later than previously expected, and the share of respondents seeing upside risks had diminished. Inflation fixings, which had been a useful short-term indicator, continued to point to a somewhat larger undershooting of the target in the coming months than contained in the December staff projections. Moreover, market-based measures of inflation compensation suggested an undershooting of the target over the entire projection horizon. At the same time, expectations reported in the Consumer Expectations Survey and those indicated in market pricing had moved up notably over both the short and the medium term. In particular, the inflation fixings for December 2026 had increased by 30 basis points since the previous Governing Council meeting, while five-year ahead median expectations reported in the Consumer Expectations Survey now stood at 2.4%, the highest level since the data were first collected in 2022.
Against this background, members assessed that the outlook for inflation continued to be more uncertain than usual on account of the volatile global policy environment. Inflation could turn out to be lower if tariffs reduced demand for euro area exports by more than expected and if countries with overcapacity increased further their exports to the euro area. Moreover, a stronger euro could bring inflation down beyond current expectations. More volatile and risk-averse financial markets could weigh on demand and thereby also lower inflation. By contrast, inflation could turn out to be higher if there were a persistent upward shift in energy prices, or if more fragmented global supply chains pushed up import prices, curtailed the supply of critical raw materials and added to capacity constraints in the euro area economy. If wage growth moderated more slowly, services inflation might come down later than expected. The planned boost in defence and infrastructure spending could also cause inflation to pick up over the medium term. Extreme weather events, and the unfolding climate and nature crises more broadly, could drive up food prices by more than expected.
Turning to the monetary and financial analysis, members largely concurred with the assessment provided by Ms Schnabel and Mr Lane in their introductions. Market interest rates had come down since the Governing Council’s previous monetary policy meeting, with financial markets having priced out any likelihood of policy rate hikes in 2026. Market pricing and surveys both pointed to stable interest rates until at least the end of 2027, and they both indicated that the next change in 2028 was expected to be a rate hike. The uncertainty surrounding the expected rate path also remained unusually low.
Financial market volatility had temporarily increased in January owing to global trade and geopolitical tensions. The turbulence had been particularly pronounced in precious metals markets, which had been beneficiaries of flight-to-safety flows. There had also been a large increase and subsequent decline in US long-term interest rates over only a few days, significant moves in foreign exchange markets and sharp fluctuations in some technology stock prices. At the same time, it was argued that financial markets had remained remarkably calm overall in the face of the trade and geopolitical uncertainties. Within the euro area, it was observed that the stock market of the newest member country had surged in January. This underlined the role of the adoption of the euro in boosting confidence and improving investor access. However, the durability of this increase and longer-term market performance were still ultimately contingent on fundamental structural factors rather than on the introduction of the euro.
Financial conditions had eased since the December meeting according to the recently developed Macro-Finance FCI, but they had been broadly stable since last spring. Risk-free interest rates had increased in 2025, with the yield curve also steepening significantly. However, the increase in risk-free rates had been counterbalanced by higher convenience premia associated with holding euro area sovereign bonds for many jurisdictions and by a compression in credit risk premia, which meant that sovereign bond yields had not changed by as much over this period or had even declined. However, financial markets remained at risk of a correction. This was particularly the case for US financial markets and crypto-asset markets. Recent volatility had signalled increasing fragility against a backdrop of stretched valuations, strong and increasing risk appetite, and heightened policy uncertainty in some jurisdictions. Looking ahead, it was important to closely monitor the evolution of euro area financial conditions. Financial markets were likely to remain prone to bouts of volatility given that market sentiment remained highly sensitive amid increasing geopolitical risks and ongoing trade policy uncertainty. There was also a risk that the safe-haven properties of US assets could weaken further, although it was noted that this could also have benefits for the euro area since it was now more likely to receive flight-to-safety flows and since a rebalancing towards the euro area could lower term premia. Overall, if there were a deterioration in global financial market sentiment and an increase in volatility, this could lead to greater risk aversion in the euro area, which could weigh on demand and thereby also lower growth and inflation.
Turning to the financing conditions applying to households and firms, the average interest rate on new mortgages had again held steady, at 3.3%, in December. Lending to households had continued to strengthen. Mortgage lending had grown by 3.0%, after 2.9% in November and 2.8% in October, in response to still rising demand for loans and an easing of credit standards, according to the latest bank lending survey. It was observed that insurance companies and pension funds had built up sizeable exposures to retail lending, including via mortgage portfolio products, which could also be an indication that financial stability risks were migrating outside the banking sector.
Borrowing rates for firms rates had increased. Bank lending rates for firms had ticked up to 3.6% in December, from 3.5% in November, as had the cost of issuing market-based debt. Bank lending to firms had grown by 3.0% on a yearly basis in December, after 3.1% in November and 2.9% in October. The issuance of corporate bonds had risen by 3.4% in December. Although bank lending to firms had seen a strong monthly flow in December, the overall growth of credit to firms had remained sluggish over the past couple of years. This indicated that tighter borrowing conditions, as highlighted in the bank lending survey and the Survey on the Access to Finance of Enterprises, were weighing on corporate loan uptake.
According to the latest bank lending survey, firms’ demand for credit had increased slightly in the fourth quarter of 2025, primarily to finance inventories and working capital. However, demand for loans for investment purposes had been fairly weak. In addition, credit standards for business loans had tightened again, and banks had also reported a net increase in the share of rejected loan applications for firms. These developments were seen as surprising given the ongoing gradual recovery in the economy and its greater than expected resilience. The tightening of credit standards had been driven by perceived risks to the economic outlook and banks’ lower risk tolerance, indicating that they were showing signs of greater risk aversion, which was leading them to become more cautious in their lending. It was suggested that higher uncertainty – possibly linked to geopolitical risks – may have increased the risk perceptions of banks. The tightening could also indicate that banks had doubts about the solvency of some non-financial corporations and saw risks of rising non-performing loans. At the same time, it was contended that there could be a tightening bias in banks’ reporting in the bank lending survey, given that the tightening was in line with the historical average since 2003. More generally, it was argued that the tightening of credit standards in the bank lending survey and the Survey on the Access to Finance of Enterprises should not be overinterpreted, since the surveys contained many mixed signals and banks had strong balance sheets, with their stock prices reaching new historical highs. In particular, the tightening had been small and, rather than being a general phenomenon, had been driven by a small set of banks and firm-specific factors. A granular breakdown suggested that it had been largely confined to firms in specific sectors that had been struggling, such as energy-intensive manufacturing and, in particular, the automotive industry. It was contended that this was an indication that the reassessment of credit risks by banks had probably been driven by structural weaknesses rather than by cyclical concerns.
Taking a broader perspective, it was observed that the nature of money creation had been changing, with banks creating money by buying government bonds, possibly owing to elevated uncertainty. Bank credit to other financial institutions had also increased strongly, and banks appeared to be providing more finance to hedge funds pursuing Treasury basis trades. All of these developments could be reducing the flow of corporate lending, in particular to small and riskier firms, and pointed to the importance of understanding changing bank behaviour.
Monetary policy stance and policy considerations
Turning to the monetary policy stance, members assessed the data that had become available since the last monetary policy meeting in accordance with the three main elements that the Governing Council had communicated in 2023, and updated in July 2025, as shaping its reaction function, namely: (i) the implications of the incoming economic and financial data for the inflation outlook and the risks surrounding it; (ii) the dynamics of underlying inflation; and (iii) the strength of monetary policy transmission.
Starting with the inflation outlook, members welcomed the fact that headline inflation was currently close to the 2% medium-term target. They assessed the incoming data as broadly confirming the narrative and baseline inflation outlook embedded in the December staff projections, thereby reconfirming that inflation should stabilise at the 2% target in the medium term. Price pressures were continuing to diminish gradually. Recent shocks had been unfolding and were becoming more visible, broadly in line with expectations, with the “second China shock” putting downward pressure on goods inflation and the peak disinflationary impact from the exchange rate appreciation in 2025 approaching. So far, none of the risks identified had materialised to the extent that they would meaningfully affect the inflation outlook. At the same time, it was remarked that headline inflation in January had been lower than expected and materially below 2%. As a result, near-term inflation was likely to fall further below target than previously anticipated. However, it was cautioned against drawing strong conclusions from this single data point, especially given recent energy price volatility, and it was argued that it had no particular implications for the medium-term inflation outlook. Regarding inflation in 2026, an undershoot of the target had long been projected and the latest inflation data release would probably only imply some reversal of the 0.3 percentage point upward revision to projected inflation between the June and December staff projection exercises. Similarly, it was argued that the recent growth momentum did not pose upside risks to the baseline inflation outlook as that already incorporated resilient economic growth and a labour market that would deliver annual wage growth of around 3%. In addition, inflation expectations remained well anchored, with most measures of longer-term inflation expectations continuing to stand at around 2%, which also supported the stabilisation of inflation around target.
Against this background, most members viewed the risks surrounding the inflation outlook as two-sided and saw the distribution of risks around the baseline as relatively unchanged since the previous meeting. The outlook for inflation continued to be more uncertain than usual, owing particularly to ongoing global trade policy uncertainty and geopolitical tensions. As had been identified at the previous meeting, there were multiple, significant risks to inflation on both sides, and events since then had confirmed that these remained live risks, while possibly increasing uncertainty further. For the time being, upside risks, including from energy prices, wage growth and services inflation, and downside risks, including from the exchange rate and from the effects of cheap and rising Chinese imports on goods inflation, appeared to be offsetting one another.
Some members viewed inflation risks as being tilted to the downside relative to the December staff projections. From this perspective, there had been a downward shift in the inflation outlook since the December meeting, partly linked to the interpretation of the large surprise in the January inflation data release. It was argued that intense competition and strong disinflationary pressures from China had already resulted in surprisingly low goods inflation. It was suggested that these disinflationary pressures, which were linked to overcapacity in the Chinese economy and the effects of trade diversion, could be persistent. In particular, competitive pressures from cheap Chinese exports could be partly linked to consistently weak Chinese domestic demand. It was also argued that capacity in China was likely to continue to expand, in light of subsidies to industry and the suggested appetite for China to increase the production capacity of its manufacturing sector arising from the need to maintain high growth rates and absorb large internal migration flows to more industrialised parts of the country. Moreover, since the trade agreement between the United States and China had not yet been concluded, there could still be further trade diversion of Chinese exports to the euro area, which could put additional downward pressure on inflation. More generally in relation to trade tensions, inflation could also turn out to be lower if the rise in US tariffs reduced demand for euro area exports by more than expected. In this context, it was noted that there was now evidence that exports to the United States had fallen significantly when the pharmaceutical sector was excluded. A stronger euro, possibly prompted by a more accommodative US monetary policy than expected and an associated depreciation of the US dollar, could also bring inflation down further than currently expected. In addition, the significant appreciation of the euro in 2025 was likely to continue to dampen export growth and weigh on inflation, and it was suggested that this could be a greater concern in the context of intense competition from China. It was also argued that a systematic underestimation of the potential growth rate of the economy could pose another downside risk to inflation. The series of positive growth surprises in recent months had been partly driven by stronger than expected investment, much of which seemed to be related to the digitalisation of the economy and the adoption of artificial intelligence. Together with lower than expected core inflation in January, and consistent with initial signs of increasing labour productivity, this tentatively suggested that the euro area might be starting to experience a positive supply shock that could have disinflationary effects over the medium term. Equally, the effects of fiscal expansion on growth and inflation might be more limited than expected if the expansion led households to maintain a high saving rate in anticipation of potential future tax increases or cuts in welfare spending. Finally, financial stability risks remained, and more volatile and risk-averse financial markets could weigh on demand and thereby also lower inflation.
A few members viewed inflation risks as tilted to the upside relative to the December staff projections. From this perspective, the stronger than expected growth momentum of the euro area economy, together with the tight labour market, was likely to put upward pressure on inflation. This was particularly likely to emanate from sectors benefiting from higher public spending, such as construction and defence, or experiencing strong demand, such as digital services. It was suggested that rising labour scarcity, reinforced by demographic headwinds, could be expected to put upward pressure on wage growth in these sectors, in a context of already persistently strong wage growth. If wage growth moderated more slowly than projected, services inflation might come down later than expected. Inflation could also turn out to be higher if there were a persistent upward shift in energy prices. In this regard, recent developments in commodity prices, including for oil, gas and industrial metals, posed upside risks to the staff projections for inflation. It was argued that these factors outweighed the potential downward impact from the exchange rate, especially given that the nominal effective exchange rate of the euro had not moved much recently, despite its appreciation against the US dollar. Therefore, it was important to monitor the persistence of the spike in energy inflation and how this was reflected in energy contracts and prices in the coming months. There was also a risk that geopolitical tensions in the Middle East could lead to a further increase in energy prices. Moreover, some research had found that geopolitical risk shocks acted like adverse supply shocks, with a persistent, positive effect on inflation that led to an upward shift in the entire distribution, although it was pointed out that other studies had found that geopolitical risk shocks also acted as negative demand shocks. Regarding trade tensions, inflation could turn out to be higher if more fragmented global supply chains pushed up import prices, curtailed the supply of critical raw materials and added to capacity constraints in the euro area economy. It was also suggested that the pass-through from lower Chinese import prices to consumer prices remained limited, with some firms raising their margins rather than lowering prices. In addition, it was argued that the decline in Chinese import prices might cease owing to the stabilisation of the renminbi, as well as to a reduction in China’s overcapacity over time on account of its “anti-involution” campaign aimed at combating excess supply, which was consistent with the recent sharp drop in Chinese investment. Finally, it was suggested that upside pressures on inflation could stem from higher owner-occupied housing costs. Given these risks, the recent increase in inflation expectations in financial markets and in surveys, as well as rising input prices and more aggressive price-setting according to PMI data, underscored the need for continued vigilance.
Turning to underlying inflation, the measures had changed little over recent months and members concurred that they remained consistent with the 2% medium-term target. However, it was noted that core inflation had surprised to the downside in January. The decline in both core and services inflation signalled gradually diminishing underlying price pressures and suggested that disinflation was becoming more broad-based. It also appeared to be linked to a moderation in wage growth. Looking ahead, negotiated wage growth and forward-looking indicators, such as the ECB’s wage tracker and surveys on wage expectations, pointed to a continued moderation in labour costs. At the same time, services inflation remained elevated despite the recent decline and needed to be monitored carefully. Similarly, wage growth remained strong, especially owing to the contribution from payments over and above the negotiated wage component. It was observed that services inflation and wage growth were still both substantially above the levels that had been projected by staff in the first half of 2025.
Finally, moving to an assessment of the strength of transmission, the effects of past interest rate cuts continued to support growth. The latest bank lending survey indicated a small accommodative effect from the general level of interest rates on demand for loans by firms and households. This was seen as consistent with current lending growth, which was argued to be robust, and the marked pick-up in investment. At the same time, the impact from easier monetary policy on loan demand had diminished substantially and was now very small, according to bank lending survey data. More generally, it was argued that the nature of monetary policy transmission was evolving. While banks had loosened credit conditions in line with the monetary policy stance in recent years, this process now seemed to be showing some signs of a reversal, with banks becoming more prudent despite the significant easing in the monetary policy stance. Banks had reported a net tightening of credit standards for loans to firms, driven by perceived risks to the economic outlook as well as a lower risk tolerance. Therefore, it was important to closely monitor developments in bank lending conditions and behaviour for any unnecessary impediments to investment and growth. It was also observed that any changes in the composition of firm financing, across internal funds, bank credit and capital market financing, could have implications for the transmission of monetary policy. Similarly, the growing importance of the non-bank financial intermediation sector for financing the real economy could be affecting the nature of monetary policy transmission and warranted further examination.
In this context, it was suggested that the range of estimates of the nominal natural rate of interest had shifted up. It was argued that this was in line with a more expansionary fiscal policy and a potential productivity boost from artificial intelligence. It was noted that, if this trend were to continue, current policy rates could become increasingly accommodative. However, it was pointed out that the increase largely reflected rounding effects. In addition, it was argued that models estimating the natural rate faced challenges in discriminating between a shift in long-term rates owing to higher term premia and a shift owing to predictions of the future policy rate – with the latter only being relevant for estimates of the natural rate of interest – so it was hard to draw sharp conclusions from the increase in the nominal natural rate of interest shown by some models. Furthermore, the increase in the term premium that – according to models of the term structure – was primarily responsible for the rise at the long end of the yield curve could be connected to fiscal policy developments, but it was unlikely to be linked to developments in investment or productivity, or to expectations about future policy rates. Indeed, estimates based on macroeconomic models tended to see the nominal equilibrium rate of interest as steady, which also suggested that productivity developments had not yet had an effect on the natural rate of interest.
Monetary policy decisions and communication
Against this background, all members supported the proposal made by Mr Lane to keep the three key ECB interest rates unchanged. The Governing Council’s updated assessment had reconfirmed that inflation should stabilise at the 2% target in the medium term, with the incoming data since the December meeting also confirming that the economy had remained resilient in a challenging global environment. In line with the December staff projections, the economy had continued to grow at a steady pace, even surprising slightly to the upside. Low unemployment, solid private sector balance sheets, the gradual roll-out of public spending on defence and infrastructure and the supportive effects of past interest rate cuts were underpinning growth. The inflation outlook continued to be in a good place and the incoming data had broadly confirmed the December staff projections. This broadly unchanged outlook supported keeping monetary policy unchanged. At the same time, the outlook remained uncertain, owing particularly to ongoing global trade policy uncertainty and geopolitical tensions. Such uncertainty could also justify keeping interest rates unchanged to see how various risks developed over the coming months. In particular, the current level of policy rates provided sufficient flexibility to act in response to shocks, in view of the two-sided inflation risks and taking into account a broad range of possible scenarios. All of this meant that the Governing Council could be patient, although this should not be mistaken for being hesitant to act or being asymmetric. Overall, the ECB was currently in a good place from a monetary policy point of view, but this did not mean that the stance was to be seen as static.
With regard to communication, members reiterated that the Governing Council was determined to ensure that inflation would stabilise at its 2% target in the medium term. Future interest rate decisions would continue to be based on its assessment of the inflation outlook and the risks surrounding it, in light of the incoming economic and financial data, as well as the dynamics of underlying inflation and the strength of monetary policy transmission. The Governing Council would also continue to follow a data-dependent and meeting-by-meeting approach to determining the appropriate monetary policy stance without pre-committing to a particular rate path.
The outlook for inflation remained more uncertain than usual, with the continuing possibility of large inflation and growth shocks in both directions. Events of recent weeks and those on the horizon highlighted that elevated uncertainty and unpredictability were likely to persist, and much of this could be viewed as radical, or Knightian, uncertainty. Therefore, it was important for the Governing Council to maintain full optionality in either direction for future meetings and to be agile in order to react quickly, if necessary, to new information that changed the outlook, or to large shocks. Communication should therefore remain non-committal about the future interest rate path, and it should not be interpreted as ruling out future interest rate changes in either direction should there be grounds for an adjustment.
Looking ahead, members reflected on possible strategies for future monetary policy. While the baseline outlook was benign, with resilient growth and inflation projected to remain around target, it also remained fragile, given the significant risks and uncertainties surrounding it. This environment called for a careful assessment of the evolving risk landscape. However, considering recent data surprises, it was also important to remain attentive not only to the major risks but also to subtle trends that could gradually derail the projected path of inflation away from target. Against this backdrop, it was particularly important to extract signals from incoming hard data. In this regard, the new staff projections in March would provide further insights, including on the recent downward surprise in inflation and on growth momentum. More specifically, it was important to carefully monitor wage growth dynamics and developments in services inflation to confirm whether underlying inflation was receding as projected. Similarly, it was important to closely monitor bank lending conditions, exchange rate developments, the effects of trade diversion and the evolution of consumption in order to assess the risks of a more pronounced or prolonged undershooting of the inflation target.
Still, the view was expressed that interest rates could remain at their current levels for an extended period as long as the incoming data did not point to any significant change in the baseline inflation outlook or the balance of risks around it. The near-term undershoot had been anticipated for a long time, with much of it attributable to developments in energy inflation, and it was argued that, in the medium term, inflation could be expected to remain close to the 2% target under a steady hand approach. From this perspective, it was seen as helpful for communication to anchor policy expectations around current levels.
At the same time, the view was expressed that inflation risks were tilted to the downside, or had been moving in that direction since the December meeting, in a context in which inflation was projected to remain close to target but still slightly below it. Market-based measures of inflation compensation had moved up across horizons but still suggested an undershoot of the target over the entire projection horizon, one which was also larger than the undershoot embedded in the December staff projections over much of the horizon. Option prices, meanwhile, implied a materially higher probability of inflation undershooting the target than overshooting it over the medium term. It was therefore important to avoid complacency, given the risk that a gradual increase in disinflationary pressures could lead to a material undershooting of the inflation target. It was also seen as vital to reiterate that the Governing Council’s target was fully symmetric over the medium term. In this context, the Governing Council should remain ready to adjust all of its instruments within its mandate to ensure that inflation stabilised sustainably at the medium-term target and to preserve the smooth functioning of monetary policy transmission.
Taking into account the foregoing discussion among the members, upon a proposal by the President, the Governing Council took the monetary policy decisions as set out in the monetary policy press release. The members of the Governing Council subsequently finalised the monetary policy statement, which the President and the Vice-President would, as usual, deliver at the press conference following the Governing Council meeting.
Monetary policy statement
Monetary policy statement for the press conference of 5 February 2026
Press release
Meeting of the ECB’s Governing Council, 4-5 February 2026
Members
- Ms Lagarde, President
- Mr de Guindos, Vice-President
- Mr Cipollone
- Mr Demarco
- Mr Dolenc, Deputy Governor of Banka Slovenije
- Mr Elderson
- Mr Escrivá
- Mr Kazāks
- Mr Kažimír
- Mr Kocher
- Mr Lane
- Mr Makhlouf*
- Mr Müller*
- Mr Nagel
- Mr Panetta
- Mr Patsalides
- Mr Pereira
- Mr Radev*
- Mr Rehn*
- Mr Reinesch
- Ms Schnabel
- Mr Šimkus
- Mr Sleijpen*
- Mr Stournaras
- Mr Villeroy de Galhau
- Mr Vujčić
- Mr Wunsch*
* Members not holding a voting right in February 2026 under Article 10.2 of the ESCB Statute.
Other attendees
- Mr Dombrovskis, Commissioner**
- Ms Senkovic, Secretary, Director General Secretariat
- Mr Rostagno, Secretary for monetary policy, Director General Monetary Policy
- Mr Kapadia, Head of Division, Directorate General Monetary Policy
** In accordance with Article 284 of the Treaty on the Functioning of the European Union.
Accompanying persons
- Ms Bénassy-Quéré
- Ms Brezigar
- Mr Dechaene
- Mr Gilbert
- Mr Horváth
- Mr Kaasik
- Mr Koukoularides
- Mr López
- Mr Lünnemann
- Mr Madouros
- Ms Mauderer
- Mr Meichenitsch
- Mr Nicoletti Altimari
- Ms Raposo
- Mr Rutkaste
- Ms Schembri
- Mr Šiaudinis
- Mr Šošić
- Mr Tavlas
- Mr Välimäki
Other ECB staff
- Mr Proissl, Director General Communications
- Ms Vansteenkiste, Counsellor to the President
- Ms Rahmouni-Rousseau, Director General Market Operations
- Mr Arce, Director General Economics
- Ms Nickel, Deputy Director General Economics
Release of the next monetary policy account foreseen on 16 April 2026.