

Sample Category Title
USD/CHF Daily Outlook
Daily Pivots: (S1) 0.9185; (P) 0.9232; (R1) 0.9273; More...
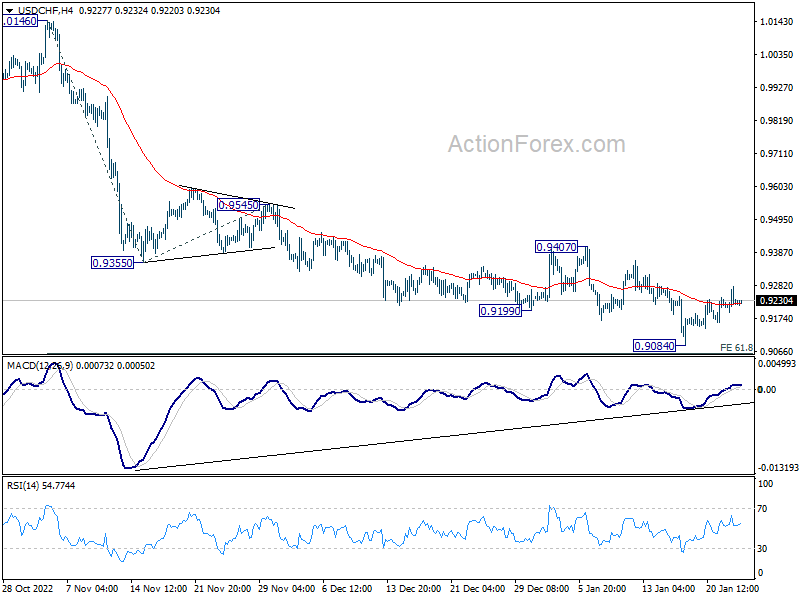
Intraday bias in USD/CHF remains neutral and outlook is unchanged. On the downside, sustained break of 61.8% projection of 1.0146 to 0.9355 from 0.9545 at 0.9056 will pave the way to 100% projection at 0.8754, which is close to 0.8756 long term support. Nevertheless, on the upside, break of 0.9407 should confirm short term bottoming and turn bias back to the upside.
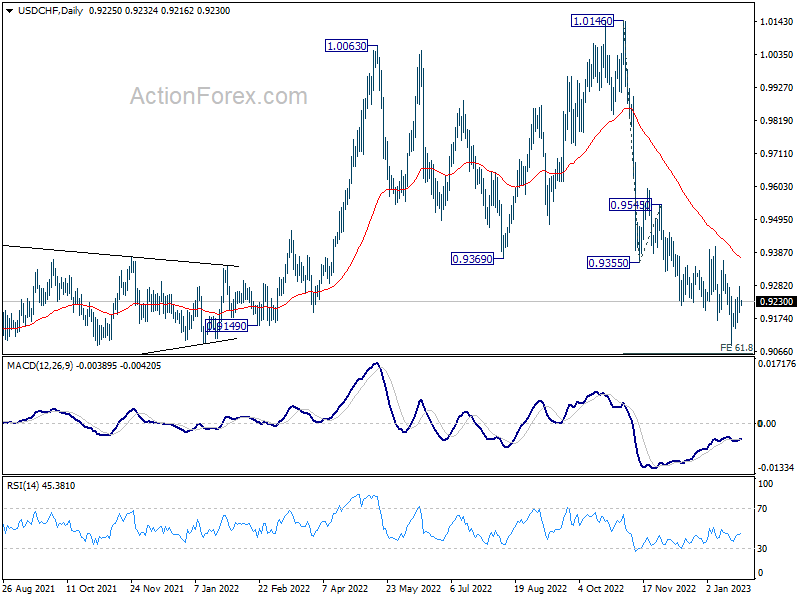
In the bigger picture, rise from 0.8756 (2021 low) has completed at 1.0146, well ahead of 1.0342 long term resistance (2016 high). Based on current downside momentum, fall from 1.0146 should be a medium term down trend itself. Next target is a test on 0.8756 low. Strong support should be seen there to bring rebound. Still, further decline will now be expected as long as 0.9407 resistance holds, in any case.
USD/JPY Daily Outlook
Daily Pivots: (S1) 129.57; (P) 130.34; (R1) 130.96; More...
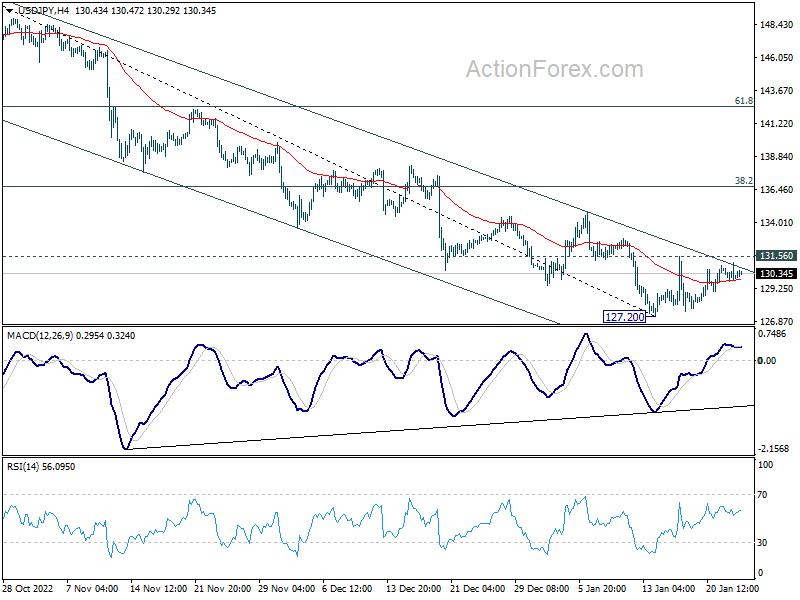
Range trading continues in USD/JPY and intraday bias remains neutral for the moment. On the downside, break of 127.20 will resume the whole decline from 151.93 and target 121.43 fibonacci level. Nevertheless, on the upside, break of 131.56 should confirm short term bottoming, and turn bias back to the upside for stronger rebound to 55 day EMA (now at 134.34).
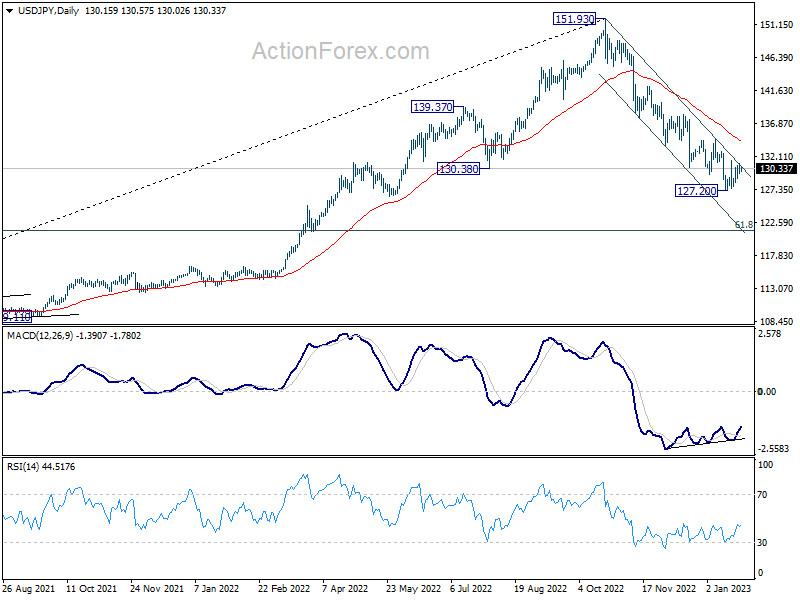
In the bigger picture, the break of 55 week EMA (now at 131.47) raises the chance of medium term bearish reversal, but that's not confirmed yet. Strong support could be seen around 61.8% retracement of 102.58 to 151.93 at 121.43 and 38.2% retracement of 75.56 to 151.93 at 122.75 to bring rebound. But break of 131.56 resistance is needed to indicate bottoming first. Otherwise further fall will remain in favor.
USD/CAD Daily Outlook
Daily Pivots: (S1) 1.3339; (P) 1.3376; (R1) 1.3405; More....
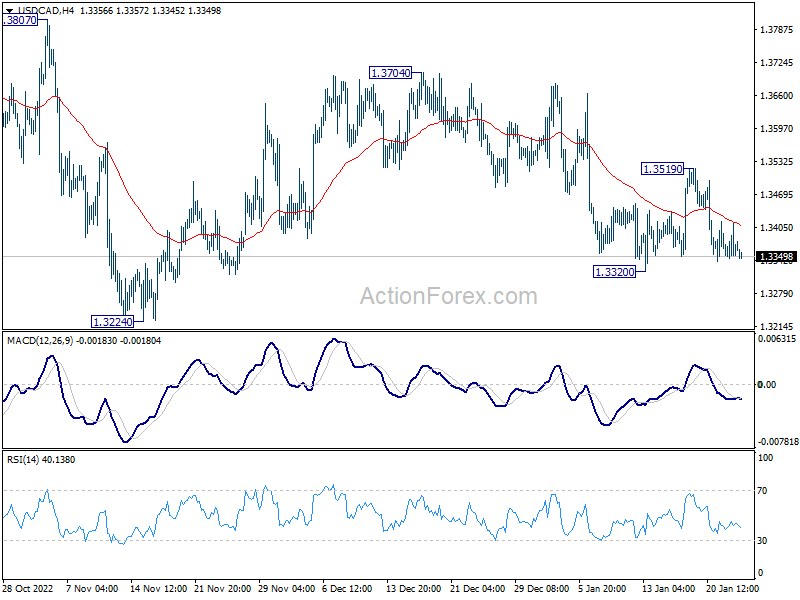
USD/CAD is still bounded in range of 1.3320/3519 and intraday bias remains neutral first. On the downside, break of 1.3320 will resume the fall from 1.3704 to 1.3224 key support level. On the upside, though, above 1.3519 will turn bias back to the upside for 1.3704 resistance.
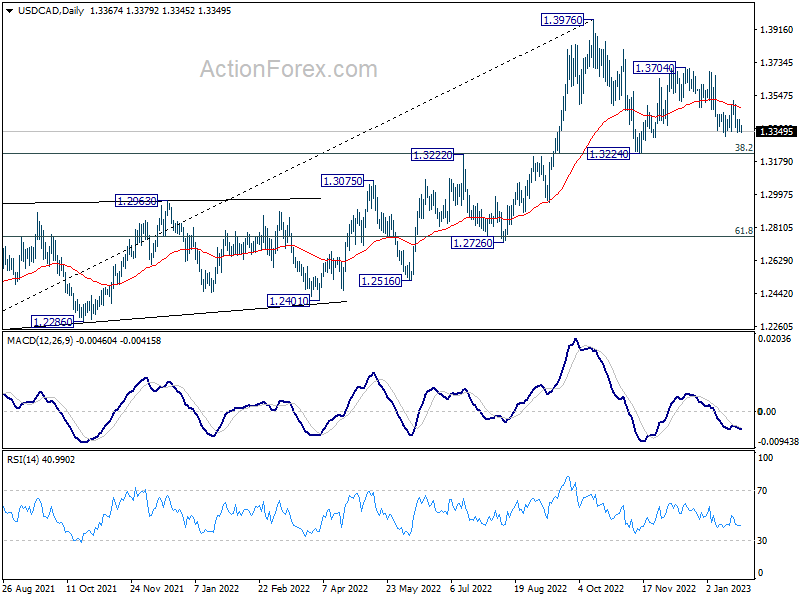
In the bigger picture, as long as 1.3222 cluster support (38.2% retracement of 1.2005 to 1.3976 at 1.3223) holds, larger up trend from 1.2005 (2021 low) is still expected to resume through 1.3976 high at a later stage. However, firm break of 1.3222/3 will indicate that the trend might have reversed. Deeper fall would be seen to next cluster support at 1.2726 (61.8% retracement at 1.2758).
Mixed Results, Mixed Data, Mixed Sentiment
Trading in the US was eventless, except for the wild moves that marked the opening bell at the NYSE.
The S&P 500 swung around the 4000, without any major moves up or down, as investors remained undecided faced with mixed company earnings, and mixed economic data.
Both US services and manufacturing PMI came in better than expected in January, but both remain in the contraction zone. While the Richmond Manufacturing index fell to -11, significantly lower than -5 expected by analysts.
In summary, the data confirmed a certain slowdown in US economic activity, but it didn’t point to a free fall.
The US 2-year yield fell for the second straight session, as the soft data kept the Federal Reserve (Fed) doves at a soft and warm spot.
But at the current levels, the swap market suggests around 48 bp rate increase over the next two FOMC meetings. This means that the present activity in the swap market gives around 8% probability for no rate hike at all after the Fed’s February meeting.
And if that’s what keeps the S&P500 bid around the 4000 mark, it’s worrying.
Earnings, earnings
The S&P 500 could or could not get a boost from Microsoft at today’s session, as Microsoft announced better-than-expected results yesterday after the market close, but the results were not all rosy. The revenue – which grew at its slowest pace since 2016 - slightly missed expectations, but the earnings beat estimates. The Intelligent Cloud segment grew 18%, as the Azure services grew 31% - slower than the past quarter but better than expected with the prospects of being further boosted by the ChatGPT deal. The shares rallied 5% in the afterhours, but gains were mostly given back.
S&P 500 futures are down -0.40% at the time of writing.
Today, it’s Tesla’s turn to go to the earnings confessional after the bell, and nobody can tell you with confidence what will happen to the share price once the results are freshly out of the oven.
Tesla is doing very well, the company announced record car deliveries quarter after quarter, but the record deliveries weren’t enough to meet the market expectations over the past three quarters. And unfortunately, the expectations make the market price, and missing them is no good thing for the share price.
In the FX
The US dollar remains under the pressure of soft data, and worryingly softening Fed expectations, while the euro got the boost that we were hoping for at yesterday’s PMI release.
The EURUSD is again testing the 1.09 level to the upside this morning. And the gently widening divergence between the hawkish European Central Bank (ECB) expectations and the dovish Fed expectations remains supportive of a further advance. But be careful, the pair is about to step into the overbought market, which could slow the rally into the 1.10 target.
Across the Channel, the numbers were not as enchanting as on the main continent, and no one is surprised I guess to see the services PMI plunge to 48 in January with all the strikes going on. The manufacturing PMI on the other hand contracted less than expected but a new report suggested that the number of UK firms facing collapse jumped by more than a third at the end of last year.
Cable plunged below its year-to-date ascending channel, and the euro-pound is bought without much hesitation at the 50, 100-DMA levels, and should continue pressuring higher on a broadly stronger euro.
In Canada, the Bank of Canada (BoC) is preparing to announce its final 25bp hike. The dollar-CAD puts more weight into clearing the 1.3350 support, but crude oil is not helping, as the price of a barrel of American crude continues bumping its head against the solid $82pb wall, the 100-DMA, without being able to break it to the upside.
The API data showed almost 3.4-million-barrel build in the US inventories last week, hinting that the more official EIA data could also disappoint the bulls at today’s read.
But the medium term outlook for crude oil remains positive, therefore, price pullbacks remain interesting dip buying opportunities as long as the 50-DMA support, which stands a touch below the $78pb mark, holds.
Upbeat PMIs Ease Recession Fears
Market movers today
The German IFO index for January is on the agenda today. The German economy has been holding up better than feared in Q4 22, thanks to a range of tailwinds from mild weather to a large order backlog and easing supply bottlenecks in industry. A further improvement in the IFO business climate would add to the positive signals from other leading indicators such as ZEW and PMI, supporting easing recession risks in the market.
In Sweden, December PPI is likely to show a high print again, after electricity prices rose sharply.
The 60 second overview
Euro area: Both manufacturing and service sector PMIs came out stronger than expected, which pushed the composite index above 50 ie. to a level no longer pointing towards economic contraction. That said, the figures were a 'two-sided sword' for the ECB as euro area still appears caught in stagflationary environment in early 2023. Strong labour market, improved consumer confidence and the reopening in China could give a further boost to PMIs over the coming months, but at the same time selling price pressures increased for both goods and services from December. In our view, the combination of a resilient economy yet still elevated inflation risks supports our call for 50bp ECB hikes at both February and March meetings.
US: Also US Flash PMIs ticked higher from December, although the levels still remain consistent with a modest recession. While it seems that the risk of a hard landing has eased, input price pressures rose both in manufacturing, and especially services sector (63.7, from 58.3). Employment indices eased just slightly, but overall labour market conditions still appear tight, and wage-driven inflation risks have not yet eased completely. We expect Fed to hike its policy rate to 5.00-5.25% with three consecutive 25bp hikes, but markets' focus has already shifted towards the looming rate cuts. We take a look at the factors which will eventually determine the pace and timing of the cuts in our preview for the next week's meeting, see Research US - Fed preview: What it takes for the Fed to cut rates, 24 January.
Australian CPI: Overnight, the Reserve Bank of Australia's (RBA) preferred trimmed-mean measure of inflation picked up more than expected in Q4 to 6.9% y/y (from 6.1%), which is the highest level since 1988. Despite the cooling labour markets, the figures increased the risk of RBA continuing its hiking cycle in February (with markets now pricing around 80% probability of a 25bp hike) and supported AUD/USD close to our 1M target of 0.71.
FI: It was a rather choppy trading session yesterday through most of the day amid mixed European PMIs. In the late afternoon, US treasuries' volatile reaction to the US PMIs initially sent yields higher, but spreads were marginally tighter on the day and did not seem affected by Spain mandating banks for a new 10y. Curves recorded a minor flattening from the long end. The long end tap from EU (2053) saw strong demand and is likely to have supported the demand for long end papers.
FX: In a fairly uneventful session the HUF stood out as the session winner while NOK and GBP traded slightly on the back-foot. EUR/USD started the session by moving lower but later erased losses leaving the cross virtually unchanged on the day just below the 1.09 threshold. EUR/SEK is hovering just north of 11.10, which marks the lowest level so far this year.
Credit: Credit markets were jittery on Tuesday on the back of a softish overall market for risk assets. Itrax main widened 0.6bp to close at 79.0bp while Itrax xover widened 3.9bp to close at 416.5bp. Primary markets remained open but were still somewhat muted due to reporting season being in full swing currently.
AUD/USD Daily Report
Daily Pivots: (S1) 0.7007; (P) 0.7032; (R1) 0.7071; More...
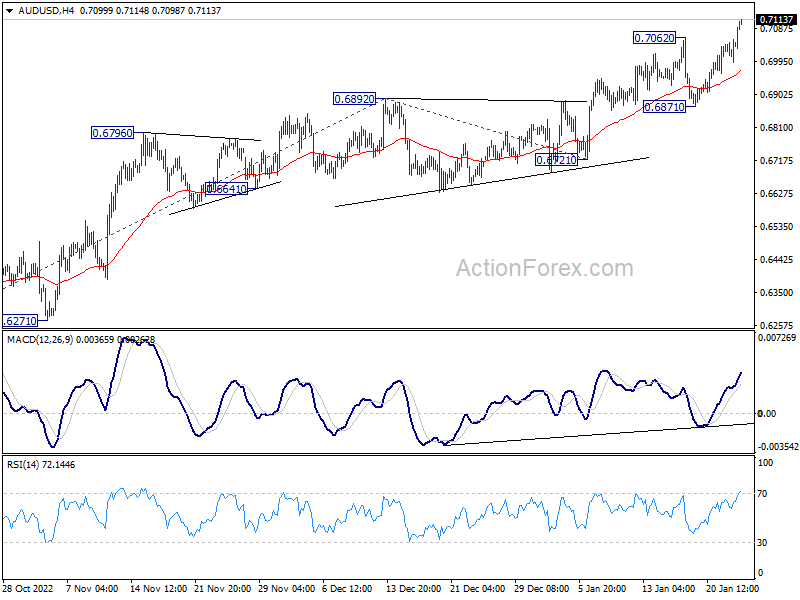
AUD/USD's rally resumes by breaking through 0.7062 and intraday bias is back on the upside. Current rise from 0.6169 should target 61.8% projection of 0.6169 to 0.6892 from 0.6721 at 0.7168 next. Break there will target 0.7304 fibonacci level. On the downside, break of 0.6871 support is needed to indicate short term topping. Otherwise, outlook will stay bullish in case of retreat.
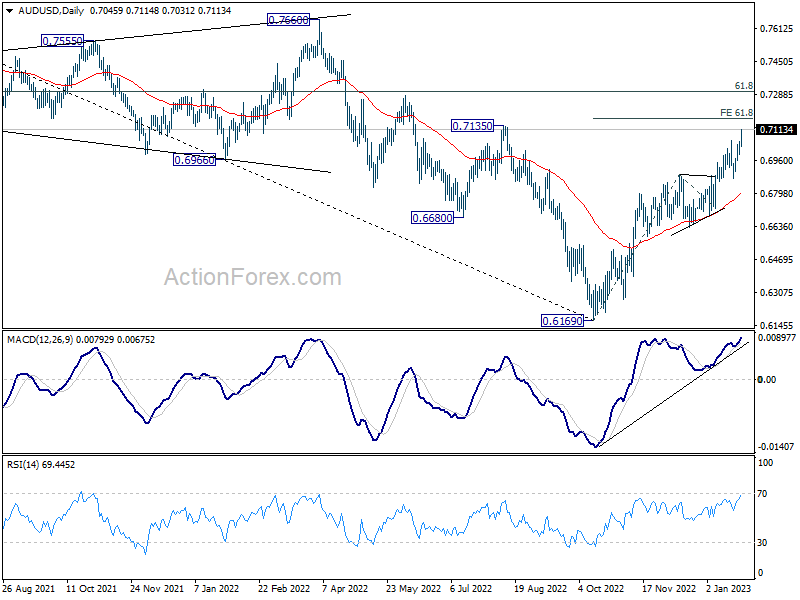
In the bigger picture, corrective decline from 0.8006 (2021 high) should have completed with three waves down to 0.6169 (2022 low). Further rally should be seen to 61.8% retracement of 0.8006 to 0.6169 at 0.7304. Sustained break there will pave the way to retest 0.8006. This will now remain the favored case as long as 0.6721 support holds.
Aussie Soars, Kiwi Tumbles, Loonie Awaits BoC
Australian Dollar rises broadly today after strong CPI data supports continuation of tightening by RBA. On the other hand, New Zealand CPI didn't accelerate as RBNZ projected, and markets are lowering their expectation on the terminal rate. Kiwi, thus falls broadly. Canadian Dollar is firm as focus turns to BoC rate decision, where a final "insurance" hike is expected in the current cycle. As for the week, Aussie is the strongest, followed by Euro. Yen is the worst, followed by Sterling. Dollar is mixed in between.
In Asia, Nikkei closed up 0.35%. Japan 10-year JGB yield rose 0.249 to 0.437. Singapore Strait Times is up 1.66%. Hong Kong and China are still on holiday. Overnight, DOW rose 0.31%. S&P 500 dropped -0.07%. NASDAQ dropped -0.27%. 10-year yield fell -0.056 to 3.469.
New Zealand CPI unchanged at 7.2% yoy in Q4
New Zealand CPI rose 1.4% qoq in Q4, slightly below expectation of 1.5% qoq. Annual CPI was unchanged at 7.2% yoy, above expectation of 7.1% yoy, comparing to the peak at 7.3% yoy in Q2.
StatsNZ said, "Housing and household utilities was the largest contributor to the December 2022 annual inflation rate. This was due to rising prices for both constructing and renting housing."
The quarterly rise in inflation was "influenced by rising prices in the housing and household utilities, food, and recreation and culture groups."
Australia CPI rose to 8.4% yoy in Dec, 7.8% yoy in Q4
Australia CPI rose 1.9% qoq in Q4, above expectation of 1.7% qoq. Annual CPI accelerated from 7.3% yoy to 7.8% yoy, above expectation of 7.5% yoy. RBA trimmed mean CPI also accelerated from 6.1% yoy to 6.9% yoy, above expectation of 6.5% yoy.
Michelle Marquardt, ABS head of prices statistics, said "This is the fourth consecutive quarter to show a rise greater than any seen since the introduction of the Goods and Services Tax (GST) in 2000. The increase for the quarter was slightly higher than the quarterly movements for the September and June quarters last year (both 1.8 per cent)."
"The annual increase for the CPI is the highest since 1990. Annual inflation for goods such as new dwellings and automotive fuel steadied this quarter, however we saw an uptick in inflation for services such as holidays and restaurant meals," Marquardt said.
Monthly CPI accelerated from 7.3% yoy to 8.4% yoy in December, well above expectation of 7.7% yoy.
Marquardt said, "The monthly indicator recorded the largest annual rise in the series in December. The most significant contributors in the 12 months to December were New dwellings, up 16.0 per cent, and Holiday travel and accommodation, up 29.3 per cent. Airfare and accommodation prices rose in response to strong demand over the Christmas holiday period."
AUD/NZD and AUD/CAD extends up trend
Australian Dollar surges broadly after much stronger than expected CPI reading in December in particular dented any hope for an imminent RBA pause. Meanwhile, New Zealand Dollar is just mixed as CPI didn't accelerate as RBNZ projected, raising hope of a lower terminal rate.
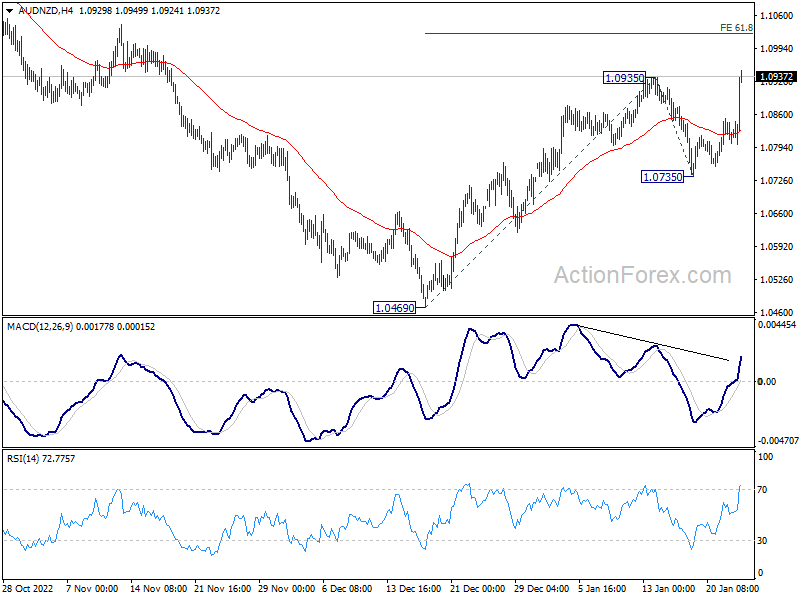
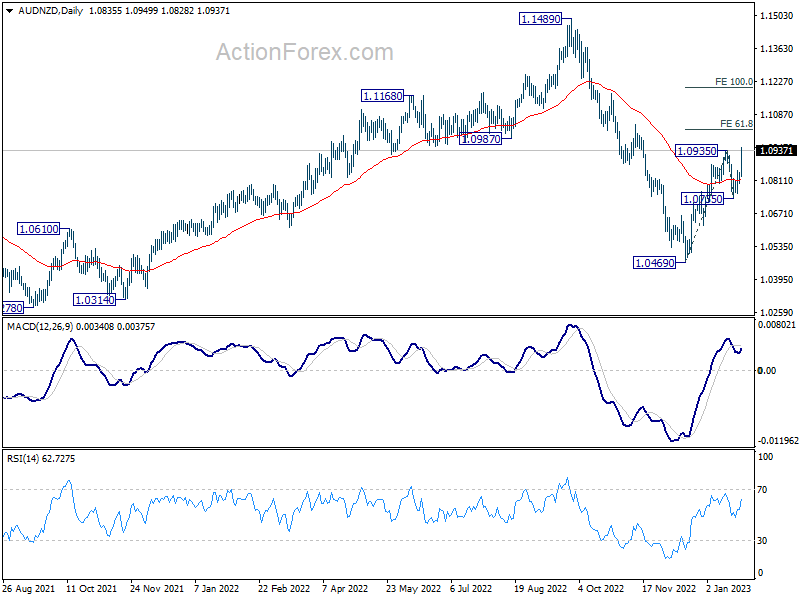
AUD/NZD breaks through 1.0935 resistance to resume the whole rally from 1.0469. The support from 55 day EMA is seen as a near term bullish favor. Further rise is now expected as long as 1.0735 support holds. Next target is 61.8% projection of 1.0469 to 1.0935 from 1.0735 at 1.1023. Firm break there would prompt upside acceleration to 100% projection at 1.1201 next.
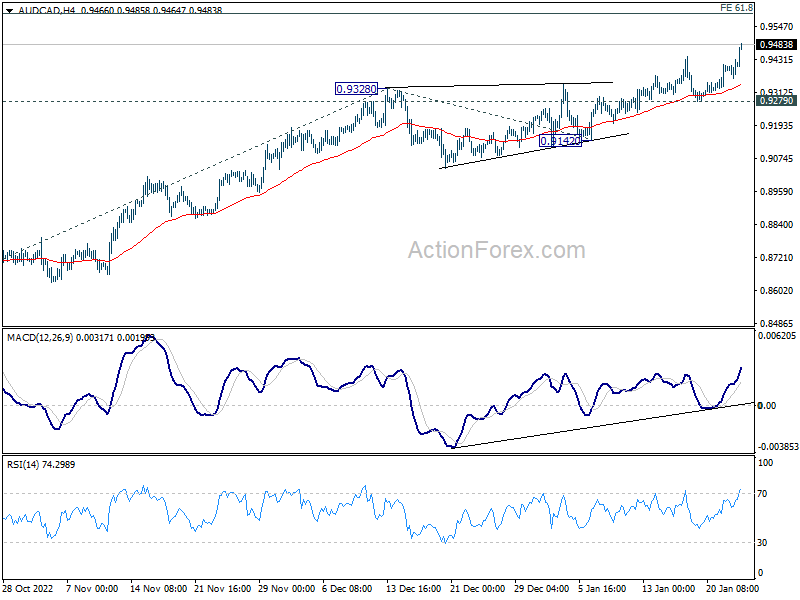
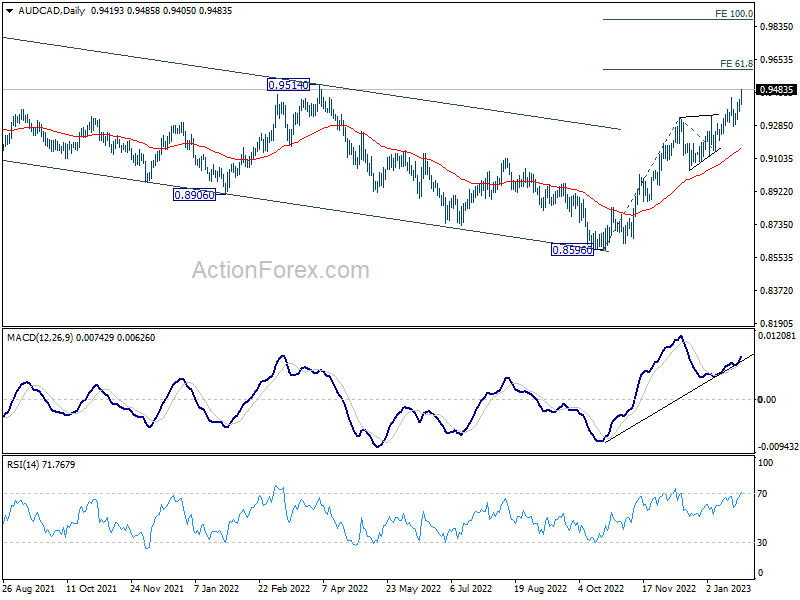
AUD/CAD also breaks through 0.9442 temporary top to resume the rally from 0.8596. Near term outlook will stay bullish as long as 0.9279 support holds. Next target is 61.8% projection of 0.8596 to 0.9328 from 0.9142 at 0.9594. Sustained break there would also prompt upside acceleration to 100% projection at 0.9874 next.
ECB Simkus backs hikes of 50bps in the coming meetings
ECB Governing Council member Gediminas Simkus said yesterday, "core inflation remains strong and demonstrates that the fight against inflation is not over."
"There's a strong case for staying on the course that's been set for the coming meetings of 50 basis-point increases. In my opinion, these 50 basis-point increases must be taken unequivocally," he added.
"Pressures in wage growth are increasing — I expect wage increases to exceed historical averages in the euro area," he said. "It's something that's happening and something we need to take into account because it affects core inflation."
"It's clear to me that the current economic environment requires us to deliver increases of 50 basis points in the coming meetings," he said. "When we move to the more distant periods of the summer or next autumn, we need to wait and see."
SNB Schlegel: Cannot rule out further interest increases
SNB Vice Chairman Martin Schlegel said yesterday, "we cannot rule out further interest increases at present," even though inflation is forecast to fall back to 2.4% in 2023, and 1.8% in 2024.
"The maintenance of price stability has absolute priority for the SNB," he added.
Meanwhile, Schlegel also expects a weak growth dynamic in the coming quarters.
BoC Previews: One more insurance hike before pausing
BoC is expected to deliver an "insurance" rate hike of 25bps today, to bring policy rate to 4.50%. After this eighth consecutive increase, the central bank is expected to pause the tightening cycle.
It's already indicated in the December statement that the bank will be "considering whether the policy interest rate needs to rise further". BoC should more explicitly indicate that it's now the time to let pass rate hikes work through the economy.
The question would then shift to the time interest rate is going to stay at this level, but no answer is expected any time soon.
Here are some previews on BoC:
- Will BoC Press the Hike Button One More Time?
- Market Pricing and Economists Favour a 25bp Hike from the BOC Tomorrow
- Bank of Canada Likely to Make One Last Rate Hike—Then Take a Breather
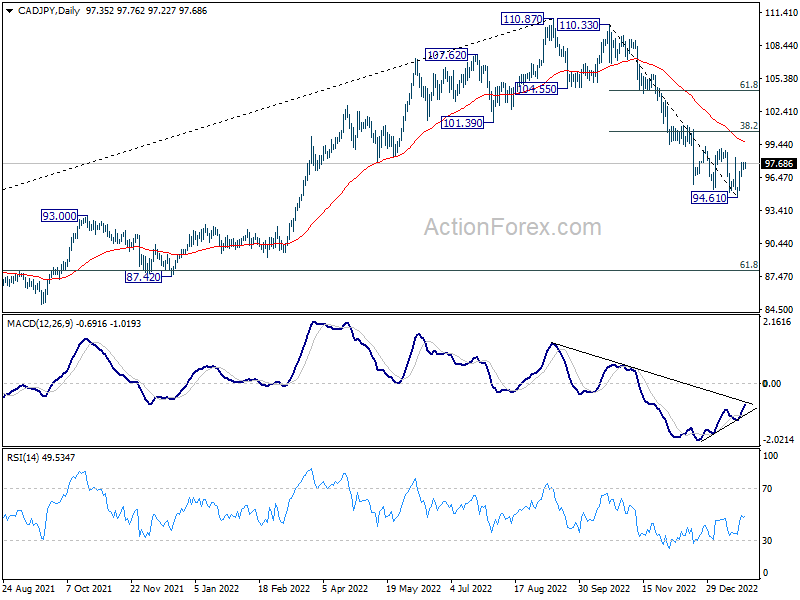
CAD/JPY has been losing downside momentum for some time, as seen in daily MACD and a bounce is overdue. Yet, even in case of a rebound, strong resistance could be seen between 55 day EMA (now at 99.65) and 38.2% retracement of 110.33 to 94.61 at 100.61 to cap upside. Until 100.61 is taken out decisively, any bounce is more of a short opportunity than a turnaround.
Elsewhere
UK PPI, Swiss Credit Suisse economic expectations and Germany Ifo business climate will also be featured today.
AUD/USD Daily Report
Daily Pivots: (S1) 0.7007; (P) 0.7032; (R1) 0.7071; More...
AUD/USD's rally resumes by breaking through 0.7062 and intraday bias is back on the upside. Current rise from 0.6169 should target 61.8% projection of 0.6169 to 0.6892 from 0.6721 at 0.7168 next. Break there will target 0.7304 fibonacci level. On the downside, break of 0.6871 support is needed to indicate short term topping. Otherwise, outlook will stay bullish in case of retreat.
In the bigger picture, corrective decline from 0.8006 (2021 high) should have completed with three waves down to 0.6169 (2022 low). Further rally should be seen to 61.8% retracement of 0.8006 to 0.6169 at 0.7304. Sustained break there will pave the way to retest 0.8006. This will now remain the favored case as long as 0.6721 support holds.
Economic Indicators Update
| GMT | Ccy | Events | Actual | Forecast | Previous | Revised |
|---|---|---|---|---|---|---|
| 21:45 | NZD | CPI Q/Q Q4 | 1.40% | 1.50% | 2.20% | |
| 21:45 | NZD | CPI Y/Y Q4 | 7.20% | 7.10% | 7.20% | |
| 23:30 | AUD | Westpac Leading Index M/M Dec | -0.10% | -0.10% | ||
| 00:30 | AUD | CPI Q/Q Q4 | 1.90% | 1.70% | 1.80% | |
| 00:30 | AUD | CPI Y/Y Q4 | 7.80% | 7.50% | 7.30% | |
| 00:30 | AUD | RBA Trimmed Mean CPI Q/Q Q4 | 1.70% | 1.60% | 1.80% | 1.90% |
| 00:30 | AUD | RBA Trimmed Mean CPI Y/Y Q4 | 6.90% | 6.50% | 6.10% | |
| 00:30 | AUD | Monthly CPI Y/Y Dec | 8.40% | 7.70% | 7.30% | |
| 07:00 | GBP | PPI Input M/M Dec | 0.90% | 0.60% | ||
| 07:00 | GBP | PPI Input Y/Y Dec | 19.20% | 19.20% | ||
| 07:00 | GBP | PPI Output M/M Dec | 0.70% | 0.30% | ||
| 07:00 | GBP | PPI Output Y/Y Dec | 13.90% | 14.80% | ||
| 07:00 | GBP | PPI Core Output M/M Dec | 1.10% | 0.50% | ||
| 07:00 | GBP | PPI Core Output Y/Y Dec | 13.90% | 13.30% | ||
| 09:00 | CHF | Credit Suisse Economic Expectations Jan | -42.8 | |||
| 09:00 | EUR | Germany IFO Business Climate Jan | 90.5 | 88.6 | ||
| 09:00 | EUR | Germany IFO Current Assessment Jan | 95 | 94.4 | ||
| 09:00 | EUR | Germany IFO Expectations Jan | 85 | 83.2 | ||
| 15:00 | CAD | BoC Rate Decision | 4.50% | 4.25% | ||
| 15:30 | USD | Crude Oil Inventories | 1.2M | 8.4M | ||
| 16:00 | CAD | BoC Press Conference |
BoC Previews: One more insurance hike before pausing
BoC is expected to deliver an "insurance" rate hike of 25bps today, to bring policy rate to 4.50%. After this eighth consecutive increase, the central bank is expected to pause the tightening cycle.
It's already indicated in the December statement that the bank will be "considering whether the policy interest rate needs to rise further". BoC should more explicitly indicate that it's now the time to let pass rate hikes work through the economy.
The question would then shift to the time interest rate is going to stay at this level, but no answer is expected any time soon.
Here are some previews on BoC:
- Will BoC Press the Hike Button One More Time?
- Market Pricing and Economists Favour a 25bp Hike from the BOC Tomorrow
- Bank of Canada Likely to Make One Last Rate Hike—Then Take a Breather
CAD/JPY has been losing downside momentum for some time, as seen in daily MACD and a bounce is overdue. Yet, even in case of a rebound, strong resistance could be seen between 55 day EMA (now at 99.65) and 38.2% retracement of 110.33 to 94.61 at 100.61 to cap upside. Until 100.61 is taken out decisively, any bounce is more of a short opportunity than a turnaround.
Technical Outlook and Review
USD/JPY:
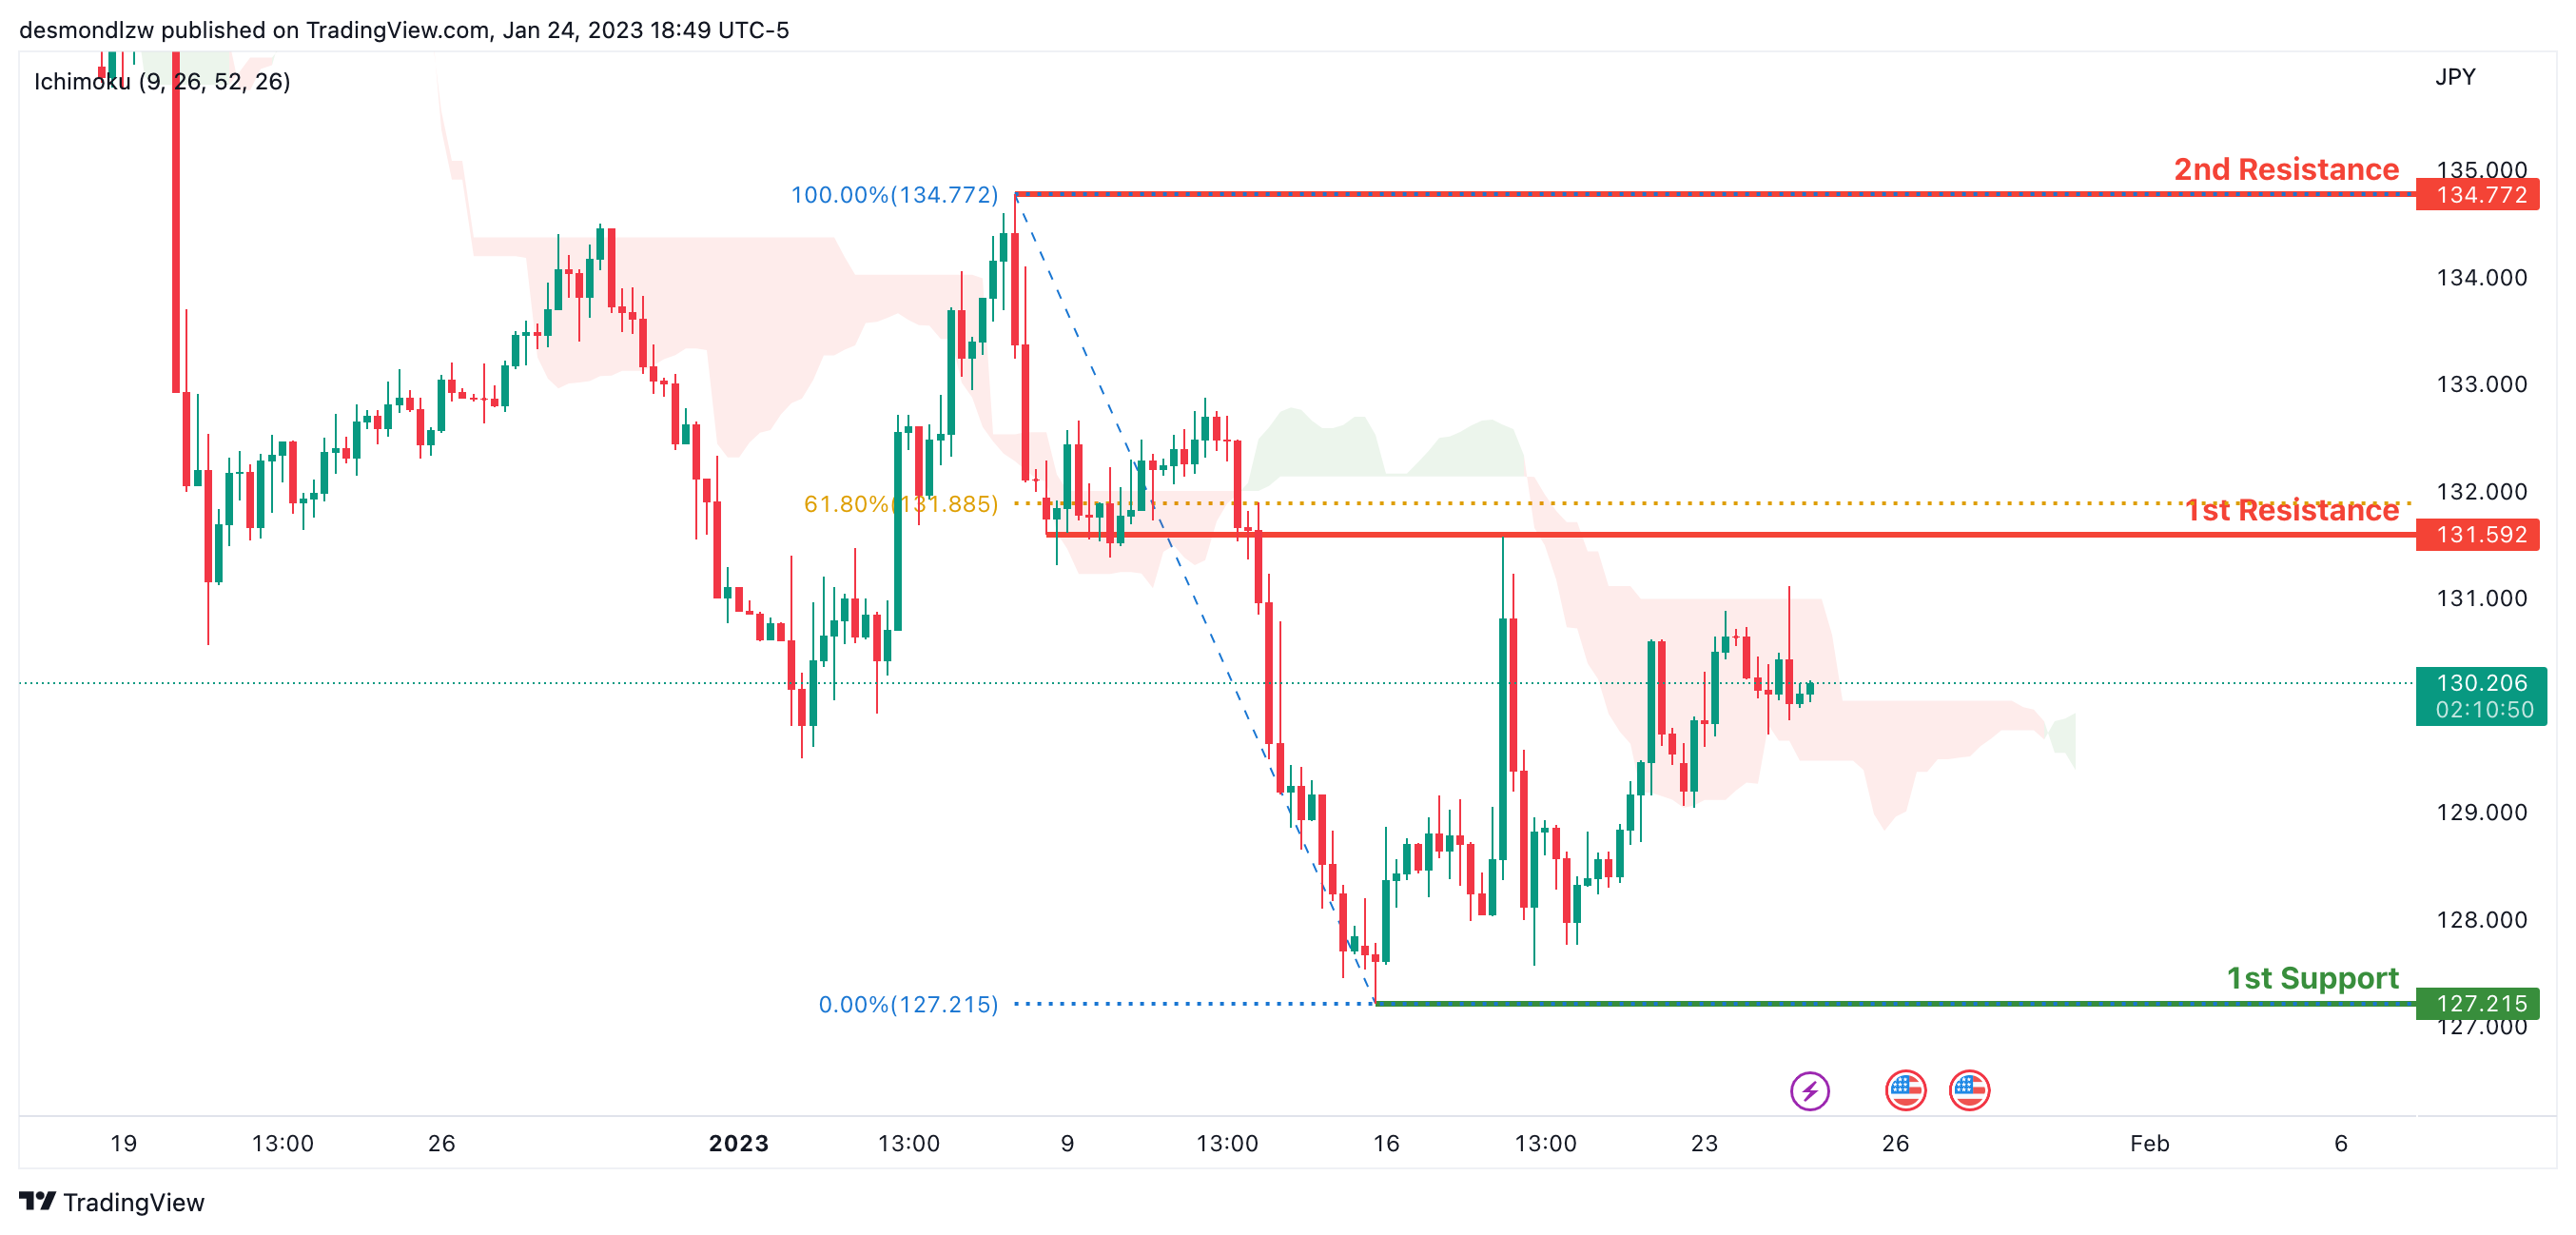
Looking at the H4 chart, my overall bias for USDJPY is bullish due to the current price crossing above the Ichimoku cloud, indicating a bullish market. If this bullish momentum continues, expect the price to possibly continue heading towards the 1st resistance level at 131.592, where the 61.8% Fibonacci line is. In an alternate scenario, price could possibly head back down to retest the 1st support at 127.215, where the previous swing low is.
Areas of consideration:
- H4 time frame, 1st resistance at 131.592
- H4 time frame, 1st support at 127.215
DXY:
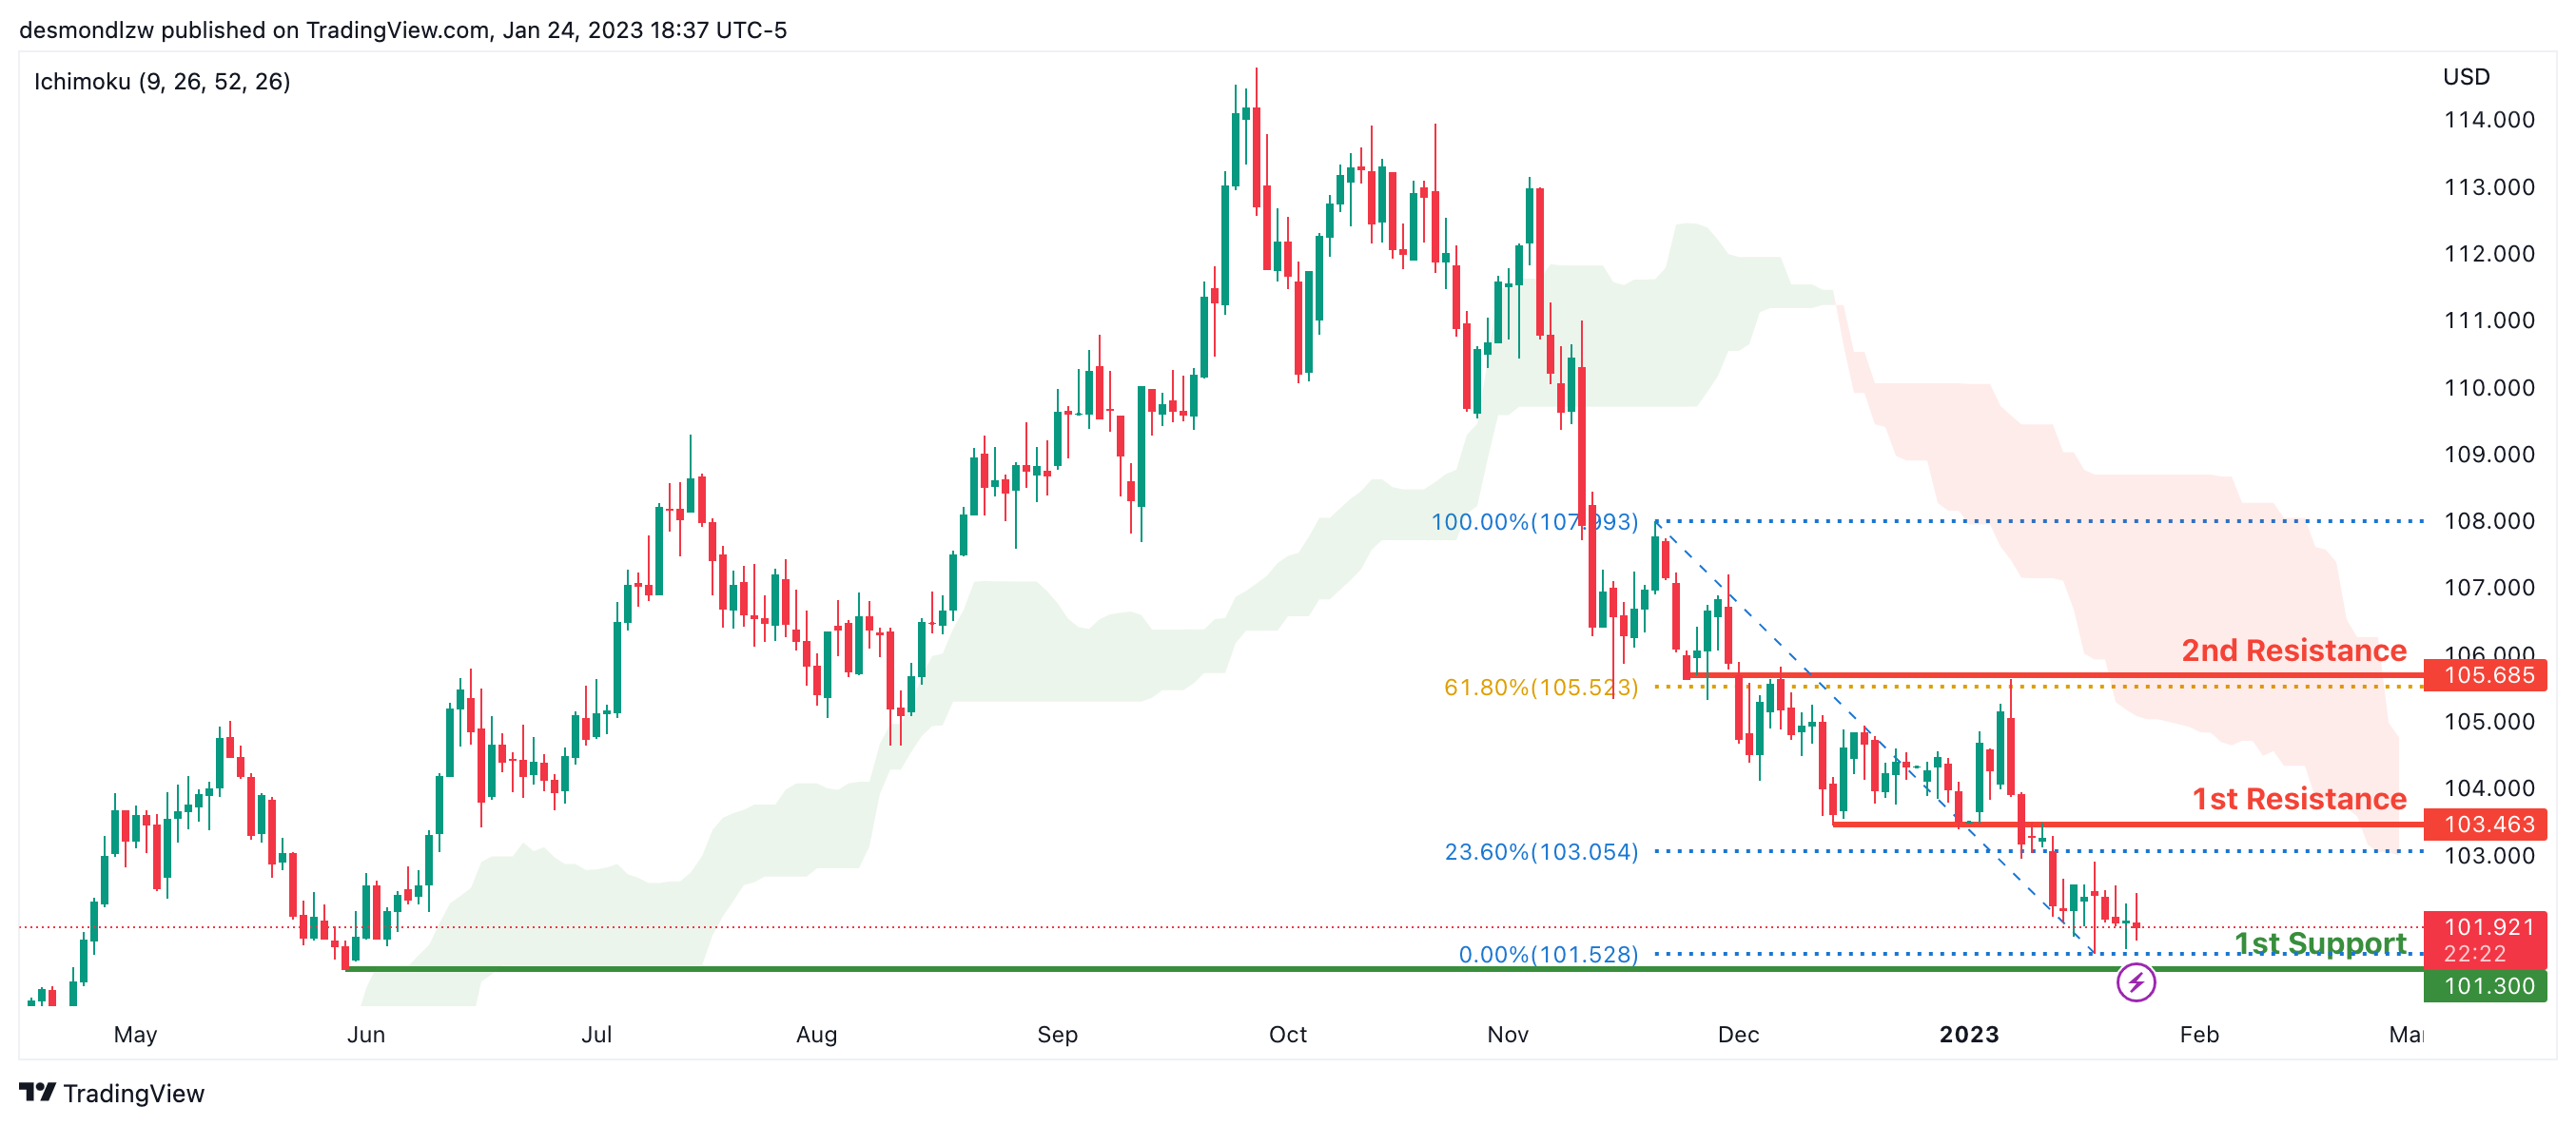
Looking at the Daily chart, my overall bias for DXY is bearish due to the current price being below the Ichimoku cloud, indicating a bearish market. If this bearish momentum continues, expect the price to possibly continue heading towards the 1st support at 101.300, where the previous low is. . In an alternative scenario, price could head back up to retest the 1st resistance at 103.463, where the 23.6% Fibonacci line is.
Areas of consideration:
- H4 time frame, 1st resistance at 103.463
- H4 time frame, 1st support at 101.300
EUR/USD:
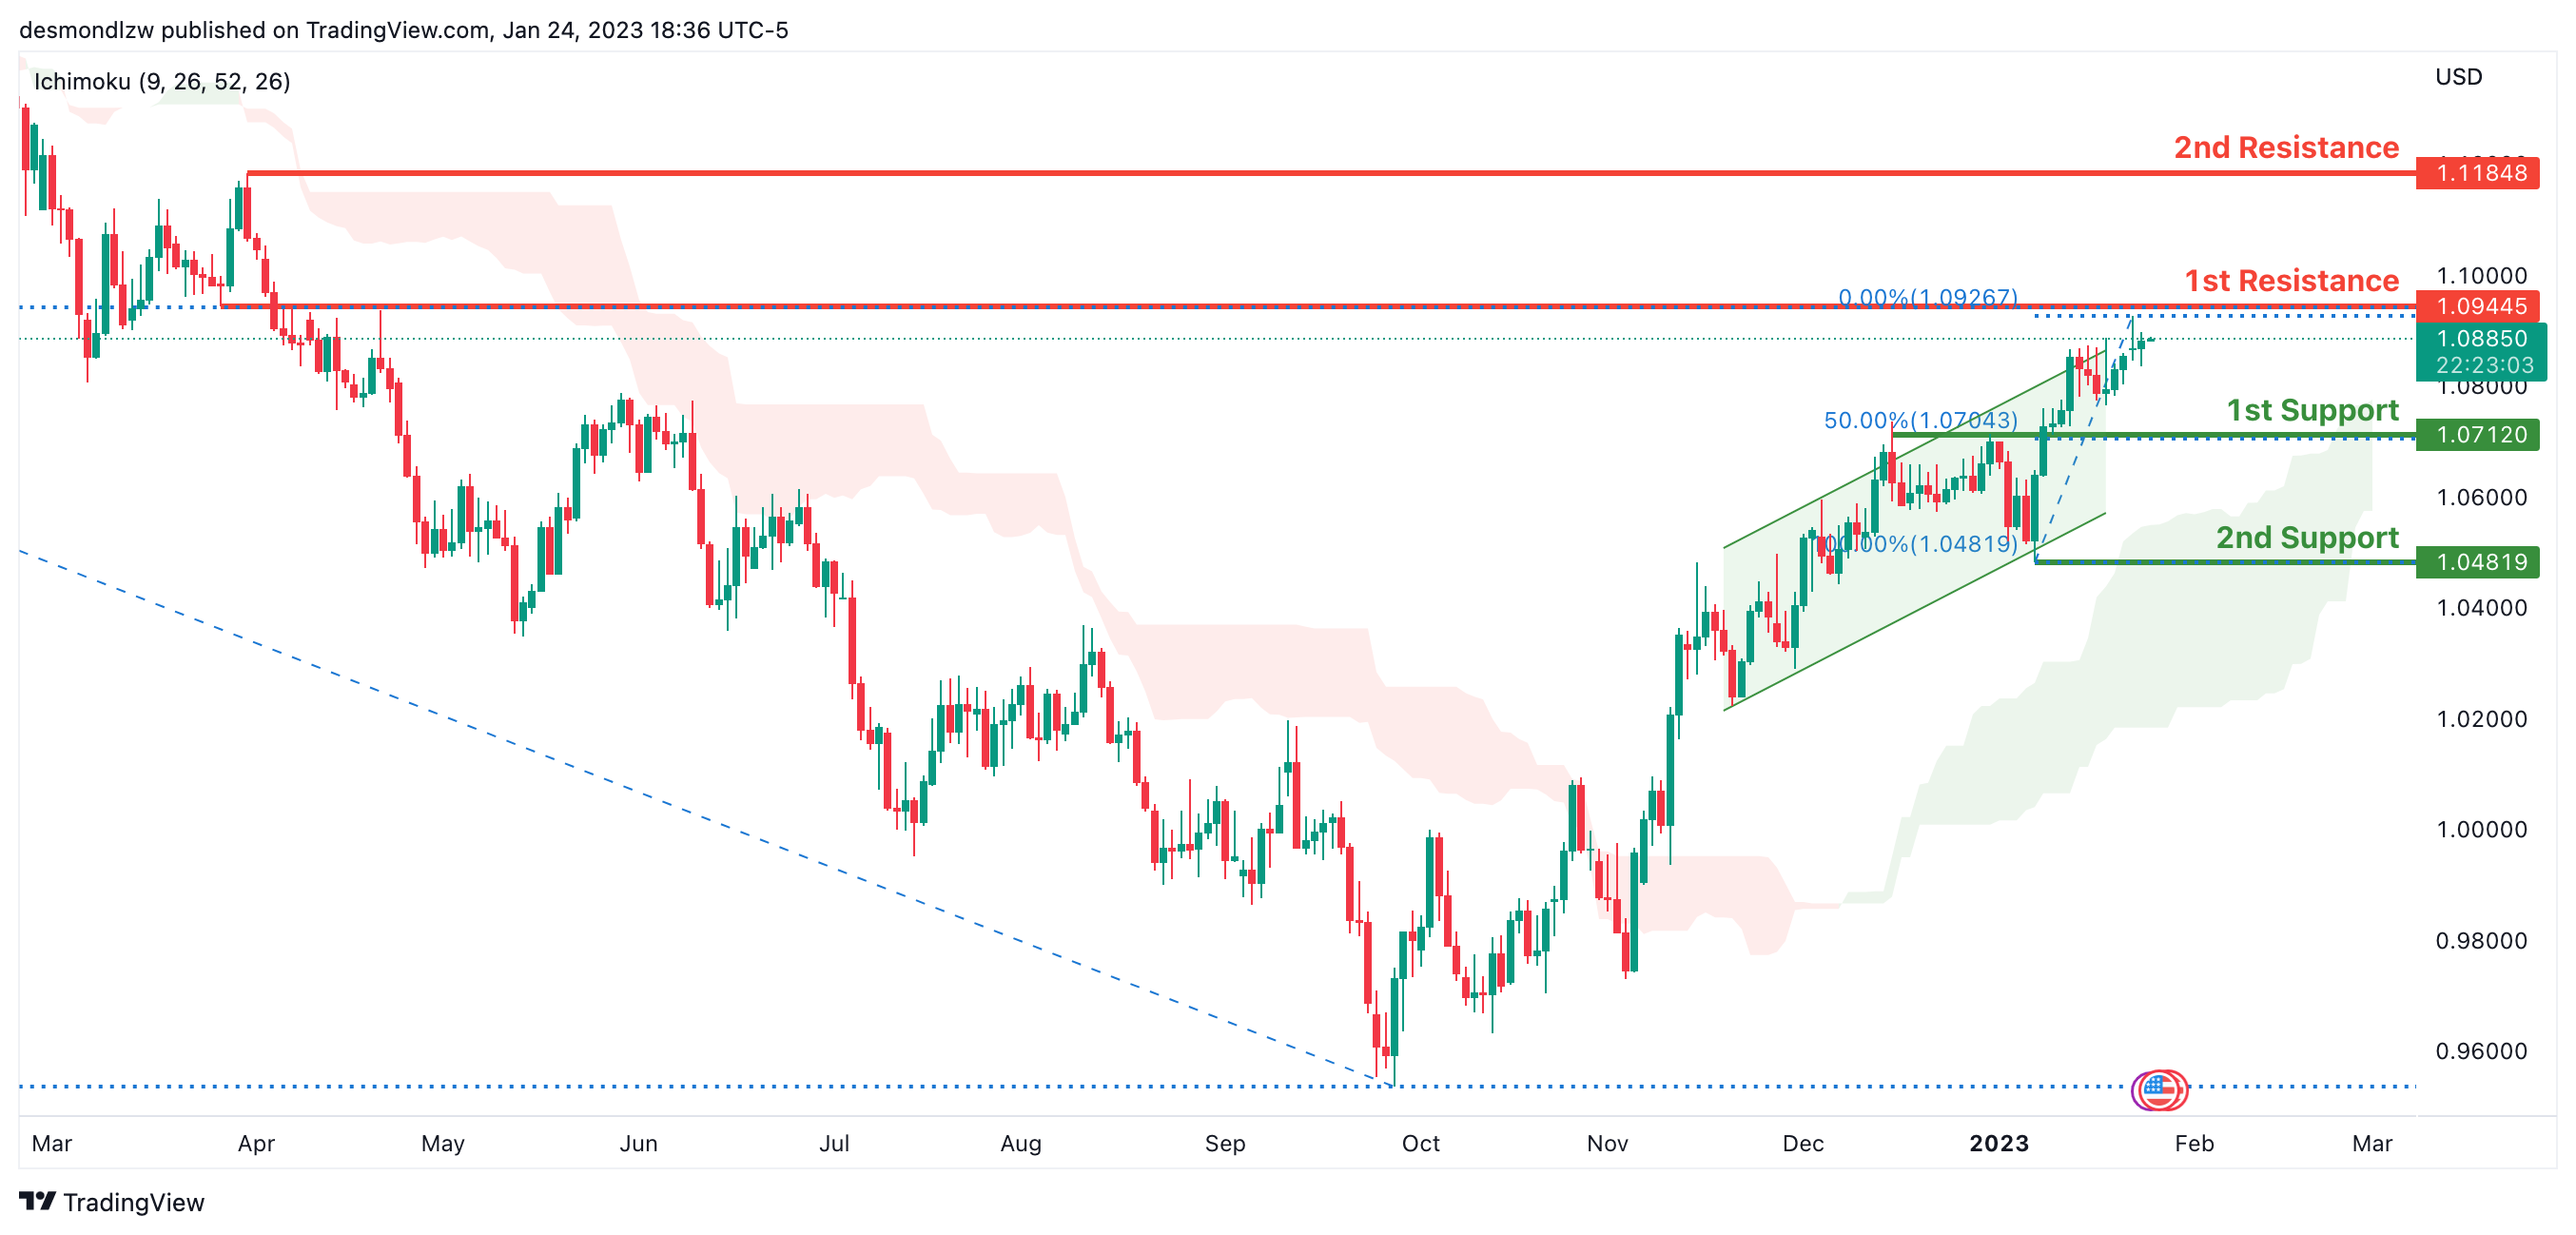
Looking at the Daily chart, my overall bias for EURUSD is bullish due to the current price being above the Ichimoku cloud, indicating a bullish market structure. To add confluence to this bias, price is also within an ascending channel. If this bullish momentum continues, expect the price to possibly continue heading towards the 1st resistance at 1.09445, where the 50% Fibonacci line is. In an alternate scenario, price could possibly head back down to retest the 1st support level at 1.07120, where the 50% Fibonacci line is.
Areas of consideration :
- H4 1st resistance at 1.09445
- H4 1st support at 1.07120
GBP/USD:
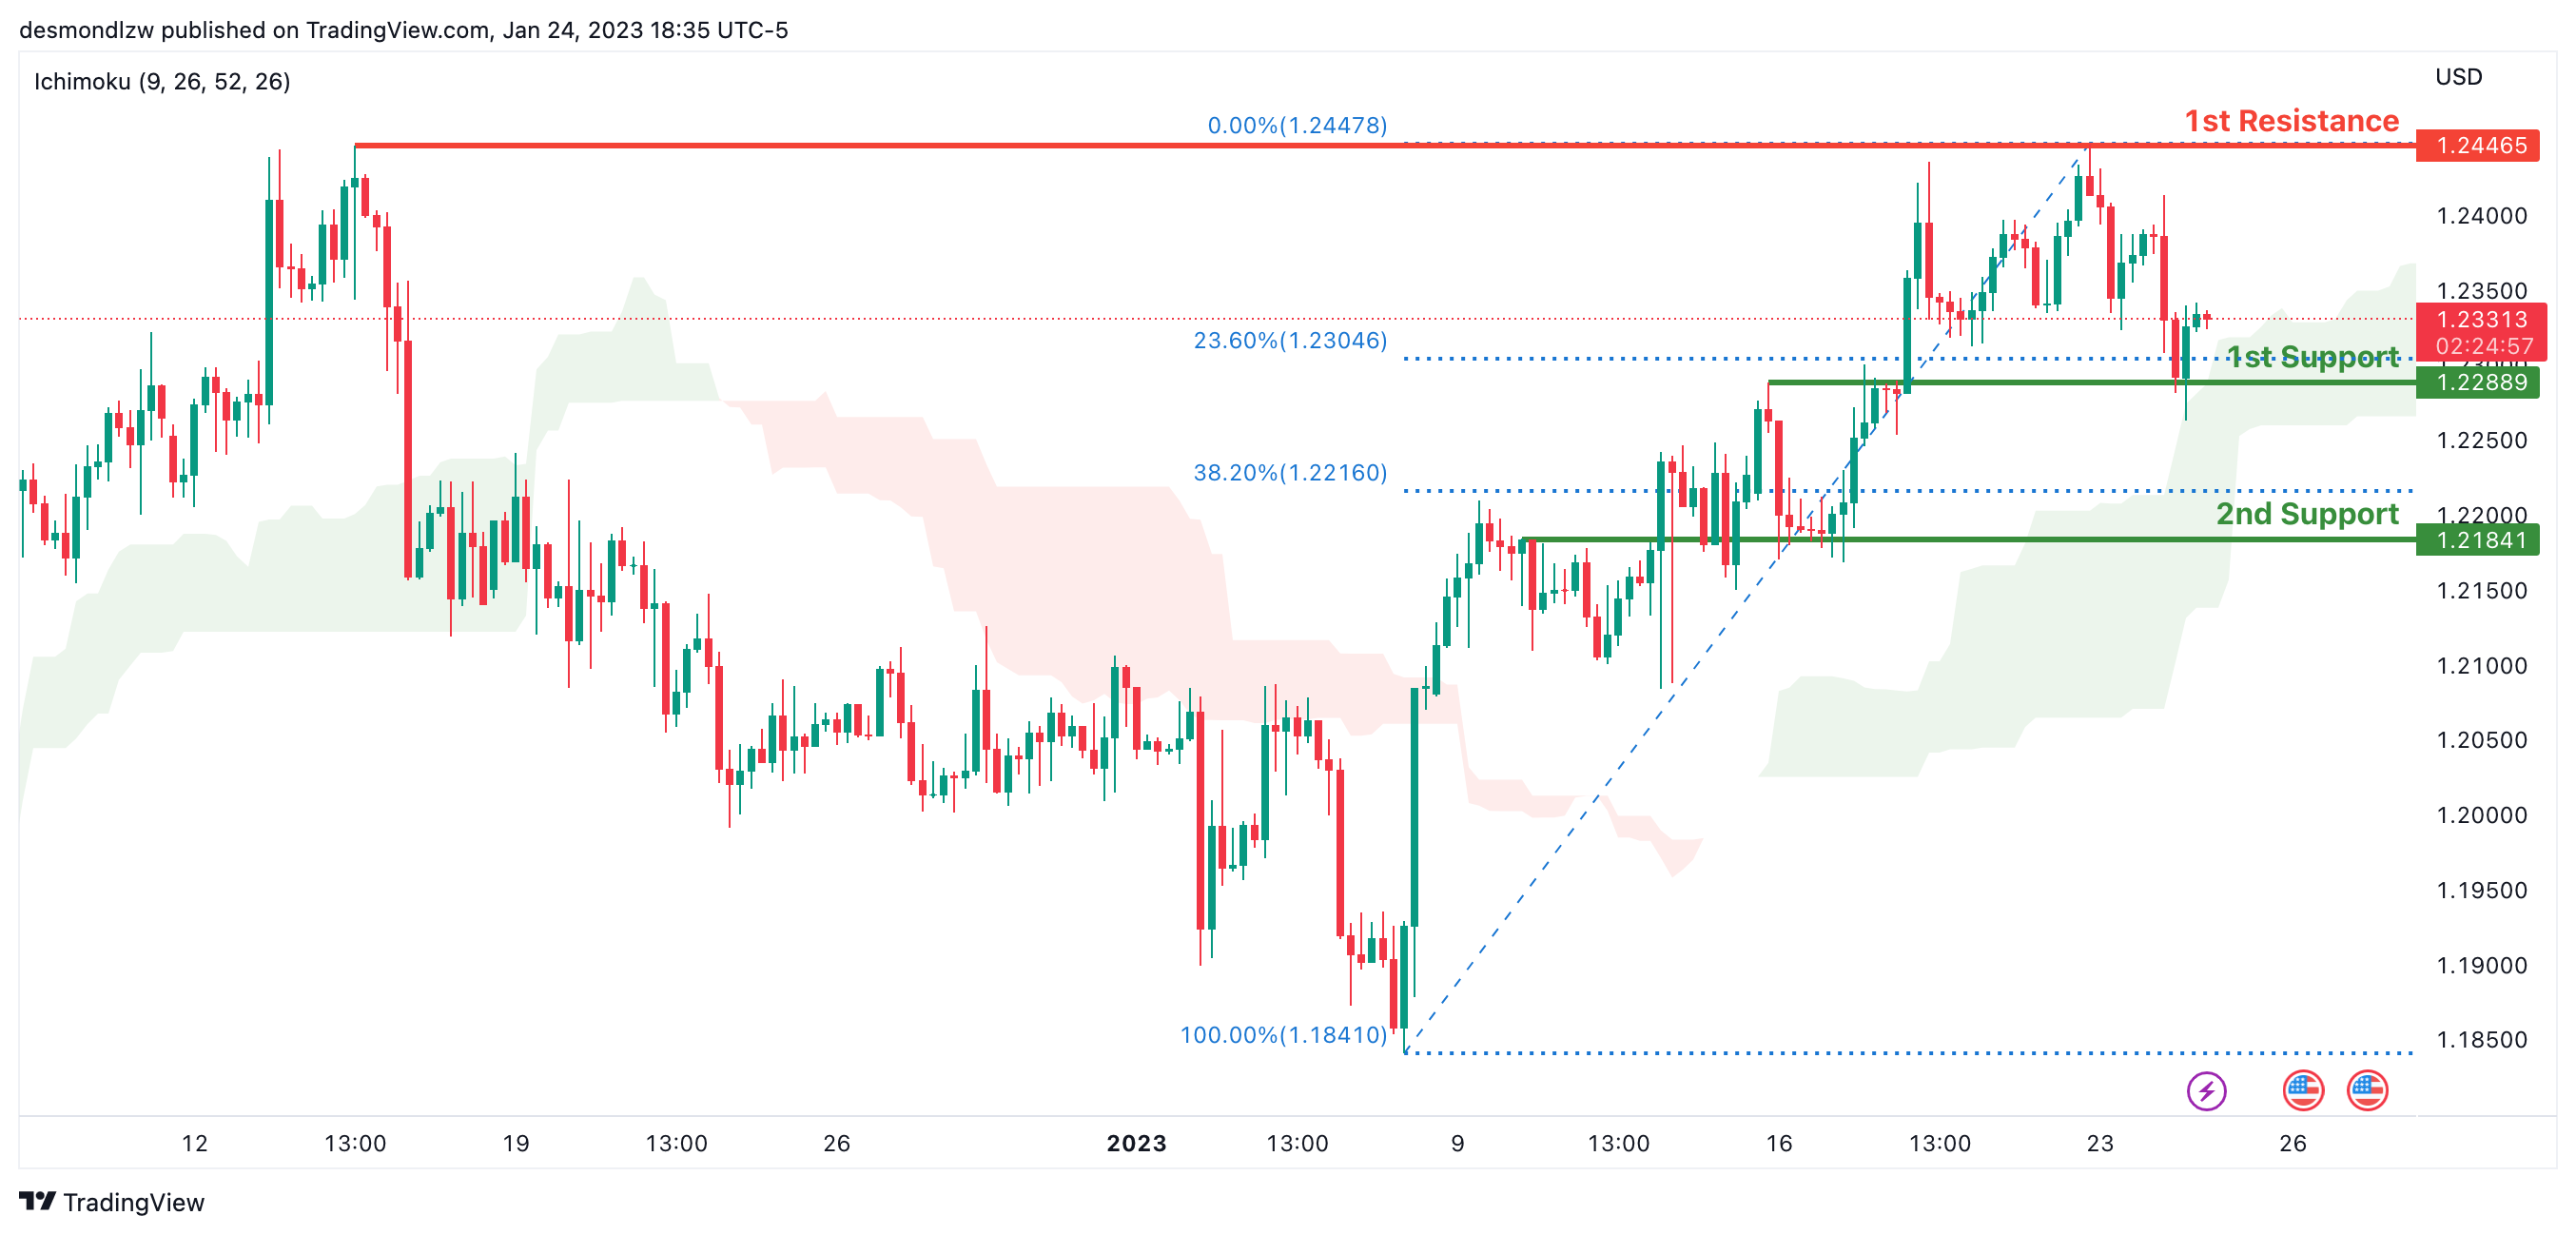
Looking at the H4 chart, my overall bias for GBPUSD is bullish due to the current price being above the Ichimoku cloud, indicating a bullish market. If this bullish momentum continues, expect price to possibly continue heading towards the 1st resistance line at 1.24465, where the previous swing high is. In an alternate scenario, price could possibly head back down and retest the 1st support at 1.22889, where the 23.6% Fibonacci line is.
Areas of consideration:
- H4 1st resistance at 1.24465
- H4 1st support at 1.22889
USD/CHF:
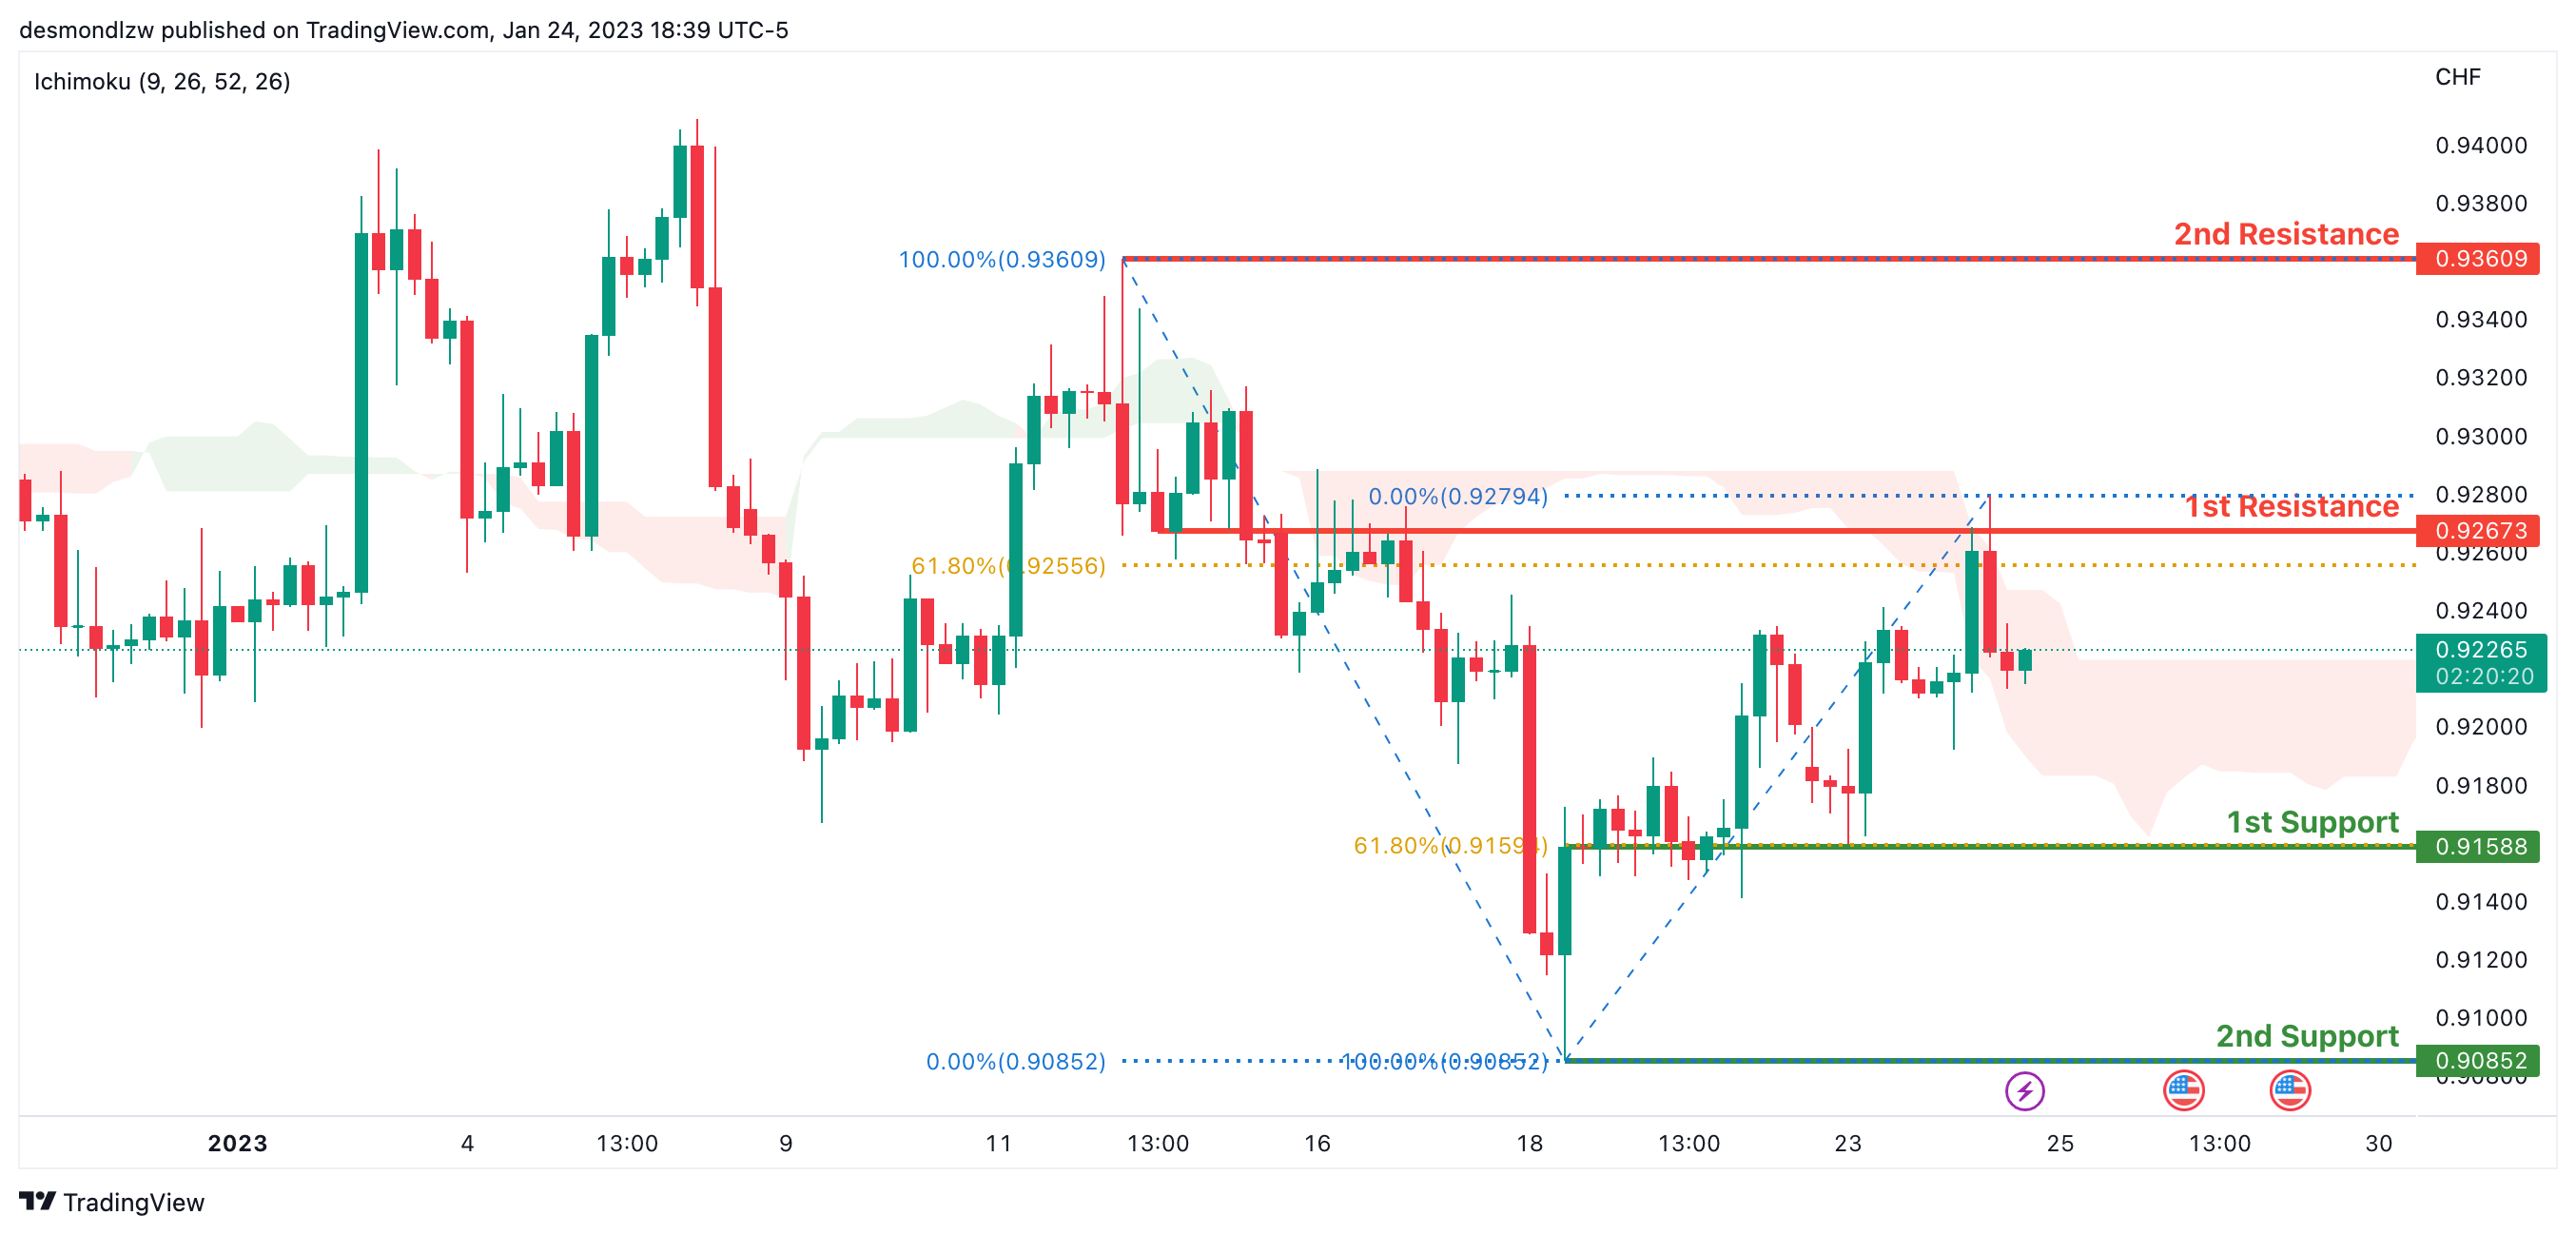
Looking at the H4 chart, my overall bias for USDCHF is bullish due to the current price crossing above the Ichimoku cloud, indicating a bullish market. If the current bullish trend continues, expect the price to possibly continue to head towards the 1st resistance at 0.92673, where the 61.8% Fibonacci line is. In an alternative scenario, price could possibly head back down to retest the 1st support at 0.91588, where the 61.8% Fibonacci line is.
Areas of consideration
- H4 1st support at 0.91588
- H4 1st resistance at 0.92673
XAU/USD (GOLD):
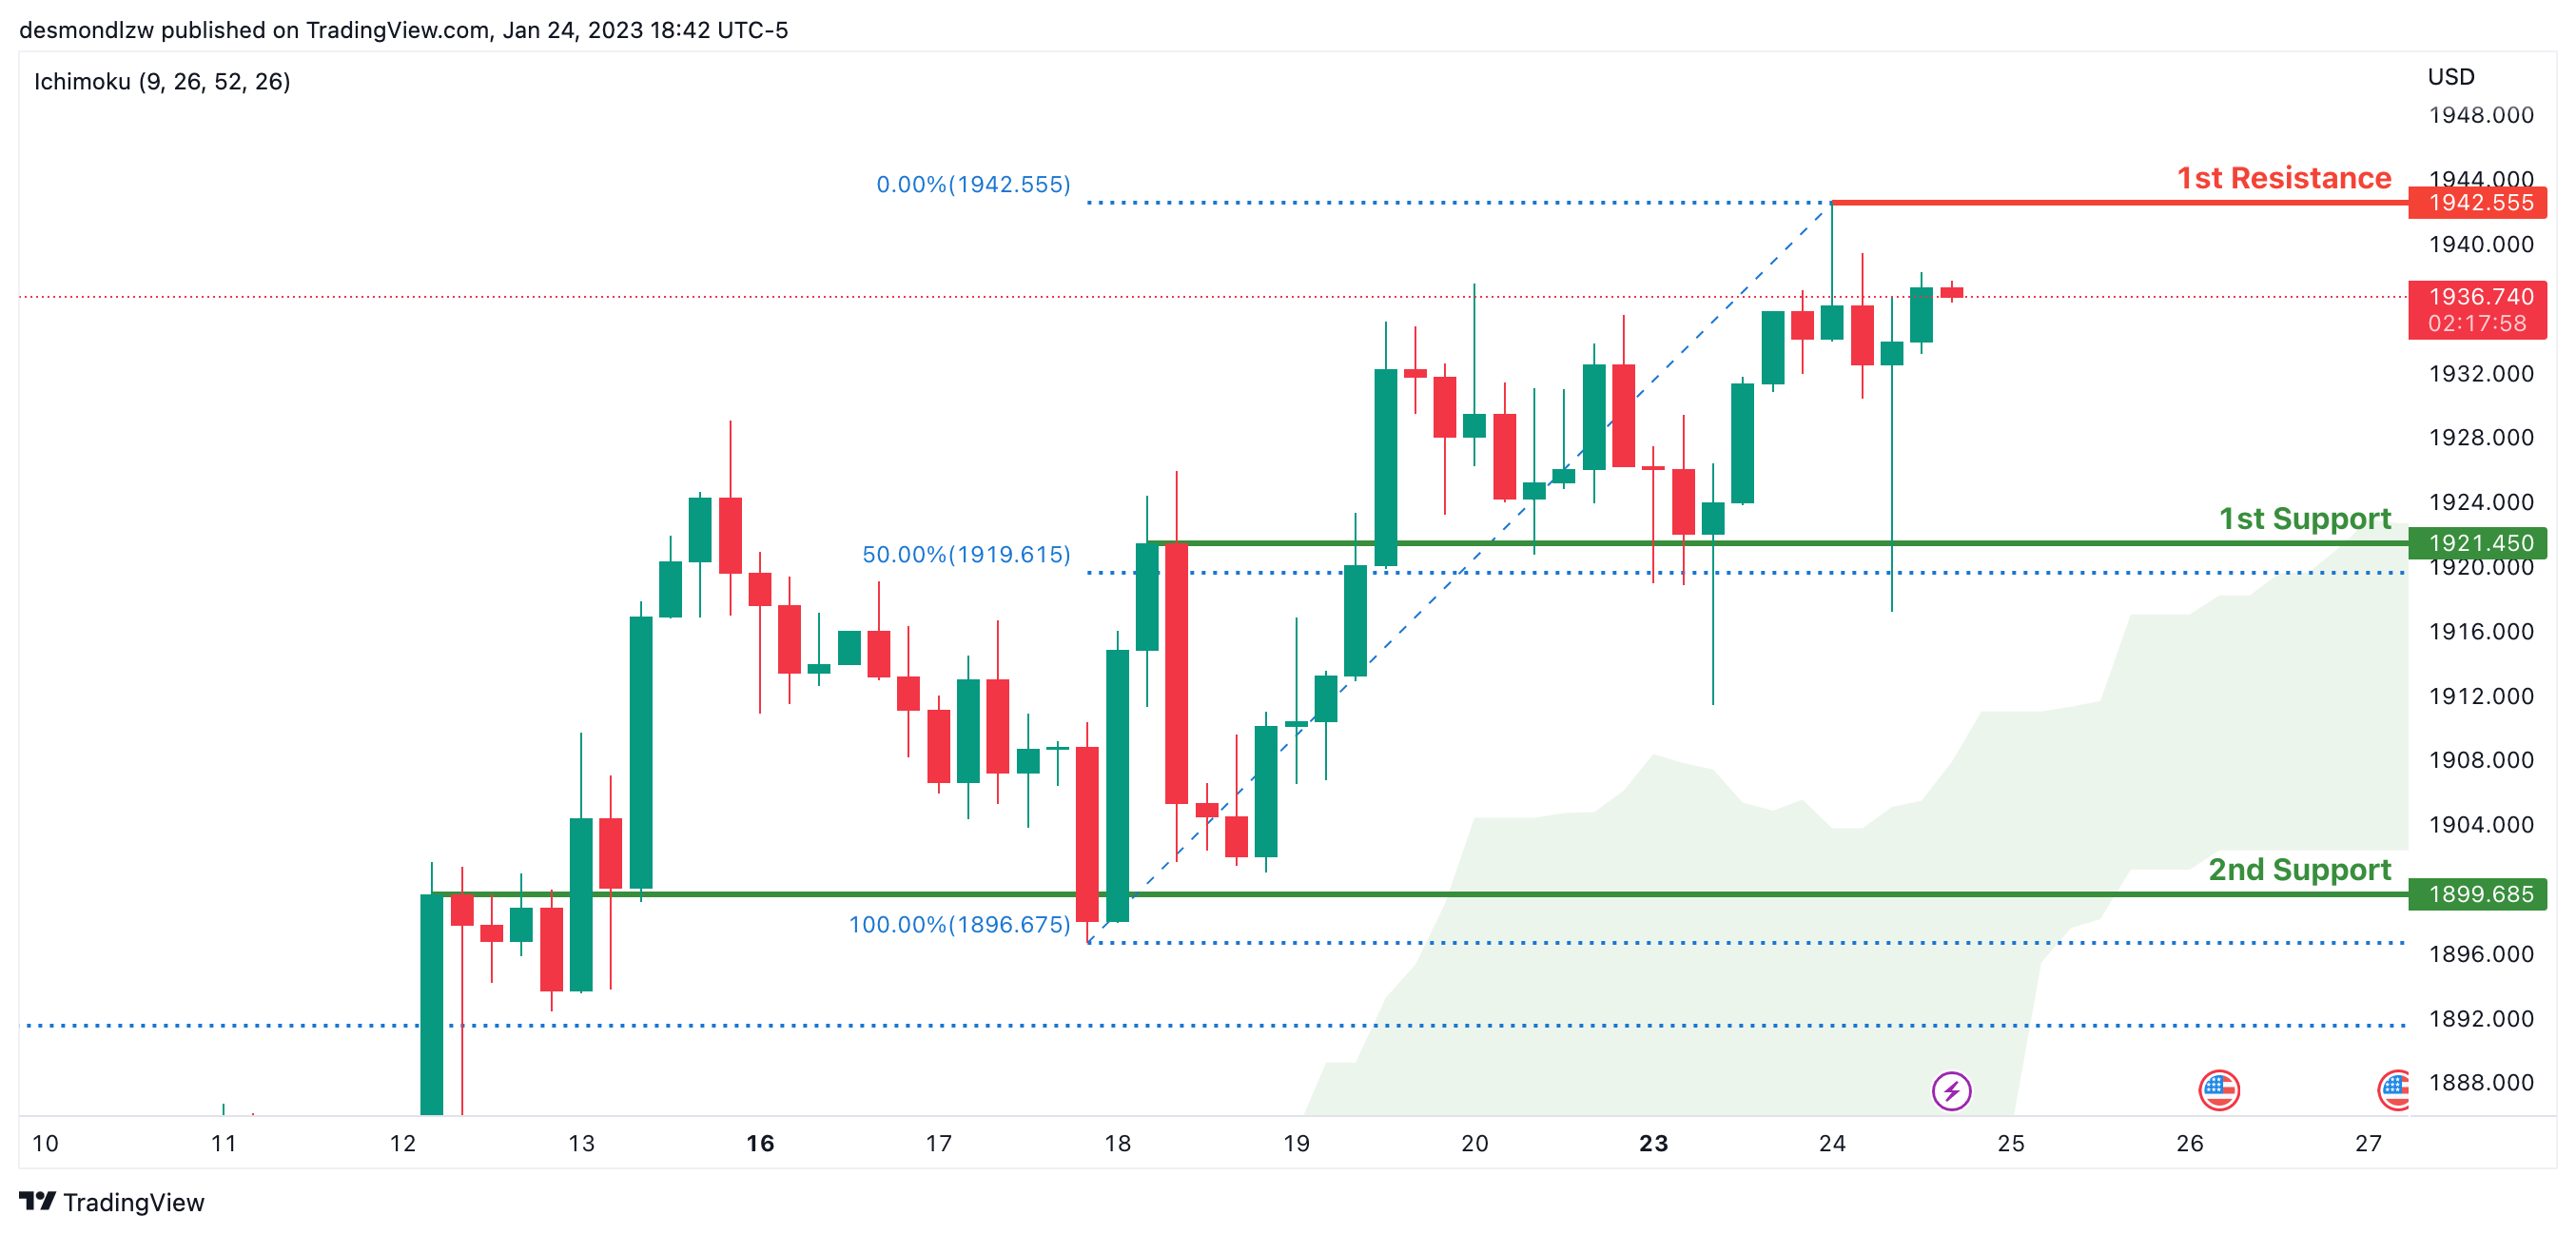
Looking at the H4 chart, my overall bias for XAUUSD is bullish due to the current price being above the Ichimoku cloud, indicating a bullish market. If this bullish momentum continues, expect the price to possibly continue heading towards the 1st resistance at 1942.555, where the recent high is. In an alternative scenario, price could possibly head back down to retest the 1st support at 1921.450 where the 50% Fibonacci line is.
Areas of consideration:
- H4 time frame, 1st resistance at 1942.555
- H4 time frame, 1st support at 1921.450
AUD/USD:
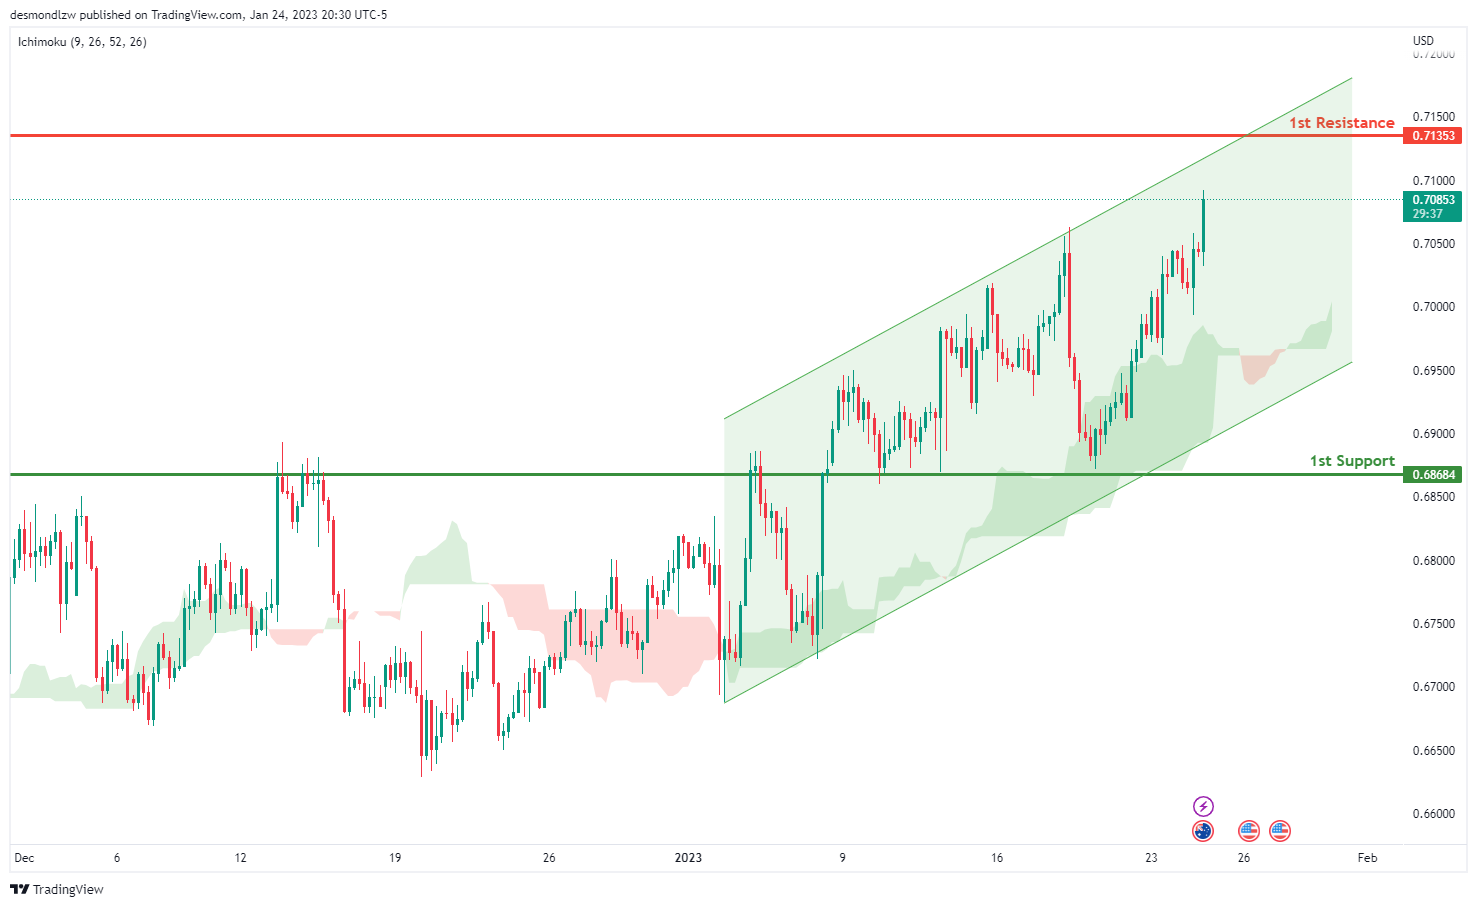
Looking at the H4 chart, we can see that the 1st support is at 0.68684 which is a strong overlap support. There is an ascending channel . the current price is now above the Ichimoku Cloud. Expecting the price is moving towards the 1st resistance is at 0.71353 which is recent swing high.
Areas of consideration
- H4. 1st resistance at 0.71353
- H4, 1st support at 0.68684
NZD/USD:
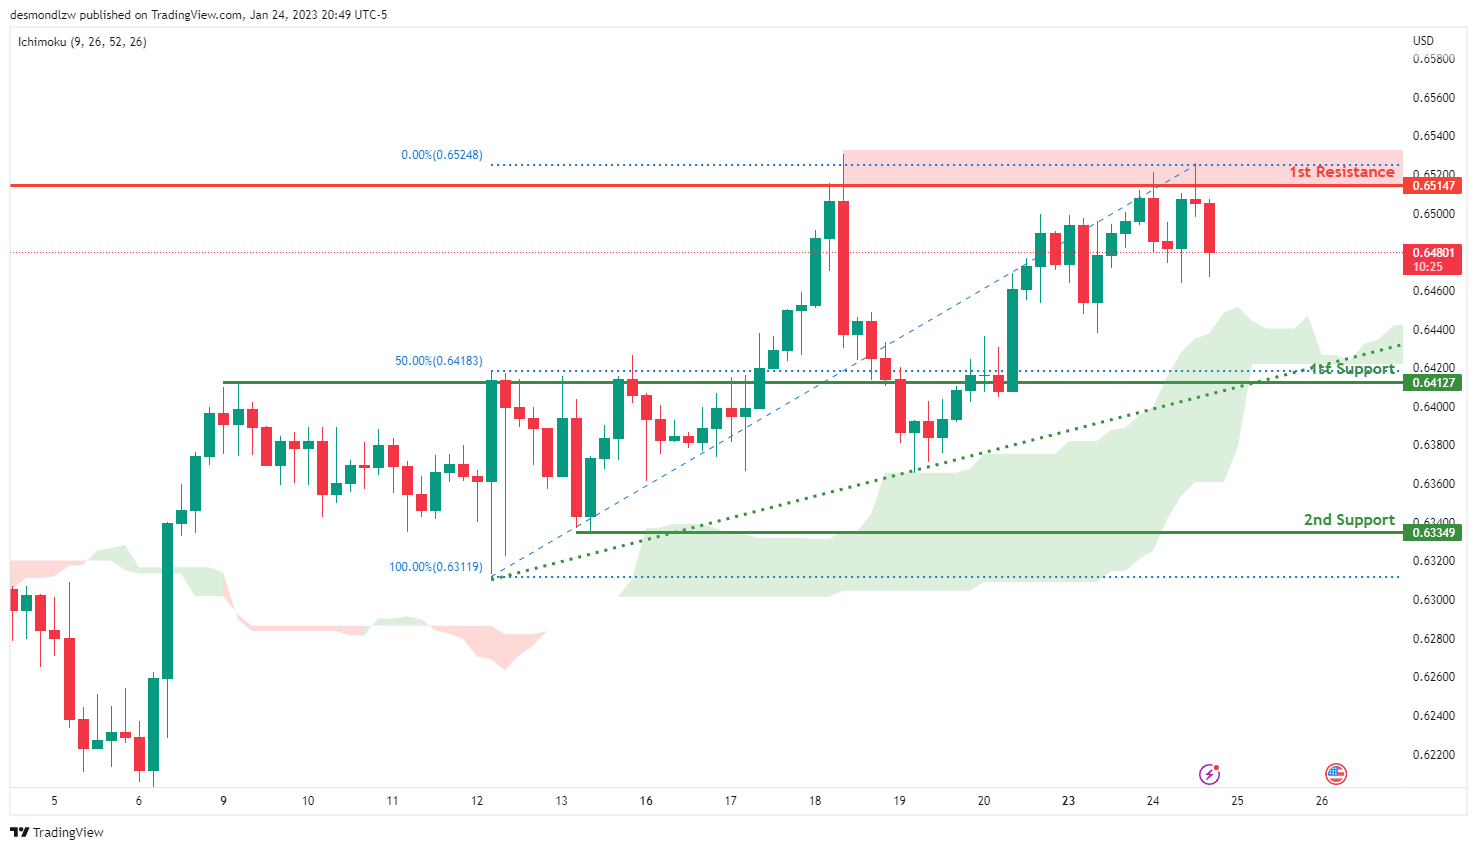
Looking at the H4 chart, we can see that the 1st support is at 0.64127 which is overlap support that is in line with the 50% Fibonacci line. If the price breaks this level, we could see it drop to 2nd support is down at 0.63349. As the current price is above the Ichimoku cloud and there is an ascending trend line, which suggests bullish momentum.
For the resistance, our 1st resistance is at 0.65147 which is a recent swing high resistance area.
Areas of consideration:
- H4 time frame, 1st resistance at 0.65147
- H4 time frame, 1st support at 0.64102
- H4 time frame, 2nd support at 0.63349
USD/CAD:
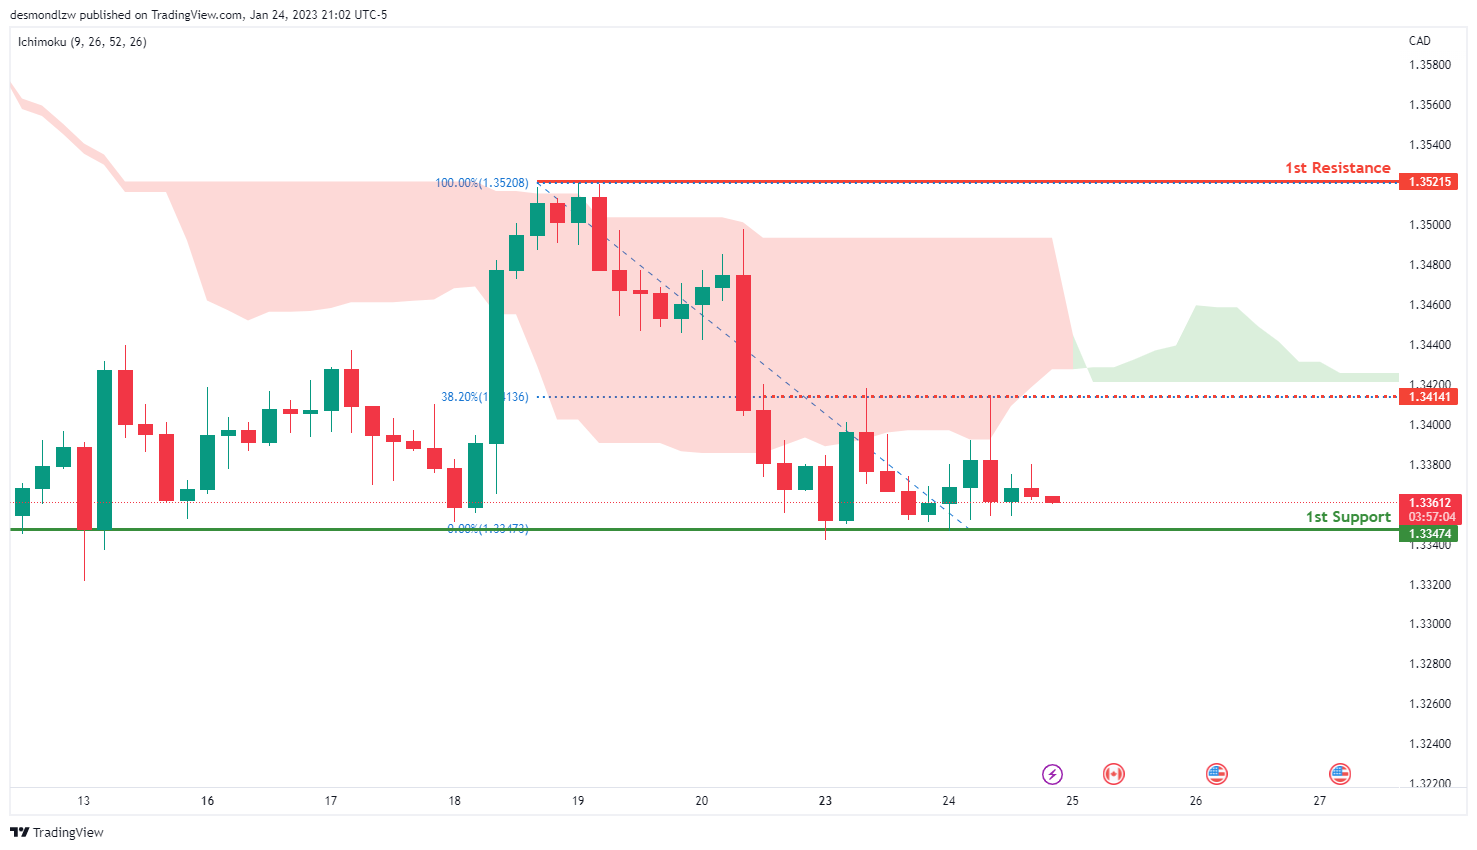
On the H4 chart, the 1st support is at 1.33474 which is an overlap support and recent swing low.
In terms of resistance, the 1st resistance we can see is at 1.35208 which is the recent swing high. There is an intermediate resistance which is in line with 38.2% Fibonacci retracement at 1.35208.
Areas of consideration:
- H4 time frame, 1st resistance at 1.35208
- H4 time frame. Intermediate resistance at 1.35208
- H4 time frame, 1st support at 1.33474
OIL:
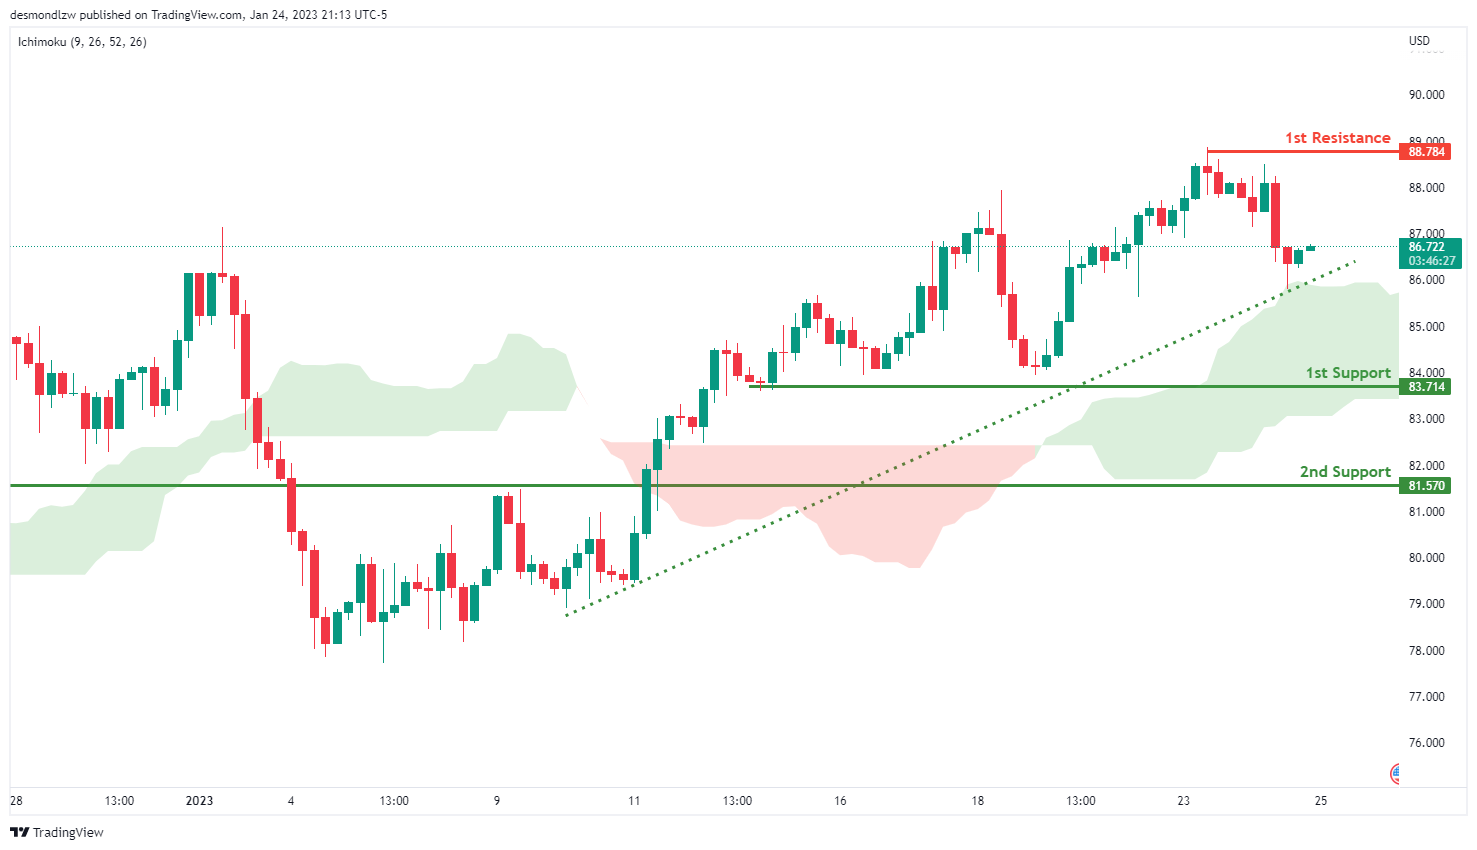
Looking at the H4 chart, we can see that the 1st resistance is at 88.784 which is recent swing high. As the price is above the Ichimoku Cloud and uptrend line is suggesting the bulilish momentum.
In terms of support, we can see our 1st support at 83.714 which is overlap support. Breaking this level would trigger a further drop to our 2nd support at 81.704.
Areas of consideration:
- H4 time frame, 1st resistance at 88.784
- H4 time frame,1st support at 83.714
- Hr time frame, 2nd support at 81.704
Dow Jones Industrial Average:
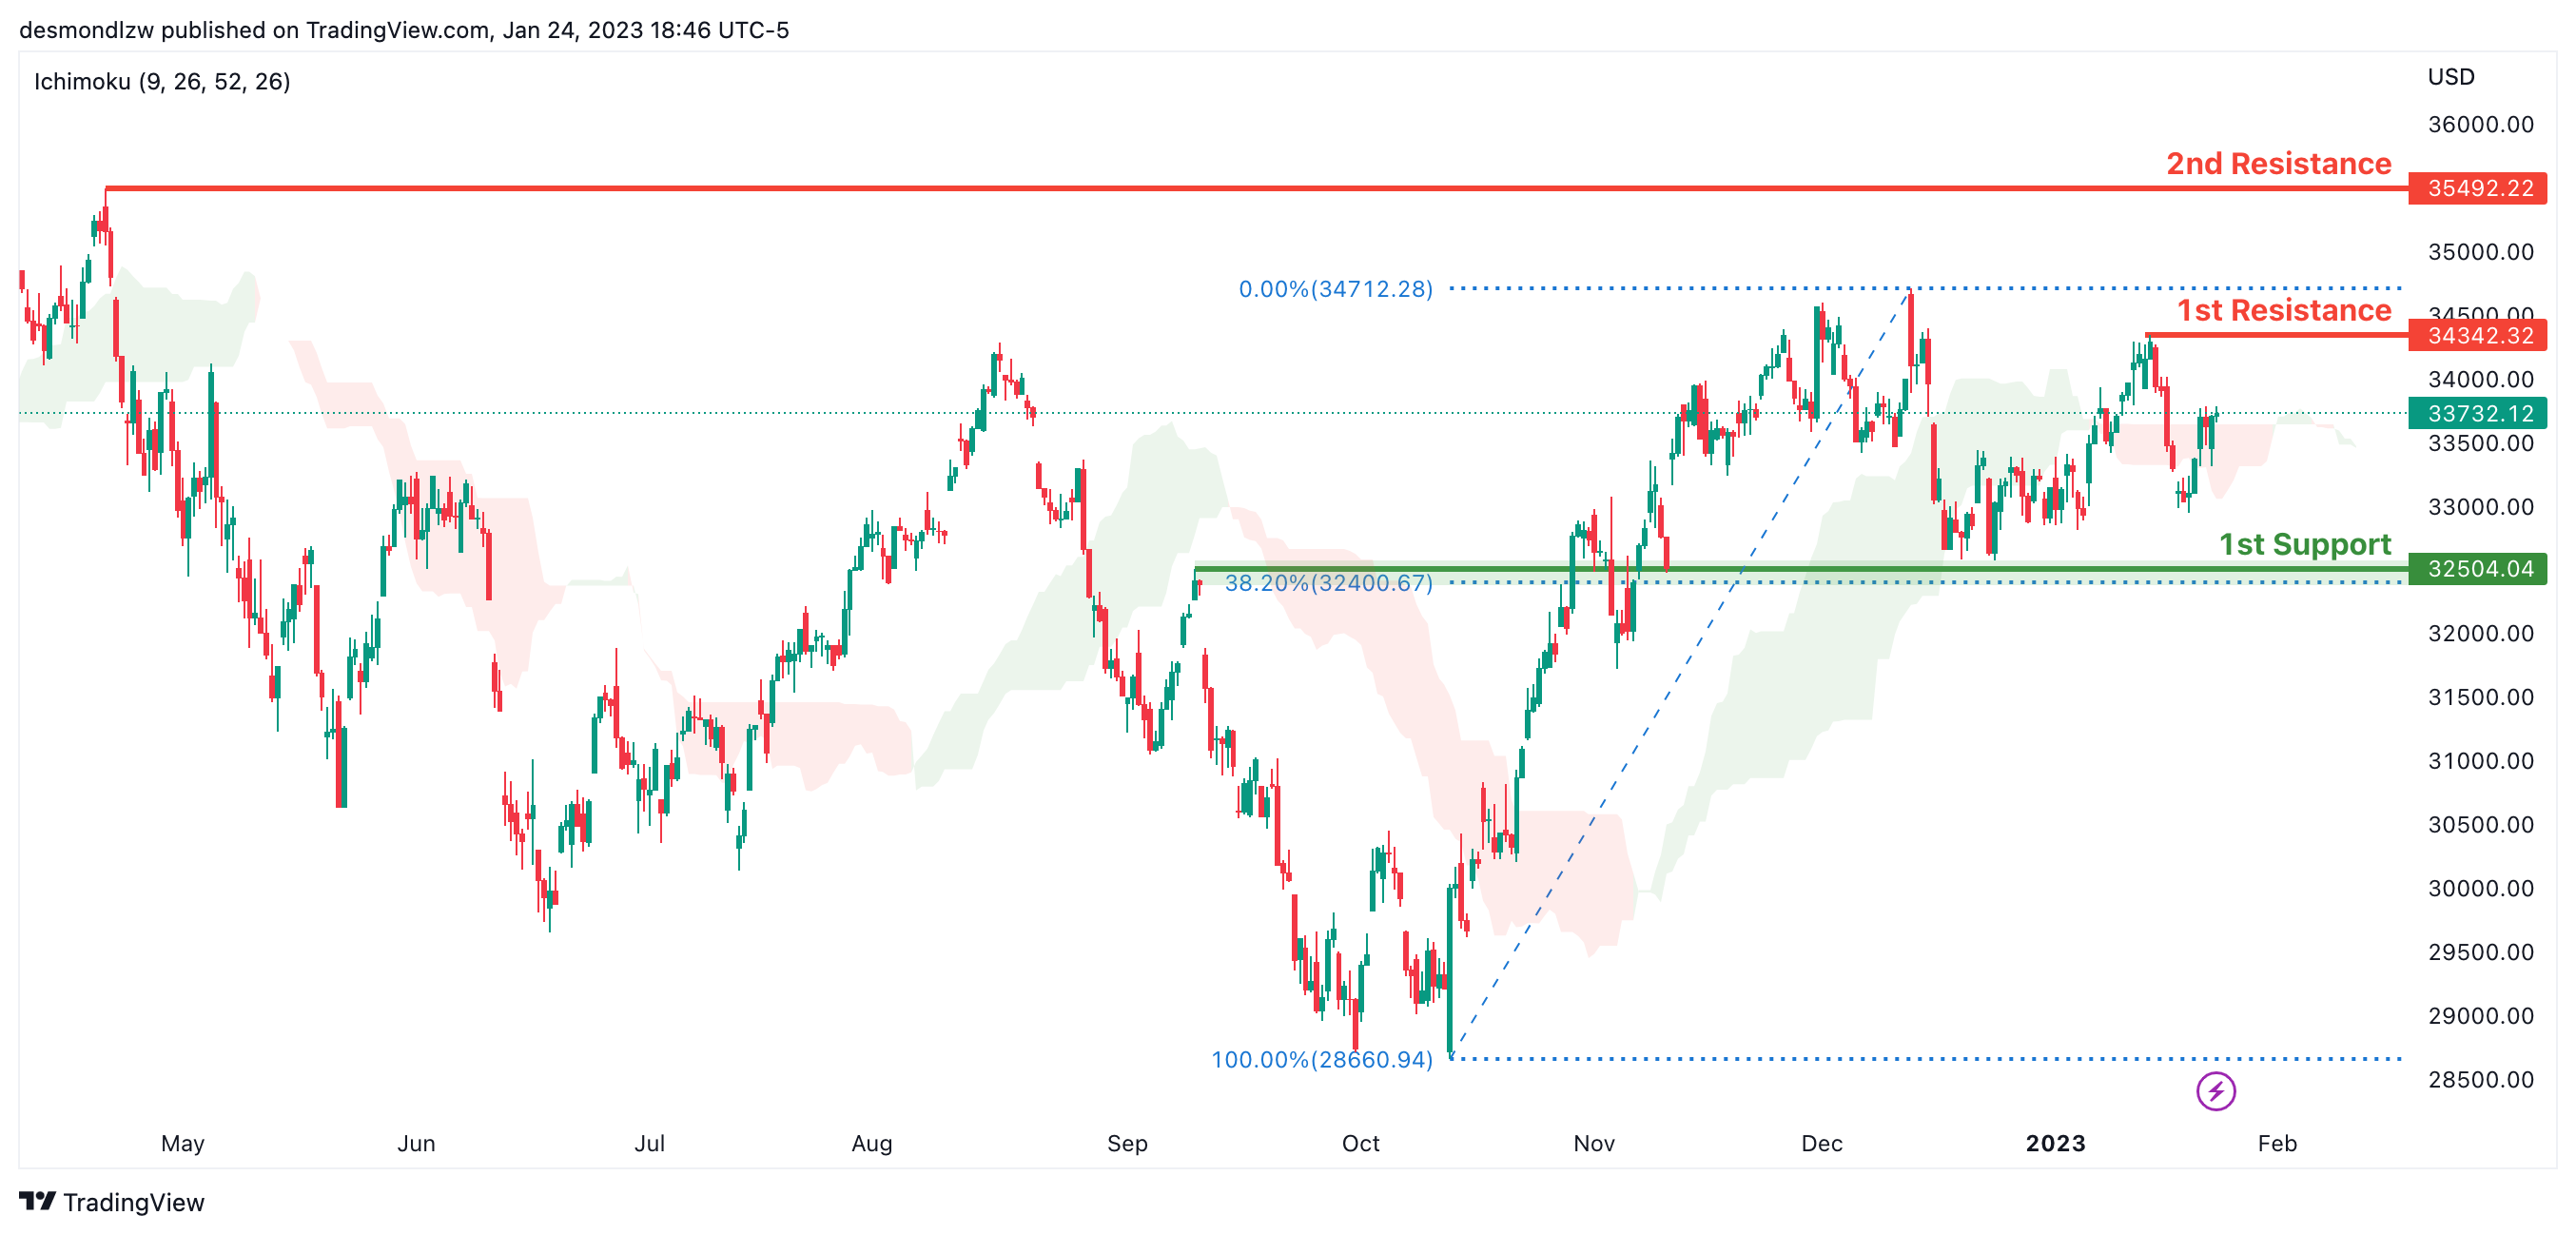
On the H4 chart, the overall bias for DJI is bullish. To add confluence to this, the price is crossing above the Ichimoku cloud which indicates a bullish market. If this bullish momentum continues, expect the price to possibly continue heading towards the 1st resistance line at 34712.28, where the recent swing high is. In an alternative scenario, price could possibly head back down towards the 1st support at 32581.97, slightly above where the 38.2% Fibonacci line is.
Areas of consideration:
- H4 time frame, 1st support at 32581.97
- H4 time frame, 1st Resistance at 34712.28
DAX:
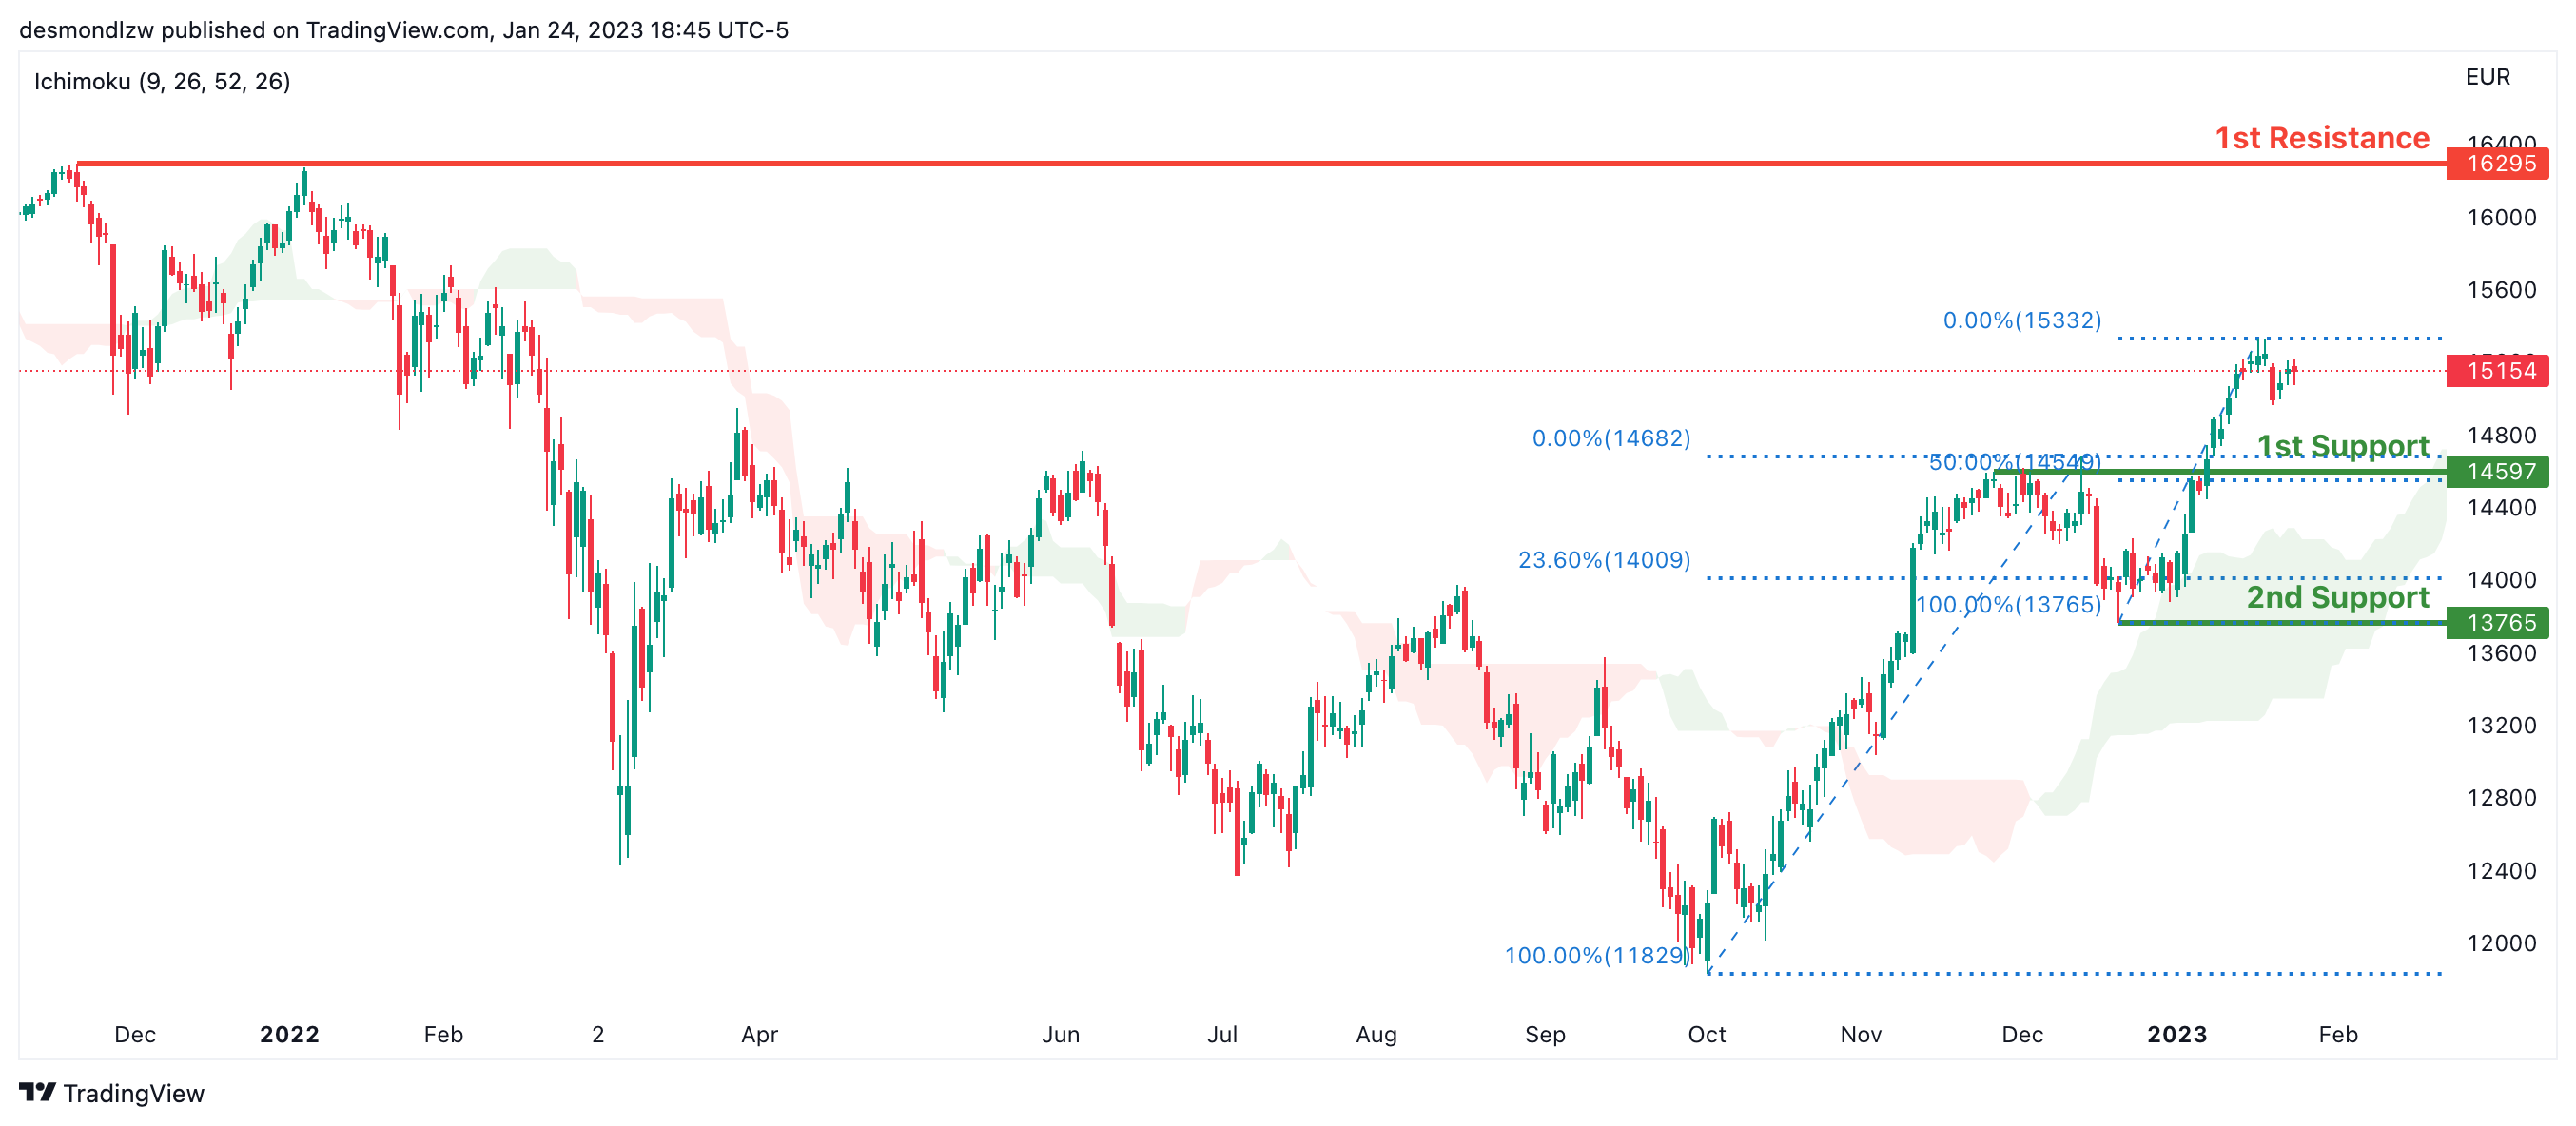
Looking at the Daily chart, my overall bias for DAX is bullish due to the current price crossing above the Ichimoku cloud, indicating a bullish market. If this bullish momentum continues, expect the price to possibly head towards the 1st resistance line at 16295, where the previous swing high is. In an alternative scenario, price could possibly head down to retest the 1st support at 14597, where the 50% Fibonacci line is.
Areas of consideration:
- H4 time frame, 1st resistance is at 16295
- H4 time frame, 1st support is at 14597
ETHUSD:
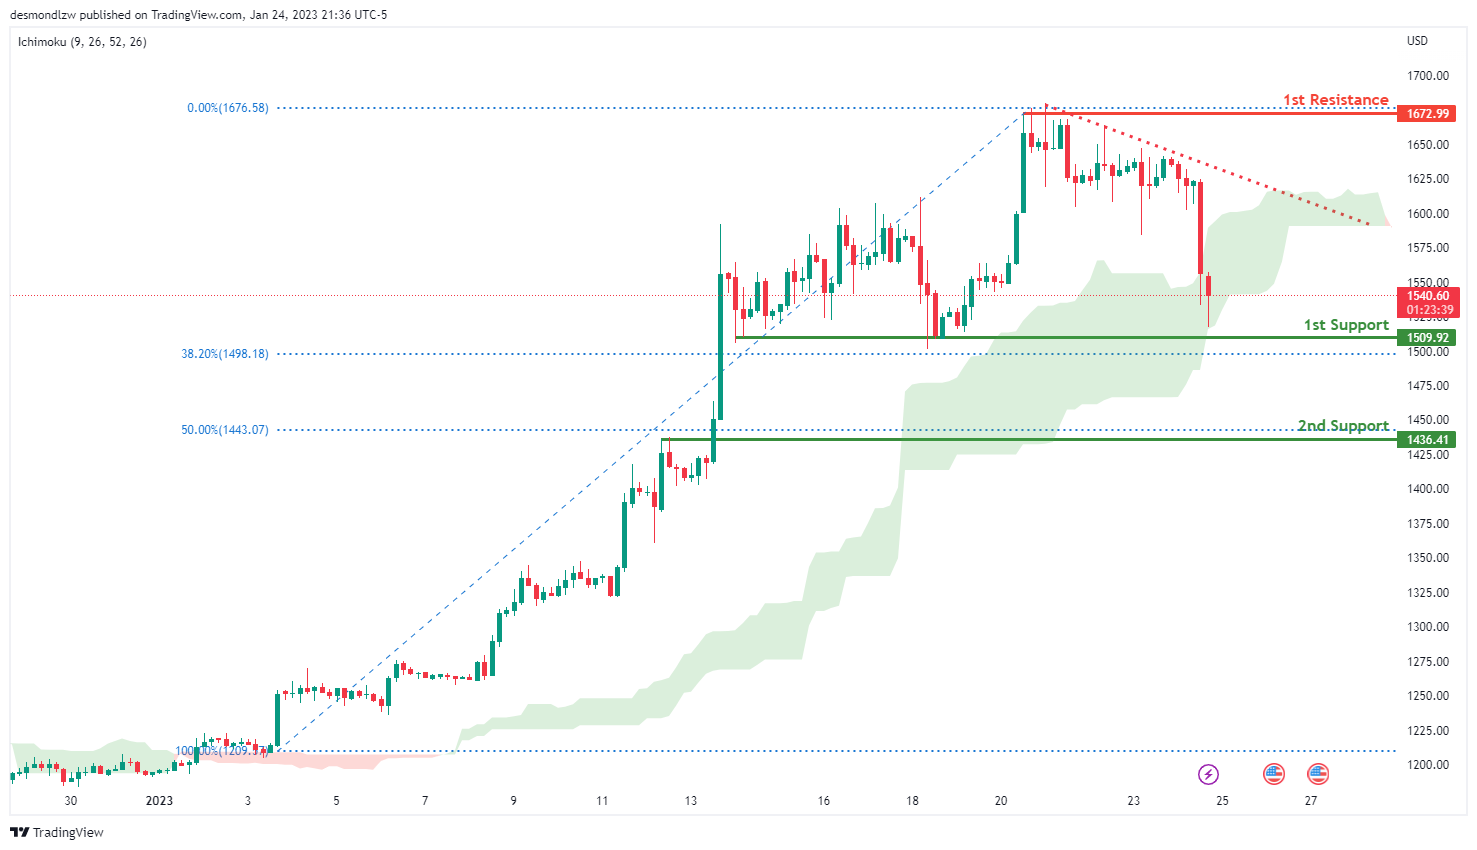
Looking at the H4 chart, my overall bias for ETHUSD is bearish, as there is an downside trend line. Expecting the price is move towards the 1st support at 1509.92 which is overlap support. It is also line with 38.2% Fibonacci retracement. Once the price is break the 1st support, it will head towards 2nd support at 1436.41. The 1st resisitanace is at 1672.99 which is the recent swing high.
Areas of consideration:
- H4 time frame, 1st resistance of 1672.99
- H4 time frame, 1st support at 1509.92
- H4 time frame, 2nd support at 1436.41
BTCUSD:
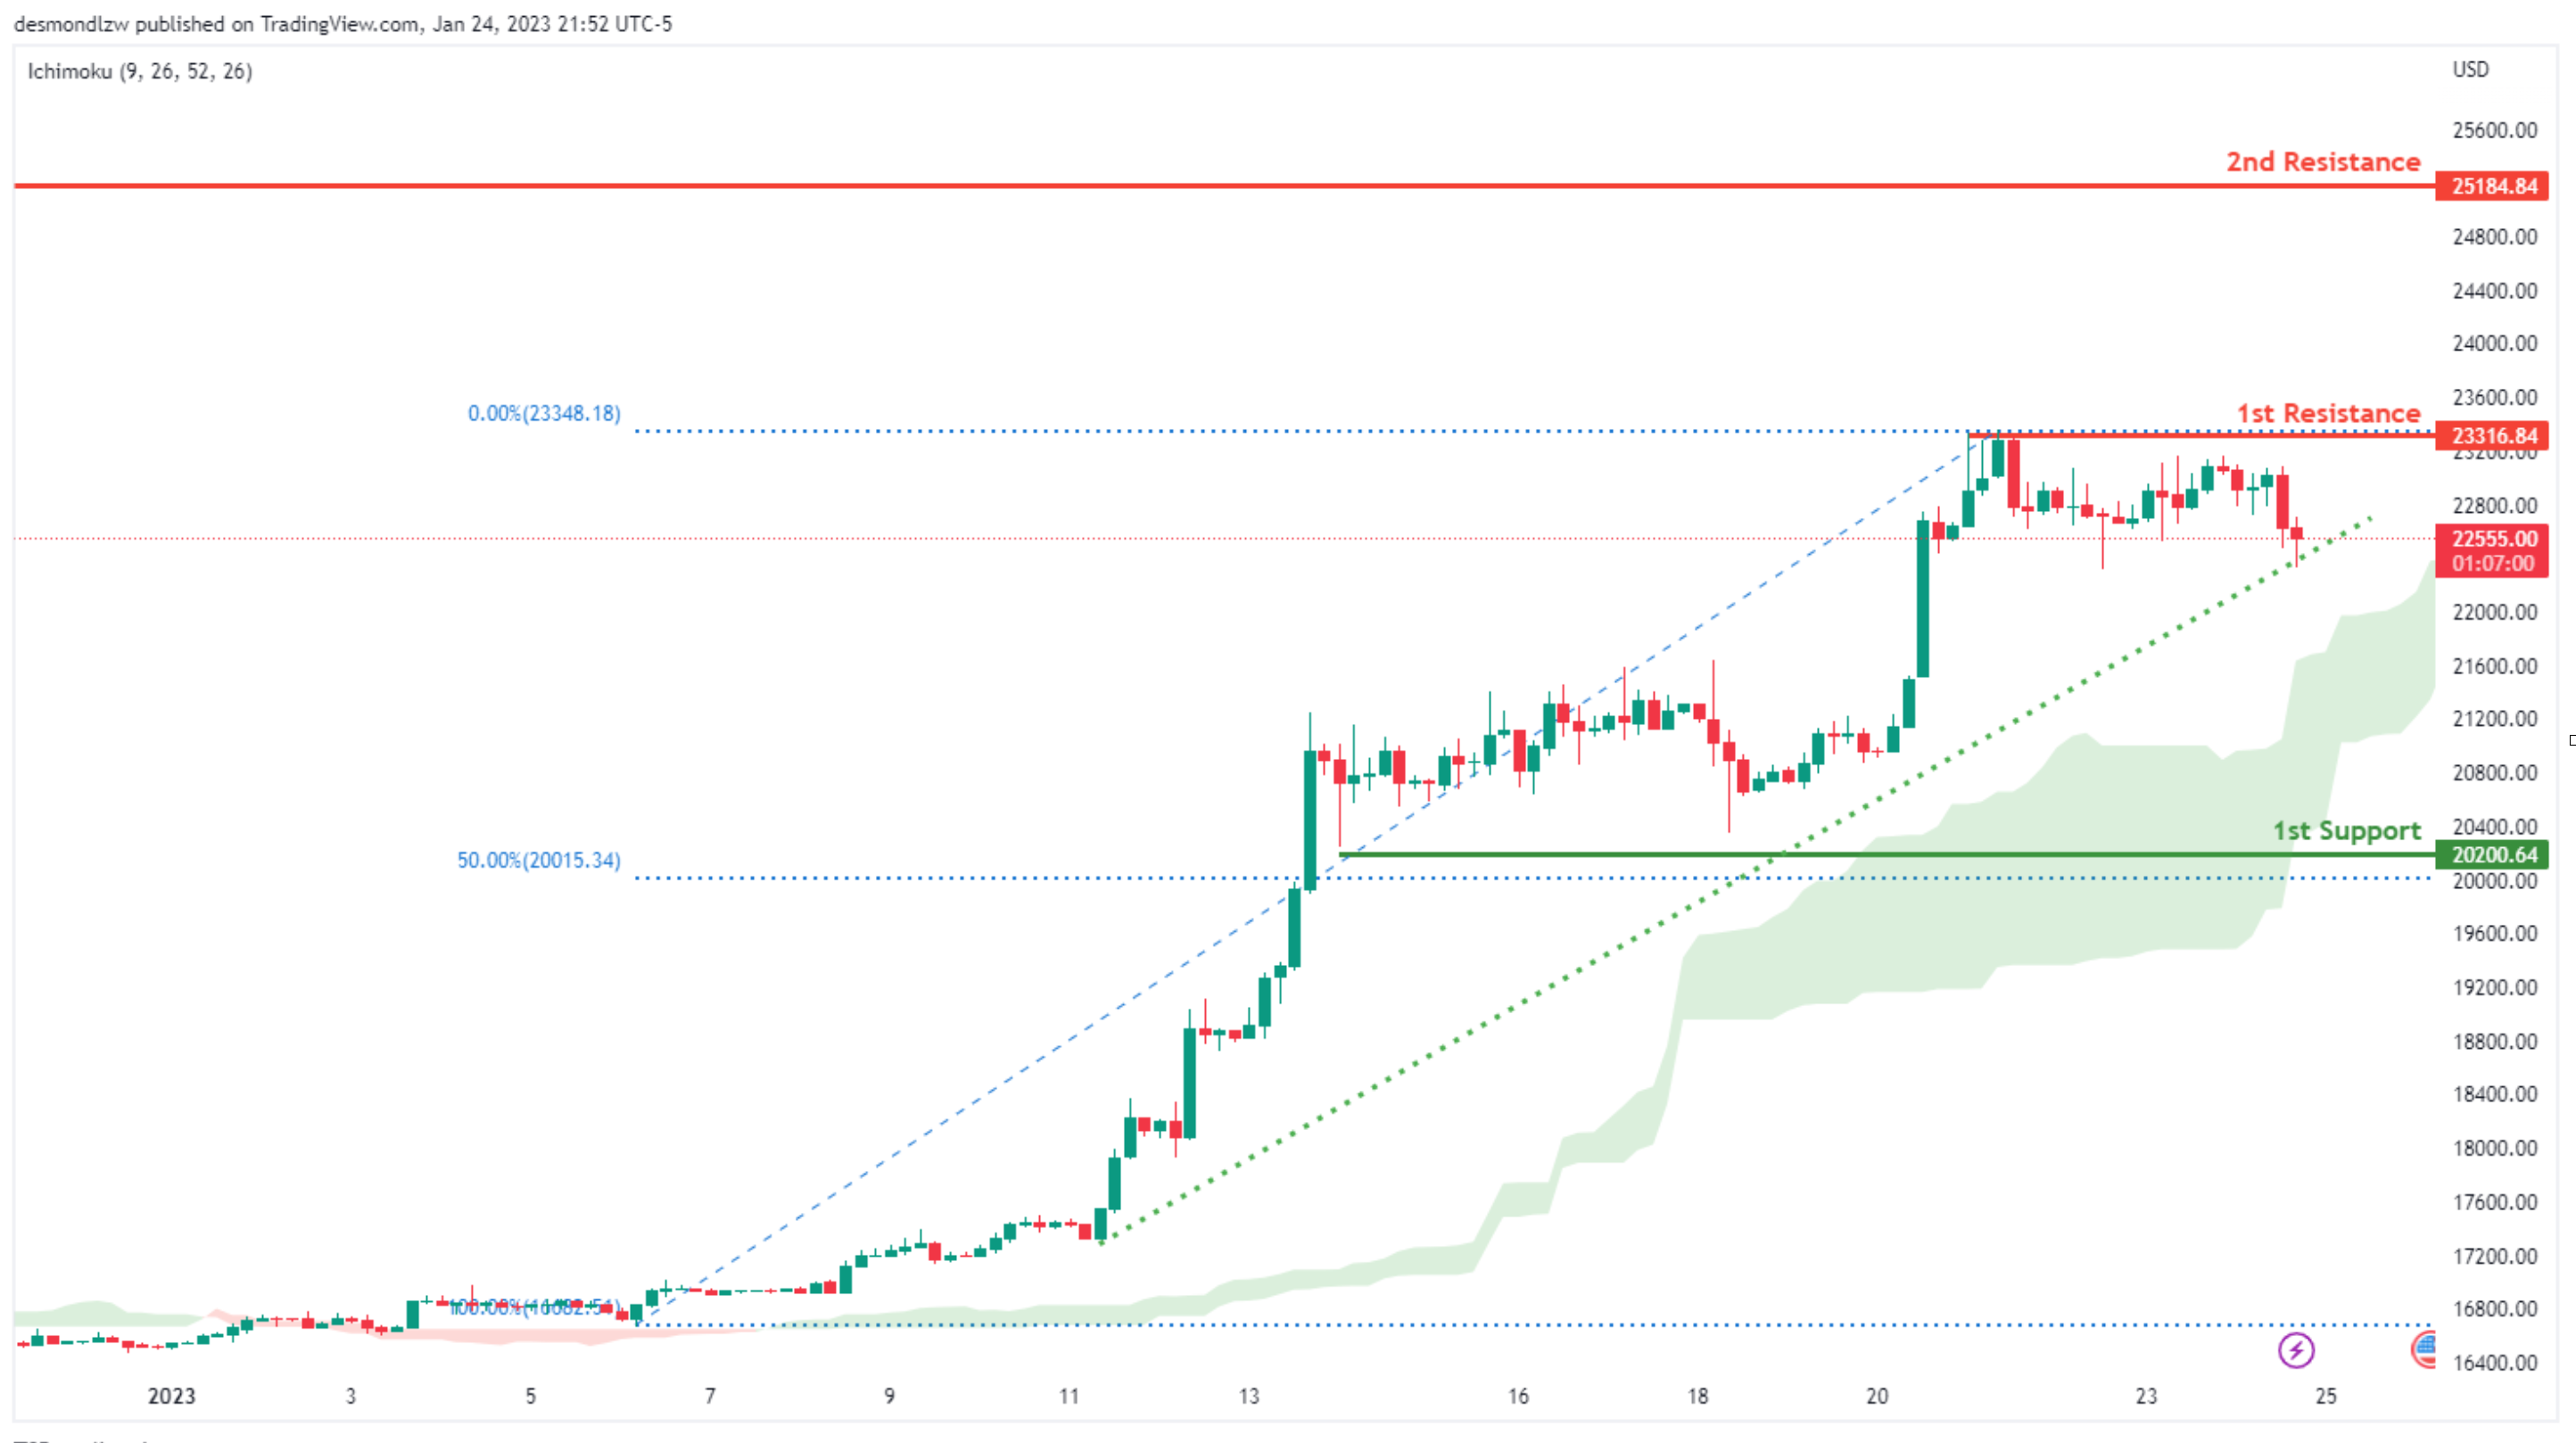
Looking at the H4 chart, my overall bias for BTCUSD is bullish due to the current price being above the Ichimoku cloud, and there is an upside trend line, indicating a bullish market. If this bullish momentum continues, expect the price to possibly break the 1st resistance at 23316.84 which is the recent swing high. The 2nd resistance is at 25184.84.
In an alternative scenario, the price could possibly head back down to retest the 1st support at 20200.64 which is in line with the 50% Fibonacci retracement.
Areas of consideration:
- H4 time frame, 2nd resistance 25184.84
- H4 time frame, 1st resistance 23316.84
- H4 time frame, 1st support at 20200.64
S&P 500:
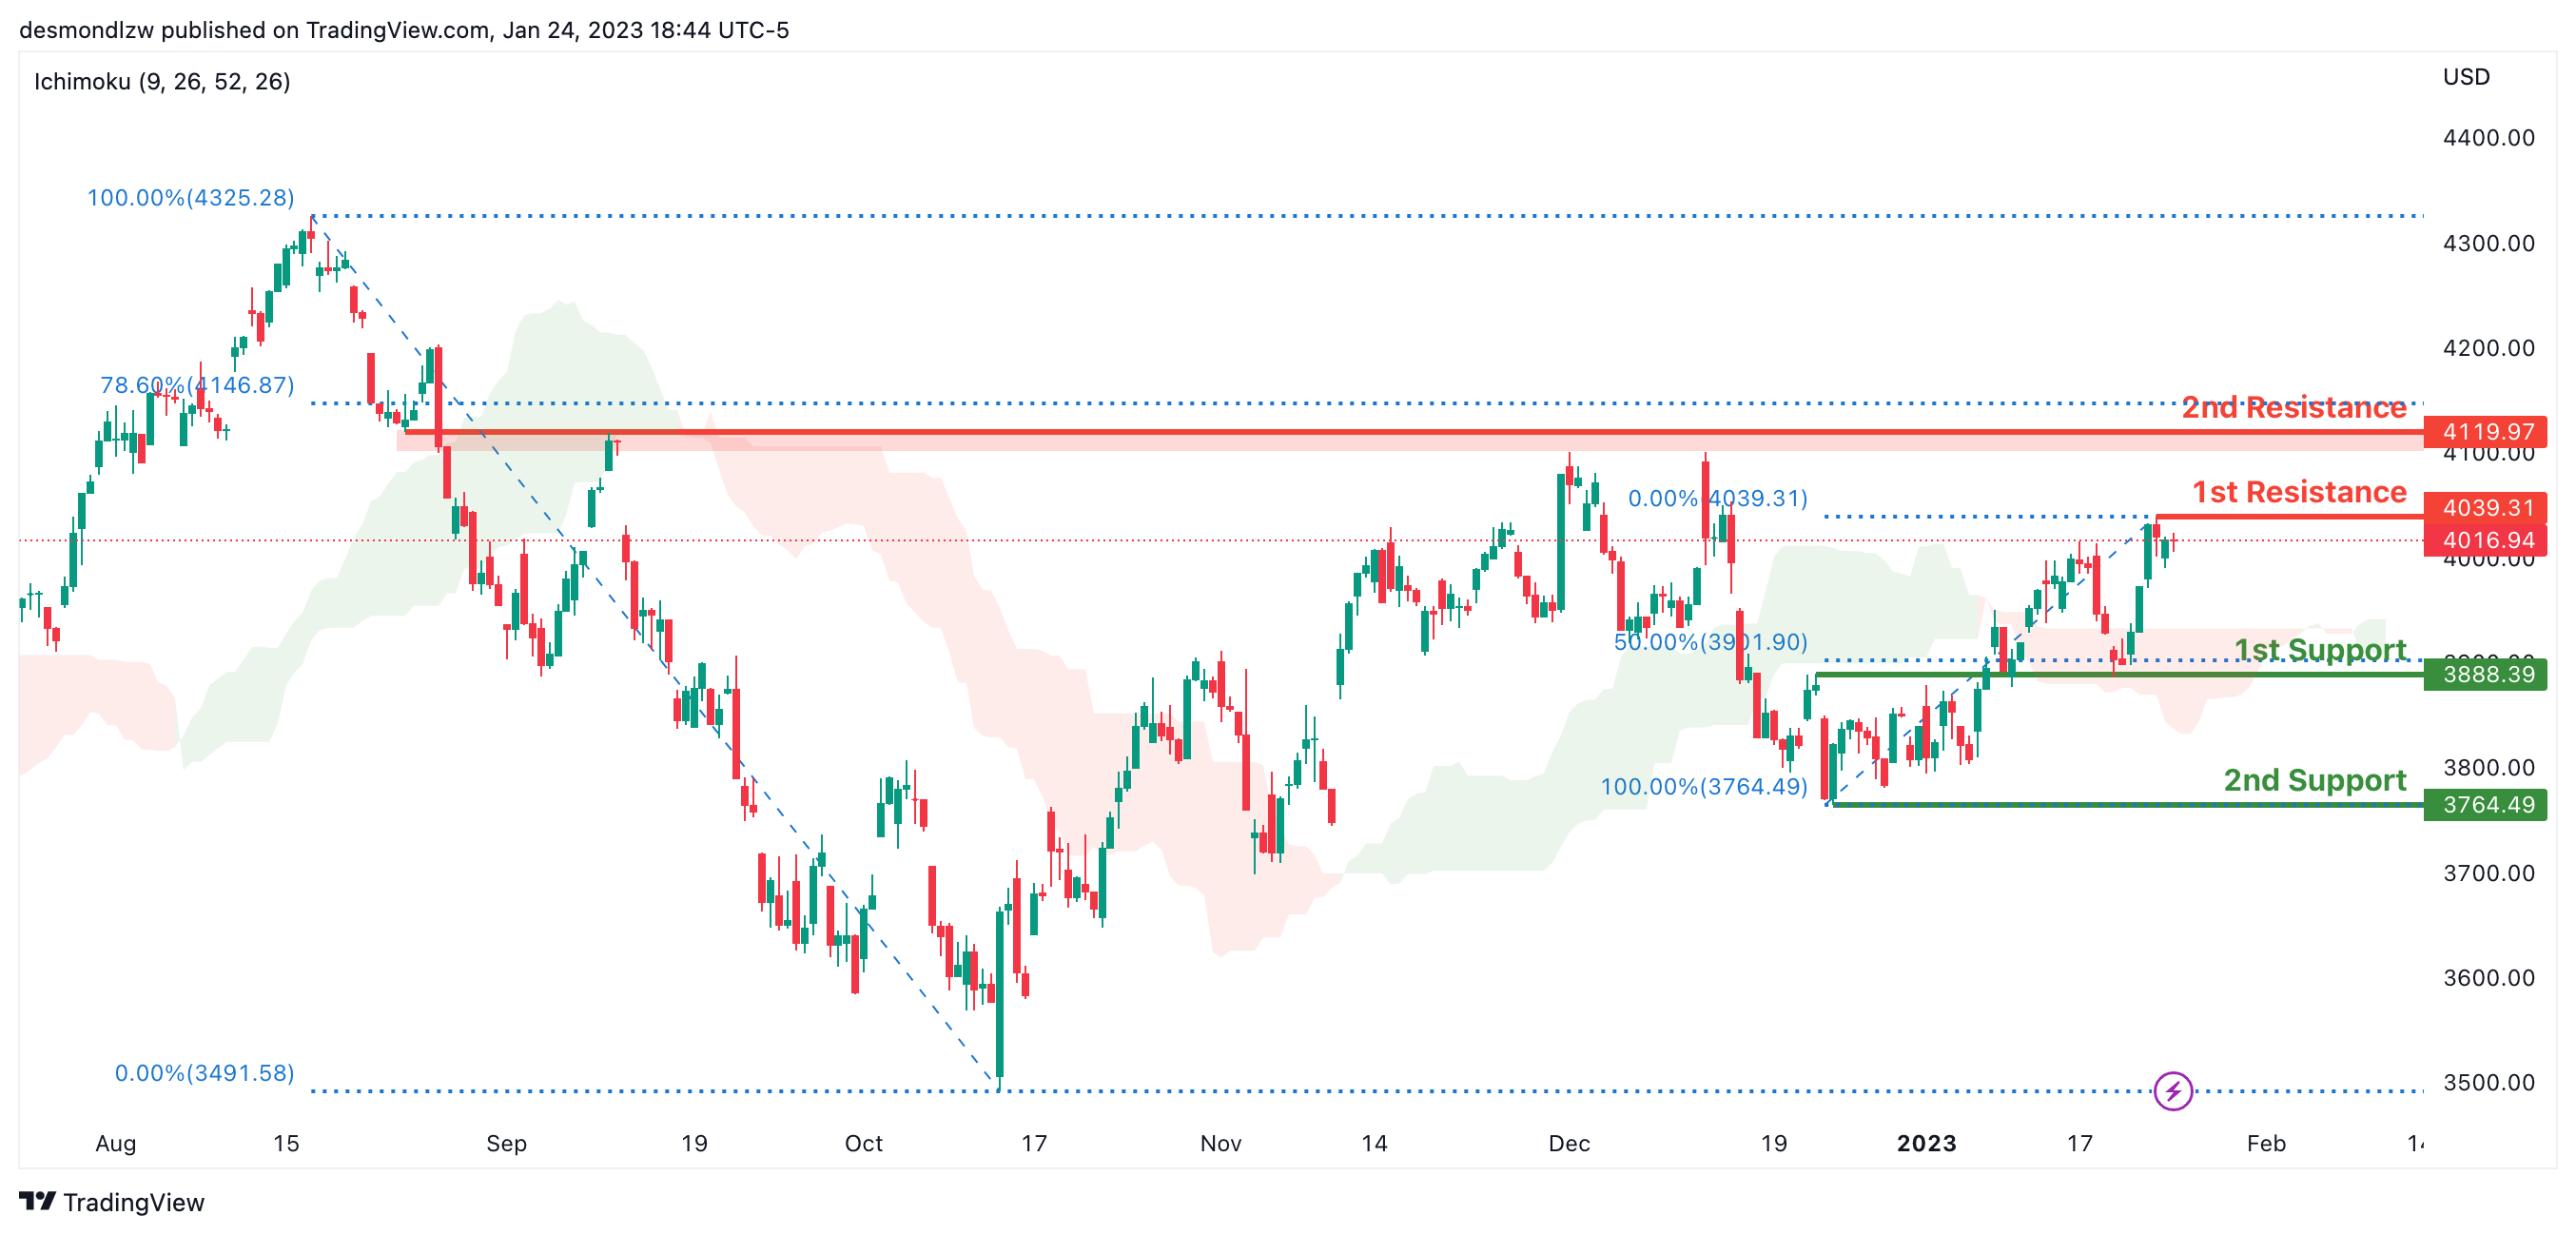
Looking at the H4 chart, my overall bias for S&P500 is bullish due to the current price being above the Ichimoku cloud, indicating a bullish market. If this bullish momentum continues, expect the price to continue heading towards the 1st resistance at 4039.31, where the recent high is. In an alternative scenario, price could possibly head back down to break the 1st support at 3888.39, where the 50% Fibonacci line is, before heading towards the 2nd support at 3764.49, where the recent swing low is.
Areas of consideration:
- H4 time frame, 1st support at 3888.39
- H4 time frame, 2nd support at 3764.49
- H4 time frame, 1st resistance at 4039.31
AUD/NZD and AUD/CAD extends up trend
Australian Dollar surges broadly after much stronger than expected CPI reading in December in particular dented any hope for an imminent RBA pause. Meanwhile, New Zealand Dollar is just mixed as CPI didn't accelerate as RBNZ projected, raising hope of a lower terminal rate.
AUD/NZD breaks through 1.0935 resistance to resume the whole rally from 1.0469. The support from 55 day EMA is seen as a near term bullish favor. Further rise is now expected as long as 1.0735 support holds. Next target is 61.8% projection of 1.0469 to 1.0935 from 1.0735 at 1.1023. Firm break there would prompt upside acceleration to 100% projection at 1.1201 next.
AUD/CAD also breaks through 0.9442 temporary top to resume the rally from 0.8596. Near term outlook will stay bullish as long as 0.9279 support holds. Next target is 61.8% projection of 0.8596 to 0.9328 from 0.9142 at 0.9594. Sustained break there would also prompt upside acceleration to 100% projection at 0.9874 next.