Sample Category Title
Australia CPI rose to 8.4% yoy in Dec, 7.8% yoy in Q4
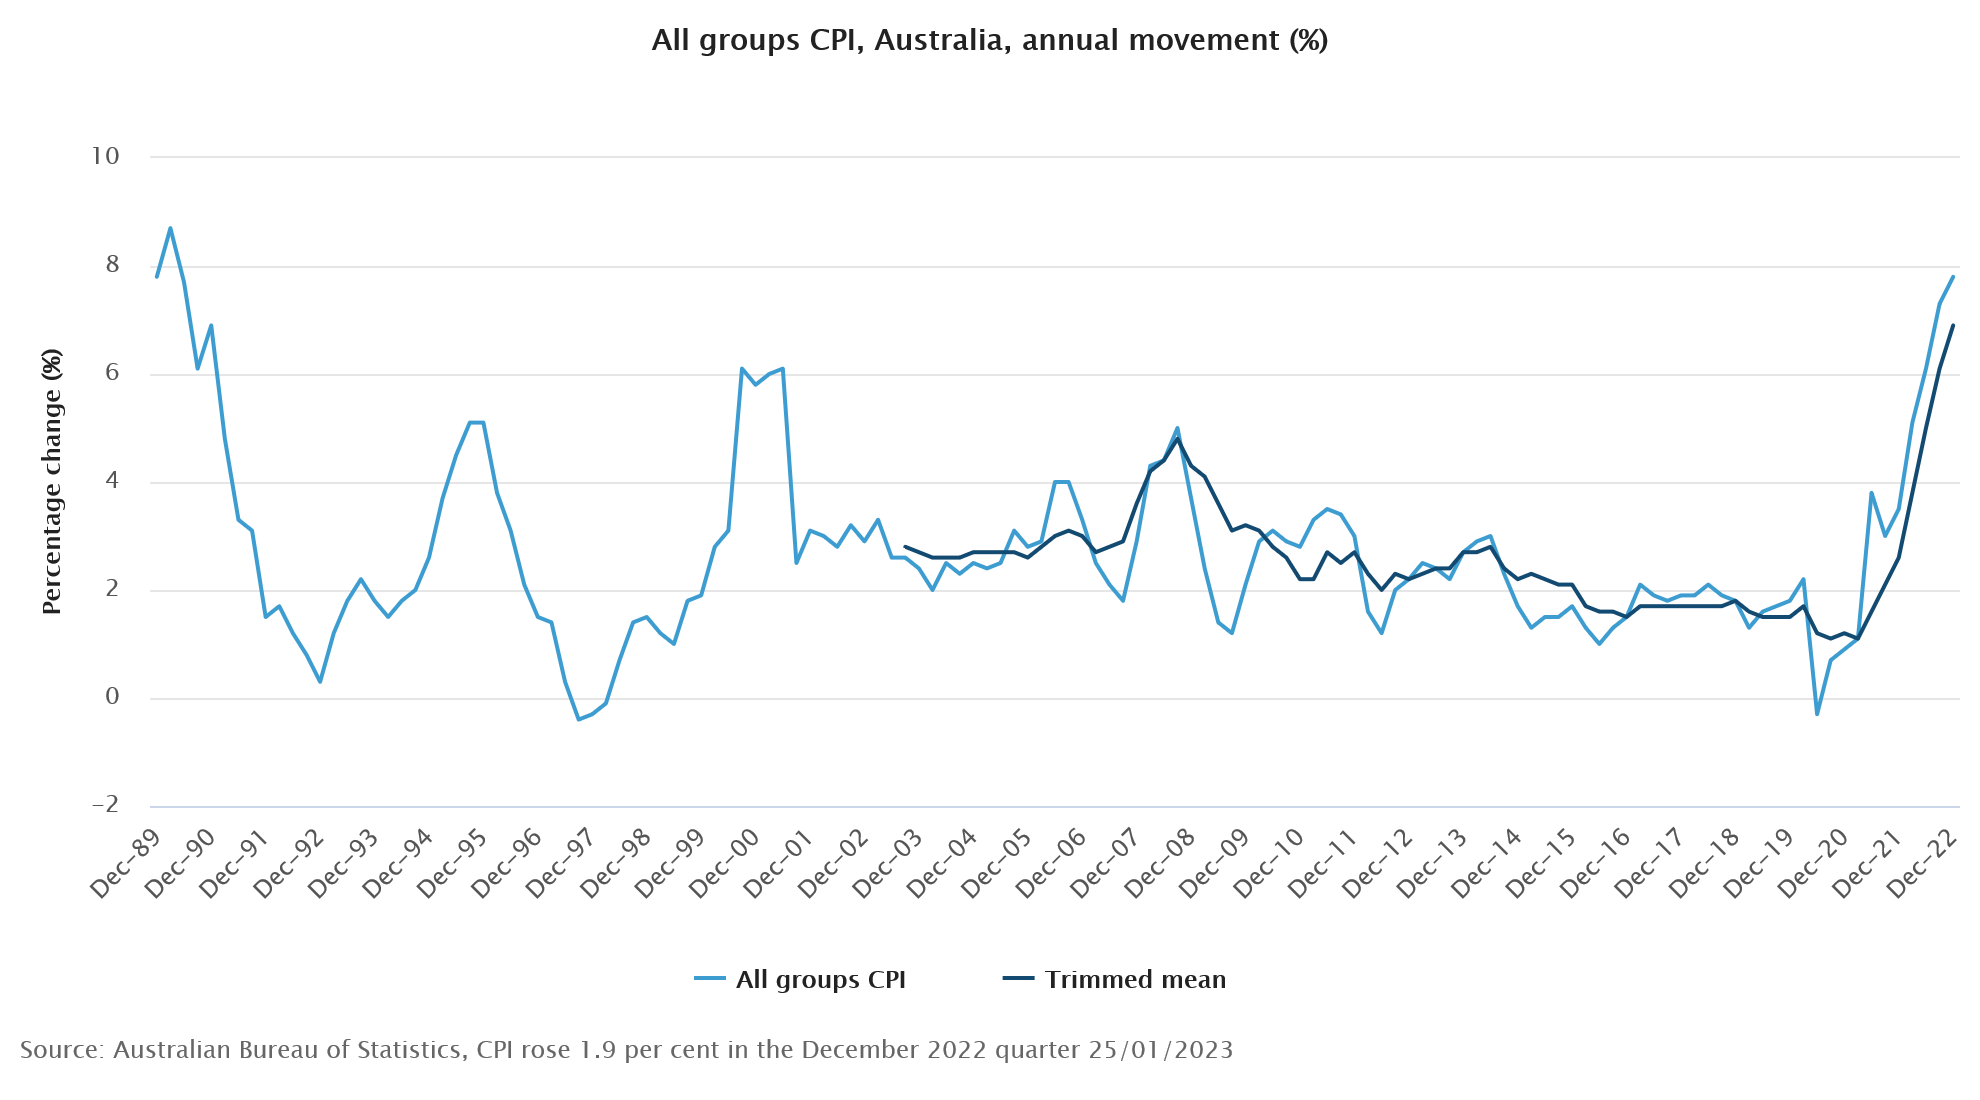
Australia CPI rose 1.9% qoq in Q4, above expectation of 1.7% qoq. Annual CPI accelerated from 7.3% yoy to 7.8% yoy, above expectation of 7.5% yoy. RBA trimmed mean CPI also accelerated from 6.1% yoy to 6.9% yoy, above expectation of 6.5% yoy.
Michelle Marquardt, ABS head of prices statistics, said "This is the fourth consecutive quarter to show a rise greater than any seen since the introduction of the Goods and Services Tax (GST) in 2000. The increase for the quarter was slightly higher than the quarterly movements for the September and June quarters last year (both 1.8 per cent)."
"The annual increase for the CPI is the highest since 1990. Annual inflation for goods such as new dwellings and automotive fuel steadied this quarter, however we saw an uptick in inflation for services such as holidays and restaurant meals," Marquardt said.
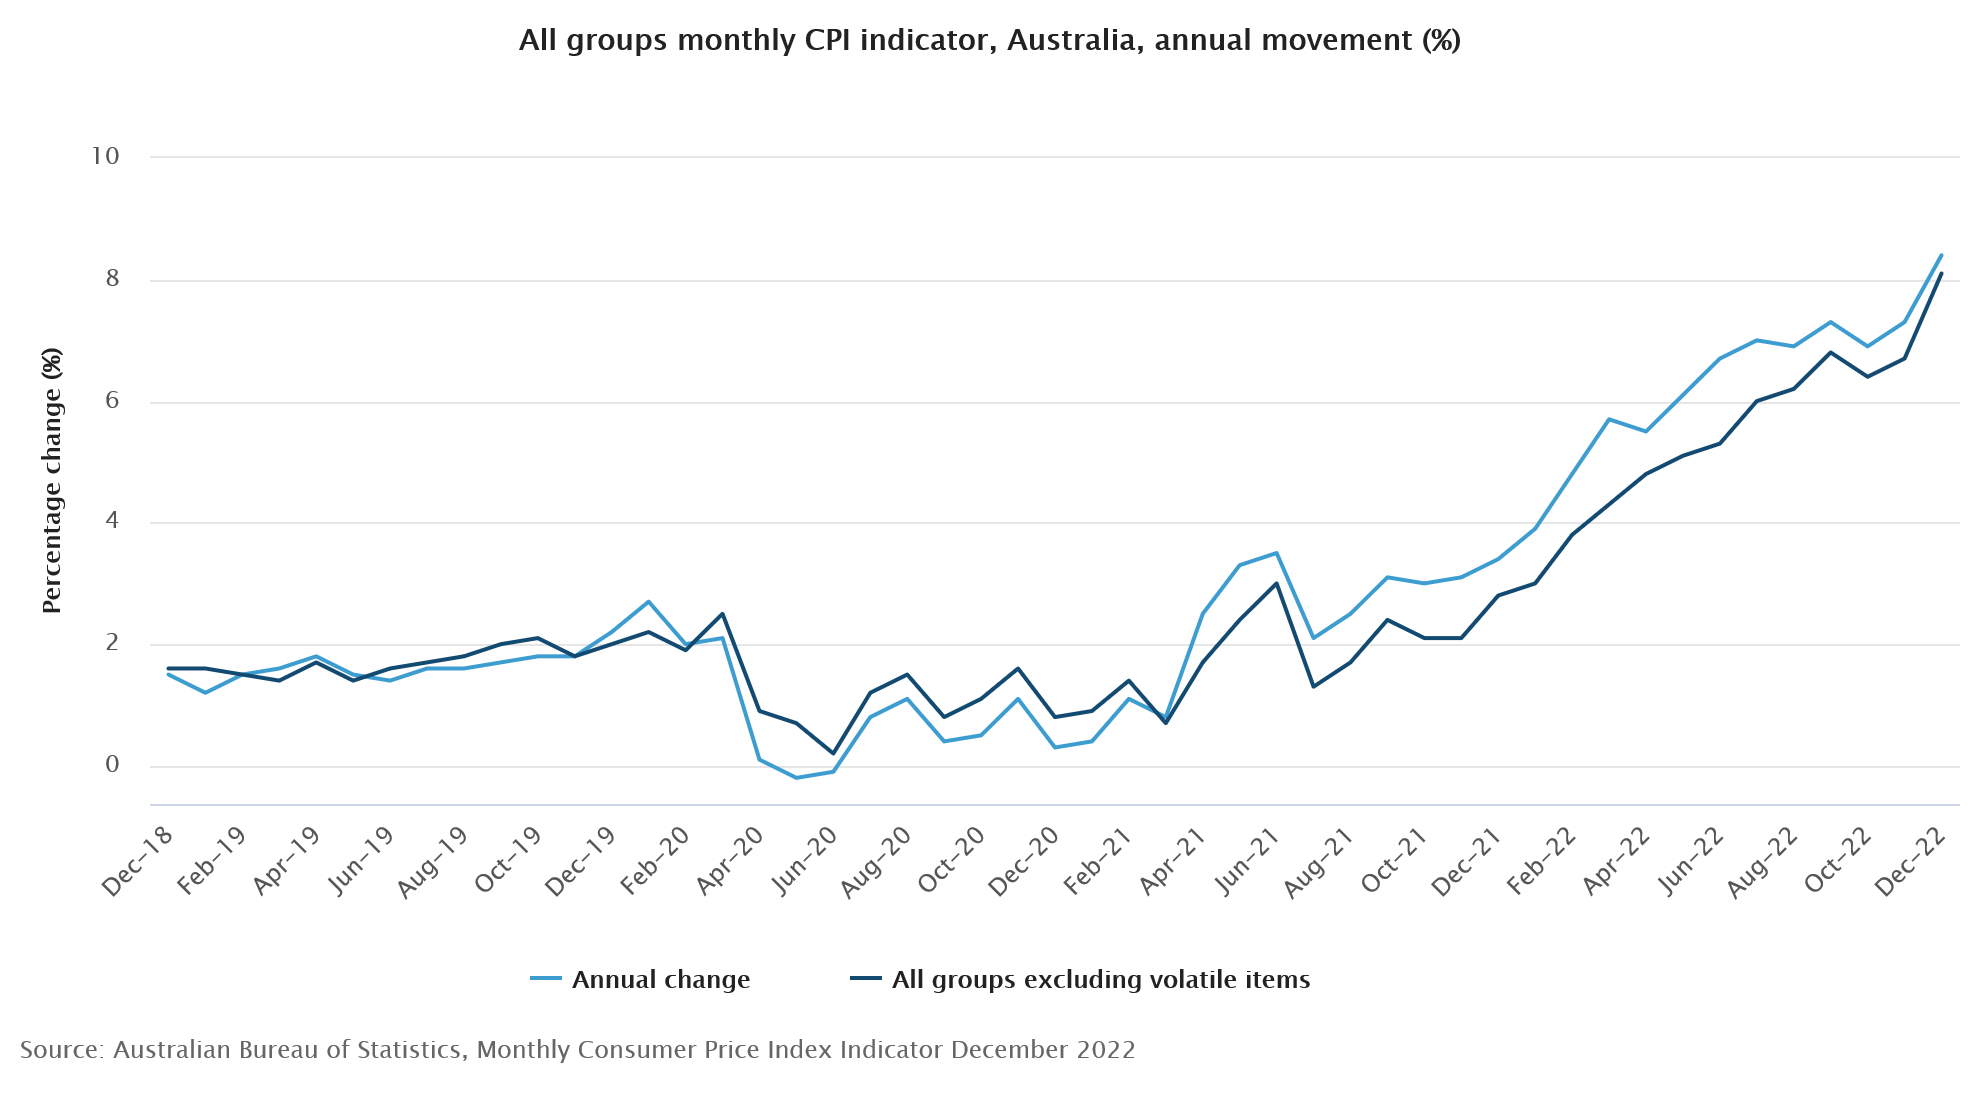
 Monthly CPI accelerated from 7.3% yoy to 8.4% yoy in December, above expectation of 7.7% yoy.
Marquardt said, "The monthly indicator recorded the largest annual rise in the series in December. The most significant contributors in the 12 months to December were New dwellings, up 16.0 per cent, and Holiday travel and accommodation, up 29.3 per cent. Airfare and accommodation prices rose in response to strong demand over the Christmas holiday period."
Australia CPI: Hospitality Prices Surge While Dwelling Price Inflation Eases Back
Headline CPI 1.9%qtr/7.8%yr; Trimmed Mean 1.7%qtr/6.9%yr; Weighted Median 1.6%qtr/5.8%yr. Hospitality services most important factor in the upside surprise in the December quarter but with the Trimmed Mean coming in broadly as expected this suggests the pace of core inflation is generally unfolding as we expected.
The CPI lifted 1.9% in the December quarter with the most significant contributions coming from domestic holiday travel & accommodation (+13.3%), electricity (+8.6%), and international holiday travel & accommodation (+7.6%).
The ABS noted that “strong demand, particularly over the Christmas holiday period, contributed to price rises for domestic holiday travel and international airfares.” The rises seen for domestic & international travel were notably higher than the historical norm for the December quarter.
We did see the expected unwinding of the $400 electricity credit offered by the Western Australian Government. There was some offset from the Queensland Government's $175 Cost of Living rebate and the introduction of the Tasmanian Government's $119 Winter Bill Buster electricity discount for concession households.
The large upsize surprise in the December quarter, compared to our 1.5% forecast, was the 5.4% rise in recreation on the back of a 10.9% increase in holiday travel & accommodation costs. Housing was slightly stronger than expected (1.9% vs 1.7% forecast) with slightly stronger gains in dwelling prices and utilities. However, it only contributed 0.06ppt to our 0.5ppt error confirming that housing is no longer the inflationary story but pressures are shifting more towards services and, in particular, tourism and hospitality services.
Even though food prices continued to rise, driven by meals out & takeaway foods (+2.1%) as restaurants/cafes passed on rising ingredients and labour costs, the 0.9% increase was less than our 2.0% forecast. The main downside surprise in food was the 7.3% fall in fruit & vegetables reflecting the increase in supply due to improved weather conditions.
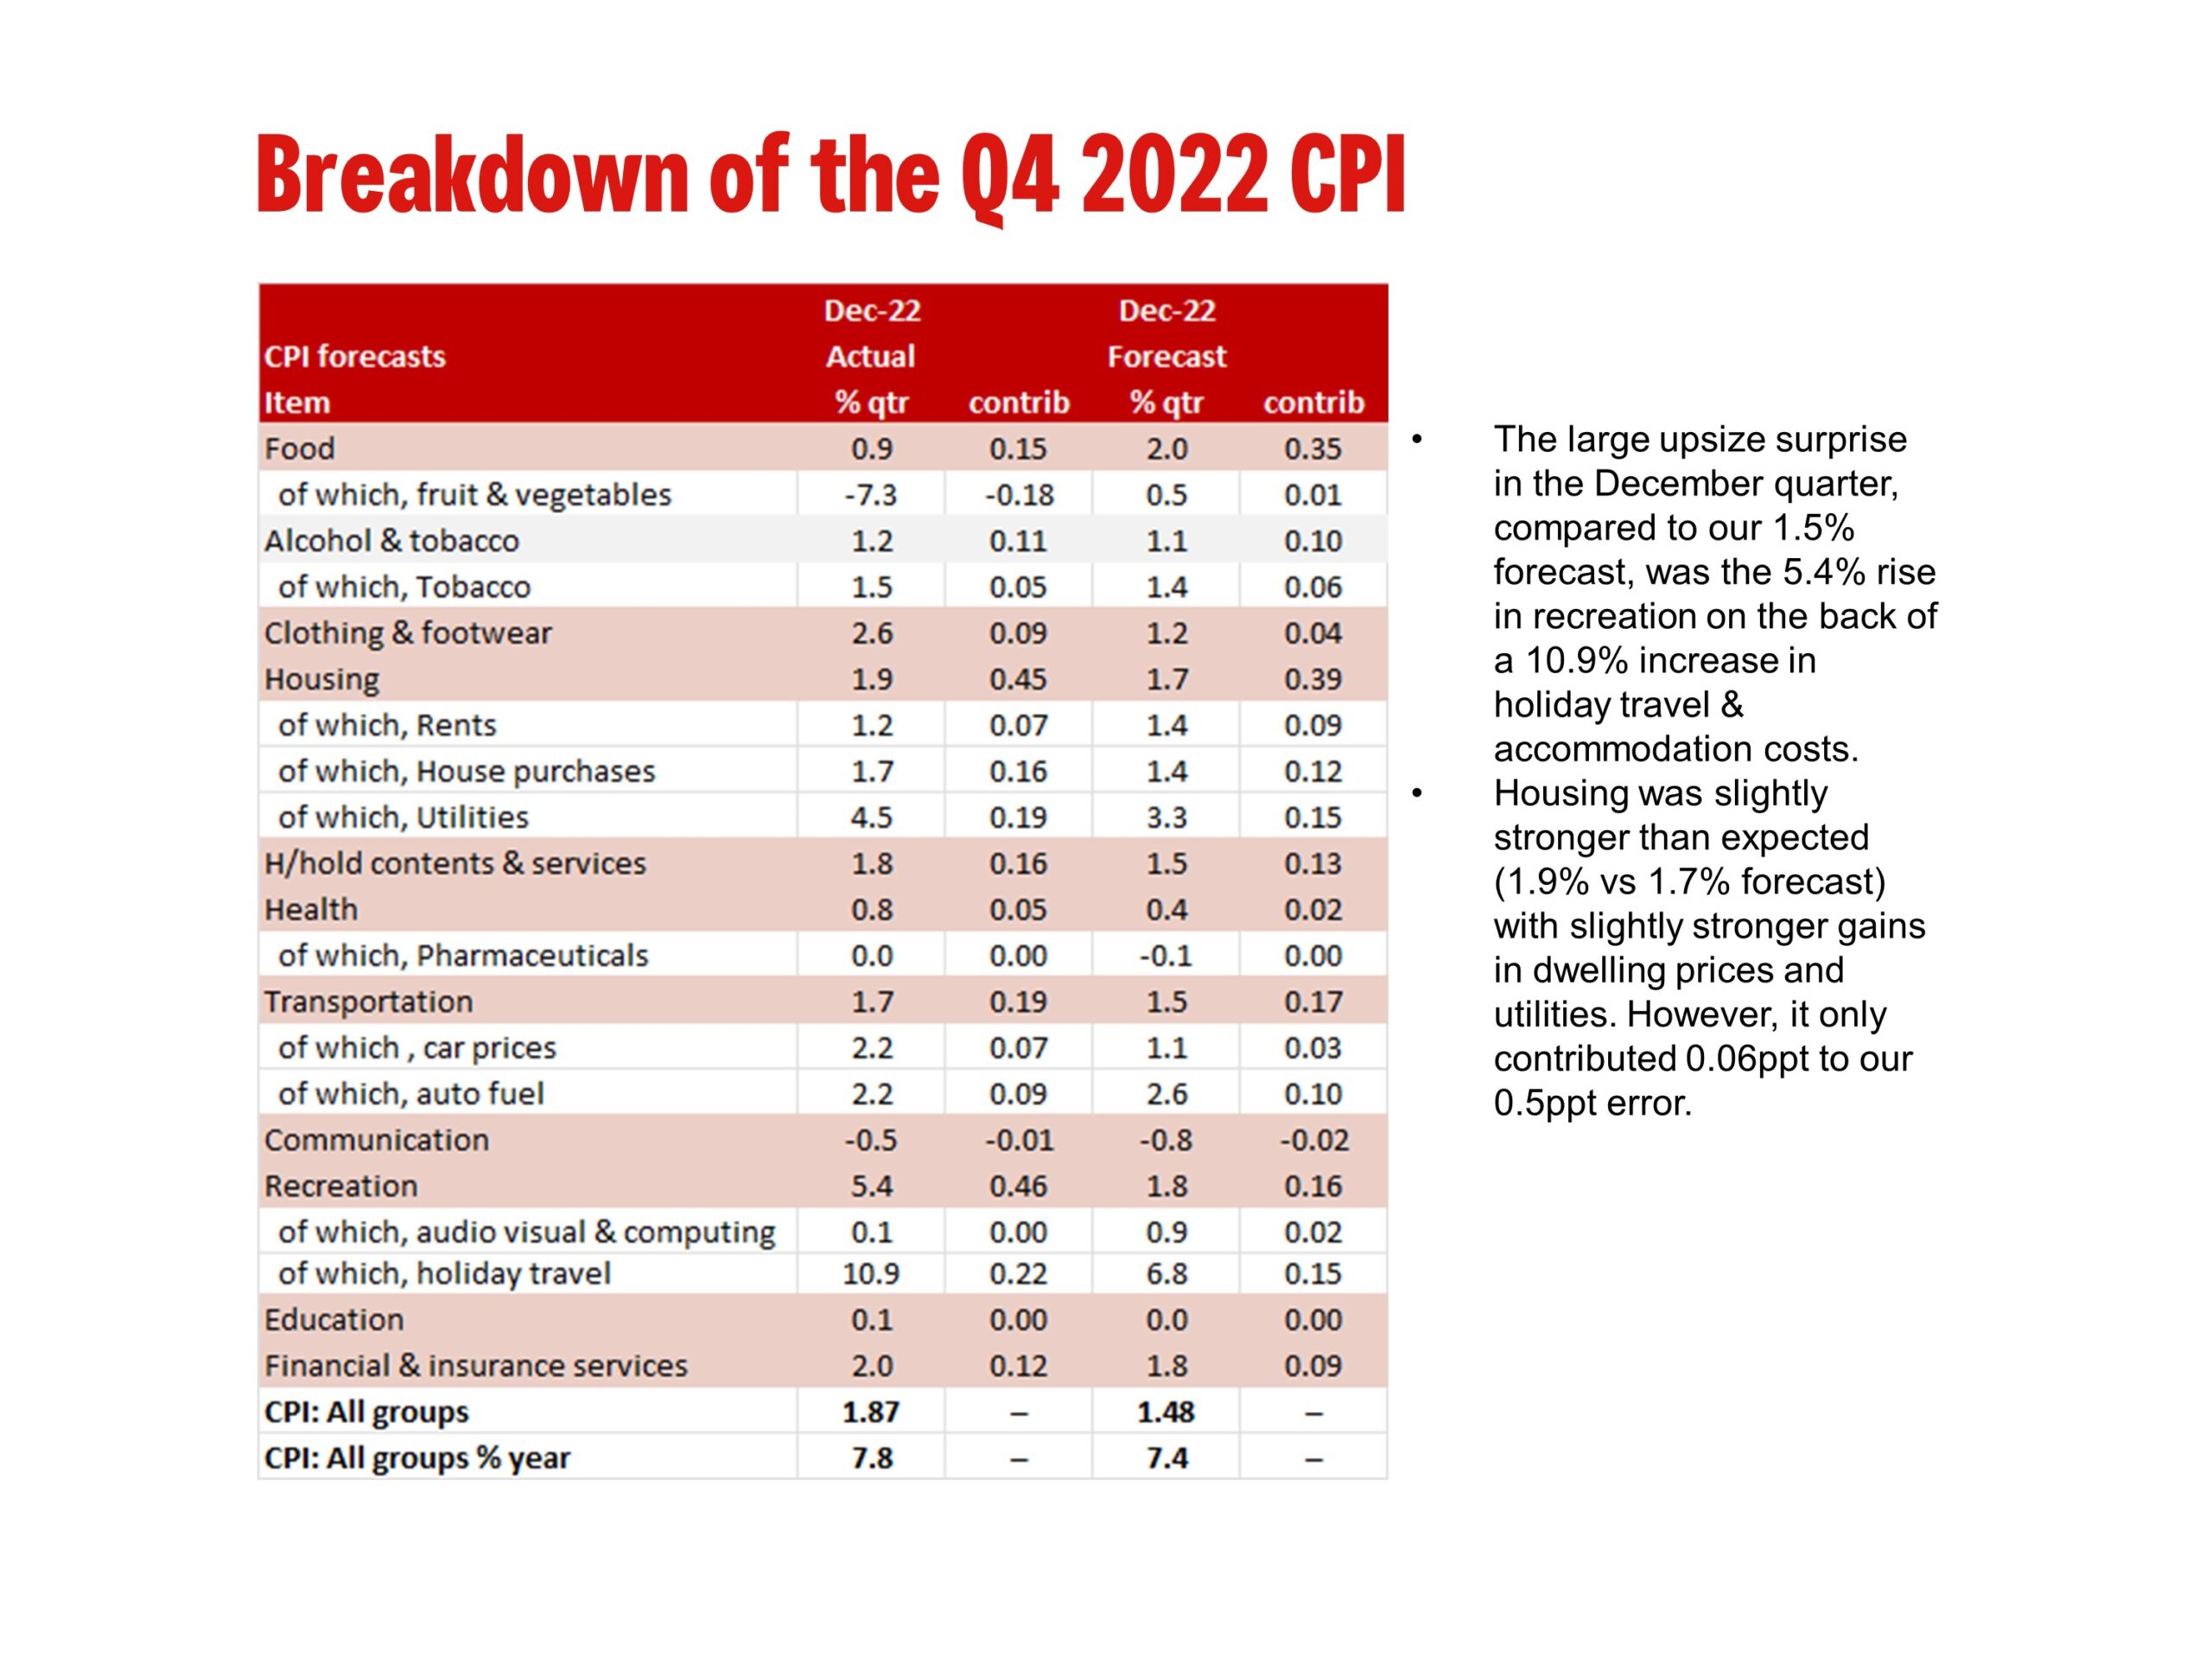
The Trimmed Mean rose 1.7%, a touch more than Westpac’s 1.6% forecast but 0.2ppt more than the market’s 1.5% forecast. This suggests the overall momentum of underlying inflation is broadly as we expected.
We are processing the numbers and working through how they will impact on our current inflation forecasts.
New Zealand CPI unchanged at 7.2% yoy in Q4
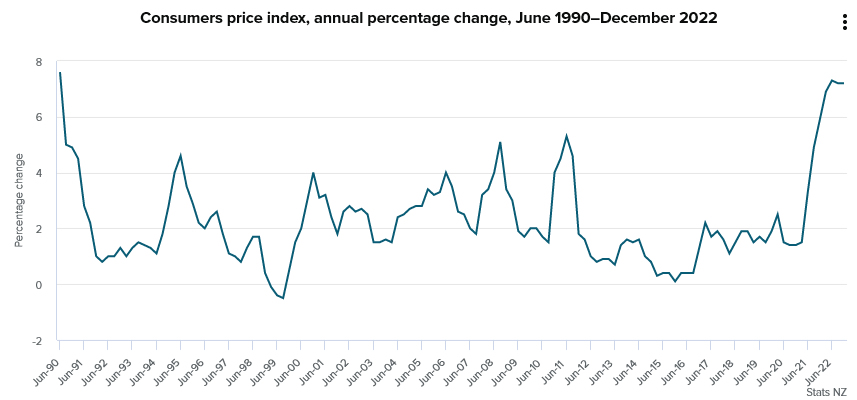
New Zealand CPI rose 1.4% qoq in Q4, slightly below expectation of 1.5% qoq. Annual CPI was unchanged at 7.2% yoy, above expectation of 7.1% yoy, comparing to the peak at 7.3% yoy in Q2.
StatsNZ said, "Housing and household utilities was the largest contributor to the December 2022 annual inflation rate. This was due to rising prices for both constructing and renting housing."
The quarterly rise in inflation was "influenced by rising prices in the housing and household utilities, food, and recreation and culture groups."
ECB Simkus backs hikes of 50bps in the coming meetings
ECB Governing Council member Gediminas Simkus said yesterday, "core inflation remains strong and demonstrates that the fight against inflation is not over."
"There's a strong case for staying on the course that's been set for the coming meetings of 50 basis-point increases. In my opinion, these 50 basis-point increases must be taken unequivocally," he added.
"Pressures in wage growth are increasing — I expect wage increases to exceed historical averages in the euro area," he said. "It's something that's happening and something we need to take into account because it affects core inflation."
"It's clear to me that the current economic environment requires us to deliver increases of 50 basis points in the coming meetings," he said. "When we move to the more distant periods of the summer or next autumn, we need to wait and see."
SNB Schlegel: Cannot rule out further interest increases
SNB Vice Chairman Martin Schlegel said yesterday, "we cannot rule out further interest increases at present," even though inflation is forecast to fall back to 2.4% in 2023, and 1.8% in 2024.
"The maintenance of price stability has absolute priority for the SNB," he added.
Meanwhile, Schlegel also expects a weak growth dynamic in the coming quarters.
NZ CPI Review: Lower RBNZ OCR Peak Now Expected
NZ CPI Review: Lower RBNZ OCR Peak Now Expected
- We have revised down our forecast for Official Cash Rate hikes from the RBNZ. We now expect a 50 bp rise in the OCR at the February policy meeting (previously we expected a 75 bp rise).
- We continue to expect another 50 bp increase in April, but that will be dependent on the strength of economic conditions.
- Inflation pressures have remained strong. However, the acceleration in inflation that the central bank was forecasting has not eventuated.
- At the same time, signs of a downturn in demand are developing. And with mounting pressure on household balance sheets, a stark slowdown in economic activity is expected over the coming year.
- Against this backdrop, further increases in the OCR are still required to bring inflation back inside the RBNZ's target band. However, it now appears that the extent of those increases doesn't need to be as large as we (or the RBNZ) had previously assumed.
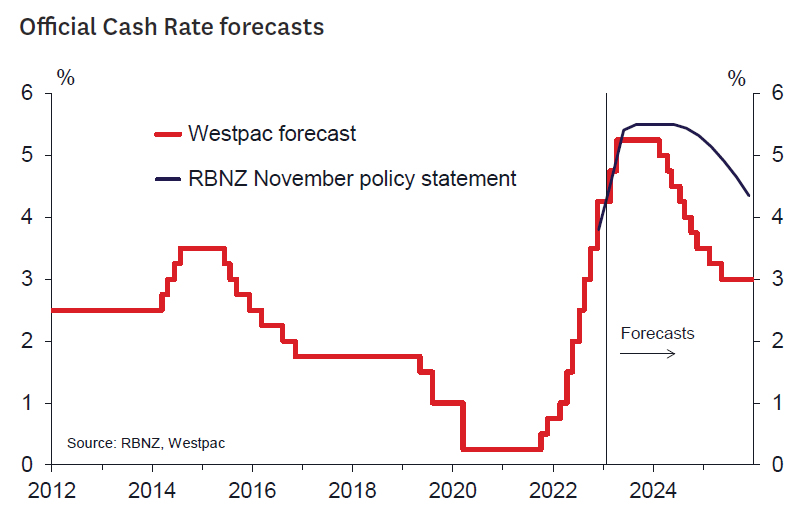
Inflation remains strong. However, it has fallen short of the Reserve Bank's forecast. At the same time, a slowdown in demand is taking shape and economic growth is set to slow sharply over 2023. Against this backdrop, further hikes in the Official Cash Rate are still needed to get inflation back inside the target band. However, the extent of policy tightening required to do that now looks like it will be more moderate than the central bank had previously signalled.
The Consumers Price Index rose 1.4% in the December quarter. That left the annual inflation rate at 7.2%, just slightly below the 32-year high that was reached in June.
December quarter inflation was boosted by unusually large increases in some specific prices, with food prices up a massive 11% and large increases in both domestic and international airfares. But even adjusting for those sorts of swings in specific areas, there's no denying that the underlying trend in inflation remains strong and that pressures are widespread. In fact, most measures of core inflation are continuing to track around 6%.
That continued firmness in underlying inflation pressures isn't a surprise. We weren't expecting to see an easing in inflation just yet.
However, the RBNZ didn't just expect that inflation pressures would remain strong: the central bank actually expected an acceleration in inflation in the December quarter. In its last policy statement, the RBNZ forecast that the annual inflation rate would rise to 7.5%, and that it would remain around that level through the early part of 2023.
Instead, inflation has fallen short of the RBNZ's forecast. Annual inflation peaked at 7.3% back in June. And while still elevated, it doesn't look like it's pushing higher. Rather, the annual inflation rate has held steady at 7.2% for the past six months.
Looking ahead, inflation looks set to ease (albeit gradually) back over the year ahead. We're still updating our forecasts for today's result, but at this stage it looks like inflation will track well below the RBNZ's forecast over 2023.
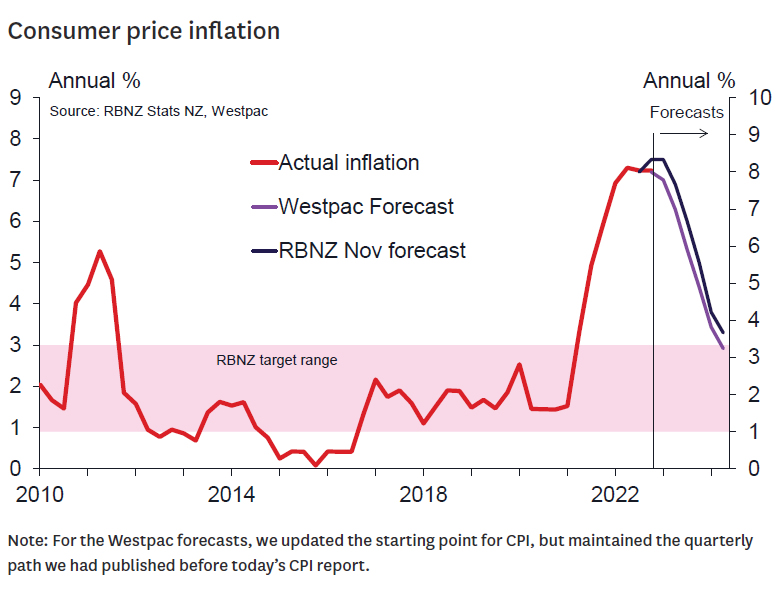
We're still looking at a strong inflation outlook, with the labour market and businesses' productive capacity still highly stretched, and international tourism on the rise. On top of that, disruptions to food production and the end of the Government's fuel excise reductions will both add to inflation over the coming months. Against that backdrop, annual inflation is set to remain over 6% through the first half of this year. But that would still be much lower than the RBNZ had been expecting in November when they delivered a jumbo size 75 bp rise in the OCR and signalled further large increases would be coming in short order.
The past few weeks have also seen some notable developments in terms of economic activity, with signs that the long forecast slowdown in demand is now taking shape. In the household sector, retail card spending declined 2.5% in December, with softness in spending seen across a range of discretionary categories. At the same time, businesses are reporting a downturn in trading activity and forward orders. We've also seen job advertisements dropping back.
On top of that, the coming year will see increasing pressure on households' finances. In part, that's due to the continued rapid increases in consumer prices that is squeezing households' purchasing power. In addition, around half of fixed rate mortgages will come up for re-pricing within the next 12 months. In many cases, borrowers will face refixing at interest rates that are 3 percentage points higher than those they are currently on. Those financial pressures, along with the related downturn in the housing market, will be a significant drag on demand – and inflation – over the coming year.
Putting this altogether, we're still left with a strong inflation outlook and the need for continued interest rate increases to get inflation back inside the 1% to 3% target band. However, the extent of further policy tightening required to do that doesn't look like it will be as large as the RBNZ had previously assumed. As a result, we've revised down our forecast for the peak in the Official Cash Rate.
We're now forecasting a 50 bp rise in the OCR at the RBNZ's February policy meeting (previously we forecast a 75bp increase). We continue to expect a 50 bp rise in April with a pause after that time. Those increases would take the cash rate to a peak of 5.25% - lower than the 5.50% peak we previously projected. That's also below the 5.50% peak that the RBNZ had signalled in their last published forecasts from November.
While we are continuing to forecast a 50 bp hike in April, that will be dependent on the strength of economic conditions over the next few months. If the downturn in demand is sharper than we expect, or if inflation pressures start to cool sooner than anticipated, the RBNZ could opt for a smaller 25 bp hike.
USD/CAD At Risk Ahead of BoC Interest Rate Decision
Key Highlights
- USD/CAD extended losses below the 1.3450 support.
- A major bearish trend line is forming with resistance near 1.3445 on the 4-hours chart.
- EUR/USD is eyeing more gains above the 1.0900 resistance zone.
- The BoC interest rate decision is scheduled today (forecast 4.5%, versus 4.25% previous).
USD/CAD Technical Analysis
The US Dollar started a fresh decline from well above 1.3550 against the Canadian Dollar. USD/CAD declined below 1.3450 to move into a short-term bearish zone.
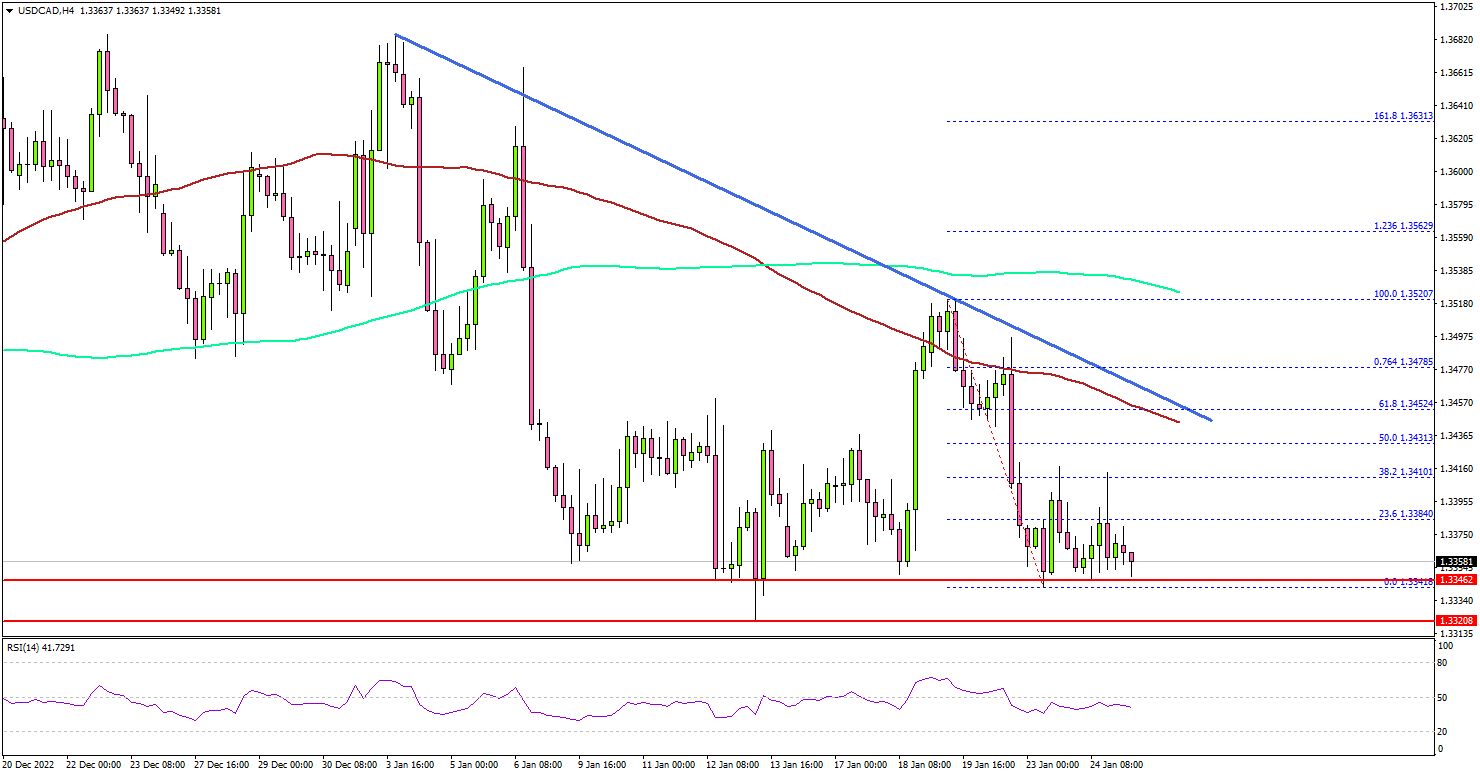
Looking at the 4-hours chart, the pair settled below the 1.3450 level, the 100 simple moving average (red, 4-hours) and the 200 simple moving average (green, 4-hours).
The pair even traded below the 1.3400 level and tested the 1.3350 support zone. It is now consolidating losses above the 1.3350 support. On the upside, an initial resistance is near the 1.3420 level.
The next major resistance may perhaps be near 1.3450. There is also a major bearish trend line forming with resistance near 1.3445 on the same chart. A clear move above the 1.3450 resistance might start a steady increase towards the 1.3520 resistance zone.
Any more gains could open the doors for a move towards the 1.3600 level. The next key hurdle is near 1.3640, above which the pair could climb towards the 1.3800 resistance zone.
On the downside, there is a major support at 1.3350. The next major support is near the 1.3320 level. A downside break below the 1.3320 zone might push the pair lower.
The next major support sits near the 1.3250 level. Any more losses might open the doors for a move towards the 1.3120 support zone.
Looking at EUR/USD, the pair is consolidating in a tight range and might attempt a fresh increase above the 1.0900 resistance.
Economic Releases
- German IFO Business Climate Index for Jan 2022 – Forecast 90.2, versus 88.6 previous.
- BoC Interest Rate Decision – Forecast 4.5%, versus 4.25% previous.
EURCHF : Euro Swiss Pair Bouncing from Weekly Blue Box
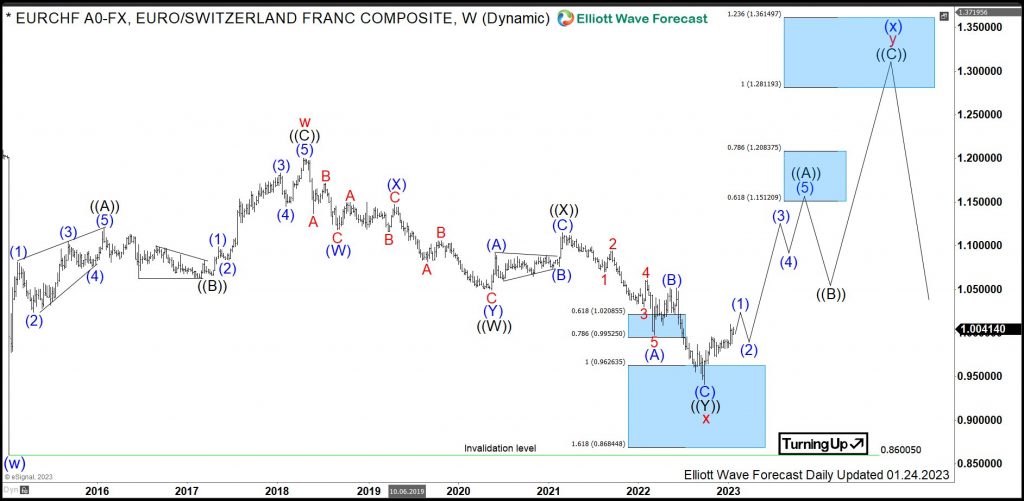
In the present article, we are going to take a look on the weekly chart of EURCHF: Euro Swiss forex pair. In a quiet natural way, this cross is a ratio of two pairs: EURUSD and USDCHF. Even though, both dollar linked pairs are by far more liquid instruments, the EURCHF shows its own character. Indeed, from January 2015 lows it develops a clean double three structure and follows hereby Fibonacci extension levels.
In our initial article from March 2020, we have forecasted another bullish cycle after 7 swings lower. As a matter of fact, the market has provided a short term bounce and correction continued as a larger 7 swings structure. Here, we take a view on EURCHF pattern in the past 8 years and provide an outlook with targets for coming 3-5 years.
EURCHF Weekly Elliott Wave Analysis 01.24.2023
The weekly chart below shows the price behavior of the cross ratio EURCHF. From the lows of January 2015, the pair has developed a cycle higher in red wave x of a cycle degree. It has printed the highs in April 2018 at 1.2005. The advance is an Elliott wave zigzag pattern being a 3 swings corrective structure. Generally speaking, the correction might be over after 3 swings already. However, in contrast to stocks, forex is a range bound market. Therefore, the latter can trend also in corrective sequences.
From April 2018 highs, a correction lower in wave x has unfolded as a double three pattern being 3-3-3 structure. First, wave ((W)) has ended in May 2020 at 1.0492 lows. Then, a connector in wave ((X)) has printed a lower high in March 2021 at 1.1151. From there, wave ((Y)) has developed another 3 swings to the downside. Hereby, blue wave (A) of black wave ((Y)) has reached 1.0208-0.9952 intermediary range being 0.618-0.786 extension area. After a bounce in wave (B), the final swing in blue wave (C) of black wave ((Y)) has reached 0.9626-0.8684 full extension area. From that area, a strong reaction higher can be seen. Now, the bottom at 0.9407 lows is favored to be the end the entire correction of cycle from January 2015 lows.
From the September 2022 lows, EURCHF might be in the first stages of a new cycle in red wave y. While above 0.9407 lows, pair can reach in 3 swings 1.2811-1.4914 area. Hereby, intermediary area 1.1512-1.2083 should provide medium term resistance.
WTI Crude Oil Wave Analysis
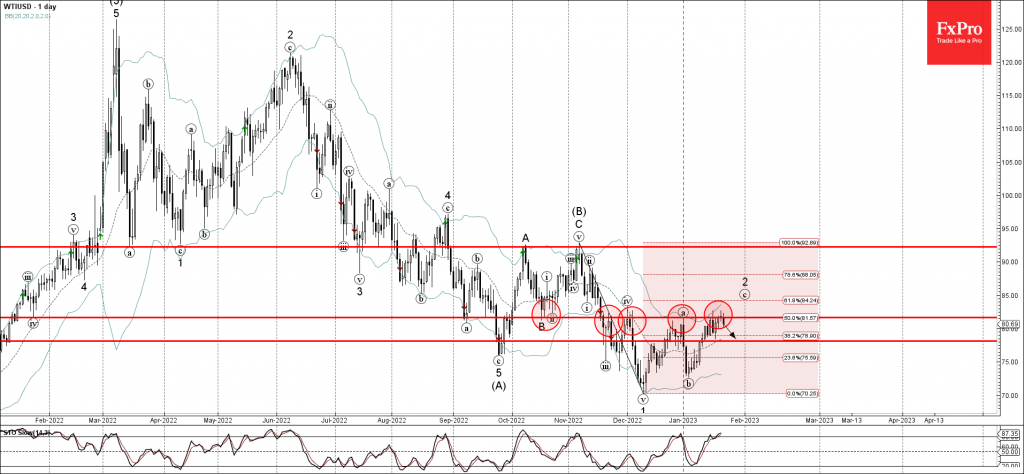
- WTI crude oil reversed from resistance level 96.00
- Likely to fall to support level 78.0
WTI crude oil recently reversed down from the pivotal resistance level 96.00 (which has been reversing the price from the end of November) intersecting with the 50% Fibonacci correction of the previous downward impulse from November.
The downward reversal from the resistance level 96.00 stopped the earlier minor ABC correction 2.
Given the persistent daily downtrend, WTI crude oil can be expected to fall further toward the next support level 78.0.
AUDJPY Wave Analysis
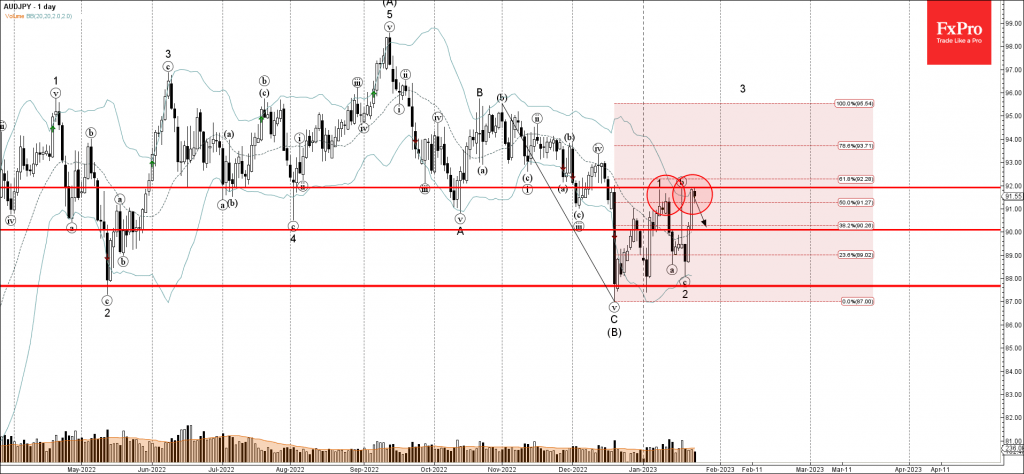
- AUDJPY reversed from key resistance level 92.00
- Likely to fall to support level 90.00
AUDJPY currency pair recently reversed down from the key resistance level 92.00 (which stopped the two of the previous minor waves -1 and b) intersecting with the upper daily Bollinger Band and the 50% Fibonacci correction of the previous sharp downward impulse from October.
The downward reversal from the resistance level 92.00 stopped the earlier minor impulse wave 3 of wave (C) from December.
Given the strength of the resistance level 92.00, AUDJPY currency pair can be expected to fall further toward the next round support level 90.00.