Sample Category Title
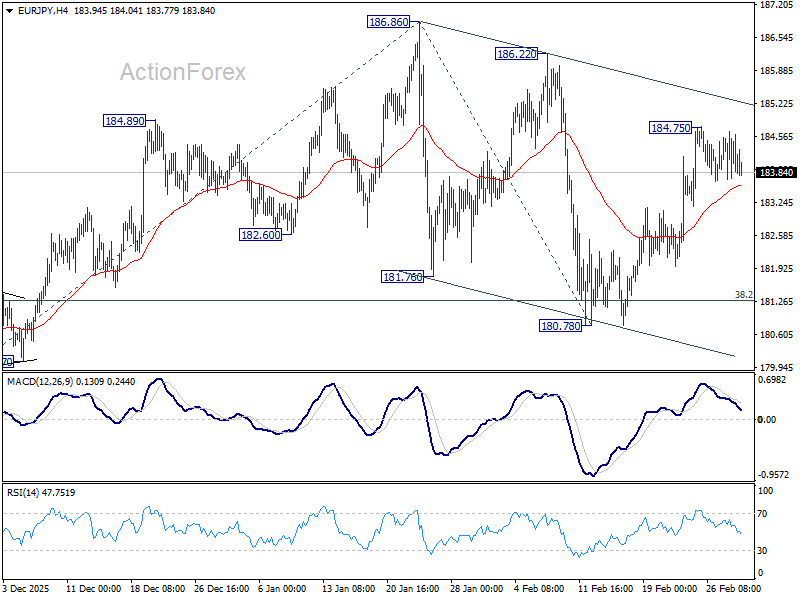
EUR/JPY Daily Outlook
Daily Pivots: (S1) 183.41; (P) 184.05; (R1) 184.58; More...
Intraday bias in EUR/JPY remains neutral at this point, as sideway trading continues below 184.75. On the upside, break of 184.75 will target 186.86 high. Firm break there will resume larger up trend to 61.8% projection of 172.24 to 186.86 from 180.78 at 189.81. Overall, outlook will remain bullish as long as 38.2% retracement of 172.24 to 186.86 at 181.27, in case of deep retreat.
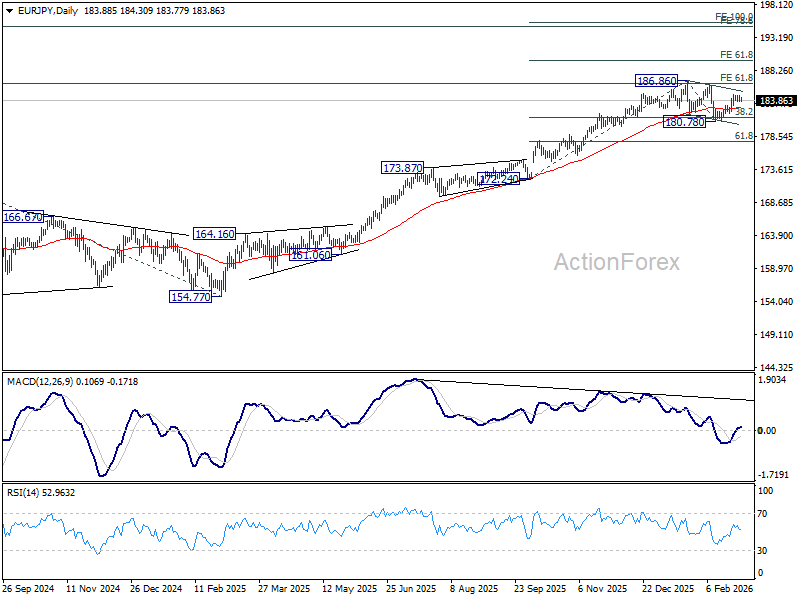
In the bigger picture, current development suggests that price actions from 186.86 are merely a near term corrective pattern. In other words, the long term up trend is still in progress. Firm break of 186.86 will pave the way to 78.6% projection of 124.37 (2022 low) to 175.41 (2025 high) from 154.77 at 194.88 next. This will now remain the favored case as long as 180.78 support holds.
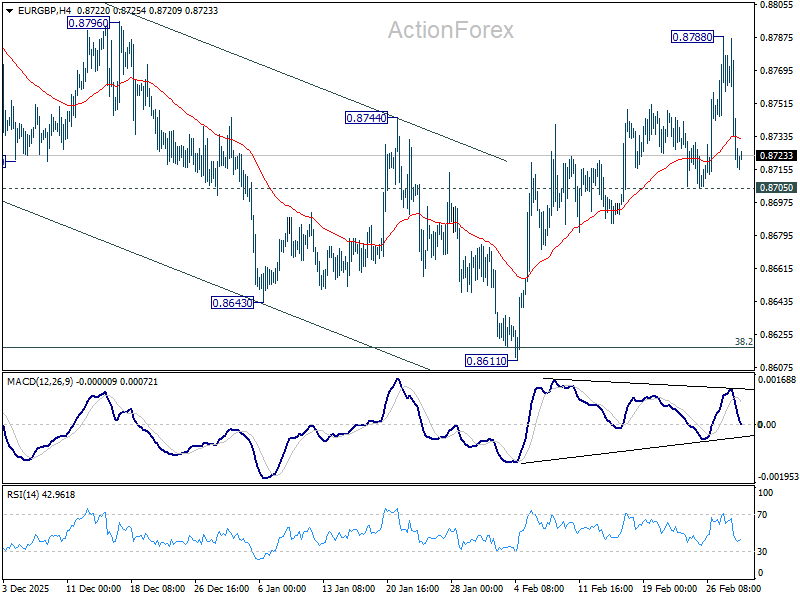
EUR/GBP Daily Outlook
Daily Pivots: (S1) 0.8697; (P) 0.8743; (R1) 0.8766; More…
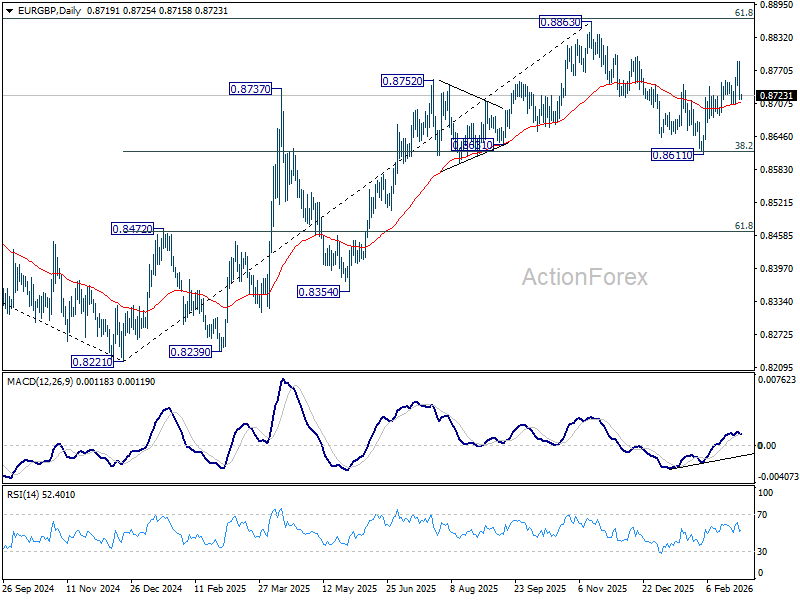
Intraday bias in EUR/GBP is turned neutral first with current steep retreat. Further rise is in favor as long as 0.8705 support holds. Above 0.8788 will resume the rebound from 0.8611 and target a retest on 0.8863 high. However, firm break of 0.8705 will argue that the pattern from 0.8863 is extending with another falling leg. In this case, bias will be turned back to the downside for 0.8611 support instead.
In the bigger picture, current development suggests that rise from 0.8221 medium term bottom is still in progress. Decisive break of 61.8% retracement of 0.9267 to 0.8221 at 0.8867 should confirm that it's reversing whole down trend from 0.9267. That should pave the way back to 0.9267.
EUR/AUD Daily Outlook
Daily Pivots: (S1) 1.6392; (P) 1.6563; (R1) 1.6649; More...
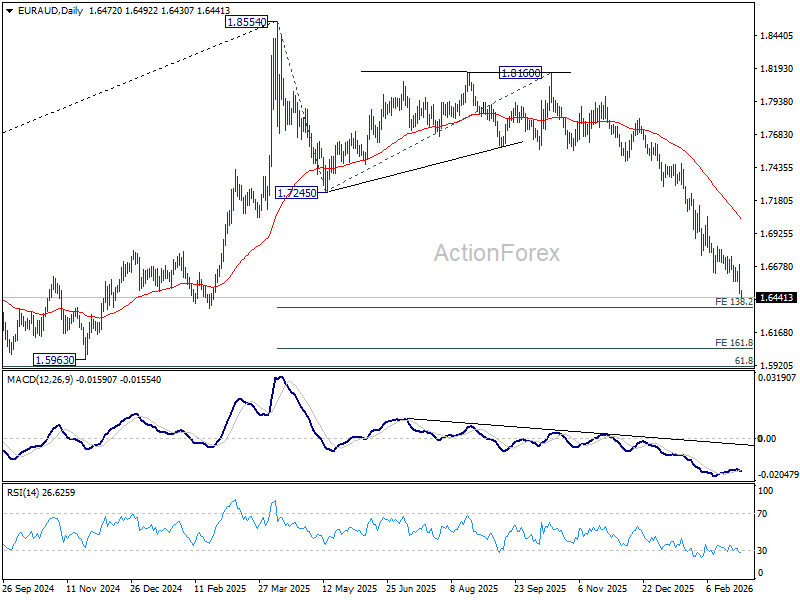
EUR/AUD's down trend is still in progress and intraday bias stays on the downside for 138.2% projection of 1.8554 to 1.7245 from 1.8160 at 1.6351. Firm break there will target 161.8% projection at 1.6042 next. On the upside, above 1.6691 minor resistance will turn intraday bias neutral and bring consolidations first.
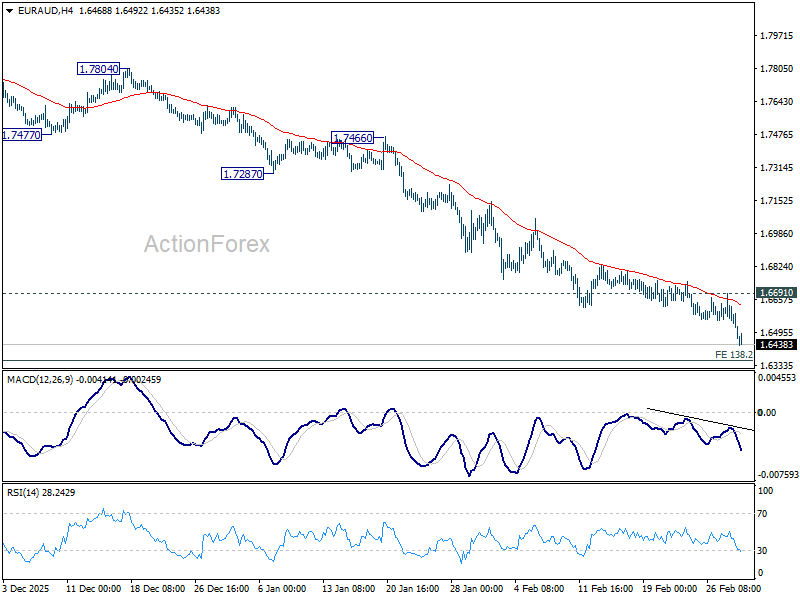
In the bigger picture, fall from 1.8554 medium term top is seen as reversing the whole up trend from 1.4281 (2022 low). Deeper decline should be seen to 61.8% retracement of 1.4281 to 1.8554 at 1.5913, which is slightly below 1.5963 structural support. For now, risk will stay on the downside as long as 55 D EMA (now at 1.7033) holds, even in case of strong rebound.
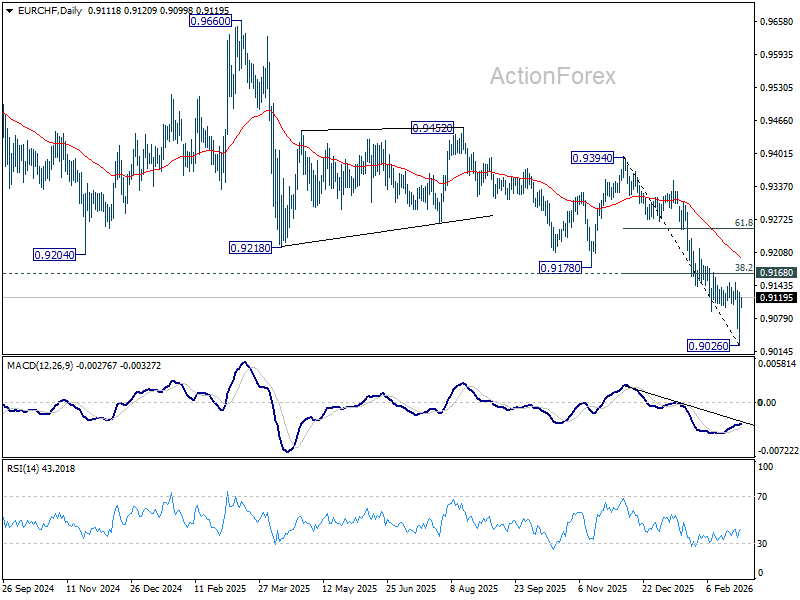
EUR/CHF Daily Outlook
Daily Pivots: (S1) 0.9046; (P) 0.9089; (R1) 0.9153; More....
Intraday bias in EUR/CHF remains neutral for the moment. Price actions from 0.9026 short term bottom are viewed as a consolidations pattern only. While stronger recovery cannot be ruled out, upside should be limited by 0.9168 cluster resistance (38.2% retracement of 0.9394 to 0.9026 at 0.9167). Another fall below 0.9026 to resume the larger down trend is expected at a later stage. However, decisive break of 0.9167/8 will bring stronger rebound to 55 D EMA (now at 0.9197) and possibly above.
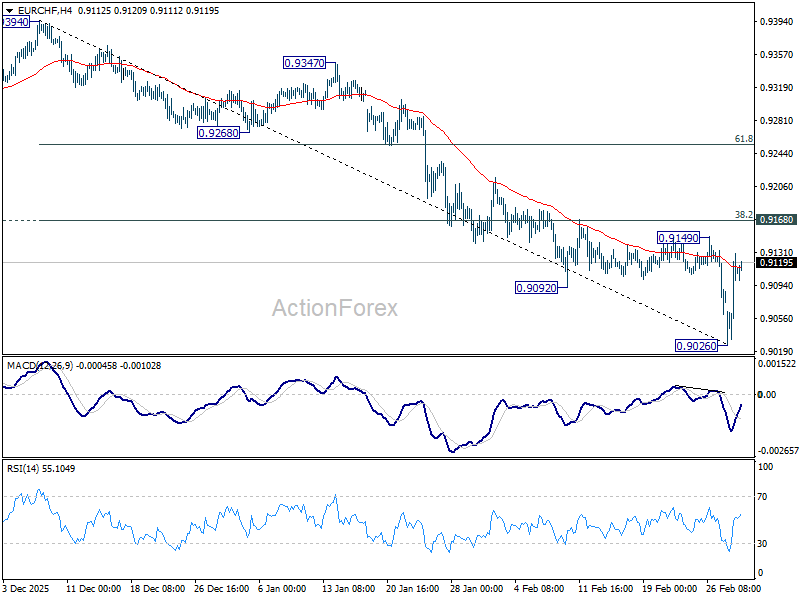
In the bigger picture, down trend from 0.9928 (2024 high) is still in progress. Next target is 61.8% projection of 1.1149 to 0.9407 from 0.9928 at 0.8851. Outlook will stay bearish as long as 0.9394 resistance holds, in case of rebound.
Bitcoin Near Inflection Point Amid Mounting Geopolitical Stress
Key Highlights
- Bitcoin is struggling to settle above $68,500 and $70,000.
- A bearish trend line is forming with resistance near $68,250 on the 4-hour chart of BTC/USD.
- Ethereum struggled to settle above $2,050 and $2,080.
- Gold is again moving higher above the $5,250 resistance.
Bitcoin Price Technical Analysis
Bitcoin price remained supported above $63,500 against the US Dollar. BTC climbed above $65,000 and $66,200, but the bears remained active.
Looking at the 4-hour chart, the price remained confined in a range below the 100 simple moving average (red, 4-hour) and the 200 simple moving average (green, 4-hour) amid the recent tensions between the USA, Israel, and Iran. The price attempted a recovery wave above $66,500. The price climbed above $68,000 before it faced resistance.
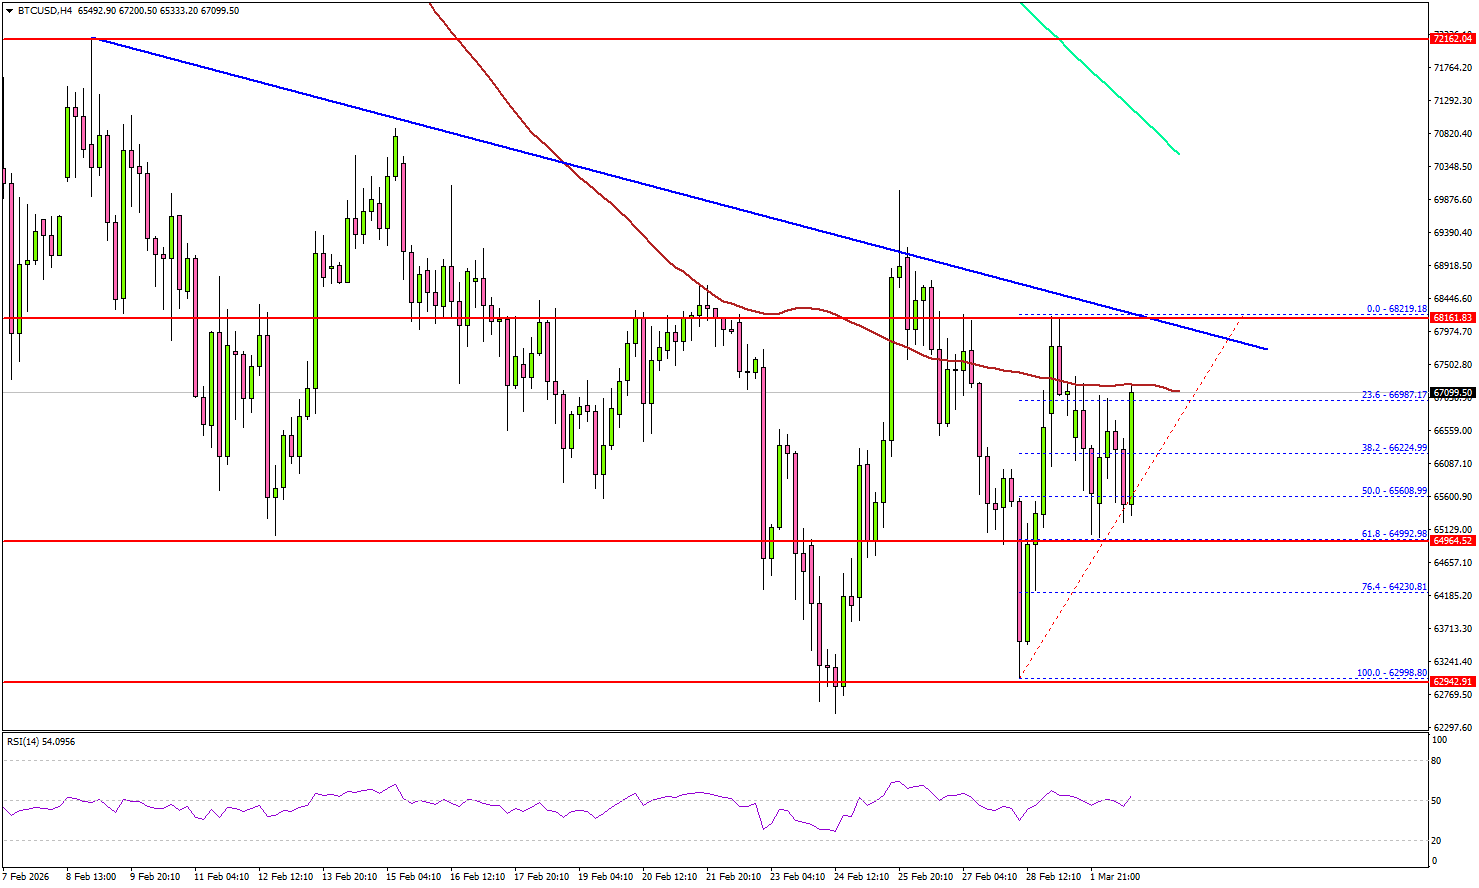
There is also a bearish trend line forming with resistance near $68,250. Immediate support sits at $65,600. The first key support could be $65,000.
A downside break below $65,000 might start another decline. The next major support is $63,000, below which BTC could decline toward $61,200.
If there is another recovery wave, the price could face resistance at $68,250 and the trend line. The first key hurdle is $69,500. A close above $69,500 could send the price toward $70,800 and the 200 simple moving average (green, 4-hour). Any more gains might call for a test of $72,000.
Looking at Ethereum, the price also remained in a range below the $2,120 resistance. If there is no close above $2,120, ETH could revisit $1,820.
Today’s Key Economic Releases
- Fed's Schmid speech.
- ECB's Sleijpen speech.
- ECB's Kocher speech.
- Fed's Kashkari speech.
Euro under siege as Middle East war exposes fragility, EUR/CAD to dive to 1.57
While the military theater of the US-Israel-Iran conflict is centered in the Persian Gulf, its economic epicenter is arguably the Eurozone. The sharp decline in Euro this week is not merely a broad flight into Dollar safety. It reflects targeted repricing of Europe’s structural vulnerabilities at a moment of acute energy risk. Euro has emerged as primary casualty among major currencies, underperforming nearly all peers except Swiss Franc, which relative weakness is largely policy-driven following intervention warning from the SNB
The Energy Storage "Time Bomb"
The timing could hardly be worse. The EU enters March refill season with gas storage around 30%, significantly below roughly 40% seen in 2025 and 60% in 2024. That cushion has evaporated just as maritime energy routes face disruption risk.
With Strait of Hormuz under threat and major shippers such as Maersk and Hapag-Lloyd bypassing Suez Canal, replenishing inventories will come at steep premium. This looming import bill shock acts as direct devaluation pressure on Euro through deteriorating trade balance.
The Stability Proxy
Besides, Euro is treated as a proxy for Eurasian stability. Tehran’s declaration of “Total War” elevates non-financial risks that disproportionately affect Europe. The region’s economic architecture is deeply intertwined with Middle East energy and Asian trade corridors.
Closure or prolonged disruption of Suez Canal forces rerouting around Cape of Good Hope, effectively taxing every Euro-denominated export. Longer shipping times translate into higher freight costs, inventory bottlenecks and margin compression for European manufacturers.
At the sovereign level, rising energy costs and regional instability could renew fiscal strain. Migration pressures and potential need for renewed energy subsidies risk widening deficits.
Monetary Policy "Trapping"
The ECB now finds itself edging toward stagflationary dilemma. Surging natural gas prices are inflationary, yet function as regressive tax on consumers and businesses. Growth erosion could force policymakers to prioritize stability over price control. Markets might start to price in scenario where the ECB is compelled to shift its stance, and even pivoting toward easing again even as inflation risks jump.
The Failure of the 1.2000
Failure to break 1.2000 in EUR/USD now looks pivotal. Throughout 2025, Euro rallied from 1.03 toward 1.20 on hopes of industrial revival. That psychological ceiling proved insurmountable. The weekend escalation is starting to trigger capitulation among long-position holders. What had been narrative of recovery is morphing into unwind of crowded positioning.
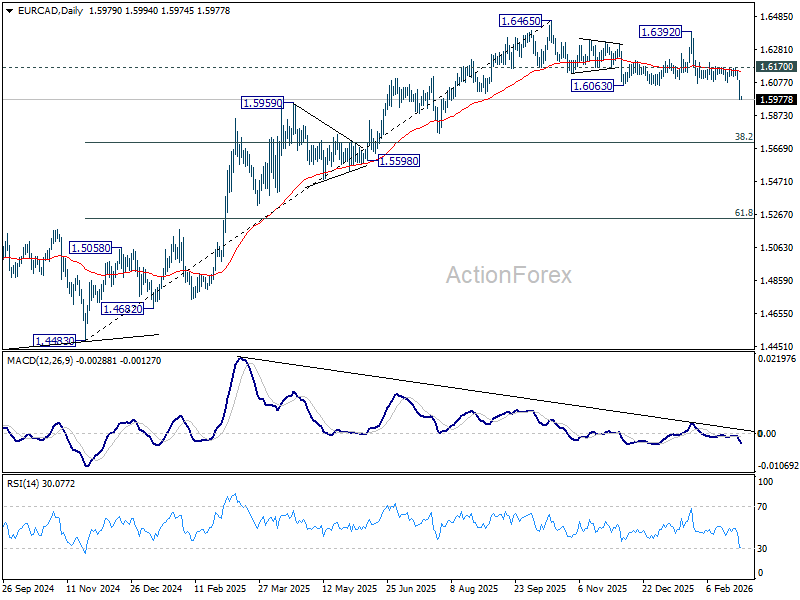
EUR/CAD to target 1.57
EUR/CAD is among the bigger movers this week, with Loonie being lifted by surging oil prices. Technically, fall from 1.6465 medium term top resumed by powering through 1.6063 support. Near term outlook will stay bearish as long as 1.6170 resistance holds.
For now, the fall from 1.6465 is seen as a correction to the five-wave rally from 1.4483. Deeper decline should be seen to 38.2% retracement of 1.4483 to 1.6465 at 1.5708. But strong support should be seen there to contain downside to bring rebound.
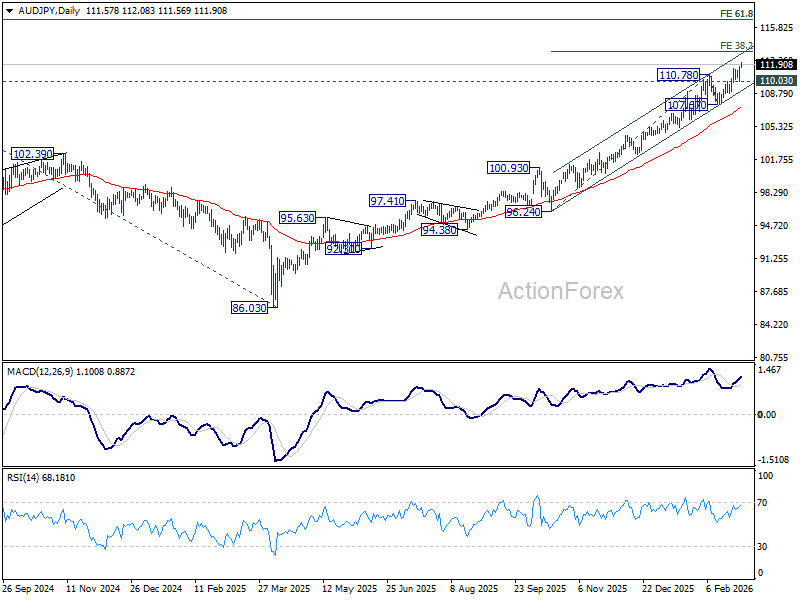
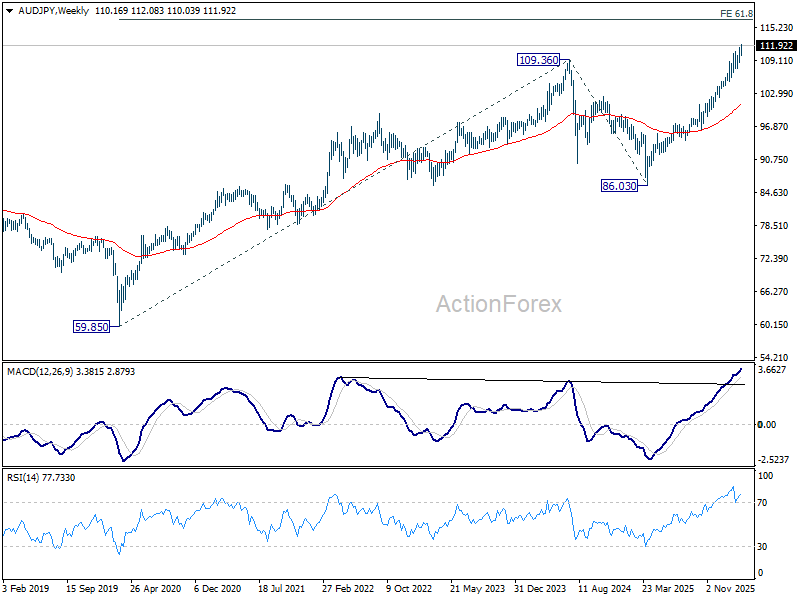
AUD/JPY breaks high after hawkish RBA shift, 113.22 next
Australian Dollar rallied broadly after RBA Governor Michele Bullock delivered hawkish remarks that reintroduced a genuine possibility of a rate hike at the March meeting. By describing the decision as “live” and warning against assuming a hold, Bullock unsettled prior market consensus and injected fresh upside risk into rate expectations. The shift immediately translated into stronger AUD performance across the board.
AUD/JPY led the advance, extending its uptrend and breached 112 level. The move reflects not only renewed tightening speculation from the RBA, but also relatively softer Yen dynamics amid delayed tightening expectations from Tokyo.
Technically, as long as 110.03 support holds, near-term bias remains firmly to the upside. The next target lies at 38.2% projection of 96.24 to 107.67 from 110.78 at 113.22, which aligns closely with the upper boundary of the near term rising channel. That area could present initial resistance and cap gains on first test, particularly if momentum indicators begin to stretch.
However, decisive break above 113.22 would open the path toward 61.8% projection at 116.65 before topping around there. That level represents a much more formidable barrier, coinciding almost precisely with the long-term fibonacci level, 61.8% projection of 59.85 (2020 low) to 109.36 (2024 high) from 86.03 (2025 low) at 116.62.
RBA’s Bullock reopens door to March hike as oil risks mount
RBA Governor Michele Bullock delivered a distinctly hawkish message at the AFR Business Summit today, warning markets not to assume a March rate hold is a done deal. She stressed that the upcoming meeting is “live,” pushing back against expectations that policy decisions are effectively pre-set or limited to quarterly moves.
Bullock highlighted that inflation remains elevated at 3.8% while unemployment at 4.1% still reflects tight labor market conditions. The Board, she said, will be “actively looking” at whether it needs to "move more quickly", explicitly discouraging the view that the RBA only adjusts rates at predictable intervals.
Central to her remarks was the risk of a prolonged oil price spike stemming from escalating Middle East tensions. While she emphasized that it is too early to quantify the impact, Bullock warned that a supply-driven shock could add to inflation pressures and, critically, influence inflation expectations — a development the RBA is “very alert to.”
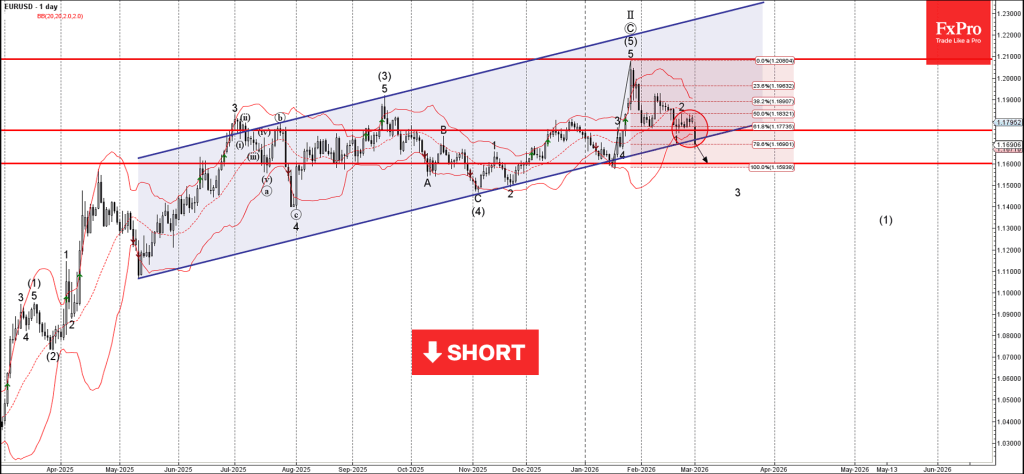
EURUSD Wave Analysis
EURUSD: ⬇️ Sell
- EURUSD broke support zone
- Likely to fall to support level 1.1600
EURUSD currency pair recently broke the support zone between the key support level 1.1755 (former resistance from October and December), support trendline of the daily up channel from May and the 61.8% Fibonacci correction of the upward impulse from January.
The breakout of this support zone should accelerate the active downward impulse wave 3 of the intermediate impulse wave (1) from the end of January.
Given the strongly bullish USD sentiment seen across the currency markets on the safe-haven inflows, EURUSD currency pair can then be expected to fall to the next support level 1.1600.
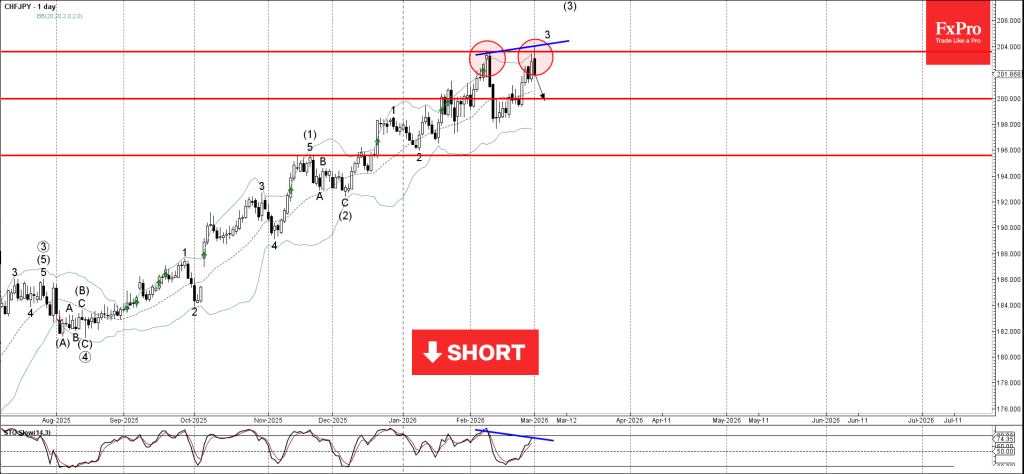
CHFJPY Wave Analysis
CHFJPY: ⬇️ Sell
- CHFJPY reversed from resistance zone
- Likely to fall to support level 200.00
CHFJPY currency pair recently reversed from the resistance zone between the strong resistance level 203.60 (which formed the daily Evening Star at the start of February) and the upper daily Bollinger Band.
The downward reversal from the resistance level 203.60 stopped the impulse wave 3 of the intermediate impulse wave (3) from the start of December.
Given the strength of the resistance level 203.60 and the bearish divergence on the daily Stochastic, CHFJPY currency pair can then be expected to fall to the next round support level 200.00.