Sample Category Title
Escalating Middle East Tensions Jolt Oil Markets
Oil markets have reacted swiftly to the latest escalation in Middle East tensions. At the time of writing, WTI crude prices have surged more than 5% to $70.50/bbl, marking the highest level since mid-June. Brent prices have moved up by a similar amount and are currently sitting at over $77/bbl. The Brent-WTI spread has been widening in recent weeks as market participants have been pricing in a higher risk premium amid escalating U.S.-Iran tensions. Currently, the spread sits at $6.5 – about twice as high as its historical average – but still below the spread reached in 2022 following Russia’s invasion of Ukraine.
Despite the sharp near-term move, price action has remained more contained than in some past geopolitical shocks, reflecting several structural features of today’s oil market. Markets broadly view current events as less disruptive than the onset of the 2022 Russia–Ukraine conflict. At that time, crude prices briefly surged to nearly $140/bbl amid sweeping sanctions, physical supply losses, and Europe’s abrupt energy cutoff from Russia. By contrast, today’s environment features more buffers: U.S. crude exports are near four million barrels per day (bpd), OPEC+ retains some spare capacity, and strategic reserves remain available. That said, the current episode is widely viewed as the most significant threat to Middle East energy supply in several years, and closer to a worst-case scenario from a supply risk standpoint relative to past regional conflicts.
A central focus for markets is the Strait of Hormuz, a critical chokepoint through which roughly 20% of global oil flows. It's also critical in shipping refined products, LNG, fertilizers, and key food inputs. Shipping companies have already begun rerouting vessels as a precaution, and while alternative pipelines in Saudi Arabia and the UAE could redirect an estimated 5 million/bpd, these routes are insufficient to fully offset a prolonged disruption. Even a short-lived closure would likely result in prices ratcheting higher with each day of interruption, while insurance and freight premiums could keep prices elevated even after physical flows resume.
Looking ahead, oil prices will be driven by how the conflict evolves, implying considerable uncertainty in the days ahead. As such, we sketch out three possible scenarios of how prices could evolve:
- Baseline Scenario (Contained Escalation): The baseline assumes some persistence over the next several weeks but without direct, sustained disruptions to major energy infrastructure or shipping lanes. Under this scenario, WTI prices average in the low $70s/bbl in the coming weeks, reflecting a moderate geopolitical risk premium and some physical supply impacts. Planned OPEC+ output increases in April and relatively weak global demand help to cap the upside and allow prices to drift a bit lower once tensions ease.
- Escalation (Material Supply Disruption): In an escalation scenario, risks to the Strait of Hormuz intensify, with shipping interruptions stranding up to 20 million/bpd for a sustained period. WTI prices could rise toward $80–$100/bbl, potentially exceeding $100 temporarily if disruptions are prolonged. Spillovers to refined products and global gas markets would amplify inflationary pressures. The duration of this scenario could extend for several months, depending on the persistence of asymmetric attacks and broader regional instability.
- De-escalation (Rapid Resolution): In a de-escalation scenario, swift military action limits further retaliation and avoids major infrastructure damage. In this case, oil prices could peak quickly at current levels and retrace much of their recent gains, with WTI falling back toward $60/bbl within a couple of weeks. However, even here, some residual risk premium may persist above historical norms given heightened uncertainty around Iran’s longer-term posture.
Macro Implications
From a macroeconomic perspective, higher oil prices pose some upside to the inflation outlook and a headwind to economic growth, but only if they’re sustained. So far, our mark-to-market on oil prices has barely moved the needle from a growth standpoint and has added no more than a tick or two to headline inflation metrics.
However, should oil prices continue to push higher – as suggested under the “Escalation Scenario” – the growth impacts could become visible. A rule of thumb is that every $10 increase in WTI subtracts roughly 0.1 percentage points from U.S. real GDP growth. This would imply a potential drag of 0.2-0.4 percentage points. The inflation impacts would be more notable, potentially adding as much as three-quarters of a percentage point to the 2026 annual average. However, the secondary effects to core measures of inflation would be considerably smaller given the temporary nature of the shock. This suggests no meaningful shift in monetary policy as central banks look through the temporary price effects.
For Canada, higher near‑term oil prices, combined with a stronger U.S. dollar amid elevated global risk aversion, would support cash flows for Canadian producers, partially offsetting broader growth headwinds. Still, with weaker U.S. demand, reduced consumer purchasing power and heightened global uncertainty, the net macroeconomic impact of a prolonged escalation scenario would likely be negative, despite gains in the energy sector.
Canada nonetheless remains a stable and strategically important global energy producer, with the oil patch already positioned for modest improvement this year. Capital spending was expected to rebound by roughly $1.5 billion, following a $1.6 billion contraction in 2025. A sustained increase in oil prices would tilt risks to the upside for investment, though structural constraints and elevated uncertainty may limit the scale of the response.
War Begins, Wall Street Unfazed (for Now!) – Dow Jones and US Stocks Outlook
- US Stock Benchmarks gapped lower at the open but have bounced higher significantly since.
- Investor sentiment remains elevated despite the new beginning of a rough conflict in the Middle East.
- Exploring Technical Levels for the Dow Jones, Nasdaq and S&P 500.
Stock Markets have eased significantly during the Asian and European sessions, but it seems that US Markets are remaining unfazed.
Gapping lower by 1.50% across all benchmarks, Stocks are now rallying back, now close to unchanged, and essentially filling the gaps.
J.P. Morgan issued a buy-the-dips recommendation, which undoubtedly helped risk sentiment ease, but US stocks remain at key inflection points.
What is surprising is also seeing US Treasuries sell off (10Y Yield back above 4.00%) despite ongoing intense exchanges in the Middle East – Bitcoin and Cryptocurrencies are also exploding higher as we speak.
Markets were trading at the lows of their ranges, which could also have helped the rebound.
I invite you to check out Morning reactions and a detailed resume of the events right here.
Keep a close eye on sentiment throughout the week, as economic damage from the war is still far from reflected. The Strait of Hormuz and a potential closure there could be hurting sentiment more consistently throughout the week.
Let's explore the key levels for weekly action by diving into today’s session charts and key trading levels for the major US indices: the Dow Jones, Nasdaq, and S&P 500.
Current Session's Stock Heatmap
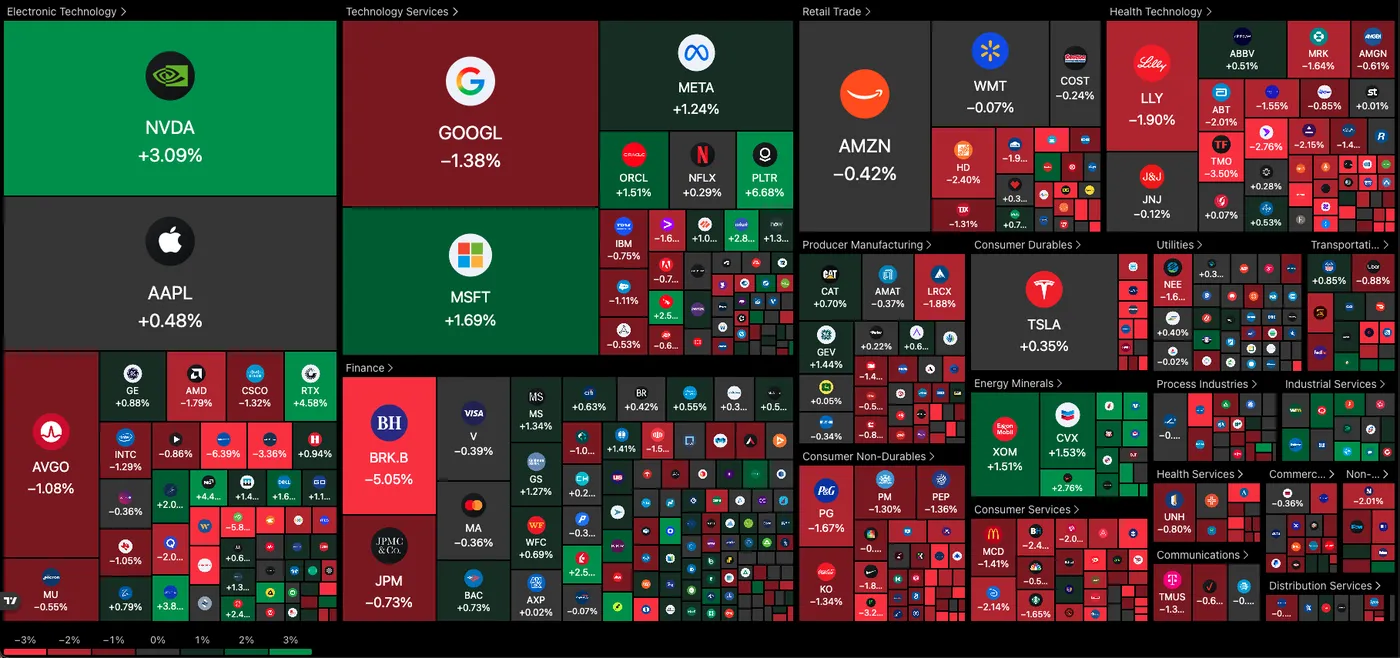
Current picture for the Stock Market (11:56 A.M. ET) – Source: TradingView – March 2, 2026
Despite the rebound around US Benchmarks, individual equities are sending a mixed picture.
Nvidia, Microsoft, Meta and Energy stocks are dominating the action.
Dow Jones 1H Chart and Trading Levels
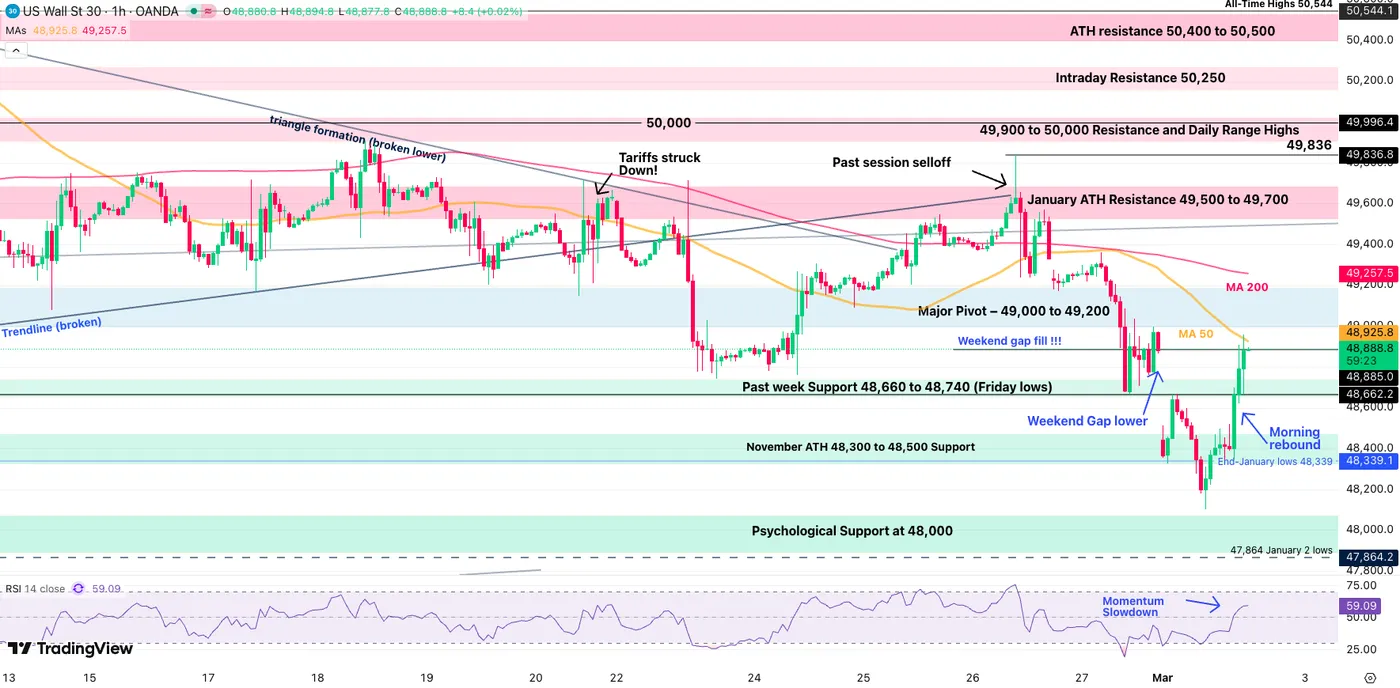
Dow Jones (CFD) 1H Chart – March 2, 2026 – Source: TradingView
Dow Jones rebounded significantly from its 48,103 overnight futures lows, and is now facing a significant test at its Gap-fill level and 50-Hour MA (48,925 – Morning Highs).
- Closing above on the session would imply a buy-the-dip flows over War flows – Odds for this could be compromised if news worsen.
- Rejecting the 50-Hour MA (immediate test) could lead to further downside in US Indexes – Doing so could see a test of the overnight lows.
Dow Jones technical levels for trading:
Resistance Levels
- Key 1H MA 48,925 – Current rejection & Morning highs
- 200-Hour MA 49,270
- January ATH Resistance 49,500 to 49,700
- 49,900 to 50,000 Resistance (Range Highs)
- Index All-Time highs 50,512
Support Levels
- Past week Support 48,660 to 48,740 (Friday lows)
- November ATH 48,300 to 48,500 Minor Support
- Overnight futures lows 48,103
- Key Support from 47,500 to 48,000 (Next main Support)
- 45,000 psychological level (Main Support on higher timeframe)
Nasdaq 1H Chart and Trading Levels
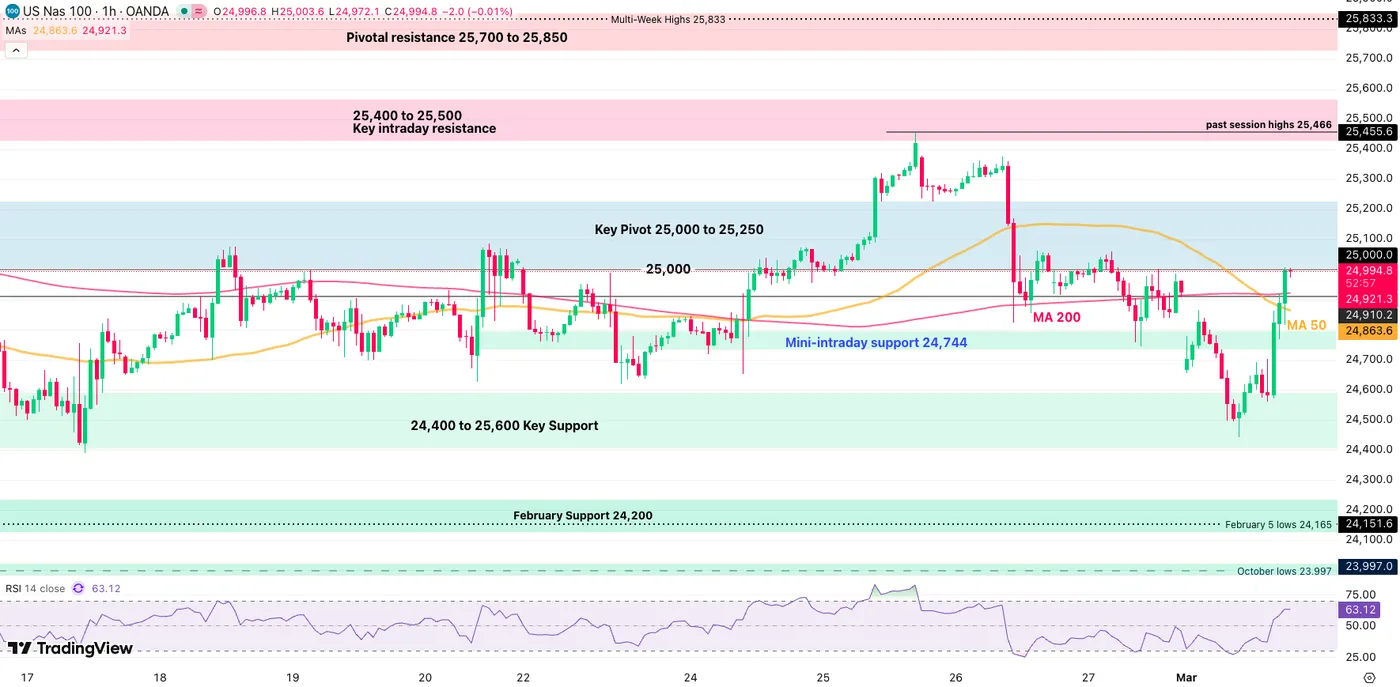
Nasdaq (CFD) 1H Chart – March 2, 2026 – Source: TradingView
Nasdaq breached back above its 50-Hour MA but is less responsive than the DJIA to the indicator.
The level to watch is being tested as we speak: 25,000.
- Closing above on the session would see further dip-buying, like in the DJIA.
- Rejecting here however could see a quick test of the 24,441 overnight lows.
Nasdaq technical levels of interest:
Resistance Levels
- Key Pivot 25,000 to 25,250 (Immediate rejection!)
- 25,400 to 25,500 Intraday resistance
- All-time high resistance zone 26,100 to 26,300
Support Levels
- Mini-intraday support 24,744 (bearish below)
- 24,400 to 25,600 Key Support (Range Support)
- 24,441 Overnight lows
- February Support 24,150 to 24,200
- October - November Support 23,800 to 24,000
- Early 2025 ATH at 22,000 to 22,229 Support
S&P 500 1H Chart and Trading Levels
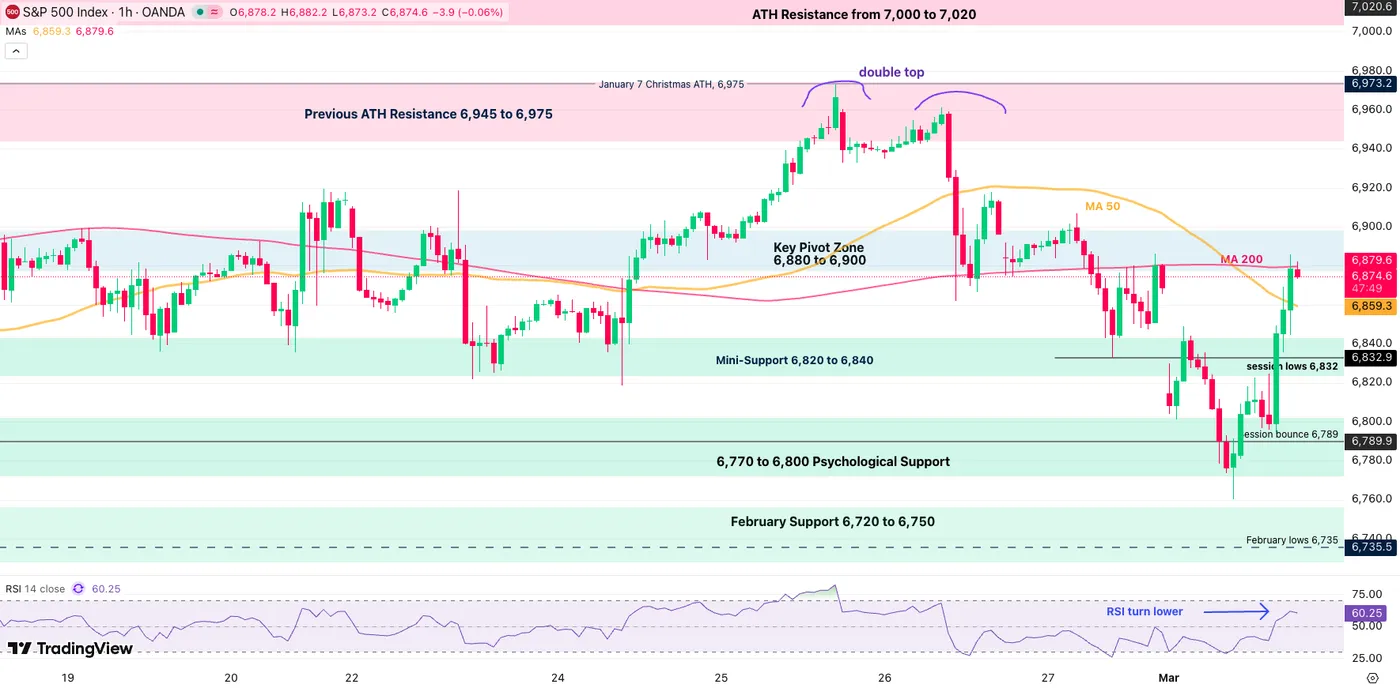
S&P 500 (CFD) 1H Chart – March 2, 2026 – Source: TradingView
The S&P 500 is facing almost similar conditions as the Dow. After running higher in the morning session, bulls will be facing a key test at the 200-Hour MA (6,874).
- Trading and closing above would point to 7,000.
- Below would point to a test of the 6,760 overnight lows.
S&P 500 technical levels of interest:
Resistance Levels
- Morning highs and 200-Hour MA (6,874)
- Key Pivot Zone 6,880 to 6,900
- Previous ATH minor Resistance 6,945 to 6,975
- Current ATH 7,020
- All-time High Resistance 7,000 to 7,020 (range highs)
Support Levels
- Mini-Support 6,830 to 6,850
- 6,800 Psychological Support
- Overnight lows 6,760
- February lows 6,730 (Higher timeframe range lows)
- 6,400 Major psychological support
Safe Trades and keep a close eye on the US-Iran developments!
Geopolitics and Crude: Why WTI Pulled Back Despite Escalating Middle East Risks
- WTI crude oil pulled back from $75/barrel highs, with markets seemingly content that the geopolitical risk premium is priced in.
- The Middle East conflict has surged natural gas prices (due to the Qatar LNG halt), boosted shipping/energy stocks, but weighed on airline stocks.
- Key WTI technical levels to watch are resistance at $71.38 and support at $67.00.
Oil prices have pulled back significantly from the daily highs printed in the Asian session, with WTI reaching a peak around the $75/barrel mark.
The question for some though, are markets pricing enough of a premium given the geopolitics in the Middle East and potential supply disruptions if the conflict continues? Some say no while others are more optimistic.
Oil prices may not have moved as much as some have predicted, but the Middle East conflict is having an impact on a wide range of assets and markets.
Market impact of the Middle East conflict and Oil price rise
The escalating conflict has paralyzed energy production and shipping throughout the Middle East, most notably in the Strait of Hormuz, which facilitates approximately one-fifth of the world’s oil supply.
In a significant move, Qatar suspended all liquefied natural gas (LNG) production at its major facilities, including Ras Laffan, following drone attacks. Because Qatar accounts for roughly 20% of the global LNG market, this halt has triggered a massive surge in natural gas prices, with European benchmarks jumping as much as 50% in a single day.
Global energy equities have surged in response to the supply shock and the 8% spike in crude oil prices. Major players like Exxon Mobil and Shell saw notable gains, with Exxon's share price rising over 4% in early trading. Domestic natural gas firms in the US also benefited from the tightening global market; shares of CNX Resources and Williams Companies each rose by more than 1%, while the United States Natural Gas Fund (UNG) climbed 3.7%.
The aviation and travel sectors faced significant headwinds as the closure of major Middle Eastern hubs triggered a sharp sell-off in airline stocks. Shares of Ryanair, IAG, American Airlines, and United Airlines all retreated, reflected by a nearly 3% drop in the S&P 1500 Passenger Airlines index. This downturn was compounded by the surge in crude oil prices, which typically signals a spike in jet fuel costs—historically one of the industry's heaviest operating expenses.
In contrast, shipping and tanker companies saw their valuations climb as the conflict disrupted vital maritime arteries like the Suez Canal and the Strait of Hormuz. These bottlenecks have tightened global shipping capacity, fueling expectations for significantly higher freight rates. European giants Maersk and Hapag-Lloyd saw their shares jump 7.8% and 6.7%, respectively, while US-based Nordic American Tankers rose over 3%.
Other key players in the sector, including Teekay Tankers and International Seaways, also posted gains as the market braced for a prolonged period of logistical constraints.
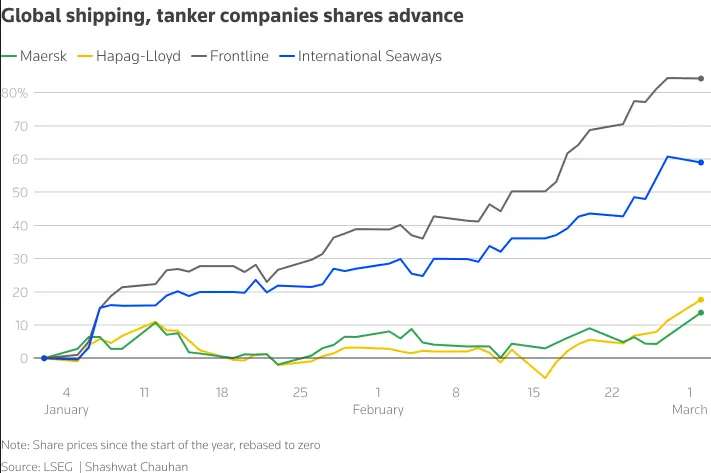
Source: LSEG
Forward Outlook - What next for energy markets?
The geopolitical situation in the Middle East remains volatile, with the threat of Iranian retaliation against neighboring Gulf states heightening risks to global energy supplies and leaving the door open for further escalation.
While the Strait of Hormuz has not been officially closed by Iranian forces, the commercial impact is already severe; insurers are canceling coverage and shipping premiums are skyrocketing, forcing vessels to either pause transits or seek costly detours.
These disruptions extend beyond maritime trade, as the closure of Gulf airspace is currently severing vital aviation corridors between Europe and Asia. Furthermore, the potential reactivation of Houthi rebels in the Red Sea threatens to shut down the primary alternative routes that previously mitigated Hormuz-related tensions.In the event of a prolonged conflict, the global economy faces a "perfect storm" of compounding pressures.
The synergy of surging energy costs, logistical breakdowns, and a widespread shock to investor confidence poses a significant threat to global trade volumes. This instability arrives at an especially precarious moment, as the world economy is still struggling to absorb the inflationary and growth-stifling effects of recent tariff shocks.
Ultimately, the timing of this crisis could not be worse, potentially stalling a global recovery that was already on shaky ground.
WTI Crude Oil Four-Hour Chart, March 2, 2026
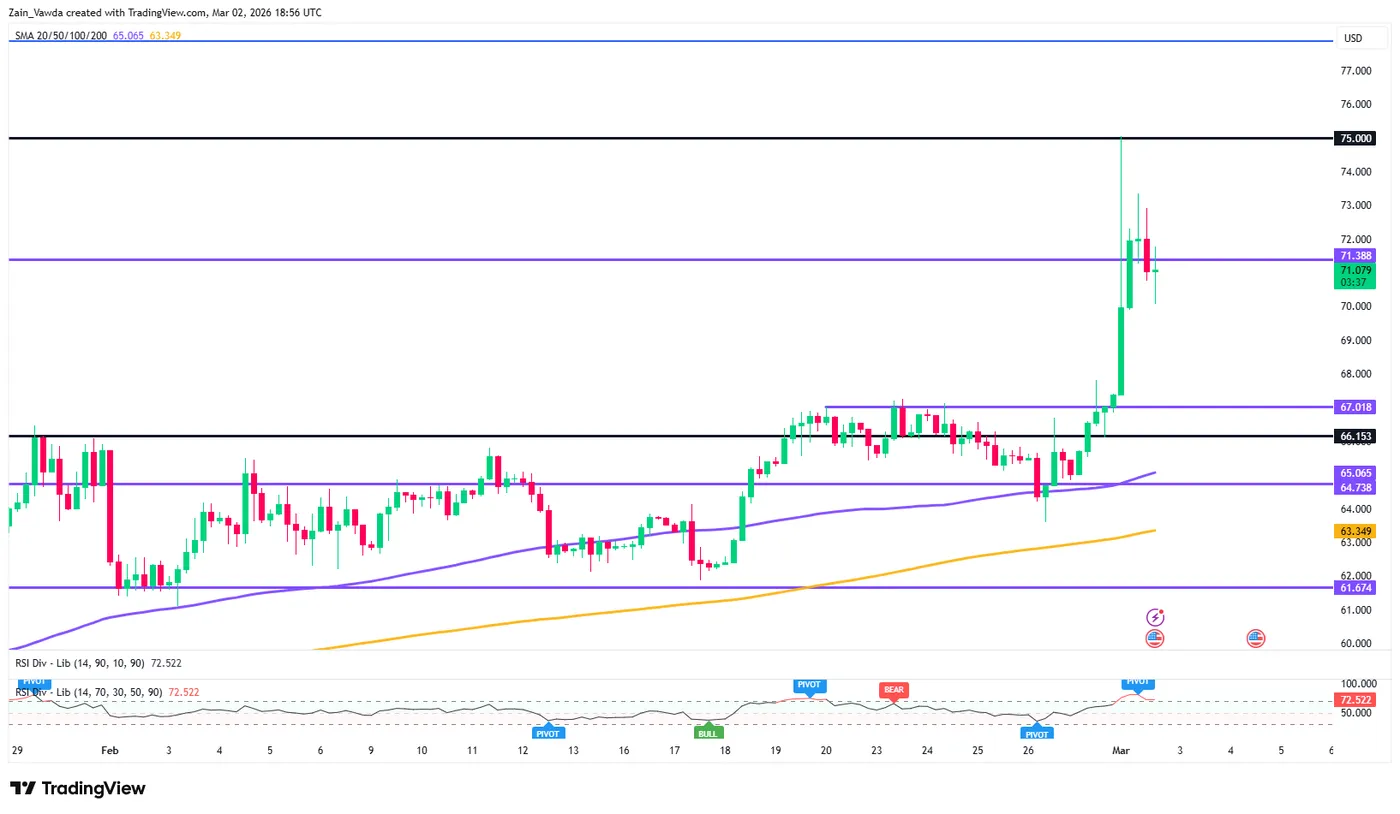
Source: TradingView (click to enlarge)
Looking at the four-hour WTI chart above and you can see the massive spike last night at the open.
Oil prices have since failed to surpass the 73.35 handle as markets appear content that enough risk premium has already been priced in.
Support rests some distance away, around the 67.00 handle.
If oil prices remain below the 71.38 resistance level, a return to the 67.00 breakout level cannot be ruled out.
A four-hour candle close back above the 71.38 handle could open up a retest of Sunday evenings highs at the 75.00 a barrel mark.
For now though, staying nimble appears to be the best option as market sentiment can shift in a second.
Keep an eye on developments in the Middle East as well as comments from the Trump administration in the US.
Key levels to keep an eye on
Support:
- 67.00
- 66.15
- 65.00 (100-day MA)
Resistance:
- 71.38
- 73.35
- 75.00
Eco Data 3/3/26
| GMT | Ccy | Events | Act | Cons | Prev | Rev |
|---|---|---|---|---|---|---|
| 21:45 | NZD | Building Permits Jan | 1.90% | -4.60% | -4.50% | |
| 23:30 | JPY | Unemployment Rate Jan | 2.70% | 2.60% | 2.60% | |
| 23:50 | JPY | Capital Spending Q4 | 6.50% | 3.00% | 2.90% | |
| 23:50 | JPY | Monetary Base Y/Y Feb | -10.60% | -10.20% | -9.50% | |
| 00:01 | GBP | BRC Shop Price Index Y/Y Feb | 1.10% | 1.20% | 1.50% | |
| 00:30 | AUD | Current Account (AUD) Q4 | -21.1B | -16.3B | -16.6B | -18.3B |
| 00:30 | AUD | Building Permits M/M Jan | -7.20% | 5.60% | -14.90% | |
| 10:00 | EUR | Eurozone CPI Y/Y Feb P | 1.90% | 1.70% | 1.70% | |
| 10:00 | EUR | Eurozone Core CPI Y/Y Feb P | 2.40% | 2.20% | 2.20% |
| 21:45 | NZD |
| Building Permits Jan | |
| Actual | 1.90% |
| Consensus | |
| Previous | -4.60% |
| Revised | -4.50% |
| 23:30 | JPY |
| Unemployment Rate Jan | |
| Actual | 2.70% |
| Consensus | 2.60% |
| Previous | 2.60% |
| 23:50 | JPY |
| Capital Spending Q4 | |
| Actual | 6.50% |
| Consensus | 3.00% |
| Previous | 2.90% |
| 23:50 | JPY |
| Monetary Base Y/Y Feb | |
| Actual | -10.60% |
| Consensus | -10.20% |
| Previous | -9.50% |
| 00:01 | GBP |
| BRC Shop Price Index Y/Y Feb | |
| Actual | 1.10% |
| Consensus | 1.20% |
| Previous | 1.50% |
| 00:30 | AUD |
| Current Account (AUD) Q4 | |
| Actual | -21.1B |
| Consensus | -16.3B |
| Previous | -16.6B |
| Revised | -18.3B |
| 00:30 | AUD |
| Building Permits M/M Jan | |
| Actual | -7.20% |
| Consensus | 5.60% |
| Previous | -14.90% |
| 10:00 | EUR |
| Eurozone CPI Y/Y Feb P | |
| Actual | 1.90% |
| Consensus | 1.70% |
| Previous | 1.70% |
| 10:00 | EUR |
| Eurozone Core CPI Y/Y Feb P | |
| Actual | 2.40% |
| Consensus | 2.20% |
| Previous | 2.20% |
The Conflict with Iran: FAQ with the Team
This is obviously a very fluid situation and as the facts on the ground evolve so too will the economic impact. As a framing, just bear in mind that, absent a prolonged war and major long-term disruptions to key shipping routes in the Strait of Hormuz, the impact on U.S. economic growth, inflation and monetary policy should remain modest. Of course, the opposite also could be true.
Our model simulations of 10% and 30% sustained increases in oil prices do not come close to generating a U.S. recession or markedly changing the trajectory for core inflation. Headline inflation does move higher via higher energy prices for the consumer, but the drag on real consumer spending and thus economic growth is muted in these scenarios (0.1-0.2 percentage points for the year).
Central banks typically look through oil-driven inflation shocks, and we expect this time to be similar. We expect the FOMC to take the long view, and the weekend's events probably will not have a major impact on the Federal Reserve's reaction function. Our forecast for 50 bps of rate cuts this year remains unchanged. Similarly, we are not making any changes to our G10 or EM central bank forecasts at this time. In the very near term, we expect central banks around the world to remain in wait-and-see mode as they await additional clarity on the geopolitical situation.
Below, the Team responds FAQ style to some of the most common questions we have received in the past 72 hours on this topic:
What happens to U.S. inflation in the wake of an oil-price shock?
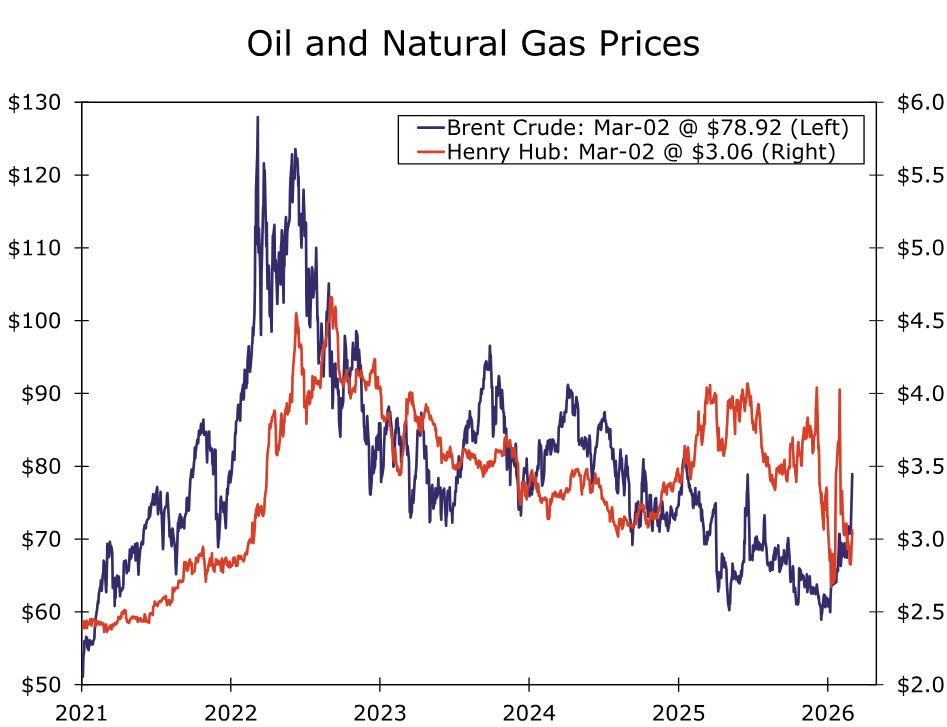
- Oil prices were already moving up over the past couple of weeks in anticipation of potential escalation, but the price of Brent crude has risen $7 since the U.S. strikes, or about 14% above its February average. Henry Hub natural gas prices are also up 6% in the wake of the strikes (Figure 1). Higher oil prices would need to persist to meaningfully impact the U.S. economy, as a sharp spike followed by a rapid normalization would not have much of an impact.
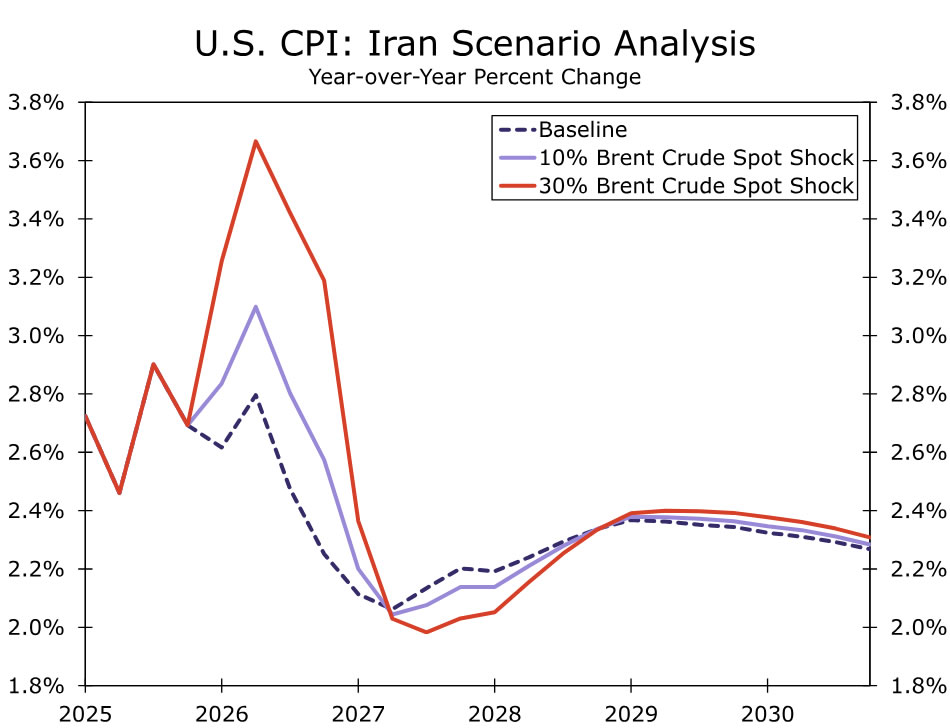
- To assess the potential U.S. macro impact from the military escalation, we run two scenarios: (1) a sustained 10% rise in Brent oil prices from a baseline expectation of around $65/barrel on average in Q1, and (2) a larger, sustained 30% rise in oil prices, which is closer to the spike that occurred immediately following Russia's invasion of Ukraine in early 2022.
- A 10% sustained rise in oil prices would add roughly 0.3 percentage point to the year-over-year rate of headline consumer price inflation in the second and third quarter of this year, whereas a 30% rise would lift the one-year change closer to a full percentage point (Figure 2). The impact on core inflation would be much more modest (a few tenths with a 30% rise in oil prices) but not zero. This upward pressure on oil prices would reverse what has been one notable tailwind for disinflation and consumer spending over the past year; since last January, energy goods prices are down 7.3% compared to the 2.4% increase in headline CPI.
What does history say about consumer confidence sensitivity to energy spikes?
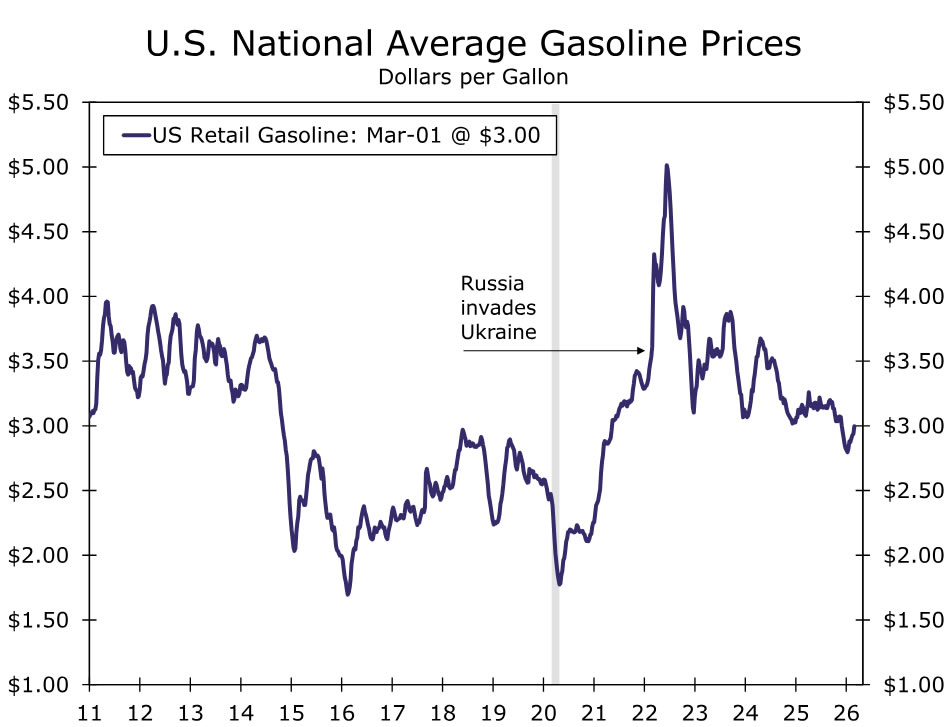
- U.S. consumer confidence tends to correlate more strongly with jobs and inflation than foreign conflict headlines. Of course, foreign conflict and inflation can also go hand in hand. That makes retail energy prices (mostly gasoline) the most important consideration for many households as it relates to this conflict. The average national price at the pump currently sits around $3/gallon. In the immediate wake of Russia's invasion of Ukraine in February 2022, the average price initially jumped and remained elevated for around four months before receding (Figure 3). In the end, the fate of pump prices and the consumer's reaction function will be dictated largely by any prolonged disruptions in the Strait of Hormuz.
How big of a hit could we expect an oil-price shock to have on U.S. economic growth?
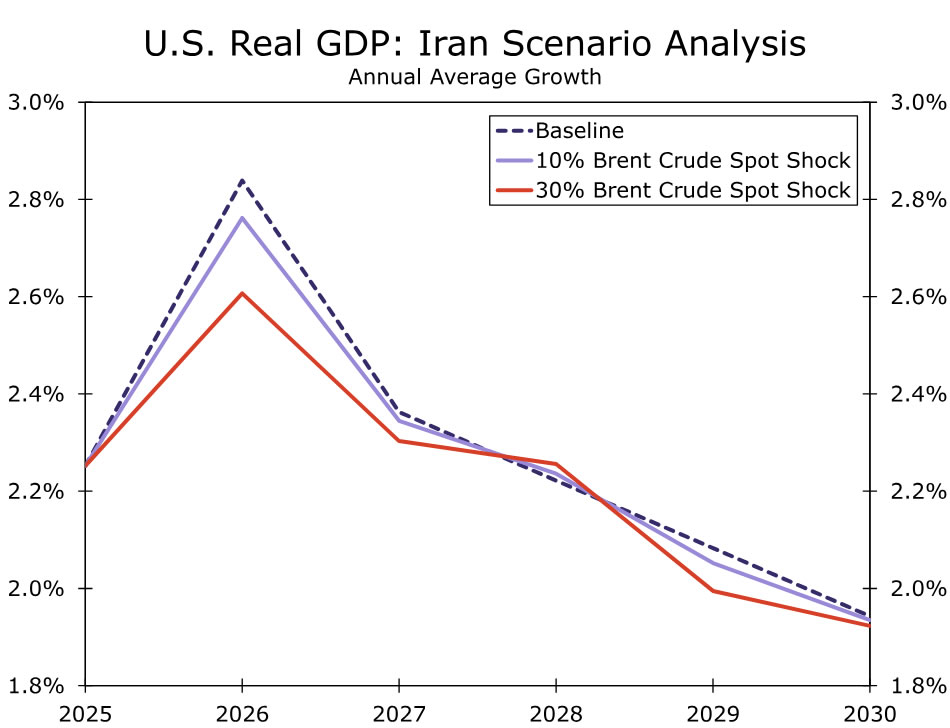
- Our model simulations suggest a 10% rise in oil prices would dampen average annual U.S. GDP growth by a very modest 0.08 percentage points (pp) this year (Figure 4), primarily through lower consumer spending with a 0.15pp reduction in real personal consumption expenditures growth. Business fixed investment spending actually rises modestly in this scenario, likely due to higher oil prices spurring some additional investment in domestic oil and gas production, which happened in the wake of Russia's invasion of Ukraine. Even in the 30% price-shock scenario, the hit to real GDP growth this year is only 0.23pp. It takes very large and persistent gas price increases to meaningfully restrain household consumption.
Will a surge in commodity prices slow the U.S. tech build out?
- A temporary spike in oil and gas prices will pressure input costs but not meaningfully limit the pace of new data center construction. Higher energy commodity prices will likely flow through to building material and freight costs, representing a modest headwind to new development. Operationally, data centers are increasingly powered by natural gas, and while higher global LNG prices could have modest short-run negative cost implications, we generally do not see increased energy prices as a major limitation on new construction.
- The tech buildout relies on other trade routes. The Straight of Hormuz is a key energy chokepoint, but high-tech trade flows are minimal with the Straight of Malacca serving as the primary passage for global electronics, advanced chips, critical minerals and other inputs predominantly sourced from Asia. For the U.S., tech shipments from Asia are straight-shotted to West Coast ports or routed through the Panama Canal. So long as supply disruptions are contained to Hormuz, the negative effects on high-tech capex should be limited.
How will the Fed react to the conflict?
- The weekend's events probably will not have a major impact on the Federal Reserve's reaction function. A jump in oil prices would generate higher headline inflation, but this would be driven by a supply shock rather than overly hot aggregate demand. Accordingly, tighter monetary policy would do little to mitigate the hotter inflation and instead would further compound the hit to economic growth. In short, a supply-driven oil price shock is a classic example of something most FOMC officials will attempt to "look through."
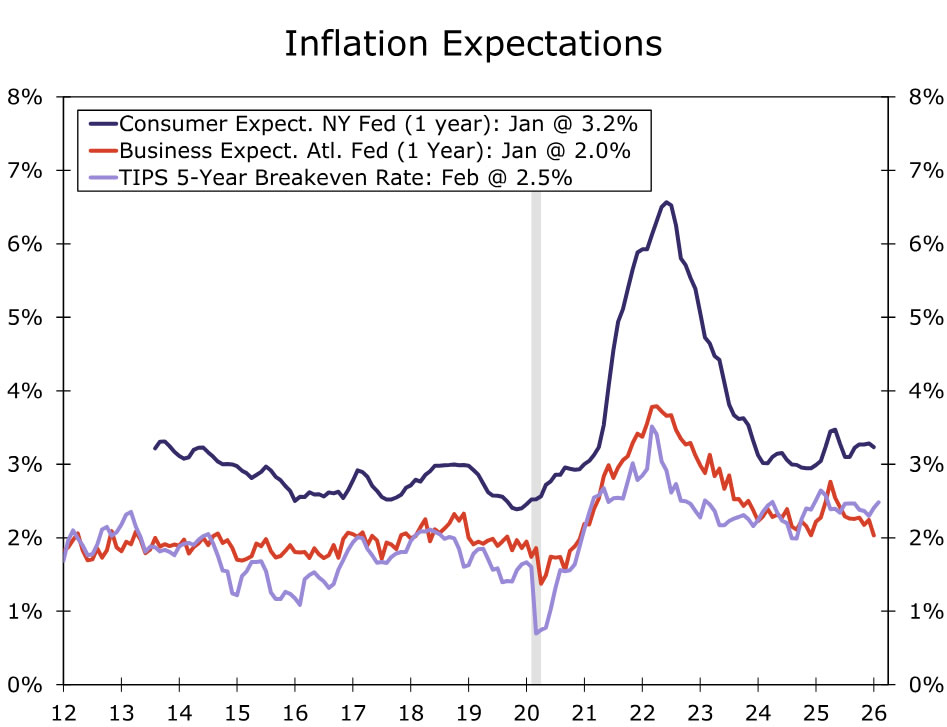
- Key will be the behavior of inflation expectations. The Fed will likely be sensitive to any notable deviations from what have been well-behaved inflation expectations. But again, any unanchoring here would stem from prolonged conflict and persistently higher energy prices. If higher prices in the short-run start to lead to higher expected inflation in the future, the inflationary shock can become more persistent. In 2021-2022, inflation expectations rose abruptly across a broad range of measures, causing the FOMC concern that the higher inflation of the time may not prove to be transitory (Figure 5).
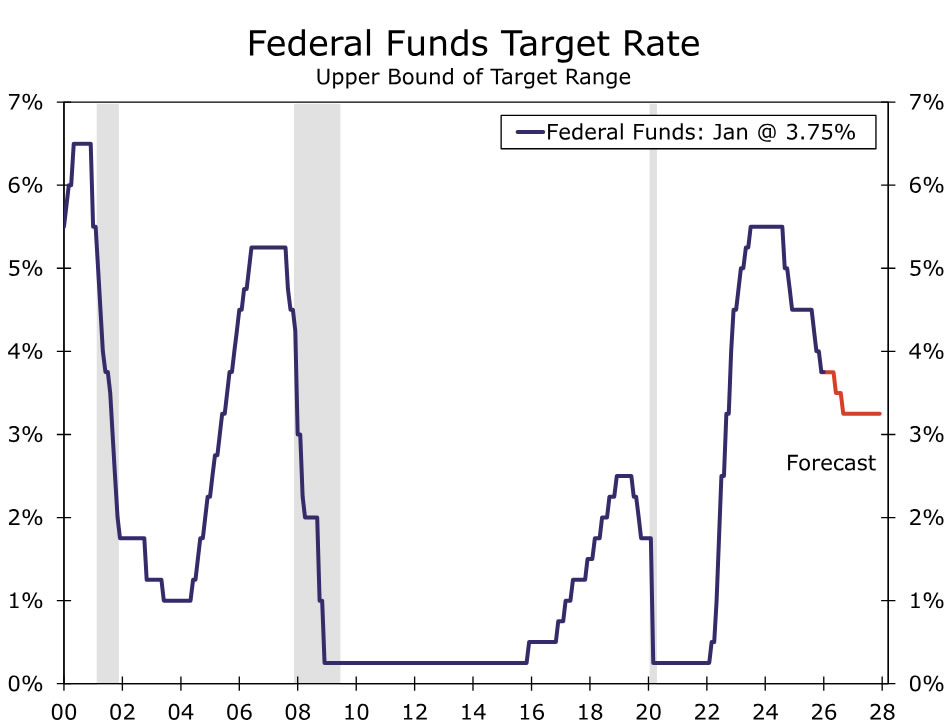
Could more Fed easing be coming?
- We doubt more easing will be forthcoming than our base case projection of 50 bps (Figure 6). We expect the impact on the U.S. economy from the conflict to be modest, and we think the FOMC will take the long view on this rather than knee-jerk react in a foggy environment. While we suspect the FOMC will want to "look through" higher inflation from a jump in energy prices, they also may be wary about adopting accommodative monetary policy given the past five years (and counting) of above-target inflation. In the very near term, we expect the FOMC to remain in wait-and-see mode as they seek additional clarity on the geopolitical situation.
How will foreign central banks respond?
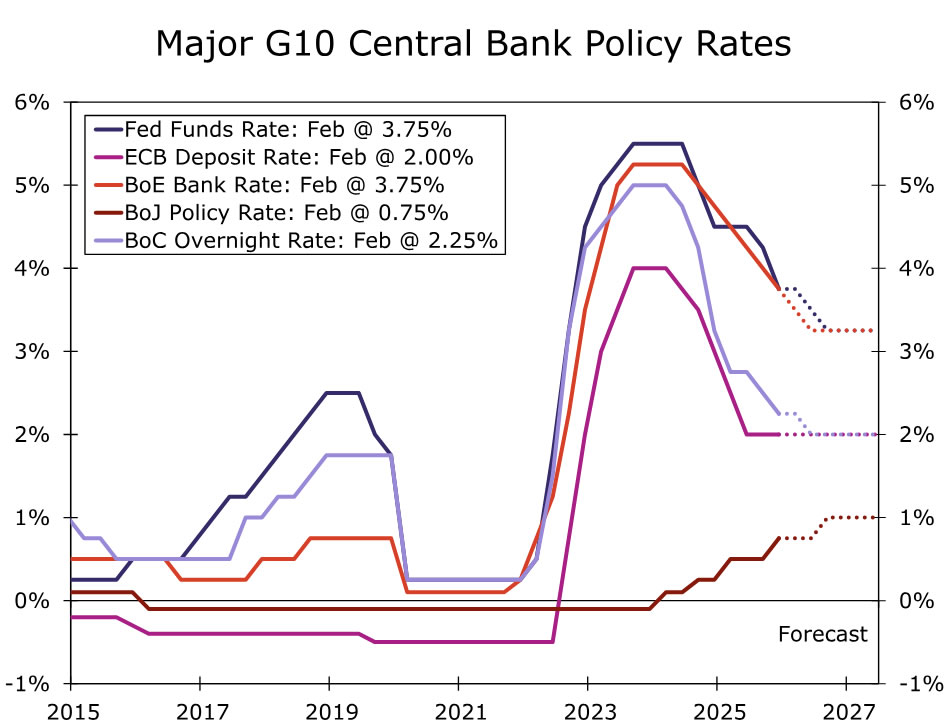
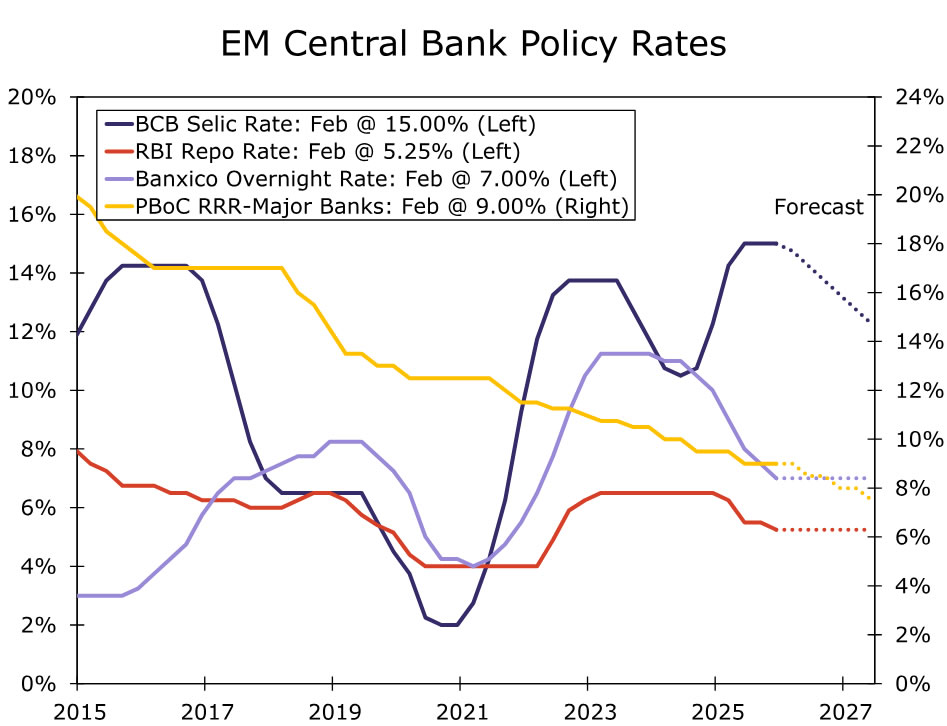
- Under our assumption that renewed military confrontation in the Middle East proves to be a temporary shock, international central banks are unlikely to adjust monetary policy paths all too materially. Similar to how we are thinking about the Fed, foreign central bank policymakers are likely to view the rise in oil and broader energy prices as a supply shock rather than a sharp upswing in demand. In that sense, pre-conflict guidance on rates is likely to remain in effect, and we are not making adjustments to our G10 (Figure 7) nor EM (Figure 8) central bank policy rate forecasts. At the same time, central banks will weigh the increase of geopolitical uncertainty on investor sentiment adding to existing downside risks to growth from trade and policy uncertainty. As such, absent a more sustained disruption from the Middle East, we see greater asymmetry of global central banks to ease policy.
- For advanced economy central banks where we forecast rate cuts prior to renewed conflict in the Middle East (e.g., Bank of Canada and Bank of England), our conviction in those calls is stronger, and we believe the balance of risk is now tilted toward more BoC and BoE easing than we currently forecast. Central banks where we felt the pre-conflict balance of risk was asymmetrically tilted toward restarting easing cycles (e.g., European Central Bank) may now have new rationale to lower rates. And in Japan, we already hold a less hawkish view on Bank of Japan rates than market pricing, a place we remain comfortable.
- Emerging market economies are more exposed to events in the Middle East and have more exposure to two-sided risks, but under the assumption of only temporary market disruptions, we do not believe EM central bank preferences for rates are set to change. Oil price shocks can be more impactful in EMs as energy tends to account for a greater share of CPI baskets relative to advanced economies. But if energy price rises are temporary, a transitory disruption to disinflation trends can also be shrugged off by EM policymakers. Also, and while not unique to EMs, local currency depreciation and the subsequent pass-through to prices is more of a risk in EMs. For now, EM currencies are under only modest pressure, which for us, is not enough to generate less dovish or more hawkish postures from major EM central banks. Even in a scenario where EM FX depreciation is more intense or longer-lasting, EM currencies have rallied over the past 12–18 months. Baked in currency strength offers central banks a degree of flexibility to maintain easing biases, or at least not rush to communicate rate hikes, going forward.
Sunset Market Commentary
Markets
Energy is front and center to today’s market response following the Israeli-US bombings against Iran which killed several high-ranking officials including Supreme leader Khamenei. Bombings could last for weeks according to US President Trump as Iran fights back with attacks across the Middle East. One of those Iranian drone attacks targeted the world’s largest LNG export facility, prompting Qatar to shut down production. Gas prices were already trading 25% higher on the day, linked to the surge in oil prices, but they spiked to more than 50% above Friday’s closing levels after QatarEnergy confirmed the output suspension. In cutting its dependence on Russian gas, Europe made a huge shift towards the Middle East, exposing its energy-reliant economies once again. The European benchmark contract, the Dutch TTF future, currently trades at €45/MWh up from €32 at the end of last week. Brent crude changes hands around $80/b with traffic through the pivotal Straight of Hormuz grinding to a halt. Aramco also halted operations at Saudi Arabia’s largest oil refinery after a drone strike in the area. Interest rate markets learned their lesson from the energy crisis around four years ago. The additional inflationary impact (on top of current >2% levels) is something central bankers should be aware of instead of going with the “transitionary” talk. In the current inflation context, it outweighs potential second-round negative economic effects. While the Fed or the ECB obviously won’t immediately respond with a rate hike, money markets reposition towards a longer status quo in the US and by pricing out any remaining ECB rate cut bets. The likelihood of a March BoE rate cut similarly fell from 80% to 50%. The resulting market outcome is a bear flattening of yield curves. German yields add 5 bps (30-yr) to 8 bps (2-yr) at the time of writing. Daily changes in the US range between +5 bps (30-yr) and +7.5 bps (2-yr). The dollar gains the upper hand on FX markets, especially against currencies from energy-reliant (importing) nations. EUR/USD currently loses first support at 1.1743, testing the 1.17 big figure. The YtD low at 1.1573 is the next reference. USD/JPY tests the February high at 157.76, compared to a 156.05 close last Friday. Cable (GBP/USD) tested the YtD low at 1.3331. On a trade-weighted basis, the greenback (DXY) broke through 98 resistance to currently change hands around 98.50. The prospect of a longer and wider geopolitical conflict equally hurts overall risk sentiment with main European indices losing 2% to 3% while main US indices open up to 1% lower. The gold price initially rallied up to 2.5%, but fails to get over the $5400/ounce bar for now.
News & Views
The Czech manufacturing PMI showed operating conditions stabilizing in February. The headline index printed at exactly 50 up from 49.8. Production rose at the fastest pace in 4 years last month, but underlying data still indicated challenging demand conditions and cost considerations for manufacturers. Orders declined for the second consecutive month pointing to a less favourable sales environment and intense competition. Firms tried to better manage their cashflow by cutting employment and input buying again. Meanwhile, input costs continued to rise at a steep, albeit softer, pace. Greater operating expenses prompted firms to raise their selling prices at a sharper rate despite international competition (fastest pace in three years). The latter will capture the attention of the Czech National Bank as it ponders whether there is room for some (limited) further easing as headline inflation returned to/below the CNB target. The Czech 2-y yield today rises by 9 bps, but this mostly mirrors a global market repositioning. The koruna in a global risk-off context eased from EUR/CZK 24.24 to EUR/CZK 24.28.
The Hungarian manufacturing PMI rose from an upwardly revised 50 to 51.3. The index indicates modest growth in the industry, but remains below the historic average. New orders and production were reported higher. At the same time, the employment index remained in contraction territory. Purchase prices accelerated. Today’s PMI and a risk-off related decline of the forint (EUR/HUF 381 from 377) complicates the MNB’s approach of cautiously easing its monetary policy. The MNB last week cut its policy rate by 25 bps to 6.25%. The central bank indicated that this wasn’t the start of an easing cycle even as inflation dropped below the MNB target (2.1% in January). Financial stability remains an important topic for the MNB. The 2-y HUF swap rate jumps 11.5 bps (5.83%) today.
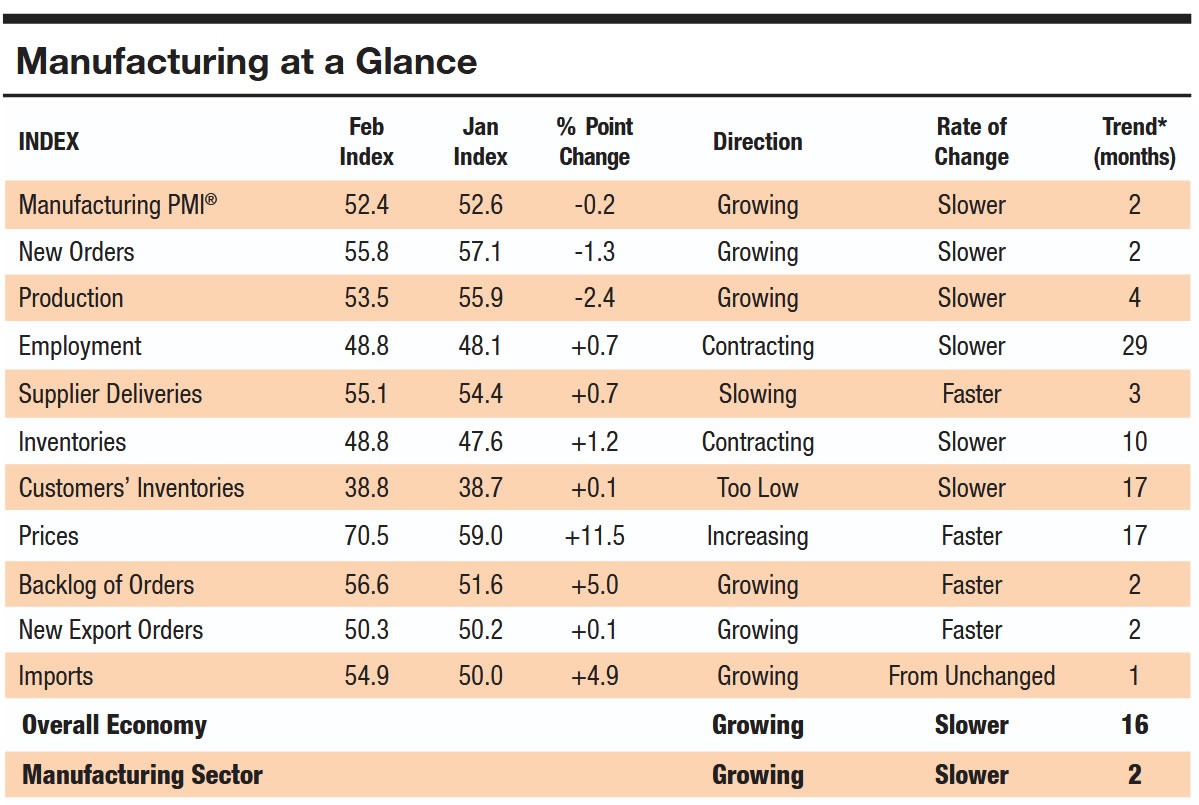
ISM manufacturing beats forecast, prices jump to highest since 2022
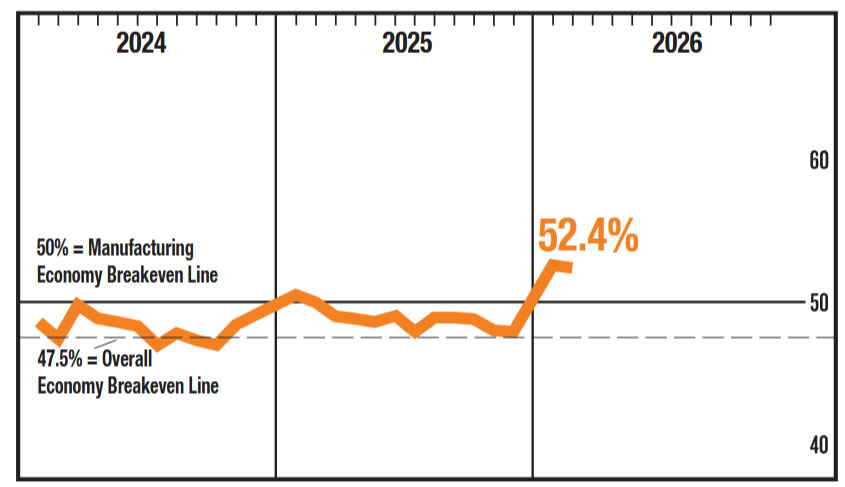
US ISM Manufacturing PMI edged down from 52.6 in January to 52.4 in February, but the reading remained comfortably above expectations of 51.9 and firmly in expansion territory. The data point to continued resilience in the factory sector, with activity still consistent with moderate economic growth.
The most striking development was the sharp surge in the Prices Index, which jumped from 59.0 to 70.5 — the highest level since June 2022. The move signals a renewed acceleration in input cost pressures and raises questions about the pace of disinflation in the goods sector, particularly as energy and supply risks intensify.
Underlying components showed some cooling in demand momentum. New orders declined from 57.1 to 55.8, while production eased from 55.9 to 53.5. Employment improved slightly from 48.1 to 48.8 but remained in contraction.
Importantly, only 1% of manufacturing GDP was in strong contraction territory (PMI at or below 45), down sharply from 12% in January. Historically, a PMI reading of 52.4 corresponds to roughly 1.7% annualized real GDP growth.
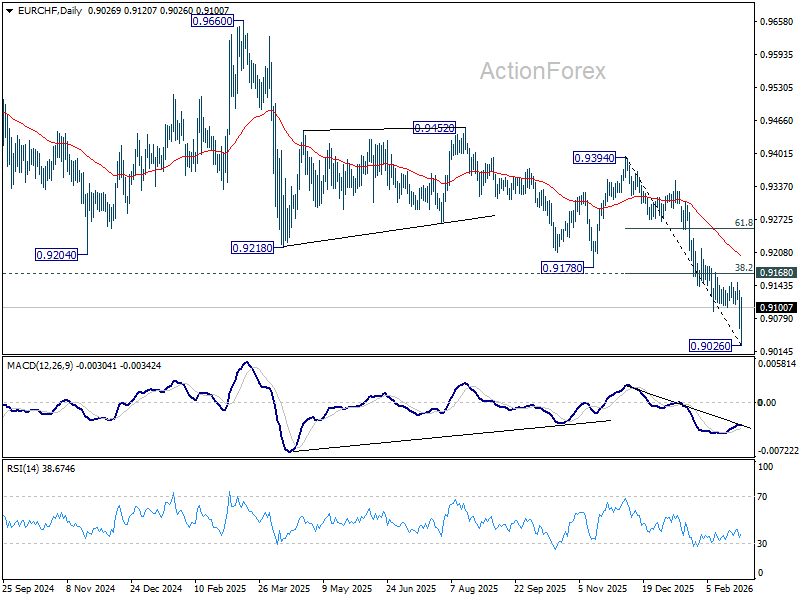
EUR/CHF Mid-Day Outlook
Daily Pivots: (S1) 0.9052; (P) 0.9097; (R1) 0.9133; More....
Intraday bias in EUR/CHF is turned neutral first with current rebound. Price actions from 0.9026 are viewed as a near term consolidation pattern only. Hence, upside should be limited by 0.9168 cluster resistance (38.2% retracement of 0.9394 to 0.9026 at 0.9167). Another fall below 0.9026 to resume the larger down trend is expected at a later stage. However, decisive break of 0.9167/8 will bring stronger rebound to 55 D EMA (now at 0.9199) and possibly above.
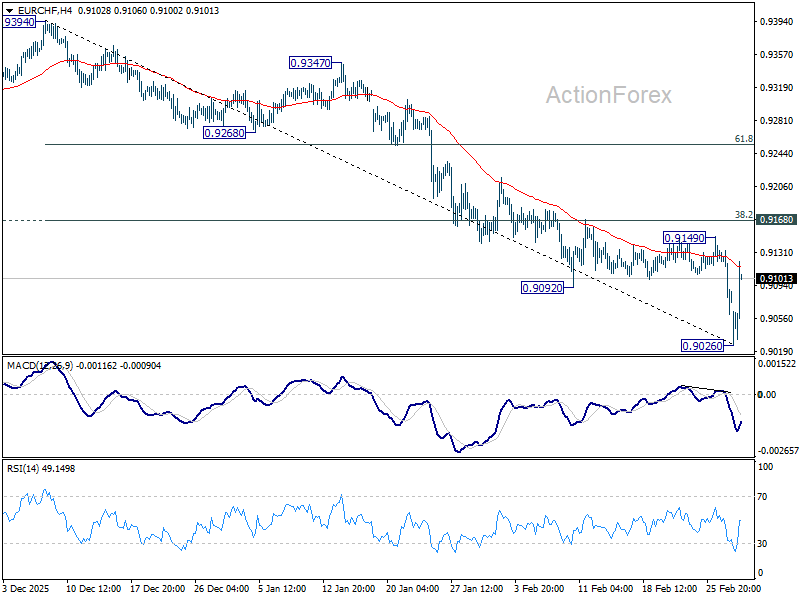
In the bigger picture, down trend from 0.9928 (2024 high) is still in progress. Next target is 61.8% projection of 1.1149 to 0.9407 from 0.9928 at 0.8851. Outlook will stay bearish as long as 0.9394 resistance holds, in case of rebound.
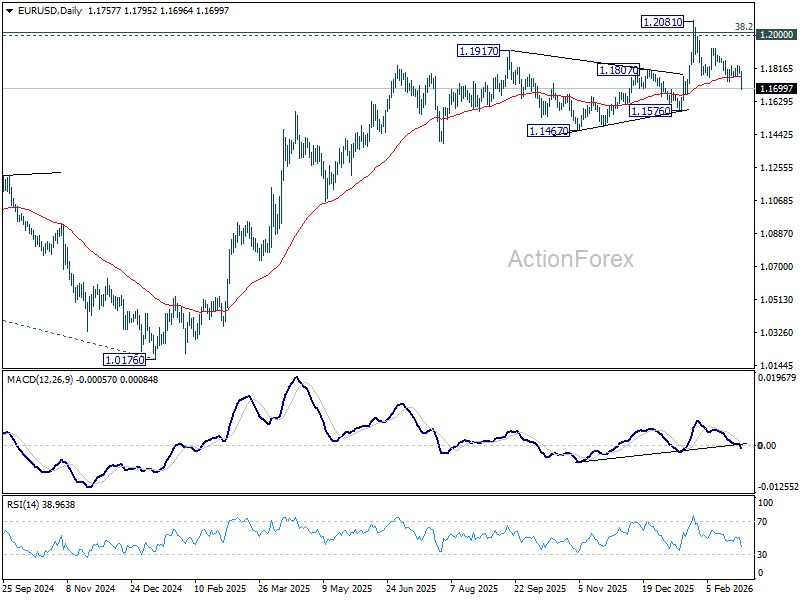
EUR/USD Mid-Day Outlook
Daily Pivots: (S1) 1.1796; (P) 1.1812; (R1) 1.1834; More….
Intraday bias in EUR/USD remains on the downside as fall from 12081 is in progress for 1.1576 structural support. Firm break there should confirm rejection by 1.2 key psychological level and turn near term outlook bearish. For now, risk will stay on the downside as long as 1.1826 resistance holds, in case of recovery.
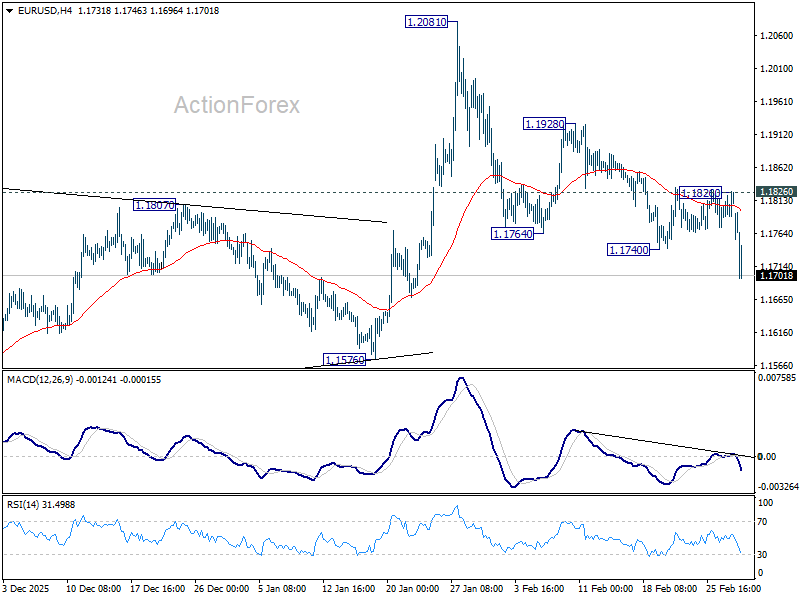
In the bigger picture, as long as 55 W EMA (now at 1.1494) holds, up trend from 0.9534 (2022 low) is still in favor to continue. Decisive break of 1.2 key psychological level will add to the case of long term bullish trend reversal. Next medium term target will be 138.2% projection of 0.9534 to 1.1274 from 1.0176 at 1.2581. However, sustained trading below 55 W EMA will argue that rise from 0.9534 has completed as a three wave corrective bounce, and keep long term outlook bearish.
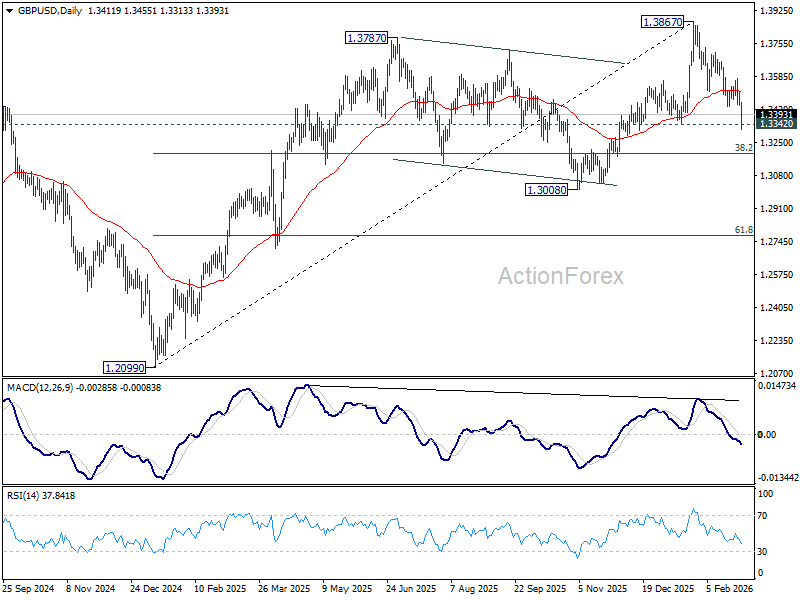
GBP/USD Mid-Day Outlook
Daily Pivots: (S1) 1.3449; (P) 1.3478; (R1) 1.3517; More...
Intraday bias in GBP/USD remains on the downside with focus on 1.3342 structural support. Decisive break there should confirm that fall from 1.3867 is already correcting the whole rise from 1.2099. In this case, deeper fall should be seen to 1.3008 support next. For now, risk will stay on the downside as long as 1.3574 resistance holds, in case of recovery.
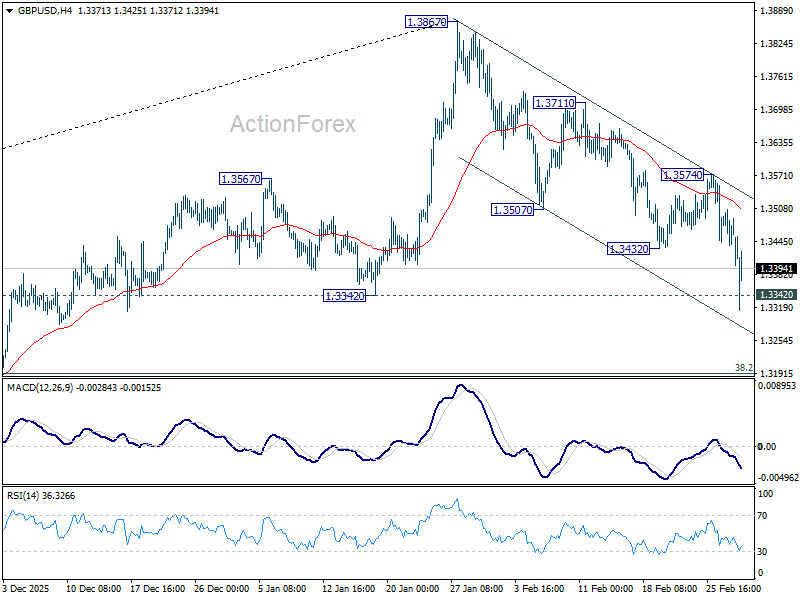
In the bigger picture, as long as 1.3008 support holds, rise from 1.3051 (2022 low) should still be in progress for 1.4284 key resistance (2021 high). Decisive break there will add to the case of long term bullish trend reversal. However, firm break of 1.3008 will raise the chance of medium term bearish reversal and target 1.2099 support next.