
Sample Category Title
GBP/JPY Daily Outlook
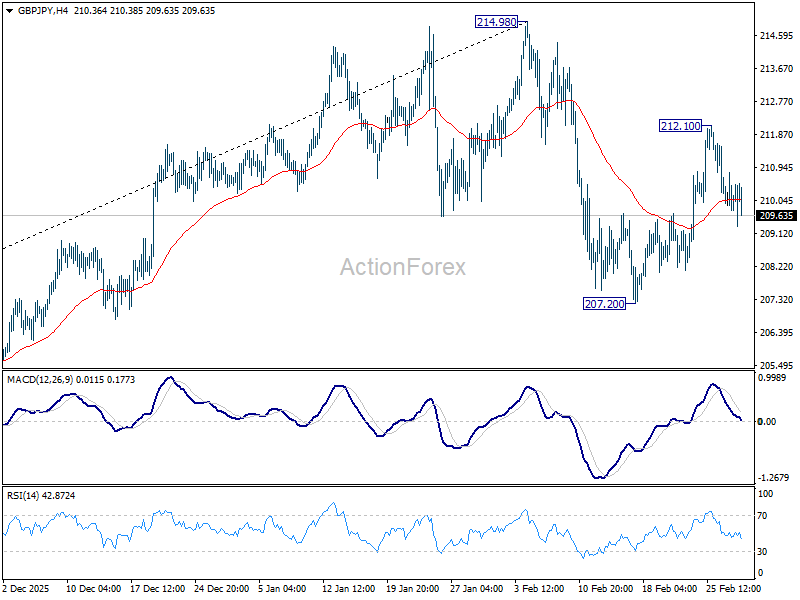
Daily Pivots: (S1) 209.92; (P) 210.38; (R1) 210.96; More...
Intraday bias in GBP/JPY stays neutral at this point. Corrective fall from 214.98 should have completed at 207.20 already. On the upside, above 212.10 will resume the rebound from 207.20 to retest 214.98 high. For now, risk will stay on the upside as long as 207.20 holds.
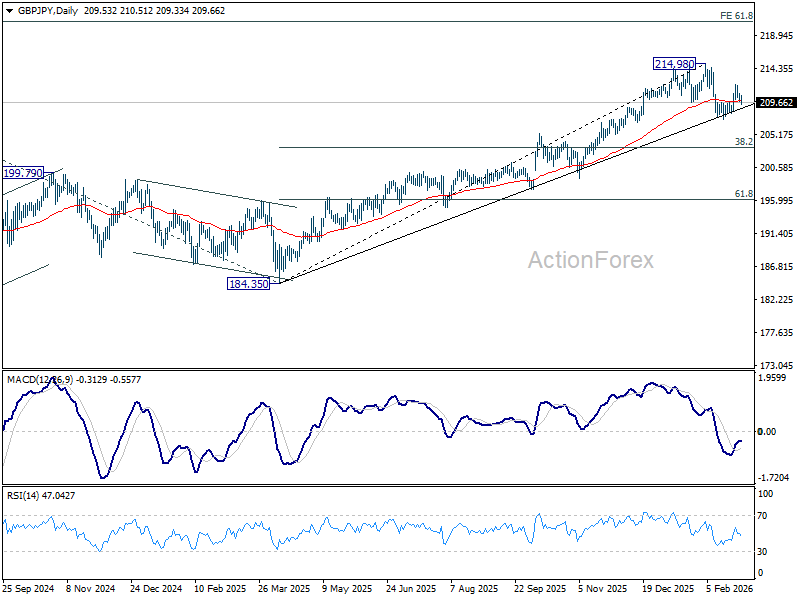
In the bigger picture, current development argues that price actions from 214.98 might be a near term consolidation pattern only. That is, larger up trend from 123.94 (2020 low) is still in progress. Firm break of 214.98 will target 61.8% projection of 148.93 (2022 low) to 208.09 (2024 high) from 184.35 at 220.90. On the downside, though, break of 207.20 will revive that case that it's already in a larger scale correction.
EUR/JPY Daily Outlook
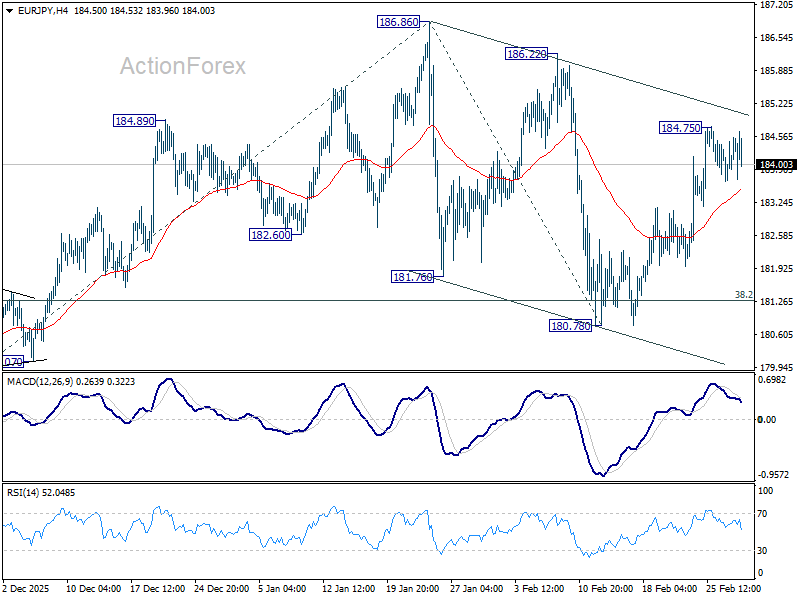
Daily Pivots: (S1) 183.89; (P) 184.22; (R1) 184.75; More...
Intraday bias in EUR/JPY remains neutral and some sideway trading could be seen below 184.75. On the upside, break of 184.75 will target 186.86 high. Firm break there will resume larger up trend to 61.8% projection of 172.24 to 186.86 from 180.78 at 189.81. Overall, outlook will remain bullish as long as 38.2% retracement of 172.24 to 186.86 at 181.27, in case of deep retreat.
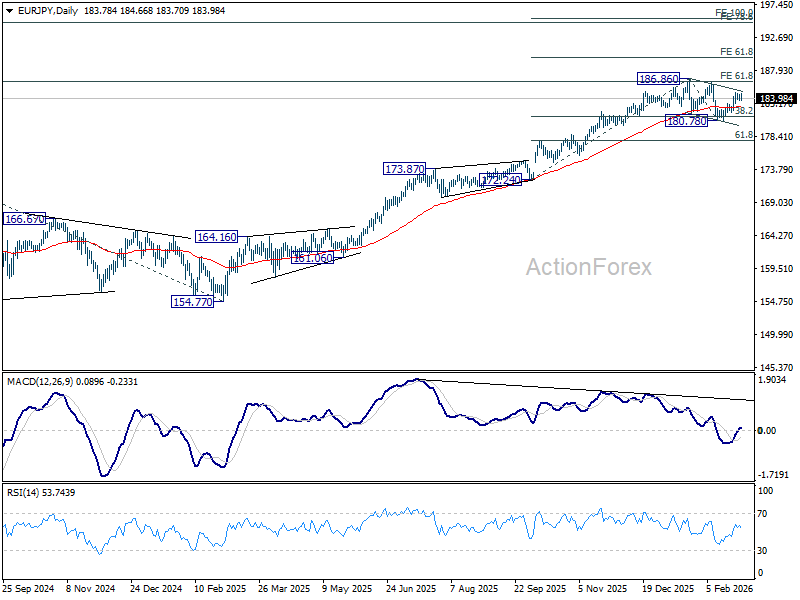
In the bigger picture, current development suggests that price actions from 186.86 are merely a near term corrective pattern. In other words, the long term up trend is still in progress. Firm break of 186.86 will pave the way to 78.6% projection of 124.37 (2022 low) to 175.41 (2025 high) from 154.77 at 194.88 next. This will now remain the favored case as long as 180.78 support holds.
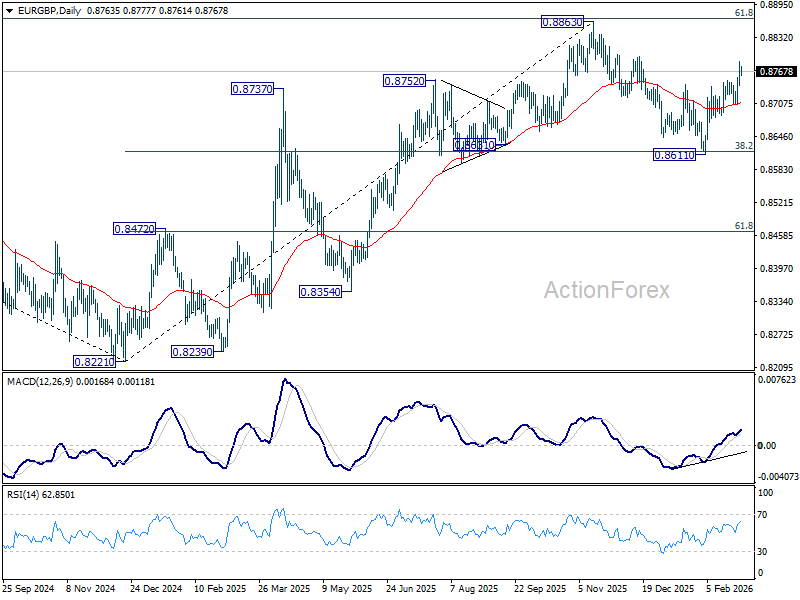
EUR/GBP Daily Outlook
Daily Pivots: (S1) 0.8718; (P) 0.8738; (R1) 0.8769; More…
Intraday bias in EUR/GBP remains on the upside as rise from 0.8611 is in progress for retesting 0.8863 high. Decisive break there will confirm up trend resumption, carries larger bullish implications. For now, further rally is expected as long as 0.8705 support holds, in case of retreat.
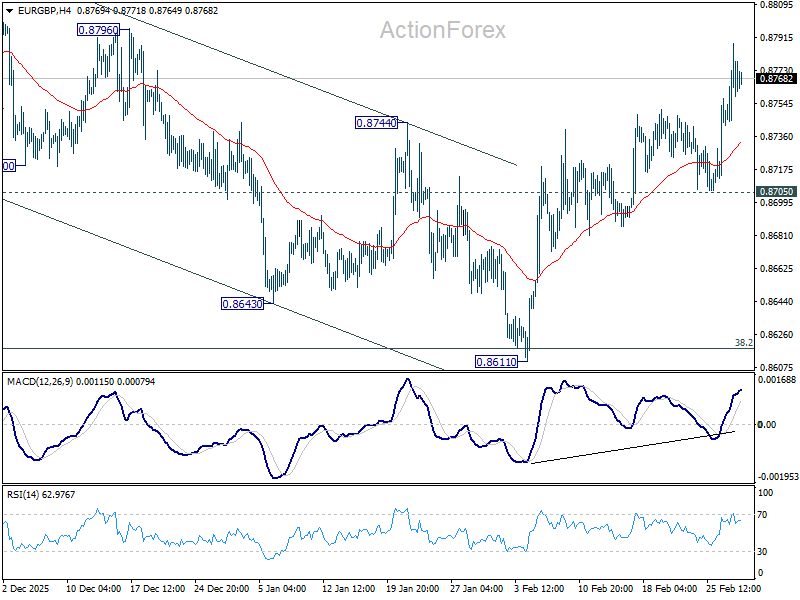
In the bigger picture, current development suggests that rise from 0.8221 medium term bottom is still in progress. Decisive break of 61.8% retracement of 0.9267 to 0.8221 at 0.8867 should confirm that it's reversing whole down trend from 0.9267. That should pave the way back to 0.9267.
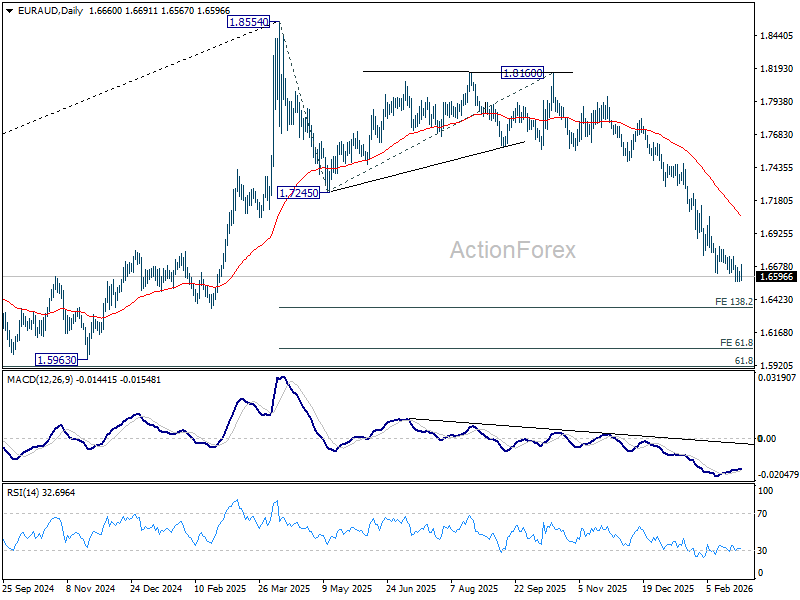
EUR/AUD Daily Outlook
Daily Pivots: (S1) 1.6567; (P) 1.6604; (R1) 1.6647; More...
Further decline is expected in EUR/AUD with 1.6830 resistance intact, despite some loss of downside momentum. Current fall should continue to 138.2% projection of 1.8554 to 1.7245 from 1.8160 at 1.6351. However, firm break of 1.6830 resistance will confirm short term bottoming, on bullish convergence condition in 4H MACD, and turn bias back to the upside for stronger rebound.
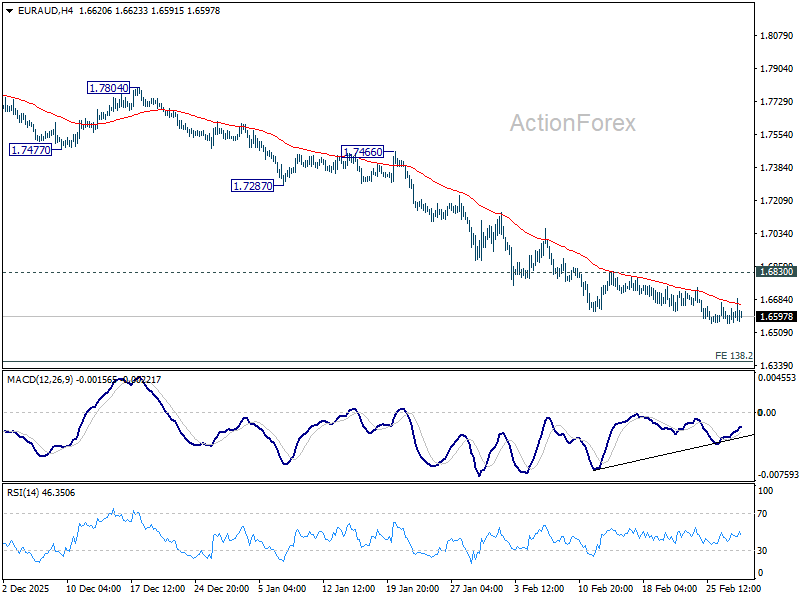
In the bigger picture, fall from 1.8554 medium term top is seen as reversing the whole up trend from 1.4281 (2022 low). Deeper decline should be seen to 61.8% retracement of 1.4281 to 1.8554 at 1.5913, which is slightly below 1.5963 structural support. For now, risk will stay on the downside as long as 1.7245 support turned resistance holds, even in case of strong rebound.
US-Israel Strikes Iran, Markets React
In focus today
In the US, the ISM manufacturing index for February will be released today. January's reading of 52.6 surprised to the upside, driven by a rise in new orders, indicating stronger final demand.
The key focus today will be the unfolding of US-Iran conflict, following the US strike that killed Iran's Supreme Leader Ayatollah Khamenei and targeted key nuclear sites. Attention is on Iran's response and the risk of broader regional escalation, while markets react to rising oil prices and potential disruptions in the Strait of Hormuz.
This week, key data releases include the February Flash HICP from the euro area and the UK spring budget, which will be presented on Tuesday. In the US, focus will be on a series of labour market reports, with the February jobs report, featuring NFP and unemployment figures, taking the spotlight on Friday.
Economic and market news
What happened during the weekend
The US and Israeli strikes on Iran, targeting the country's top leadership, missile program and navy assets, have plunged the Middle East into a regional war. Iran has retaliated by launching broad attacks across the Gulf. Domestically, Iran faces a significant upheaval, with a three-member provisional council taking control after Khamenei's death. The new Supreme leader is set to be appointed in the coming days. The tit-for-tat strikes are expected to continue at least for the coming days. Yesterday, President Trump signalled plans to engage with Iran's new leadership, despite also stating that the conflict could last up to four weeks. No timeline of talks has been provided, and Iran's security chief stated that negotiations with the US are not an option. Overnight, a significant development occurred as Hezbollah joined the conflict, leading to Israeli strikes on Lebanon.
Markets reacted sharply to escalating tensions in the Middle East, with equities under pressure and oil surged over 6% since Friday, boosting USD amid improved terms of trade. Safe-haven assets rallied, with gold up 1.6%, while CHF outperformed, pushing EUR/CHF near 0.90.
Energy markets, Brent crude surged sharply when markets opened, briefly touching USD 80 per barrel. The Strait of Hormuz (SOH), a critical chokepoint for app. 20% of global oil and LNG flows, has seen major shipping lines halt transits following Tehran's warnings and attacks against vessels. OPEC+ has announced a production increase of 206,000 bpd from April, but in the extreme scenario of a complete, weeks-long SOH closure, support to market would be insufficient. The likelihood of extreme action by Iran is undeniably higher than it has ever been, as the regime is battling for survival, but we still consider it unlikely that Iran could disrupt oil and gas flows for so long that it would trigger a global energy crisis.
What happened Friday
In the euro area, country-specific inflation data has been mixed. German inflation fell to 2.0% y/y (cons: 2.1%) from 2.1%, driven by sharply lower food inflation, while core inflation held steady at 2.5%. Services inflation regained momentum after January's VAT-related dip, confirming stable underlying dynamics. Spanish inflation surprised on the upside, with headline inflation at 2.3% y/y (cons: 2.2%) and core rising to 2.7% y/y. French flash inflation rose to 1.0% y/y (cons: 0.8%), largely due to energy base effects, though underlying inflation remains subdued. We forecast euro area headline inflation inching up to 1.8%, with core steady at 2.2%.
In the US, January PPI surprised to the upside, mainly driven by the volatile trade services category, reflecting higher sales margins by wholesalers rather than underlying cost pressures. Excluding trade services, producer prices were flat m/m, suggesting limited market impact.
In Norway, the seasonally adjusted unemployment rate (NAV) held steady at 2.1% in February, slightly below Norges Bank's 2.2% forecast. The number of unemployed fell by 1,000, while new vacancies declined slightly, underscoring a tight labour market, and enabling Norges Bank to focus on inflation when setting rates. Retail sales rose 1.1% m/m in January, with 3M/3M growth at 1.2%, indicating acceleration in recent months.
In Sweden, retail sales rose 0.1% m/m in January and 4.1% y/y, supported by strong durable goods sales, while consumables contributed negatively. Q4 GDP met expectations at 0.5% q/q and 2.1% y/y, driven by household and public consumption as well as investments. Negative contributions came from inventories and net exports.
Equities: Today, the focus is not on what happened last week or on Friday, but on developments over the weekend and into this morning following US and Israel's attack on Iran. Most Asian equity markets are trading lower, generally in a range of -0.5% to -2%. A few Middle Eastern markets are closed, and some smaller markets such as Karachi are down more sharply.
However, across the major markets, moves remain relatively limited given the scale of the geopolitical escalation. These are not outsized moves compared to what we could have seen on a major macro surprise.
The energy sector is outperforming this morning, as expected, but not to an extreme degree. Importantly, we are not seeing a pronounced defensive rotation. On a large macro shock, we would typically expect a much clearer shift into defensives than what we observe this morning.
European futures are currently down between 0.5% and 1.5%, while US futures are lower by around 1%. Again, in the context of normal daily volatility, this does not stand out dramatically. In itself, the equity market reaction - or relative lack thereof - tells an interesting story about how financial markets are currently assessing the situation in Iran.
FI and FX: The focus is on the market impact of the escalation of the war between Israel/US and Iran towards other parts of the Middle East. We have seen a rise in the oil price this morning as well as a strengthening of the USD, but modest safe haven flows in the bond market. Here, the initial reaction in JGB market has been a very modest with a decline of a few bp. US Treasuries rose rose 1-2bp in Tokyo trading hours. We expect to see some widening of the Schatz spread given the risk-off movement.
EUR/CHF Daily Outlook
Daily Pivots: (S1) 0.9052; (P) 0.9097; (R1) 0.9133; More....
EUR/CHF's fall continues today and intraday bias remains on the downside. Current down trend should target 61.8% projection of 0.9347 to 0.9092 from 0.9149 at 0.8991 first. Firm break there will target 100% projection at 0.8894 next. For now, near term outlook will stay bearish as long as 0.9149 resistance holds, in case of recovery.
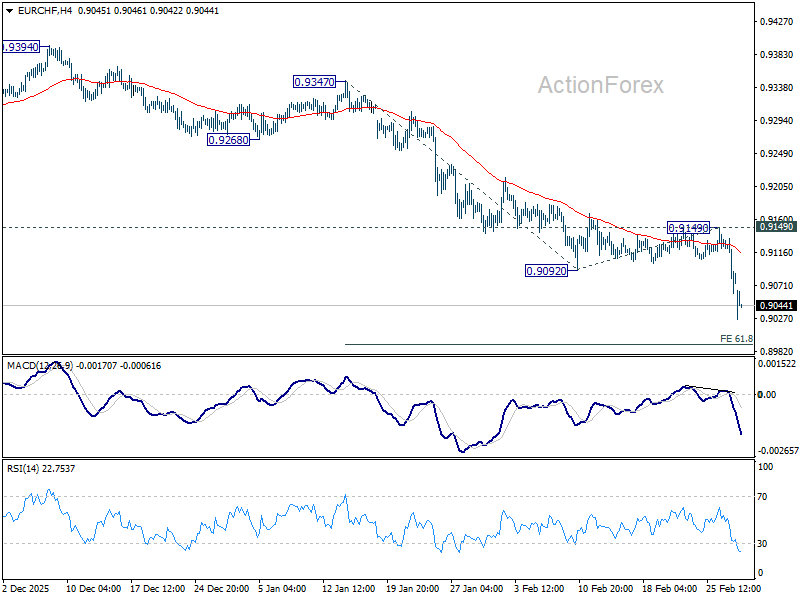
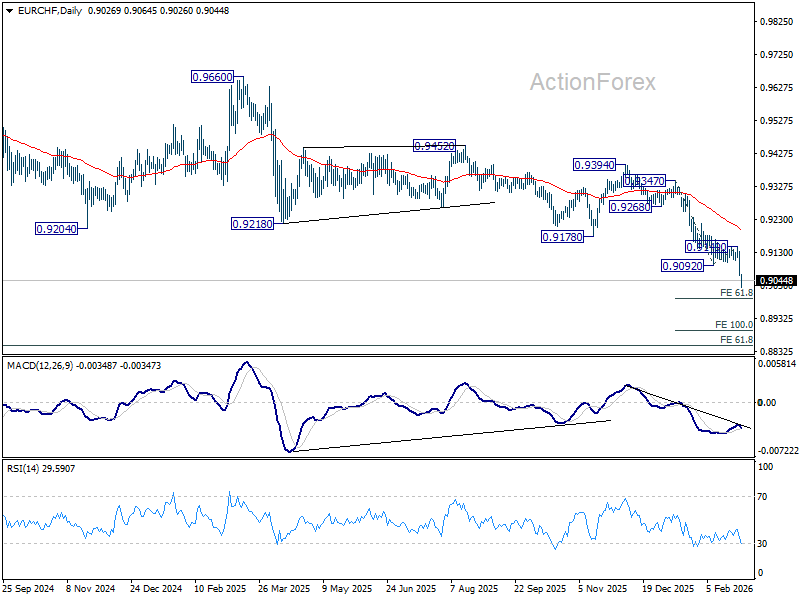
In the bigger picture, down trend from 0.9928 (2024 high) is still in progress. Next target is 61.8% projection of 1.1149 to 0.9407 from 0.9928 at 0.8851. Outlook will stay bearish as long as 0.9394 resistance holds, in case of rebound.
Safe-Haven Flows Build But No Panic, Focus Turns to Iranian Succession
Markets opened the week with a clear but measured risk-off tone following dramatic escalation in Middle East tensions over the weekend. While safe-haven flows were evident in Asia, price action so far remains contained rather than disorderly. Investors are reacting, but not capitulating.
Equity markets in the region reflected caution rather than panic. Japanese and Hong Kong stocks both declined roughly -1.5%, a notable pullback but far from crisis territory. The moderation suggests investors are still assessing whether escalation marks prolonged regional war or temporary shock.
Oil initially spiked on reports that shipping through Strait of Hormuz has effectively stalled. With major carriers such as Maersk suspending transit through both Hormuz and Suez due to safety concerns, roughly 15 million barrels per day of flows are potentially disrupted. However, gains were tempered after OPEC+ announced a larger-than-expected output hike, cushioning supply shock.
Gold reacted more decisively, jumping above 5350. Yet even this move appears orderly rather than panicked. The metal remains well below its historical peak near 5600, and momentum resembles extension of existing rebound rather than vertical flight to safety.
In currency markets, Swiss Franc leads gains, followed by Dollar. Canadian Dollar also outperforms, supported by firmer crude prices despite tempered spike. At the weaker end, Kiwi sits at the bottom, followed by Sterling, both pressured by risk aversion. Yen, typically a haven, is softer as markets increasingly price delayed tightening from BoJ, limiting its defensive appeal. Euro and Aussie trade in middle of pack.
Geopolitical shock intensified after confirmed death of Ali Khamenei, triggering broader regional involvement including Lebanon, Kuwait and Bahrain. The widening scope of the conflict has heightened uncertainty around energy supply and political stability.
Attention now shifts to Iranian succession. Reports indicate Mojtaba Khamenei and Ali Larijani are positioning for influence, with Hassan Khomeini viewed as wildcard candidate. Market reaction will hinge on whether power consolidates around hardline or moderate leadership.
If Islamic Revolutionary Guard Corps backs Mojtaba, investors may anticipate continued hardline stance and prolonged confrontation. Conversely, traction for Larijani or Khomeini could fuel hopes for rapid de-escalation, triggering risk rebound across equities and cyclicals.
Also, any signs of internal IRGC coup or fragmentation within clerical leadership would represent far more destabilizing scenario. Such outcome could amplify volatility well beyond current contained levels.
Traders will also monitor Pentagon press briefing for clues on whether operations are entering new phase. Equally important is messaging from US President Donald Trump, who indicated willingness to hold talks with “new leadership” in Iran. Naming specific counterpart could either stabilize expectations or deepen uncertainty.
In Asia, at the time of writing, Nikkei is down -1.56%. Hong Kong HSI is down -1.39%. China Shanghai SSE is up 0.54%. Singapore Strait Times is down -1.88%. Japan 10-year JGB yield is down -0.027 at 2.085.
War premium lifts, violent move possible if 100 gives way
Silver edged higher as markets reacted to escalating tensions in Middle East, with US-Israel-Iran conflict driving aggressive safe-haven flows. Prices surged to an intraday high above 96 before easing slightly as traders locked in partial profits. Despite intraday consolidation, underlying bid remains intact as war premium continues to underpin precious metals.
For now, further gains remain favored while conflict risk dominates sentiment. However, psychological barrier at 100 is shaping up as key battleground in coming sessions. Market structure and positioning suggest that a firm and sustained break above 100 is not expected at this stage without a significant fresh escalation.
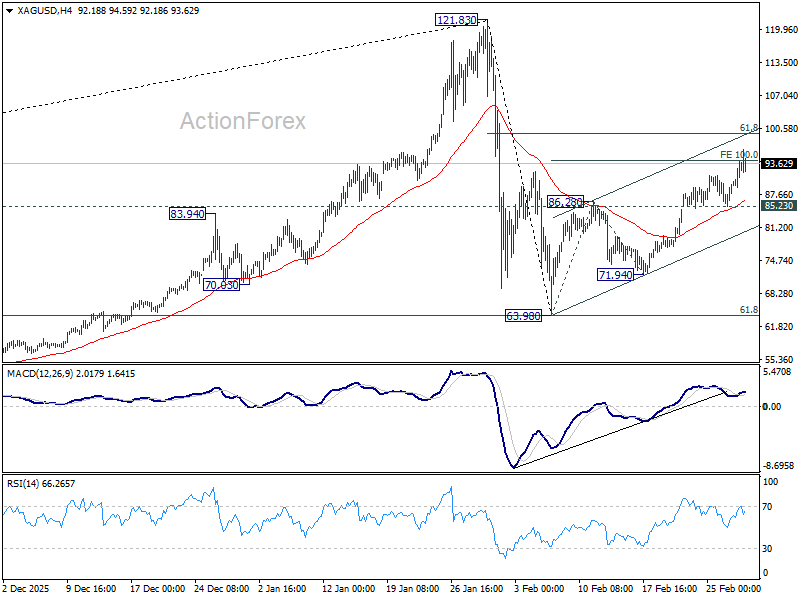
Technically, current advance from 63.98 is viewed as second leg of corrective pattern following record high at 121.83. 100% projection of 63.98 to 86.28 from 71.94 at 94.24 has already been met, suggesting measured target of the pattern has technically been satisfied.
While upside bias remains, strong resistance is expected around 61.8% retracement of 121.83 to 63.98 at 99.78. That zone aligns closely with psychological 100 handle and could cap gains. On downside, break below 85.23 would be first signal that rebound from 63.98 has completed.
That said, market dynamics could shift rapidly if physical demand intensifies. An urgent scramble for physical bars amid worsening geopolitical conditions could tighten liquidity and generate squeeze conditions, propelling Silver decisively through 100 and reopening path toward 121.83 record high.
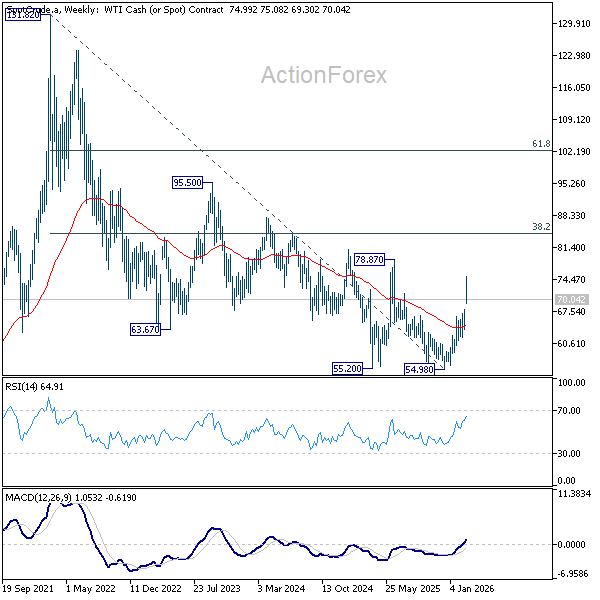
WTI soars above 70 despite OPEC+'s "band aid" production hike
On Sunday, the OPEC+ "V8" coalition took a proactive stance by accelerating production hikes to 206,000 bpd starting in April. This move—surpassing the 137,000 bpd initially anticipated—serves as a strategic pivot to buffer a market shaken by the sudden U.S./Israeli strikes on Iran. While the alliance officially points to "market fundamentals," the timing is clearly a response to the geopolitical flashpoint in the Middle East.
Technically, WTI exhibited extreme volatility at the Monday open, surging past 75 before settling to trade near 70. Despite the OPEC+ supply boost, the near-term outlook remains bullish so long as the 67.36 resistance turned support level holds.
Sustained trading above 70 psychological mark should open the door for a retest of 78.87 key resistance (2025 high). That should be the "line in the sand" for the current bull run.
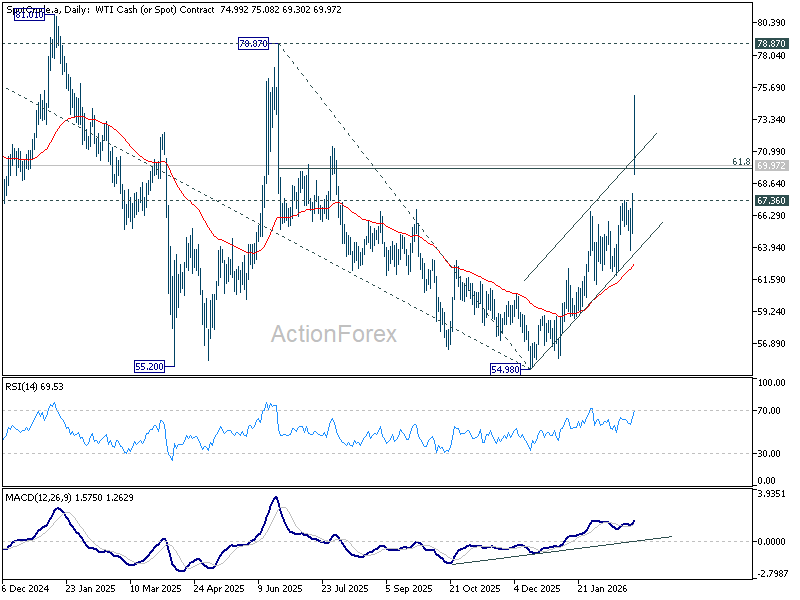
While a firm break of 78.87 isn't yet expected, a clean break above it would signal a structural trend reversal, unwinding the multi-year downtrend from of 131.82 (2022 high). That could happen in the "nightmare scenario" of a total blockade in the Gulf, that could easily propel prices toward triple digits.
Japan's PMI manufacturing finalized at 53.0, output and orders post fastest gains in years
Japan’s PMI Manufacturing was finalized at 53.0 in February, rising from 51.5 in January and marking highest reading since May 2022. The data point to a clear acceleration in factory activity, with the sector extending its expansion and signaling that recovery momentum is broadening at the start of Q1.
According to Annabel Fiddes, Economics Associate Director at S&P Global Market Intelligence, companies reported the quickest increases in output, new orders, employment and purchasing activity in more than four years. Business confidence also climbed to highest level since mid-2024, supported by expectations that global demand will continue to revive, particularly across technology and automotive sectors.
While input cost pressures eased slightly, price growth remained elevated by historical standards, partly reflecting impact of "weak Yen" on imported materials. Nevertheless, stronger demand could improve firms ability to pass on higher costs, helping to stabilize margins.
US NFP, UK fiscal risks and China target set tone for volatile week
March begins with markets delicately balanced between resilience and repricing risk. The week ahead is defined by one dominant risk event — US Non-Farm Payrolls — but the surrounding calendar ensures volatility will not be confined to Friday. Fiscal credibility in the UK, China’s growth ambitions, and renewed central bank messaging in Australia could all create cross-currents across the markets.
The High-Stakes Events:
Friday’s US non-farm payrolls report would be the most influential event. After January’s strong jobs print, positioning has tilted toward patience rather than imminent easing. That shift was highlighted by comments from known dove Fed Governor Christopher Waller, who explicitly opened door to holding rates unchanged if labor market strength proves durable. A second robust payroll report would likely push expectations for next Fed cut well into second half of year, reinforcing support for and Dollar. Conversely, meaningful downside surprise could revive earlier easing bets.
Sterling traders face their own pivotal moment on Tuesday with UK Spring Statement. Although framed as forecast update under government’s “one major fiscal event per year” rule, markets are laser-focused on fiscal headroom and updated growth projections. If the Office for Budget Responsibility delivers grim growth outlook or if policymakers hint at emergency tax adjustments, Sterling could face sharp repricing. Fiscal credibility remains critical anchor for the Pound's stability.
The Silent movers:
Asia-Pacific currencies may find direction from China’s annual “Two Sessions,” beginning March 4–5. Investors will watch closely for 2026 GDP target and signals around 15th Five-Year Plan priorities. Ambitious growth target or large-scale infrastructure and technology stimulus would likely lift AUD and NZD through improved commodity and trade expectations.
Tuesday also features appearance by RBA Governor Michele Bullock at AFR Business Summit. While the consensus is for another hike in May, some market participants currently lean toward view that last month’s increase was “one and done.” Any hint that tightening cycle is not finished could catch these dovish positioning off guard.
Switzerland adds quieter but meaningful risk with Wednesday’s CPI. Inflation is already exceptionally low, leaving SNB wary of excessive currency strength. A print significantly below zero would heighten risk of verbal intervention against CHF. In current environment of geopolitical tension, Franc has benefited from safe-haven flows. However, ultra-low inflation limits tolerance for further appreciation. Weak CPI could therefore make CHF a silent casualty of its own stability.
Here are some highlights for the week.
United States (USD):
- ISM PMIs (Mon & Wed)
- ADP Employment (Wed)
- Non-Farm Payrolls & Retail Sales (Fri):
Eurozone (EUR):
- Eurozone Flash Inflation (Tue):
- Eurozone Retail Sales (Thu):
- Eurozone GDP & Retail Sales (Fri):
United Kingdom (GBP):
- UK Spring Statement (Tue):
Switzerland (CHF):
- Swiss CPI (Wed):
Australia (AUD):
- Australia Q4 GDP (Wed)
China (CNY):
- The "Two Sessions" (Starts Mar 4)
- NBS & Private PMIs (Wed)
EUR/CHF Daily Outlook
Daily Pivots: (S1) 0.9052; (P) 0.9097; (R1) 0.9133; More....
EUR/CHF's fall continues today and intraday bias remains on the downside. Current down trend should target 61.8% projection of 0.9347 to 0.9092 from 0.9149 at 0.8991 first. Firm break there will target 100% projection at 0.8894 next. For now, near term outlook will stay bearish as long as 0.9149 resistance holds, in case of recovery.
In the bigger picture, down trend from 0.9928 (2024 high) is still in progress. Next target is 61.8% projection of 1.1149 to 0.9407 from 0.9928 at 0.8851. Outlook will stay bearish as long as 0.9394 resistance holds, in case of rebound.
War premium lifts Silver, violent move possible if 100 gives way
Silver edged higher as markets reacted to escalating tensions in Middle East, with US-Israel-Iran conflict driving aggressive safe-haven flows. Prices surged to an intraday high above 96 before easing slightly as traders locked in partial profits. Despite intraday consolidation, underlying bid remains intact as war premium continues to underpin precious metals.
For now, further gains remain favored while conflict risk dominates sentiment. However, psychological barrier at 100 is shaping up as key battleground in coming sessions. Market structure and positioning suggest that a firm and sustained break above 100 is not expected at this stage without a significant fresh escalation.
Technically, current advance from 63.98 is viewed as second leg of corrective pattern following record high at 121.83. 100% projection of 63.98 to 86.28 from 71.94 at 94.24 has already been met, suggesting measured target of the pattern has technically been satisfied.
While upside bias remains, strong resistance is expected around 61.8% retracement of 121.83 to 63.98 at 99.78. That zone aligns closely with psychological 100 handle and could cap gains. On downside, break below 85.23 would be first signal that rebound from 63.98 has completed.
That said, market dynamics could shift rapidly if physical demand intensifies. An urgent scramble for physical bars amid worsening geopolitical conditions could tighten liquidity and generate squeeze conditions, propelling Silver decisively through 100 and reopening path toward 121.83 record high.
Gold and Oil Rise as Iran Tensions Escalate, U.S. Stocks Near Support
Gold moved slightly higher as investors looked for safety amid rising geopolitical tensions, while Bitcoin demand stayed weak after its recent sharp fall. In stock markets, U.S. equities struggled despite strong earnings from NVIDIA, as concerns about higher U.S. tariffs and uncertainty over the broader impact of AI on existing business models weighed on sentiment.
Earlier in the week, U.S. consumer confidence came in stronger than expected. However, Friday’s higher-than-expected PPI inflation data had a bigger impact on markets. The data increased concerns that interest rate cuts could be delayed, putting pressure on U.S. stocks and supporting the U.S. dollar.
Geopolitical tensions escalated sharply over the weekend after reports of a joint U.S. and Israeli strike on Iran that killed a senior Iranian leader. On Monday morning, oil and gold prices rose on fears of supply disruptions and rising conflict. The U.S. dollar strengthened, while global stock markets fell as investors reduced risk exposure following developments over the weekend.
Markets This Week
U.S. Stocks
U.S. equity markets ended February on a weak note, and with the recent attacks on Iran, sentiment is likely to remain fragile. Early Monday trading is already testing the February lows. If those levels break, it could trigger faster losses at the start of the week. Short-term traders may consider selling a clear break below the February lows if U.S. markets turn aggressive to the downside. Alternatively, if support holds and buyers step in, a bounce could offer a short-term buying opportunity. Medium-term traders may prefer to wait — either for a recovery toward resistance to sell into strength, or for a confirmed break below the February lows later in the week. Resistance levels are at 49,000, 50,000, and 50,500. Support is seen at 48,300, 48,000, 47,750, and 47,500.
Japanese Stocks
Takaichi’s strong leadership and signs that the Japanese government may lean toward delaying further Bank of Japan rate hikes helped push the Nikkei sharply higher last week, briefly touching 60,000. Although the market saw early selling on Monday due to the Iran conflict, support at the 10-day moving average held, suggesting underlying demand remains firm and downside may be limited. For now, range trading between 57,500 and 60,000 looks like the most practical strategy this week, unless geopolitical risks escalate further. Resistance is seen at 59,000円, 60,000円, and 61,000円, while support is at 57,000円, 56,500円, 56,000円, and 55,000円.
USD/JPY
USD/JPY surprised the market last week, rising strongly on signs that Japanese interest rates may remain low for longer as Takaichi signals support for the economy. This shift in expectations helped weaken the yen and push the pair higher. Early Monday, the conflict in Iran added further strength to the U.S. dollar as investors moved toward safe-haven assets. With the 10-day moving average now turning higher, USD/JPY could continue to test the upside, potentially moving toward 158 as traders watch closely for any signs of Bank of Japan intervention. Resistance is at 157, 158, and 159, while support is seen at 155, 154, 153, and 152.
Gold
Gold moved higher last week as investors worried about rising geopolitical tensions in the Middle East and continued to diversify away from the U.S. dollar. The weekend escalation between the U.S. and Iran led to a strong open at the start of the week, with safe-haven demand pushing prices up. In the short term, gold looks slightly overbought, so traders should be careful about chasing higher prices. Waiting for a pullback toward short-term moving averages may offer better entry points while the overall uptrend remains intact. If tensions continue, gold could test record highs in the coming weeks. Resistance is at $5,400, $5,500, and $5,600, while support is at $5,200, $4,900, and $4,850.
Crude Oil
Crude oil closed last week near resistance as traders bought on rising Middle East tensions. They were rewarded at the start of this week, with prices gapping around 10% higher following the U.S. and Israeli strike on Iran. However, prices have already pulled back from the highs, and how far the conflict escalates will likely determine the next move. In the short term, volatility is likely to remain high, and traders may find opportunities by trading against large moves as the market swings sharply. Medium-term traders could look for buying opportunities ahead of the previous highs near $67.5 if tensions remain elevated. Resistance is at $75, $80, and $85, while support is at $67.5, $65, $60, and $55.
Bitcoin
Bitcoin continued to drift lower last week, but the lack of aggressive selling kept prices in a range, with buyers holding near $65,000. Trading conditions remain quiet, although the short-term trend is slightly negative as the 10-day moving average continues to point lower. If risk-off sentiment increases due to Middle East tensions, a test of $60,000 is possible this week. Resistance is at $70,000, $75,000, $80,000, and $85,000, while support is at $65,000, $60,000, and $55,000.
This Week’s Focus
- Monday: E.U. German Retail Sales and HCOB Eurozone Manufacturing PMI, U.K. Nationwide HPI and S&P Global Manufacturing PMI, U.S. S&P Global Manufacturing PMI and ISM Manufacturing PMI
- Tuesday: Japan Capital Spending, Australia Current Account, E.U. CPI
- Wednesday: Australia GDP, Japan S&P Global Services PMI, China Manufacturing PMI, E.U. HCOB Eurozone Services PMI and Unemployment Rate, U.K. S&P Global Services PMI, U.S. S&P Global Services PMI and Beige Book
- Thursday: Australia Trade Balance, U.K. S&P Global Construction PMI, E.U. ECB Publishes Account of Monetary Policy Meeting, U.S. Trade Balance and Factory Orders
- Friday: E.U. German Factory Orders, U.K. Halifax House Price Index, E.U. GDP, U.S. Retail Sales, Nonfarm Payrolls and Business Inventories
The impact of the conflict in Iran will be the main focus this week, as markets assess whether it leads to further selling of risk assets or is viewed as a contained and expected development with limited broader impact. On the economic side, U.S. employment data on Friday will be the key release to watch, especially after a series of manufacturing data from around the world. The jobs report could influence expectations for interest rates and add to market volatility.
US NFP, UK fiscal risks and China target set tone for volatile week
March begins with markets delicately balanced between resilience and repricing risk. The week ahead is defined by one dominant risk event — US Non-Farm Payrolls — but the surrounding calendar ensures volatility will not be confined to Friday. Fiscal credibility in the UK, China’s growth ambitions, and renewed central bank messaging in Australia could all create cross-currents across the markets.
The High-Stakes Events:
Friday’s US non-farm payrolls report would be the most influential event. After January’s strong jobs print, positioning has tilted toward patience rather than imminent easing. That shift was highlighted by comments from known dove Fed Governor Christopher Waller, who explicitly opened door to holding rates unchanged if labor market strength proves durable. A second robust payroll report would likely push expectations for next Fed cut well into second half of year, reinforcing support for and Dollar. Conversely, meaningful downside surprise could revive earlier easing bets.
Sterling traders face their own pivotal moment on Tuesday with UK Spring Statement. Although framed as forecast update under government’s “one major fiscal event per year” rule, markets are laser-focused on fiscal headroom and updated growth projections. If the Office for Budget Responsibility delivers grim growth outlook or if policymakers hint at emergency tax adjustments, Sterling could face sharp repricing. Fiscal credibility remains critical anchor for the Pound's stability.
The Silent movers:
Asia-Pacific currencies may find direction from China’s annual “Two Sessions,” beginning March 4–5. Investors will watch closely for 2026 GDP target and signals around 15th Five-Year Plan priorities. Ambitious growth target or large-scale infrastructure and technology stimulus would likely lift AUD and NZD through improved commodity and trade expectations.
Tuesday also features appearance by RBA Governor Michele Bullock at AFR Business Summit. While the consensus is for another hike in May, some market participants currently lean toward view that last month’s increase was “one and done.” Any hint that tightening cycle is not finished could catch these dovish positioning off guard.
Switzerland adds quieter but meaningful risk with Wednesday’s CPI. Inflation is already exceptionally low, leaving SNB wary of excessive currency strength. A print significantly below zero would heighten risk of verbal intervention against CHF. In current environment of geopolitical tension, Franc has benefited from safe-haven flows. However, ultra-low inflation limits tolerance for further appreciation. Weak CPI could therefore make CHF a silent casualty of its own stability.
Here are some highlights for the week.
United States (USD):
- ISM PMIs (Mon & Wed)
- ADP Employment (Wed)
- Non-Farm Payrolls & Retail Sales (Fri):
Eurozone (EUR):
- Eurozone Flash Inflation (Tue):
- Eurozone Retail Sales (Thu):
- Eurozone GDP & Retail Sales (Fri):
United Kingdom (GBP):
- UK Spring Statement (Tue):
Switzerland (CHF):
- Swiss CPI (Wed):
Australia (AUD):
- Australia Q4 GDP (Wed)
China (CNY):
- The "Two Sessions" (Starts Mar 4)
- NBS & Private PMIs (Wed)