Sample Category Title
USD/JPY Mid-Day Outlook
Daily Pivots: (S1) 155.66; (P) 155.95; (R1) 156.36; More...
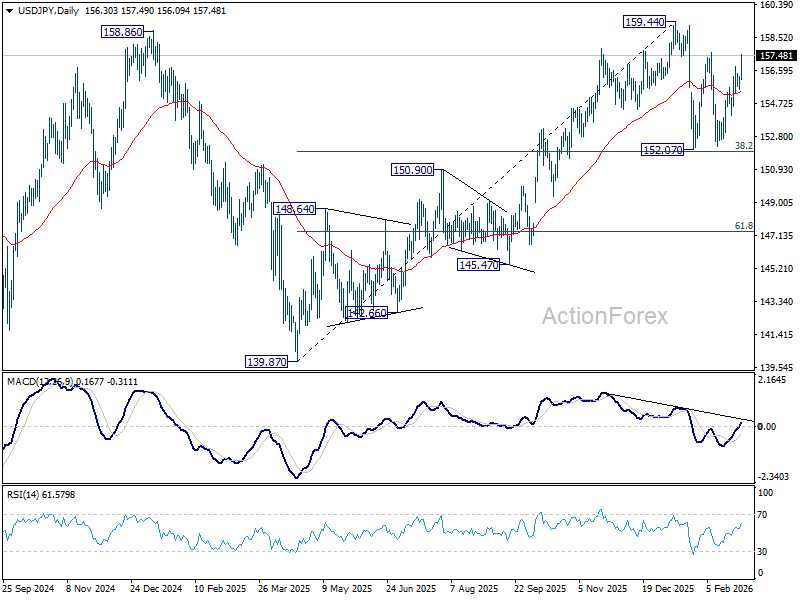
Intraday bias in USD/JPY remains on the upside as rise from 152.25 is in progress for 157.65 resistance. Firm break there will pave the way to retest 159.44 high. On the downside, below 155.52 minor support will turn intraday bias neutral. Overall, price actions from 159.44 are viewed as a near term consolidation pattern. Outlook will remain bullish as long as 38.2% retracement of 139.87 to 159.44 at 151.96 holds.
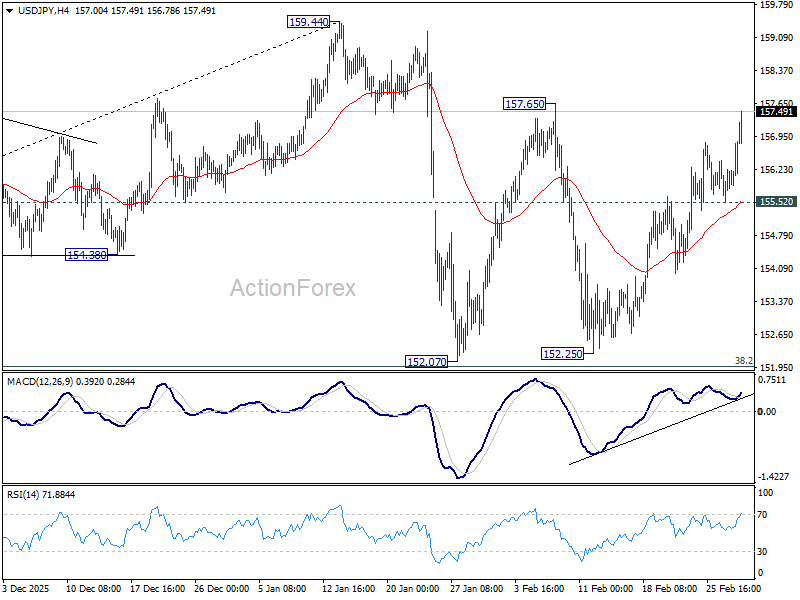
In the bigger picture, outlook is unchanged that corrective pattern from 161.94 (2024 high) should have completed with three waves at 139.87. Larger up trend from 102.58 (2021 low) could be ready to resume through 161.94. This will remain the favored case as long as 55 W EMA (now at 152.16) holds. However, sustained break of 55 W EMA will argue that the pattern from 161.94 is extending with another falling leg.
USD/CHF Mid-Day Outlook
Daily Pivots: (S1) 0.7659; (P) 0.7705; (R1) 0.7737; More….
USD/CHF jumps sharply today, but upside is still limited below 0.7816 resistance, as well as 55 D EMA (now at 0.7818). Intraday bias stays neutral first, and further decline is till expected. Below 0.7671 will bring retest of 0.7603 low. Firm break there will resume larger down trend, and target 0.7382 projection level next. However, sustained break of 55 D EMA will indicate that a larger scale corrective bounce in underway and target 0.8039 resistance next.
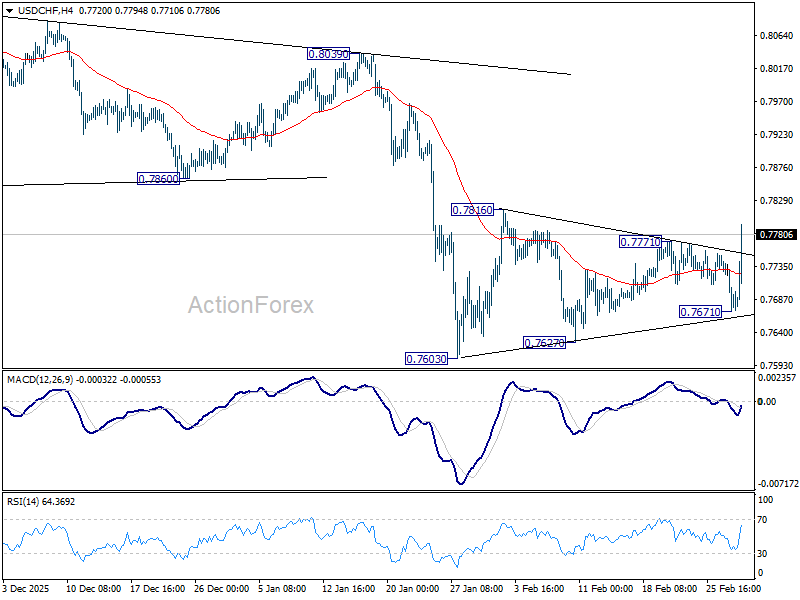
In the bigger picture, down trend from 1.0342 (2017 high) is still in progress. Next target is 100% projection of 1.0146 (2022 high) to 0.8332 from 0.9200 at 0.7382. In any case, outlook will stay bearish as long as 0.8123 resistance holds.
SNB Caps Franc as Dollar Takes Safe-Haven Crown
Global markets have entered a phase of heightened volatility as Middle East tensions transition into direct and widening regional conflict. Initial safe-haven flows rushed into Swiss Franc, pushing the currency to decade-highs against Euro. However, the move proved short-lived after rare and explicit pushback from Swiss National Bank.
In what traders quickly labeled a “verbal floor,” SNB warned of increased willingness to intervene to protect price stability. With Swiss inflation sitting at just 0.1%, authorities made clear they will not tolerate a safe-haven squeeze that risks tipping economy into deflation. The unprompted nature of the statement carried significant weight.
The message was effective. EUR/CHF stabilized after approaching key 0.9000 level — with some viewed as trigger zone for actual currency sales. Current CHF strength is seen as geopolitical spike rather than structural Eurozone deterioration back in 2010, and SNB appears determined to treat it as temporary battle of nerves.
The vacuum left by capped CHF strength has resulted in aggressive rotation into Dollar, which now stands as strongest performer. Canadian Dollar ranks second, supported by elevated energy prices. Sterling surprisingly holds third place. By contrast, Euro and Kiwi sit among weakest performers, together with Swiss Franc.
Equity markets reflect broader stress. European indexes, led by Germany’s DAX down roughly -2.4%. US futures are also pressured, with DOW down around -1.0%. Gold extended recent rebound and it's now pressing 5,400 as hedge against systemic escalation. WTI crude, though moderating near 73 after initial spike, remains highly sensitive to developments around Strait of Hormuz.
In Europe, at the time of writing, FTSE is down -1.44%. DAX is down -2.41%. CAC is down -2.06%. UK 10-year yield is up 0.078at 4.311. Germany 10-year yield is up 0.044 at 2.700. Earlier in Asia, Nikkei fell -1.35%. Hong Kong HSI fell -2.14%. China Shanghai SSE rose 0.47%. Singapore Strait Times fell -2.09%. Japan 10-year JGB yield fell -0.047 to 2.065.
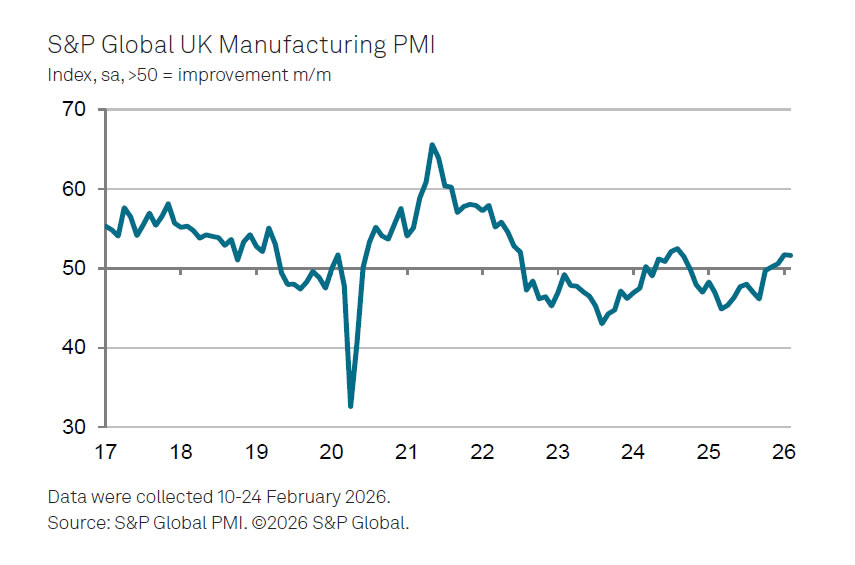
UK PMI manufacturing finalized at 51.7, strong output and export growth
UK PMI Manufacturing was finalized at 51.7 in February, easing marginally from January’s 17-month high of 51.8 but remaining firmly in expansion territory. The data suggest that the sector has made an "encouraging start" to 2026, with output rising at the fastest pace in 17 months as new orders improved across both "home and overseas markets".
According to Rob Dobson at S&P Global Market Intelligence, growth in new export business reached a four-and-a-half year high, supported by stronger client confidence in North America, mainland China, the EU and the Middle East. The rebound in external demand has helped offset lingering weakness seen through much of last year, giving manufacturers renewed momentum.
Business optimism remains elevated, close to January’s recent peak, with nearly three-fifths of firms expecting to raise production over the coming year. While staffing levels continue to decline, the pace of job losses has moderated to the weakest in the current 16-month downturn, pointing to early signs of stabilization.
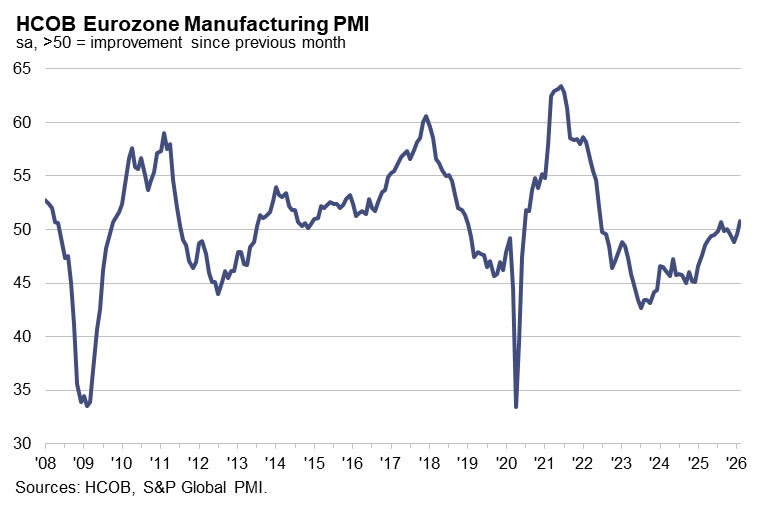
Eurozone PMI manufacturing finalized at 50.8, turning corner with broad-based recovery
Eurozone PMI Manufacturing was finalized at 50.8 in February, rising from January’s 49.5 and marking a 44-month high. The move above also the 50 threshold signals a return to expansion for the bloc’s factory sector.
The rebound appears increasingly broad-based. Greece (54.4) and Ireland (53.1) led growth, while Germany climbed to 50.9, its highest level in nearly four years and back in expansion for the first time in three-and-a-half years. Netherlands, Italy, France and Spain also hovered around or above the growth line, with Austria the only country still below 50. Among the major economies, Germany is now showing the fastest improvement in manufacturing conditions.
According to Cyrus de la Rubia, Chief Economist at Hamburg Commercial Bank, the data point to a "broad-based recovery", with six of eight surveyed countries now in growth territory. However, input price pressures accelerated for a fourth consecutive month and picked up sharply in February. While companies were able to pass on part of these increases, margins likely remained under strain.
Encouragingly, firms expressed growing optimism about future sales and production. Expectations for output improved further compared to January, suggesting confidence that demand conditions will strengthen in coming months.
Japan's PMI manufacturing finalized at 53.0, output and orders post fastest gains in years
Japan’s PMI Manufacturing was finalized at 53.0 in February, rising from 51.5 in January and marking highest reading since May 2022. The data point to a clear acceleration in factory activity, with the sector extending its expansion and signaling that recovery momentum is broadening at the start of Q1.
According to Annabel Fiddes, Economics Associate Director at S&P Global Market Intelligence, companies reported the quickest increases in output, new orders, employment and purchasing activity in more than four years. Business confidence also climbed to highest level since mid-2024, supported by expectations that global demand will continue to revive, particularly across technology and automotive sectors.
While input cost pressures eased slightly, price growth remained elevated by historical standards, partly reflecting impact of "weak Yen" on imported materials. Nevertheless, stronger demand could improve firms ability to pass on higher costs, helping to stabilize margins.
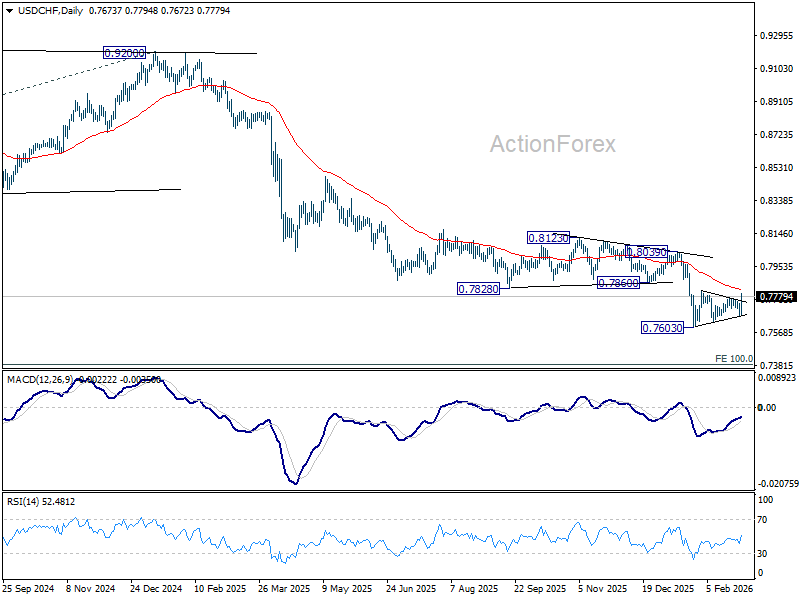
USD/CHF Mid-Day Outlook
Daily Pivots: (S1) 0.7659; (P) 0.7705; (R1) 0.7737; More….
USD/CHF jumps sharply today, but upside is still limited below 0.7816 resistance, as well as 55 D EMA (now at 0.7818). Intraday bias stays neutral first, and further decline is till expected. Below 0.7671 will bring retest of 0.7603 low. Firm break there will resume larger down trend, and target 0.7382 projection level next. However, sustained break of 55 D EMA will indicate that a larger scale corrective bounce in underway and target 0.8039 resistance next.
In the bigger picture, down trend from 1.0342 (2017 high) is still in progress. Next target is 100% projection of 1.0146 (2022 high) to 0.8332 from 0.9200 at 0.7382. In any case, outlook will stay bearish as long as 0.8123 resistance holds.
The Middle East is Changing the Game in Forex
- The US dollar may receive support from rising oil prices.
- Geopolitics is driving up inflation in Japan.
The US dollar gained about 0.8% at the start of the week, which may seem like a relatively restrained reaction to events in the Middle East. Investors are wondering how long the confrontation will last. Will Donald Trump end military action soon, or will he prolong it, risking pushing Brent above $100 per barrel and accelerating US inflation? The second option would be a blow to the oil-import-oriented eurozone and the euro.
Investors are waiting for signals from the Fed, whose meeting will take place in just over two weeks, about its priorities in terms of risks: whether to focus on inflation risks, financial market disruptions, or labour market stabilisation and actual inflation.
The market narrative before the weekend was that stabilisation of the labour market amid slowing inflation allowed the Fed to resume rate cuts around June. This made the medium-term outlook for the US dollar bearish.
The reduction in the average tariff rate following the Supreme Court’s ruling on duties will further slow down prices. To reduce fees, companies are underpricing goods, overpricing transportation and insurance services, or shipping products through Mexico. These actions explain why US inflation is not rising as fast as expected.
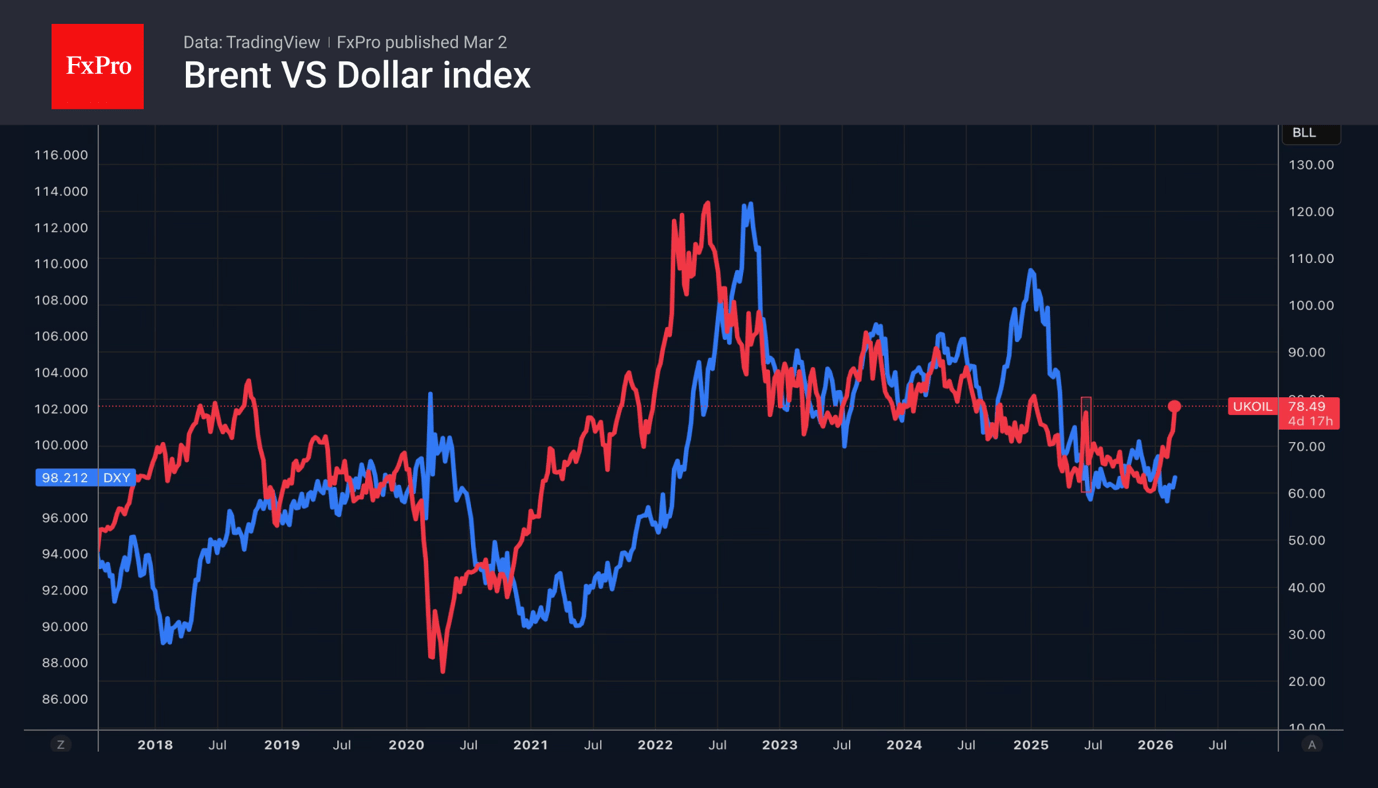
Right now, the narrative driving the markets is that rising oil prices could lead to a prolonged pause in the Fed’s rate cuts. This works in favour of dollar bulls. It also works against the EURUSD and some other European currencies, as they are closer to the conflict and are forced to buy energy resources that have skyrocketed in price.
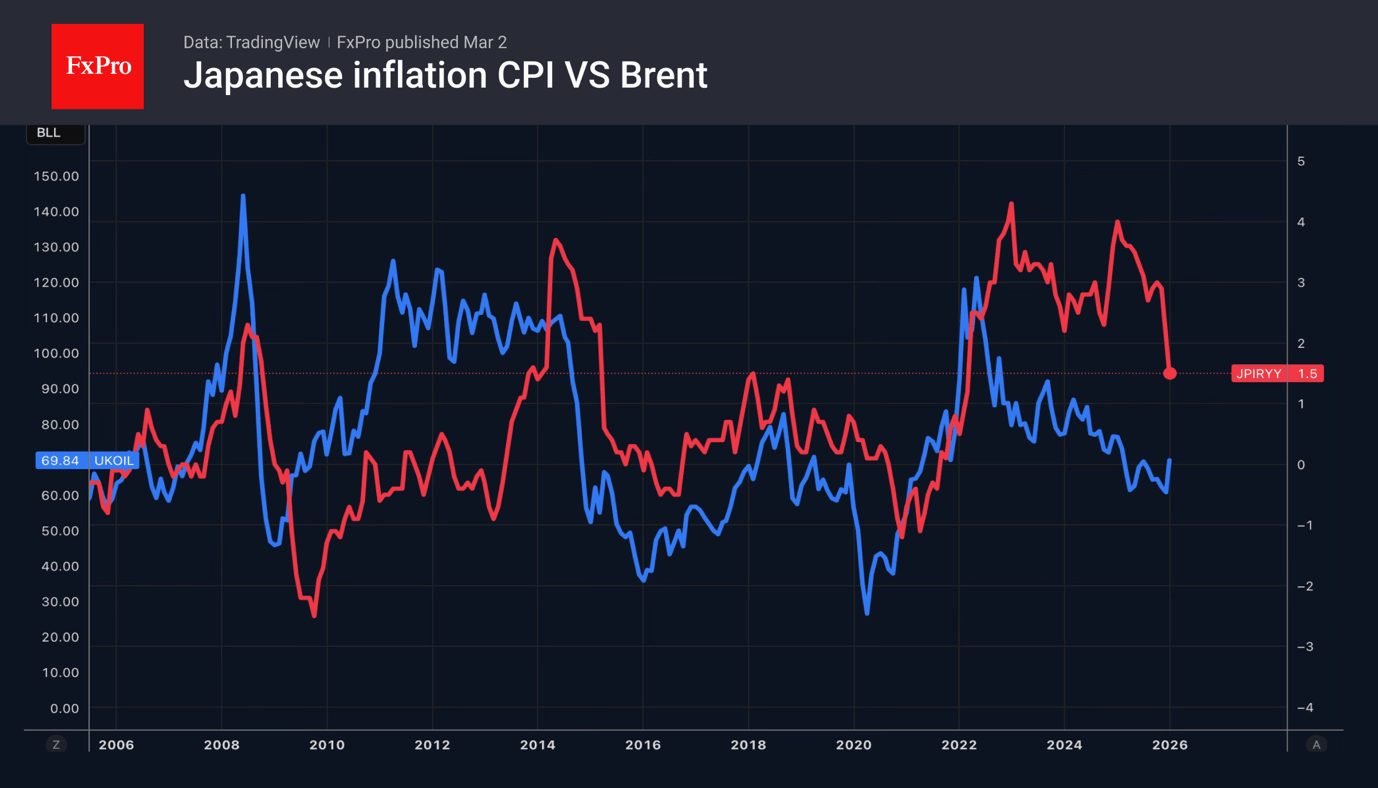
According to Monex Group, a rise in Brent to $100-120 per barrel would be equivalent to a supply shock in Japan and would derail Sanae Takaichi’s efforts to stimulate the economy. In this scenario, inflation will accelerate by 0.5 percentage points. Its slowdown in January-February seemed to have given the prime minister a free hand. However, events in the Middle East risk changing everything, which will affect the USDJPY exchange rate.
Gold appears to be a major beneficiary of the US and Israeli military strikes on Iran. Its price exceeded $5,400 per ounce, where it had briefly peaked in January. The precious metal recorded its seventh consecutive monthly gain in February, its longest winning streak since 1973. The kidnapping of the Venezuelan president, tariff threats against Europe over Greenland and, finally, the conflict in the Middle East create the perfect geopolitical backdrop for a flight to gold as a safe haven.
Investors are responding more to risk premium dynamics than to fundamental factors. In such conditions, gold feels right at home.
Crypto Market Waiting for a Signal from Outside
Market Overview
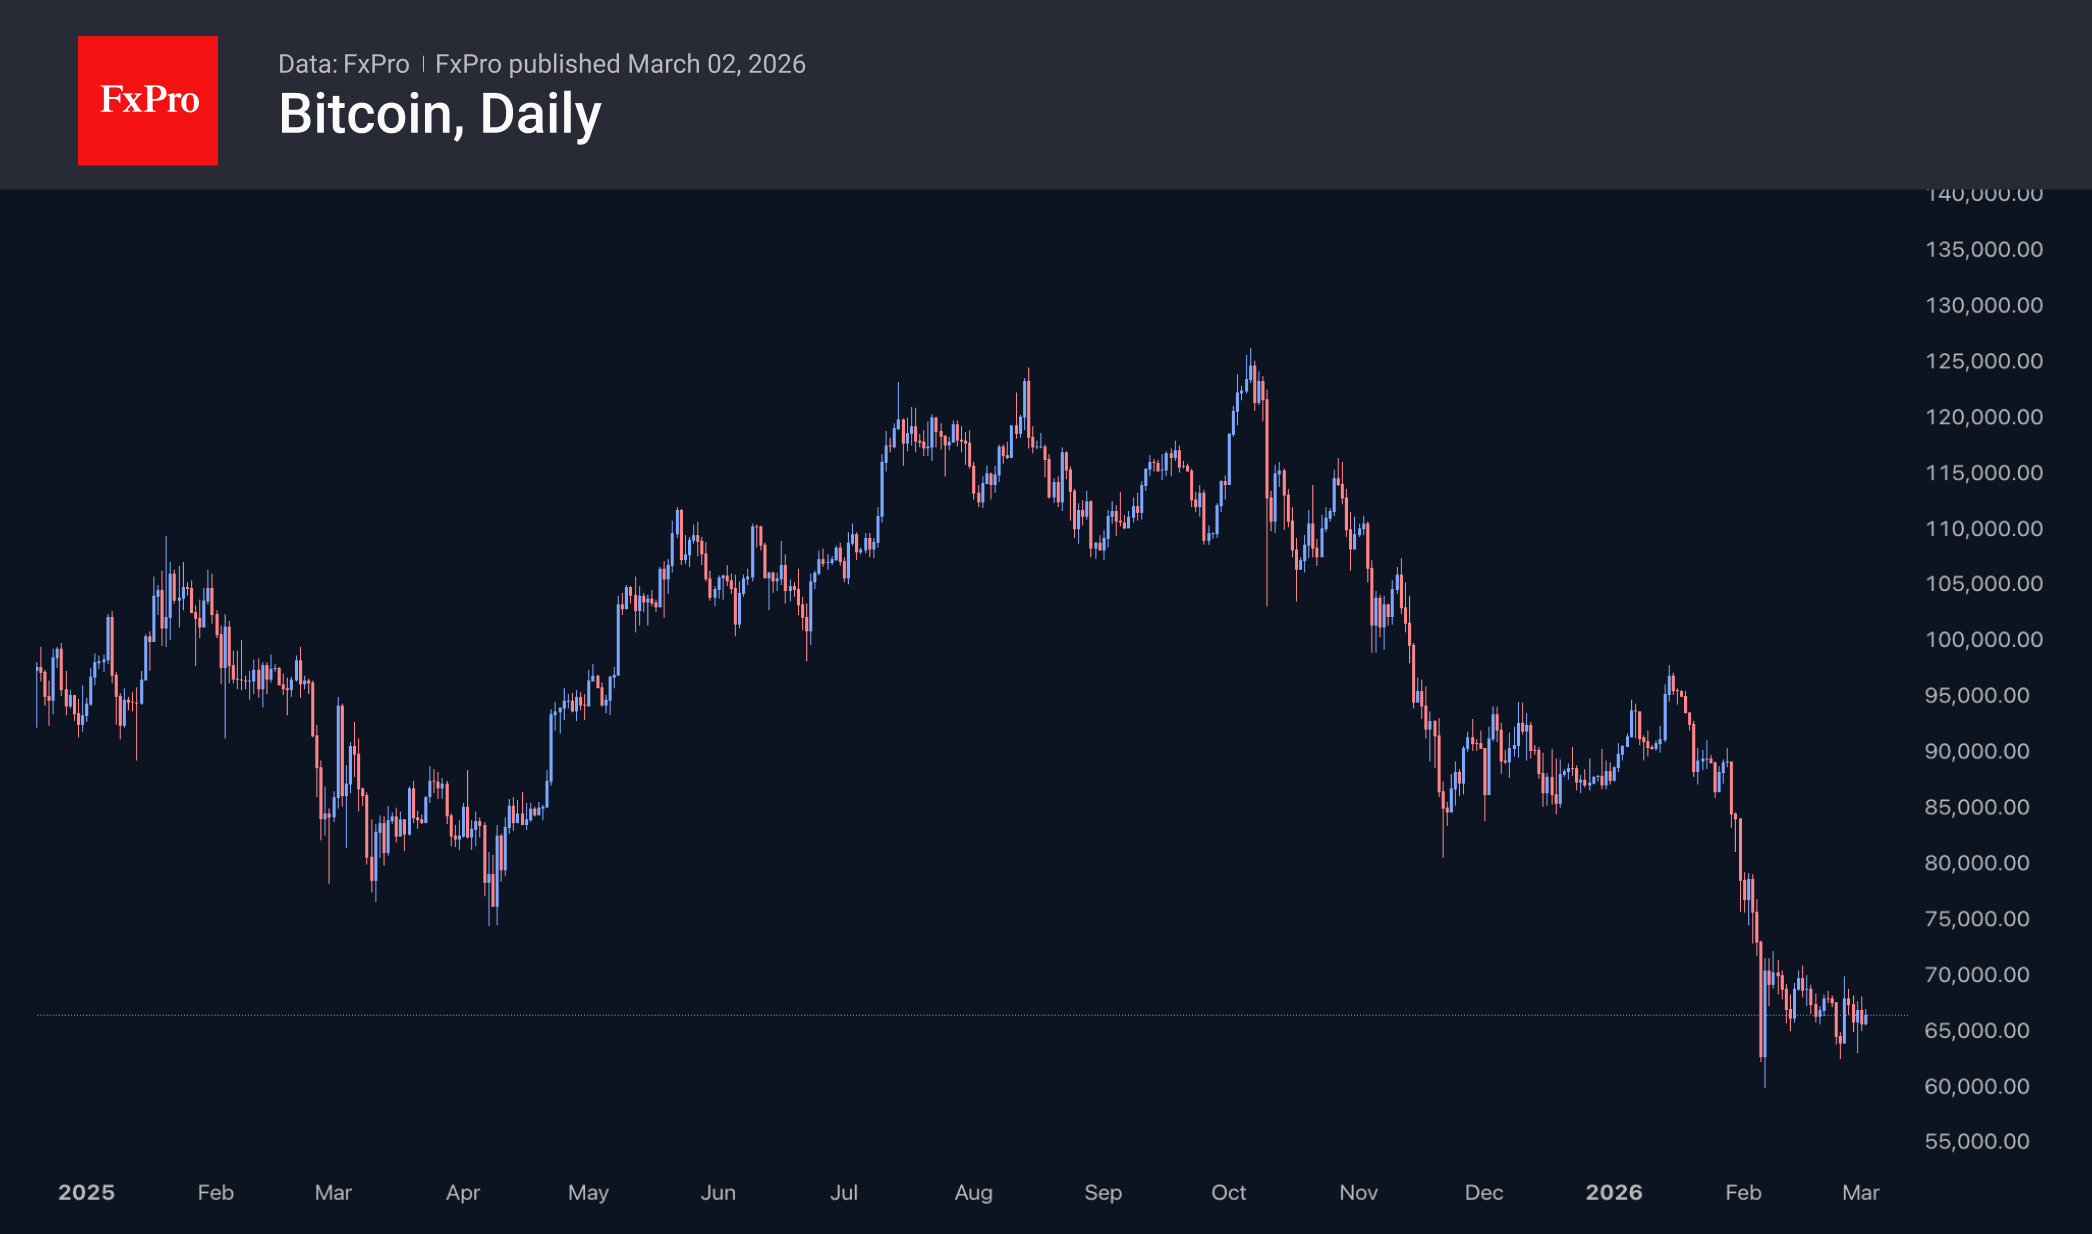
The crypto market capitalisation is roughly where it was a week ago, even though the world has changed dramatically. Events surrounding Iran initially caused cryptocurrencies to fall over the weekend, but they then rebounded, returning closer to the middle of their recent trading range. Retail traders, who dominated over the weekend, balanced between the bullish factor from geopolitics and the somewhat depressed sentiment that has prevailed in cryptocurrencies since October. We still believe that cryptocurrencies remain in a bear market, although it is worth keeping a close eye on the bullish risks for Bitcoin.
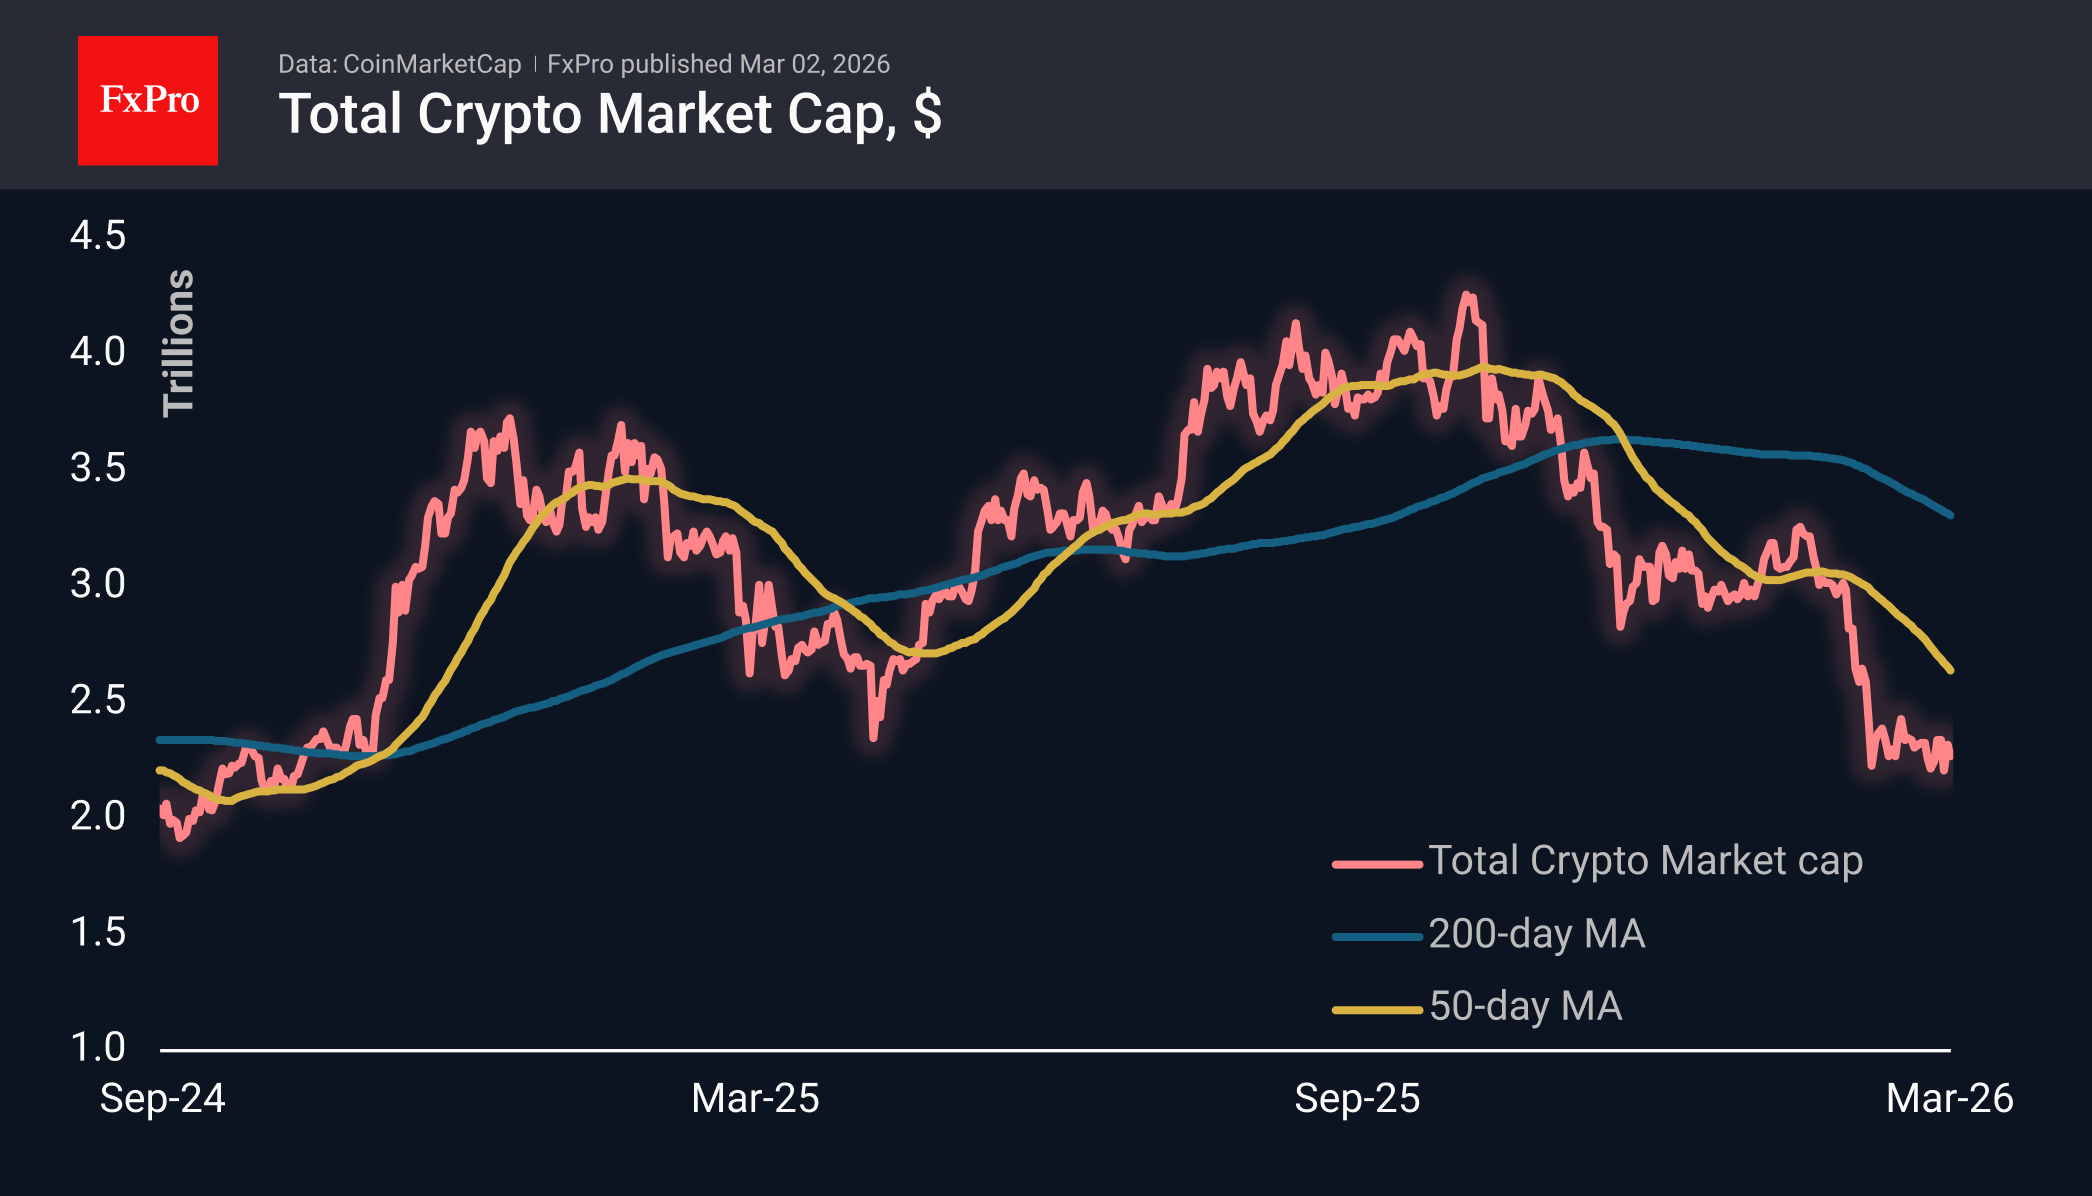
The first cryptocurrency fell to $63K over the weekend, soon rebounding to $66K, where it currently stands. In the current geopolitical situation, playing it safe is the best short-term strategy for Bitcoin. It may be wiser to let more established markets such as oil, gold and bonds take the lead during periods of geopolitical tension. In addition, the current wait-and-see attitude towards BTC is fully justified by technical factors and was anticipated by us weeks ago, as this area was an important resistance zone in 2024.
Bitcoin fell 14.1% in February to $67K, continuing its decline for the fifth consecutive month. This is the second time in history that BTC has fallen for five months in a row — the first was at the end of 2018. From a seasonal perspective, March is one of the three worst months of the year. Over the past 15 years, Bitcoin has ended this month with a decline in nine cases and only six times with an increase. The average decline was 13.5%, while the average increase was 14.2%.
News Background
In February, investors withdrew a modest $0.21 billion from spot Bitcoin ETFs in the US, amid a price decline of approximately 17%. Nevertheless, the outflow from the funds continues for a record four months in a row. Investors withdrew $0.37 billion from spot Ethereum ETFs in the US in February. This was against the backdrop of a nearly 23% drop in price over the month.
Inflows into spot Solana ETFs in the US amounted to $63 million in February, reaching $934 million. Inflows into US spot XRP ETFs totalled $58 million in February, bringing total assets to $1.24 billion.
The end of Bitcoin’s bearish trend is more likely in the fourth quarter of 2026, with a return to growth in the first half of 2027, according to analyst Willy Woo. In his opinion, the potential low in the current cycle could be $45,000.
Bitcoin miner MARA reported a loss of $1.7 billion for the fourth quarter of 2025. MARA presented a strategy for a gradual transition from BTC mining to projects related to artificial intelligence (AI).
Mark Karpeles, former CEO of the bankrupt MtGox exchange, proposed a one-time change to the Bitcoin network’s consensus rules that would allow the return of approximately 80,000 BTC stolen from the platform in 2011.
WTI Oil Trading Opens with a 10% Bullish Gap
On Friday, we warned that trading on Monday could be volatile — but not to this extent! The situation sharply escalated over the weekend following a large-scale strike by Israel and the US on targets in Iran, during which the supreme leader Ali Khamenei was reportedly killed. In retaliation, Iran launched missiles and drones at Israel, Saudi Arabia, and other targets.
Although financial markets had priced in some escalation risks, they reacted very sensitively:
→ Gold (XAU/USD): the price surged above $5,400 per ounce.
→ US Dollar Index (DXY): the US currency strengthened, not only as a safe-haven asset but also amid expectations of a new wave of global inflation driven by higher fuel costs.
→ Equity indices: opened sharply lower. Airlines and the tech sector were hit hardest, while defence stocks rose against the broader market.
→ Oil: showed the most aggressive reaction, with WTI opening at a bullish gap of roughly 10% compared with Friday’s close.
Shipping in the Strait of Hormuz (through which around 20% of global oil supply passes) is effectively paralysed following attacks on tankers. As shown on the XTI/USD chart, barrel prices are fluctuating widely as traders attempt to determine a fair value under these extraordinary circumstances.
Technical Analysis of XTI/USD
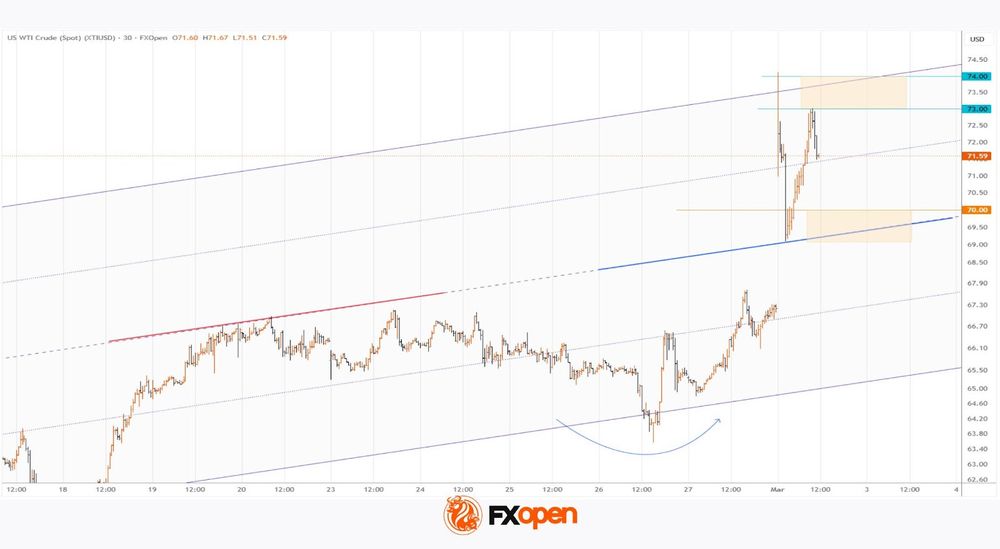
Three days ago, we drew an ascending channel on the oil price chart, which has held up:
- → its upper boundary acted as resistance at Monday’s open;
- → its median pushed the price upwards.
Bearish perspective:
- → following the bullish gap, prices failed to continue higher and fell sharply;
- → the round level of $73 acted as resistance.
Bullish perspective:
- → the channel median previously acted as resistance but now serves as support;
- → the psychological level of $70 favours buyers.
It is reasonable to expect WTI oil to remain volatile within a broad $70–73 range, with price impulses largely driven by political statements regarding escalation in the Middle East.
Start trading commodity CFDs with tight spreads (additional fees may apply). Open your trading account now or learn more about trading commodity CFDs with FXOpen.
This article represents the opinion of the Companies operating under the FXOpen brand only. It is not to be construed as an offer, solicitation, or recommendation with respect to products and services provided by the Companies operating under the FXOpen brand, nor is it to be considered financial advice.
UK PMI manufacturing finalized at 51.7, strong output and export growth
UK PMI Manufacturing was finalized at 51.7 in February, easing marginally from January’s 17-month high of 51.8 but remaining firmly in expansion territory. The data suggest that the sector has made an "encouraging start" to 2026, with output rising at the fastest pace in 17 months as new orders improved across both "home and overseas markets".
According to Rob Dobson at S&P Global Market Intelligence, growth in new export business reached a four-and-a-half year high, supported by stronger client confidence in North America, mainland China, the EU and the Middle East. The rebound in external demand has helped offset lingering weakness seen through much of last year, giving manufacturers renewed momentum.
Business optimism remains elevated, close to January’s recent peak, with nearly three-fifths of firms expecting to raise production over the coming year. While staffing levels continue to decline, the pace of job losses has moderated to the weakest in the current 16-month downturn, pointing to early signs of stabilization.
EUR/USD Reacts to Geopolitics and Data: Week Opens Nervously
EUR/USD rose to 1.1790 on Monday. The US dollar attempted to strengthen, but part of its rally was subsequently pared back. Demand for safe-haven assets intensified over the weekend amid an escalation of the conflict in the Middle East.
The US and Israel conducted strikes on Iran, resulting in the death of the country’s supreme leader, Ayatollah Ali Khamenei. Reports also emerged of the effective closure of the Strait of Hormuz, a crucial route for global oil supplies. Tehran has responded with attacks on American targets in the region, fuelling fears of a broader conflict.
Additional support for the dollar came from US producer inflation data. January’s PPI rose more sharply than expected, suggesting that companies are passing on tariff-related costs to consumers, which complicates the outlook for a potential Federal Reserve rate cut.
Nevertheless, the market continues to price in two 25-basis-point rate cuts from the Fed this year. The prevailing sentiment is that volatility and geopolitical risks could eventually force the central bank to ease its monetary policy.
Technical Analysis
On the H4 chart of EUR/USD, the market is forming a consolidation range around the 1.1834 level. A downside breakout is expected, with the decline continuing to 1.1712, and the potential for the trend to extend further to 1.1590. Technically, this bearish scenario is confirmed by the MACD indicator, whose signal line is below zero and pointing firmly downwards, reflecting sustained bearish momentum.
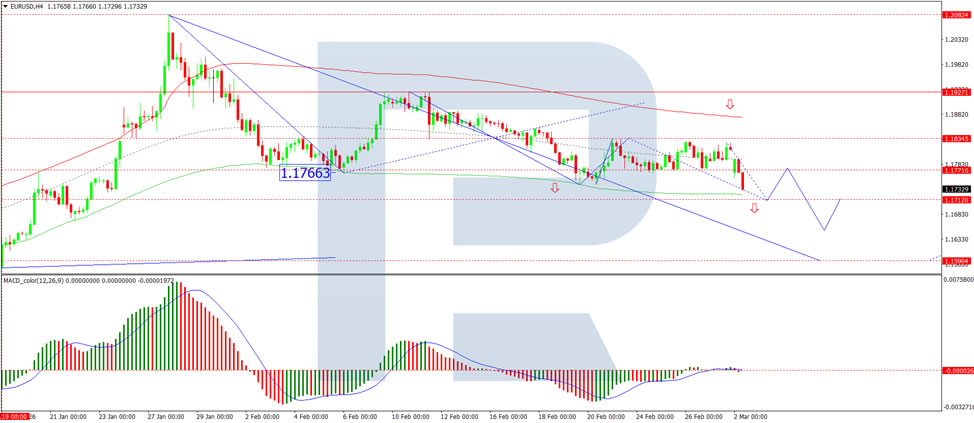
On the H1 chart, the market is forming the structure of the next downward wave towards 1.1712. After reaching this level, a corrective rise to 1.1768 is anticipated, followed by the start of a new downward wave to 1.1650. Technically, this scenario is supported by the Stochastic oscillator, with its signal line below 50 and pointing firmly downwards towards the 20 level.
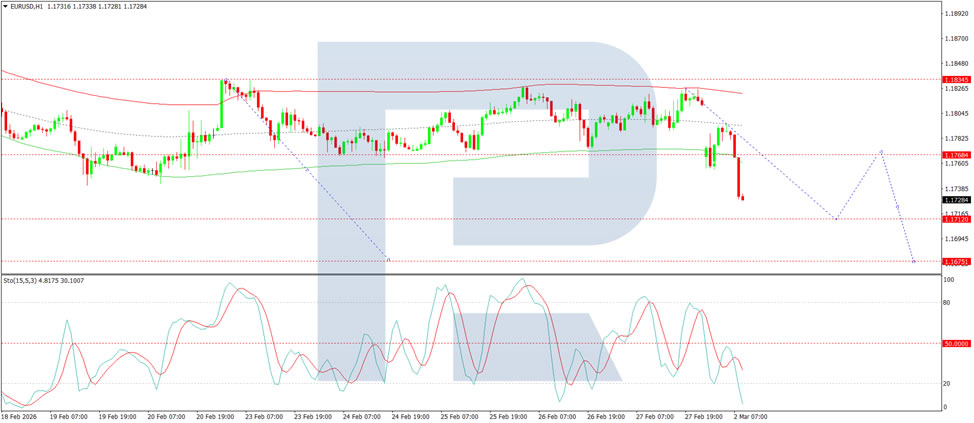
Conclusion
The euro is navigating a complex landscape, with safe-haven flows and geopolitical tensions in the Middle East initially boosting the US dollar, while hotter-than-expected US PPI data adds another layer of uncertainty to Fed policy. Although the market still anticipates rate cuts later this year, the immediate technical outlook for EUR/USD appears bearish, suggesting further downside in the short term.
Geopolitical Shock: Gold Price Storms $5,400 After Attack on Iran
The reason is clear: confirmed US and Israeli strikes on targets in Iran, including reports of the death of Supreme Leader Ali Khamenei, have triggered renewed demand for safe-haven assets, pushing gold prices higher.
As of Monday morning, news of further escalation continues to emerge, while the price per ounce has climbed above the $5,400 level — for the first time since late January. Analysts (including J.P. Morgan and Bank of America) are already revising their targets. In their view, if the price consolidates above $5,400, this could point to a move towards $6,000 by the end of 2026.
Technical Analysis of the XAU/USD Chart
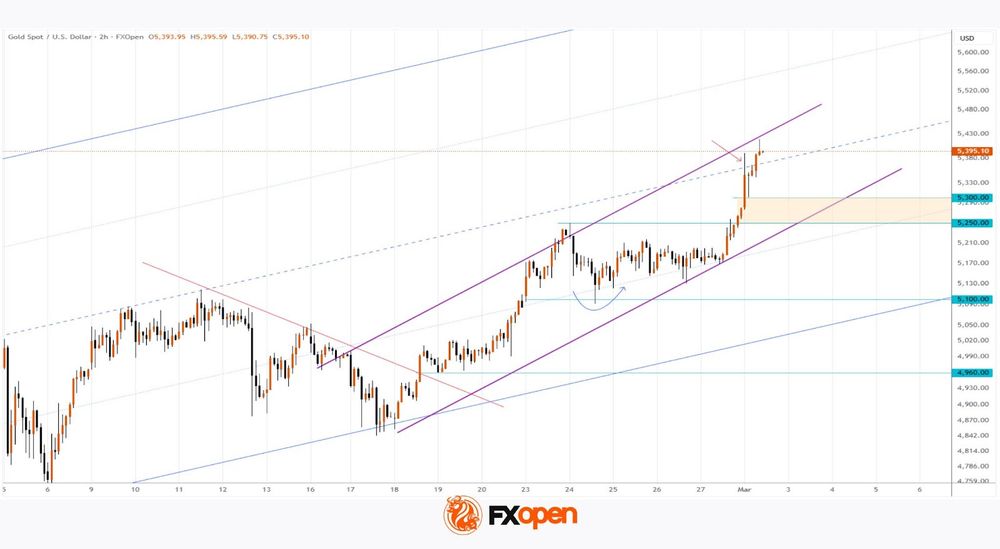
On 23 February, when analysing gold price movements, we confirmed that the long-term ascending channel remained in force and suggested that:
- → bulls would attempt to reach the median of the channel;
- → if gold were to pull back, the $5,100 level would act as support.
Indeed, both assumptions materialised. As indicated by the arrows:
- → on 24 February, the price rebounded from the stated support level;
- → this morning, the price reached the median. At the first test, bears showed aggression, but extraordinary geopolitical risks pushed the quotation into the upper half of the channel.
It is worth noting that the price has left behind:
- → the psychological $5,300 mark;
- → the $5,250 level, which acted as resistance in February (and may now be expected to provide support).
At the same time, nearby resistance is formed by a local ascending channel (shown in purple), constructed using February’s price extremes on the XAU/USD chart.
It cannot be ruled out that, following the shocking news over the weekend, market emotions may subside, leading to a pullback in gold prices. In that case, support may emerge in the $5,250–5,300 area, where the lower boundary of the purple uptrend line is located.
Start trading commodity CFDs with tight spreads (additional fees may apply). Open your trading account now or learn more about trading commodity CFDs with FXOpen.
This article represents the opinion of the Companies operating under the FXOpen brand only. It is not to be construed as an offer, solicitation, or recommendation with respect to products and services provided by the Companies operating under the FXOpen brand, nor is it to be considered financial advice.
Eurozone PMI manufacturing finalized at 50.8, turning corner with broad-based recovery
Eurozone PMI Manufacturing was finalized at 50.8 in February, rising from January’s 49.5 and marking a 44-month high. The move above also the 50 threshold signals a return to expansion for the bloc’s factory sector.
The rebound appears increasingly broad-based. Greece (54.4) and Ireland (53.1) led growth, while Germany climbed to 50.9, its highest level in nearly four years and back in expansion for the first time in three-and-a-half years. Netherlands, Italy, France and Spain also hovered around or above the growth line, with Austria the only country still below 50. Among the major economies, Germany is now showing the fastest improvement in manufacturing conditions.
According to Cyrus de la Rubia, Chief Economist at Hamburg Commercial Bank, the data point to a "broad-based recovery", with six of eight surveyed countries now in growth territory. However, input price pressures accelerated for a fourth consecutive month and picked up sharply in February. While companies were able to pass on part of these increases, margins likely remained under strain.
Encouragingly, firms expressed growing optimism about future sales and production. Expectations for output improved further compared to January, suggesting confidence that demand conditions will strengthen in coming months.