Sample Category Title
US retail sales down -1.1% mom in Dec, ex-auto sales down -1.1% mom
US retail sales declined -1.1% mom to USD 677.1B in December, worse than expectation of -0.8% mom. Ex-auto sales dropped -1.1% mom to USD 552.7B, versus expectation of -0.5% mom. Ex-gasoline sales fell -0.8% mom to USD 617.6B. Ex-auto and gasoline sales contracted -0.7% mom to USD 493.1B.
Total sales for the 12 months of 2022 were up 9.2% from 2021. For the October through December period, sales were up 6.7% from the same period a years ago.
Eurozone CPI finalized at 9.2% yoy in Dec, core CPI at 5.2% yoy
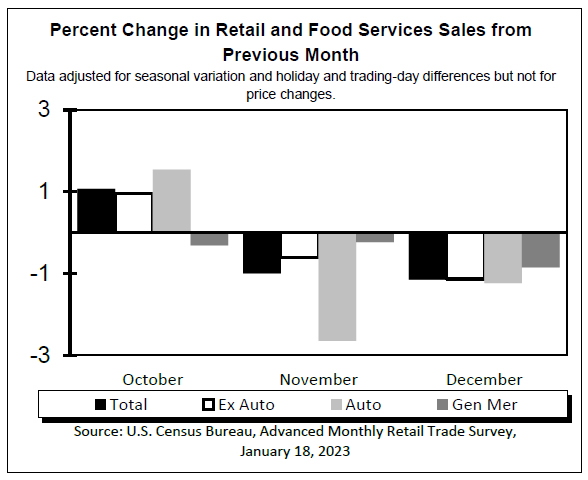
Eurozone CPI was finalized at 9.2% yoy in December, down from November's 10.1% yoy. CPI core (ex energy, food, alcohol & tobacco) was finalized at 5.2% yoy, up from prior month's 5.0% yoy. The highest contribution came from food, alcohol & tobacco (+2.88%), followed by energy (+2.79%), services (+1.83%) and non-energy industrial goods (+1.70%).
EU CPI was finalized at 10.4% yoy, down from prior month's 11.1% yoy. The lowest annual rates were registered in Spain (5.5%), Luxembourg (6.2%) and France (6.7%). The highest annual rates were recorded in Hungary (25.0%), Latvia (20.7%) and Lithuania (20.0%). Compared with November, annual inflation fell in twenty-two Member States, remained stable in two and rose in three.
XAG/USD: Bullish Trend Likely to Continue to 25.701
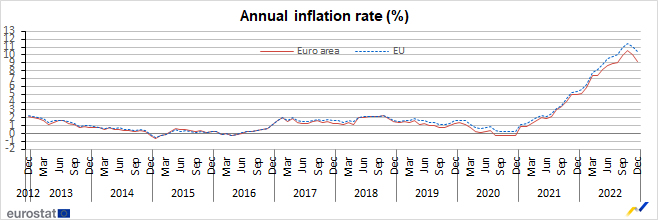
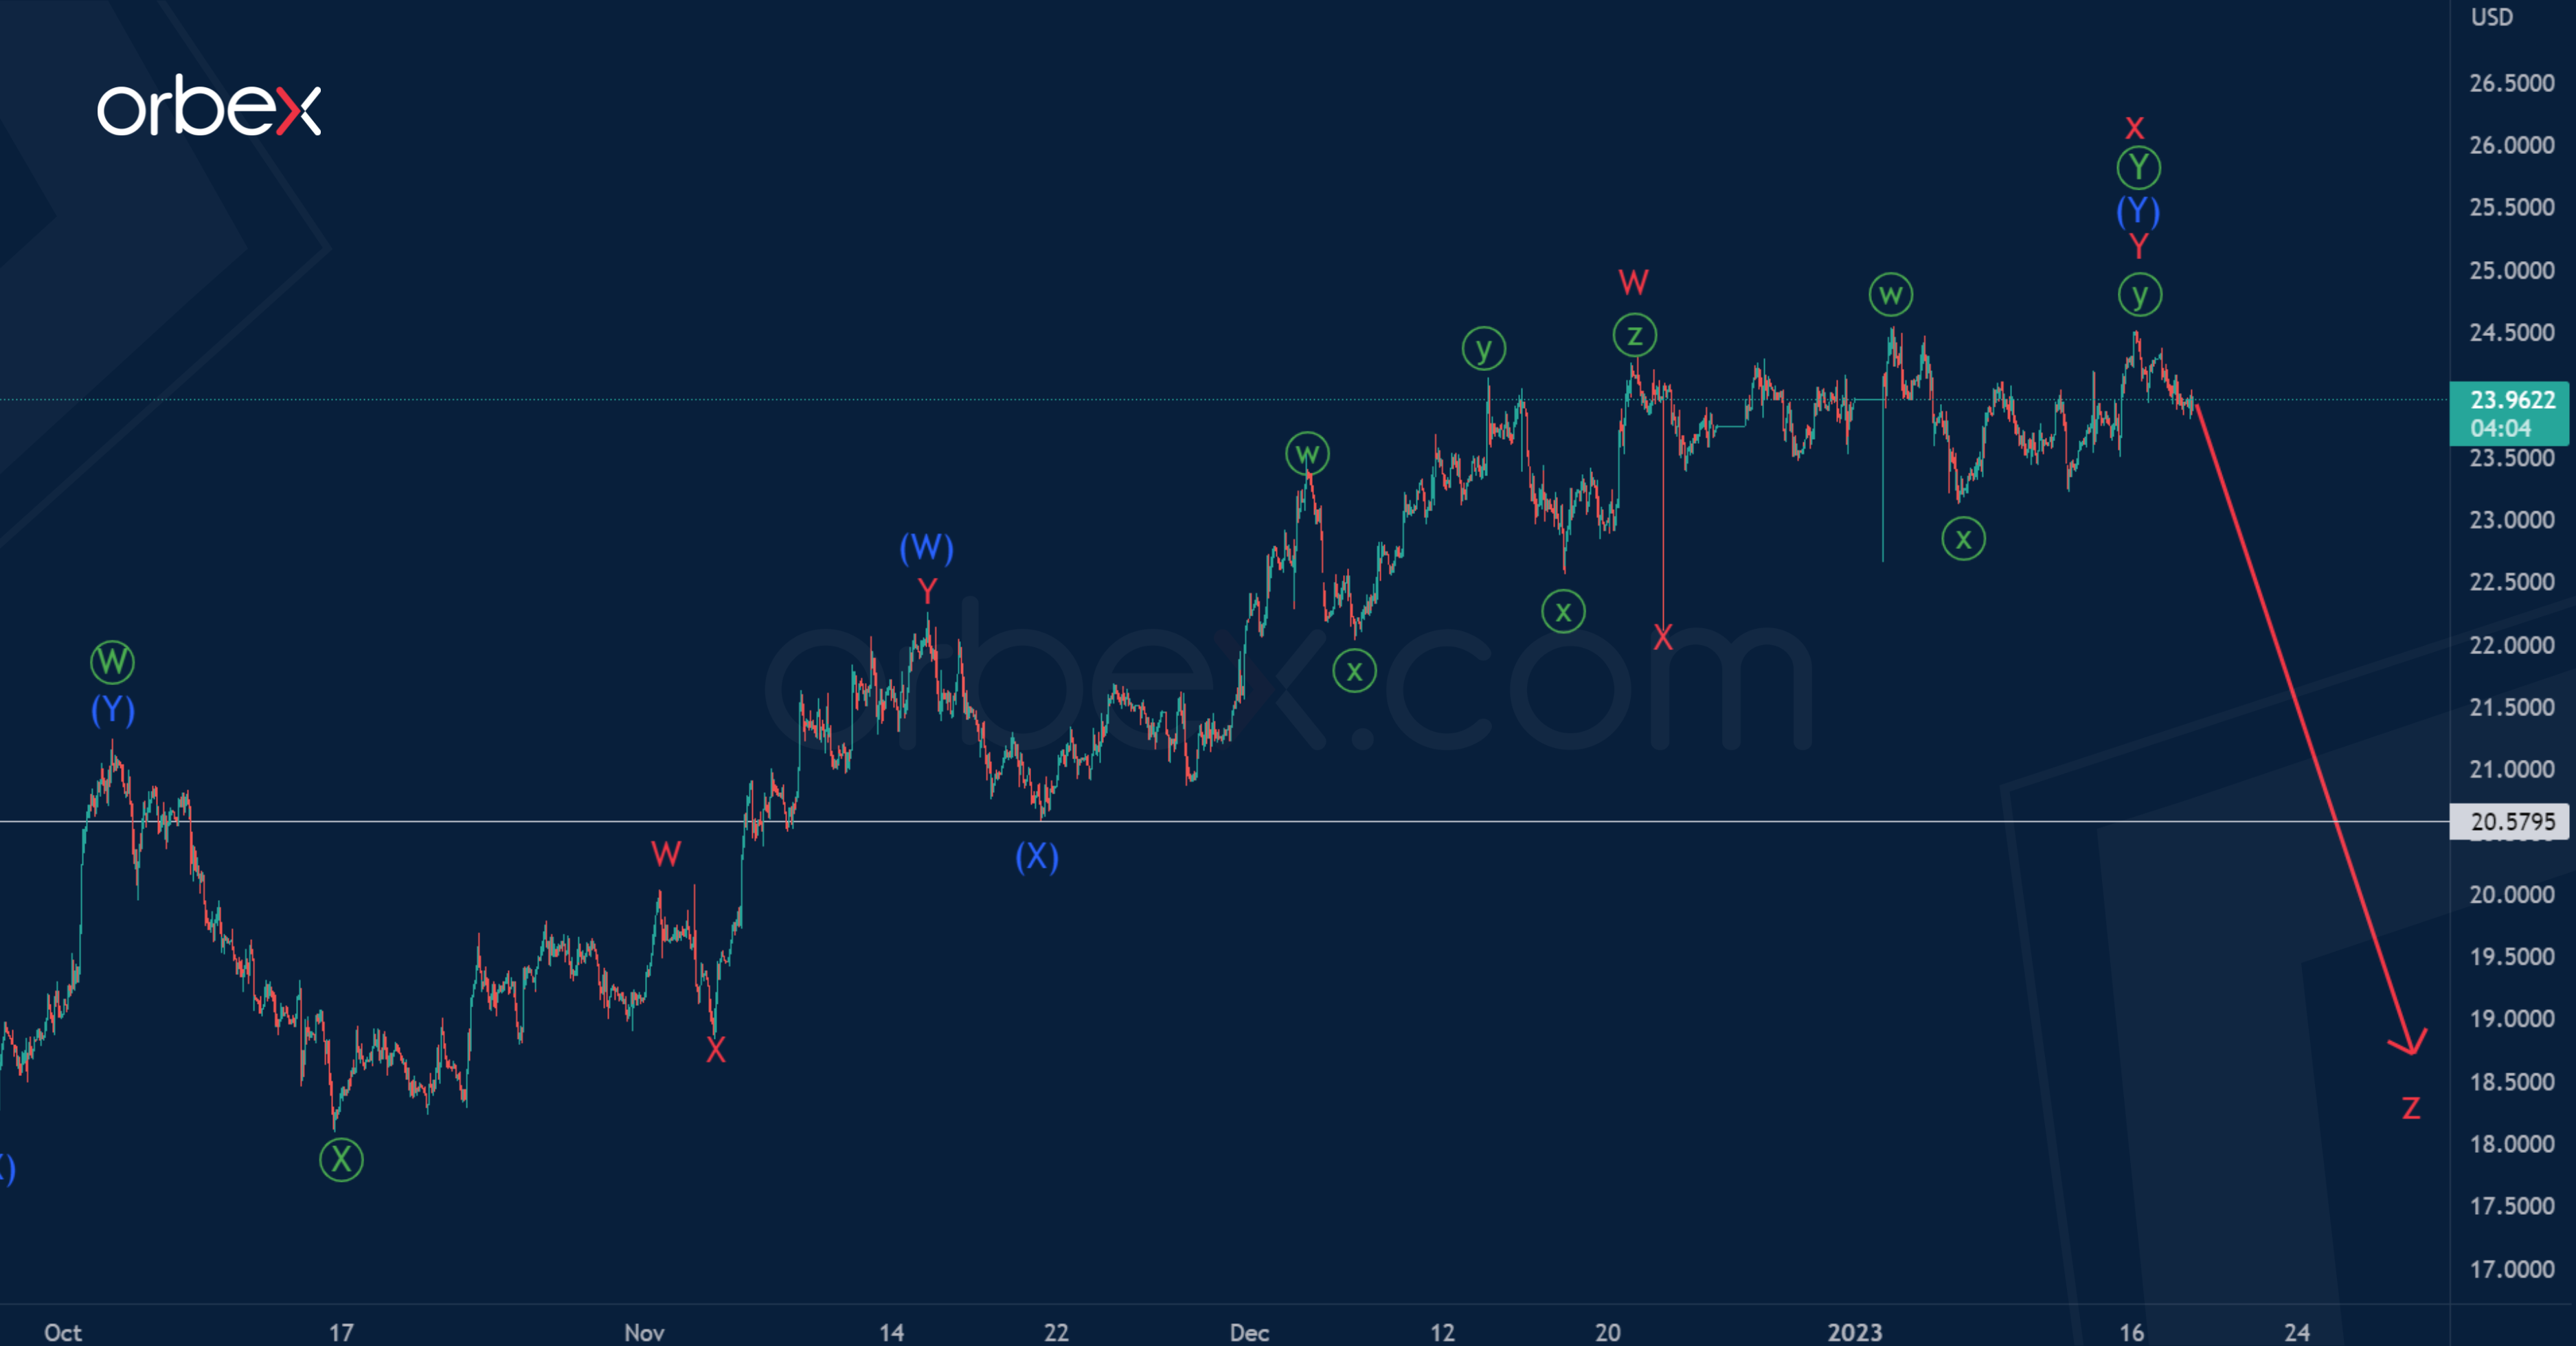
XAGUSD suggests the formation of a global triple zigzag consisting of cycle waves w-x-y-x-z.
The current chart shows the marking of the second intervening wave x, which may soon be completed, taking the form of a double zigzag of the primary degree Ⓦ-Ⓧ-Ⓨ.
The bullish wave Ⓨ consists of intermediate waves (W)-(X)-(Y), where the last sub-wave (Y) has not yet been completed.
In the near future, growth is expected to continue within the minor wave Y to 25.701. At that level, intermediate wave (Y) will be at 123.6% of wave (W).
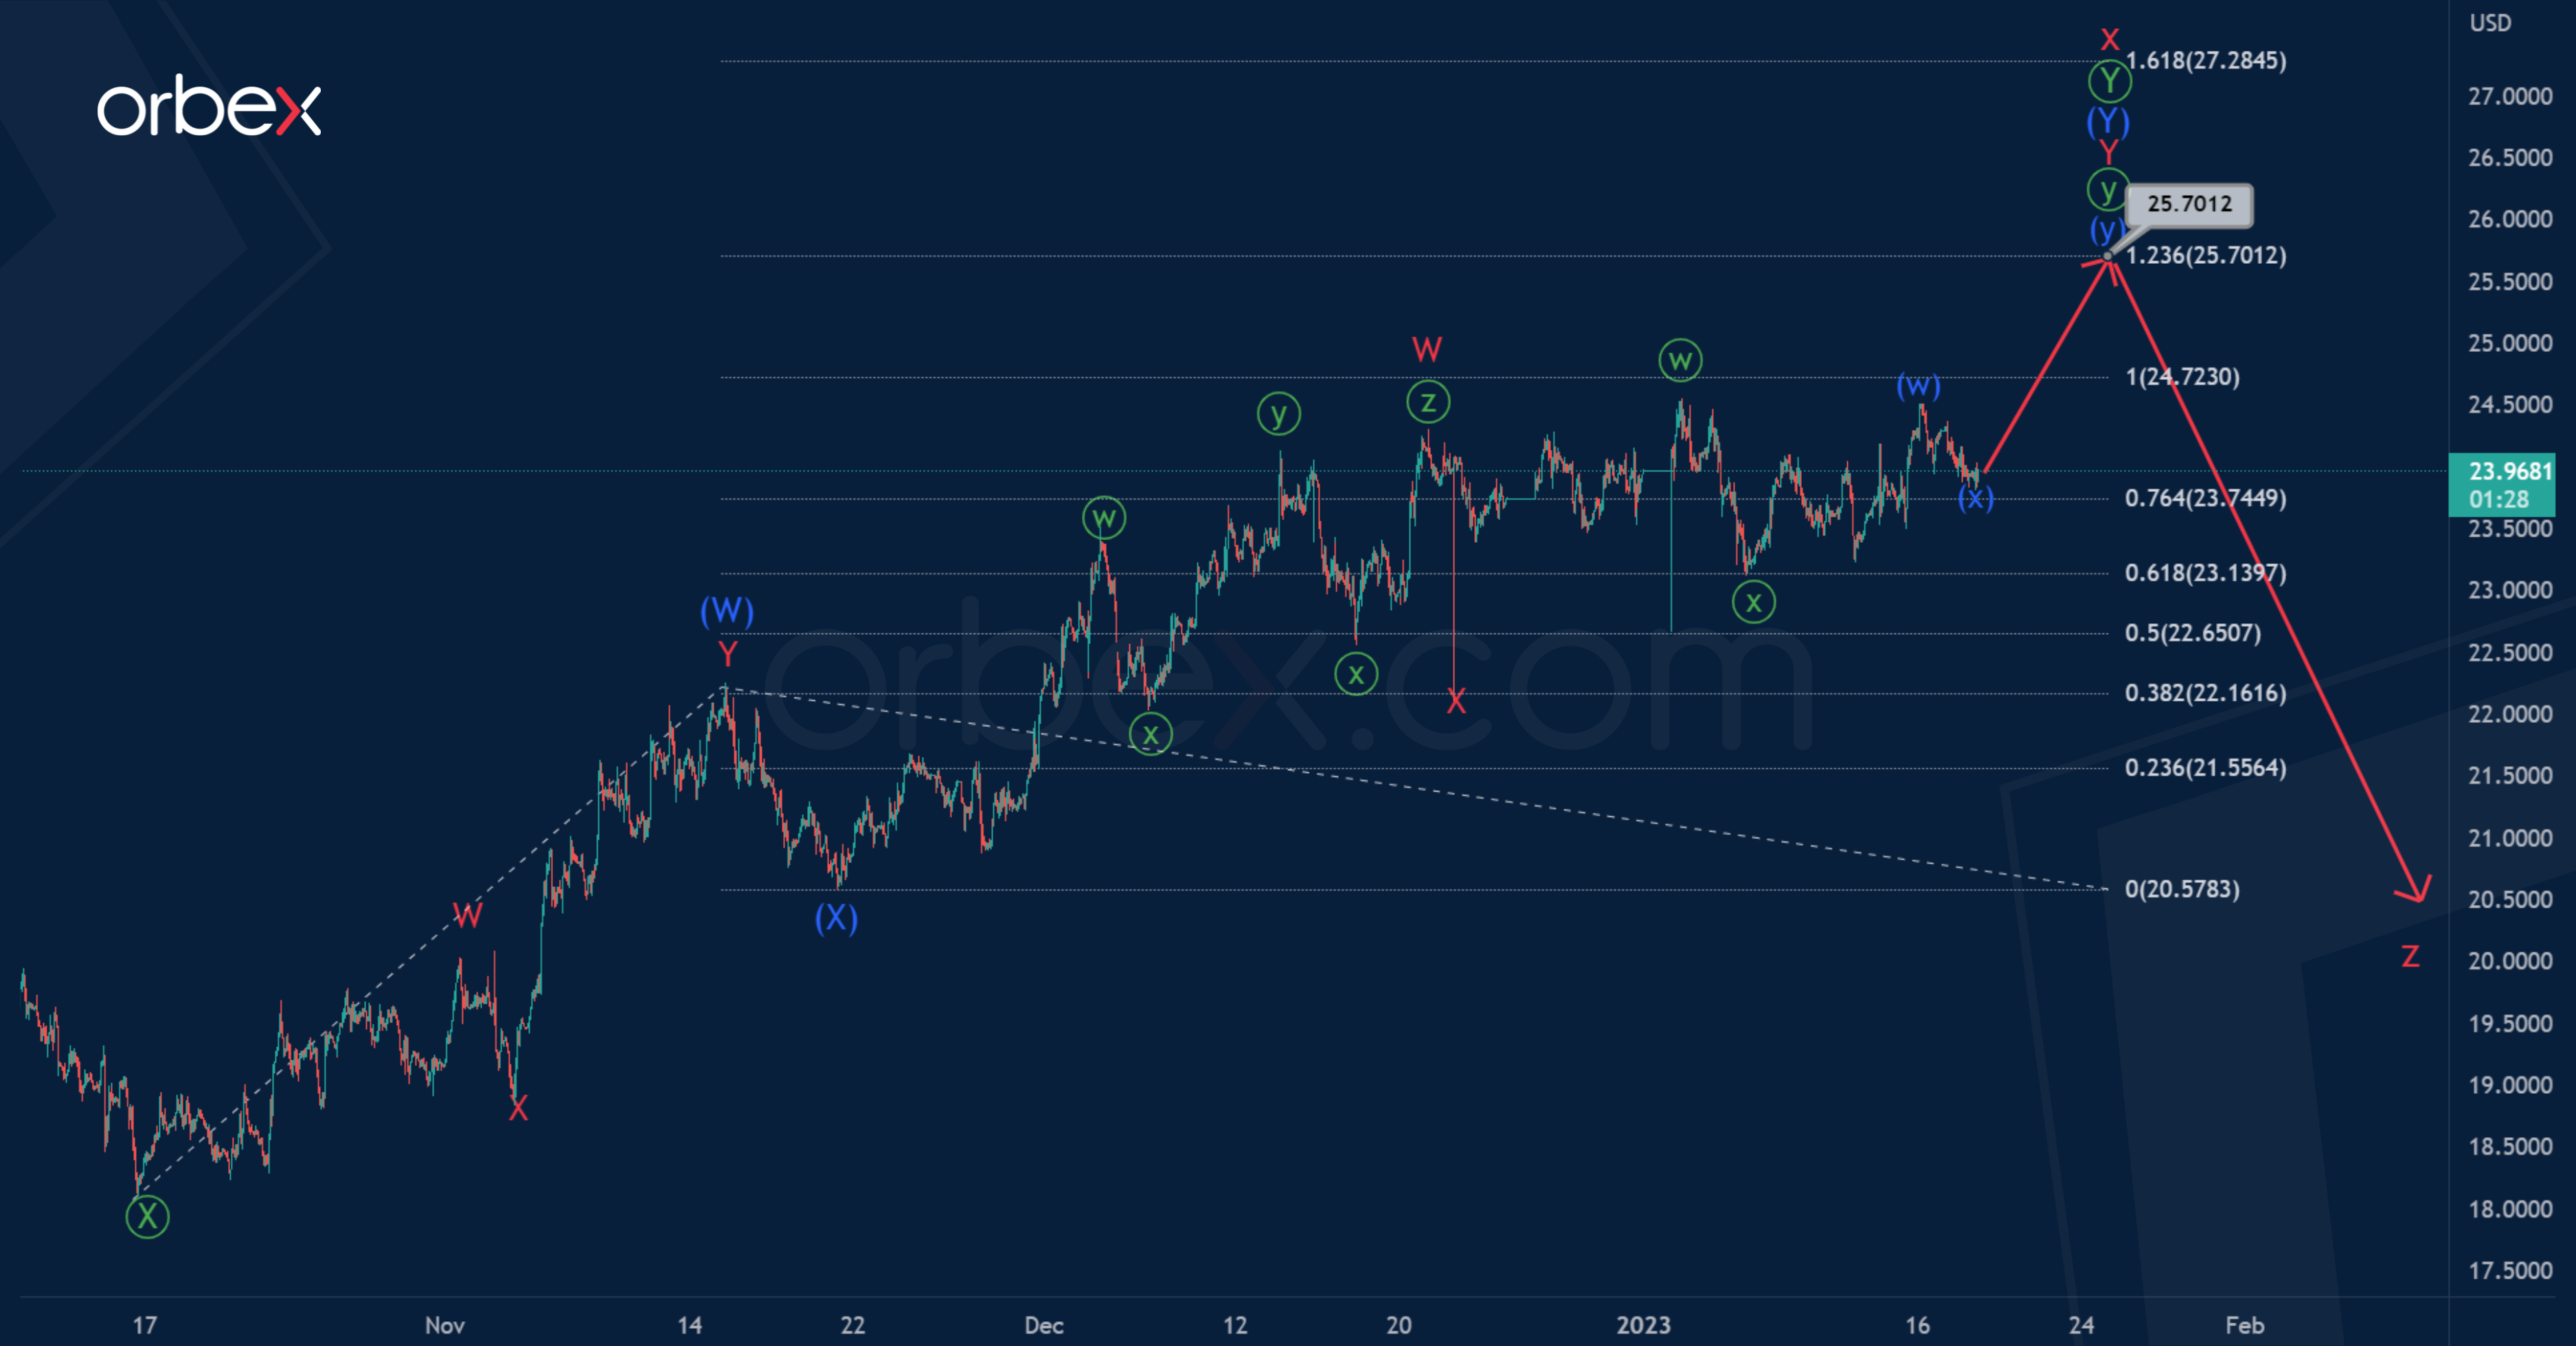
According to the alternative, the formation of the cycle intervening wave X can already be fully completed.
Its last actionary wave [Y] also looks like a double zigzag (W)-(X)-(Y). The minute sub-waves ⓦ and ⓨ are completed at the same level.
Thus, in the last section we see the initial part of a new bearish wave z of the cycle degree.
If this option is confirmed, market participants may expect a price drop to a minimum of 20.579, and then even lower.
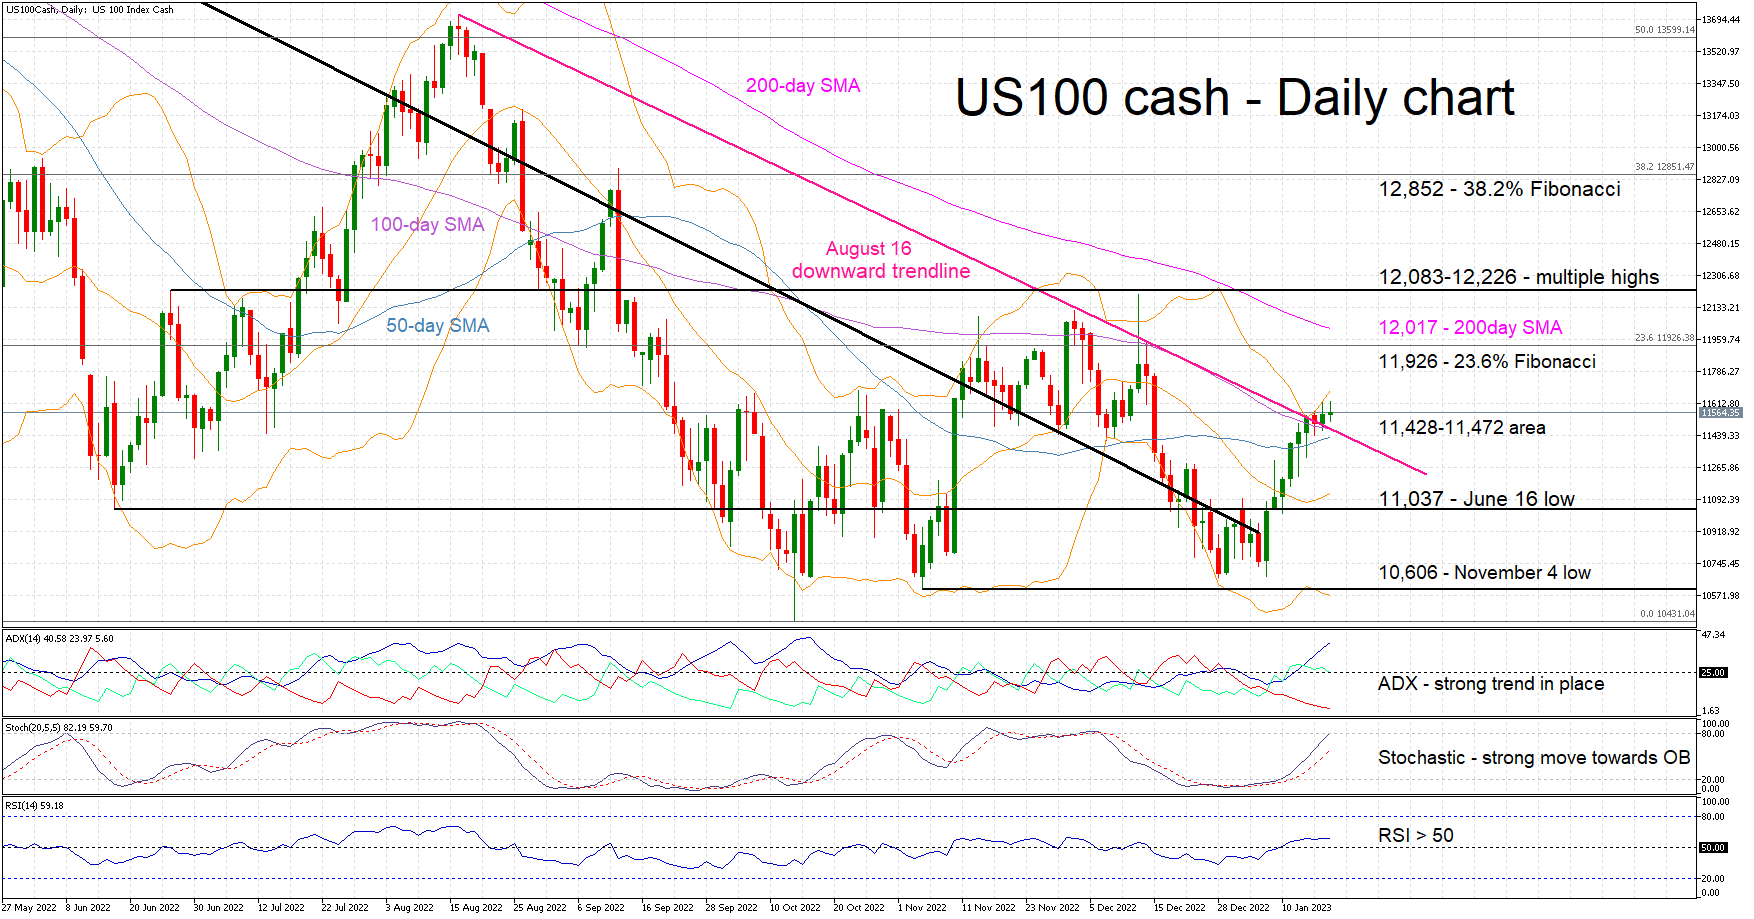
US 100 Cash Index Trades Sideways Following Strong Start to New Trading Year
The US 100 cash index is trading sideways following a climb of 900 points since December 28. This upward move appears to enjoy the universal support of the momentum indicators. The Average Directional Movement Index (ADX) is moving aggressively higher, and the stochastic oscillator is just below its overbought territory. Even the usually conservative RSI is hovering comfortably above the 50-midpoint.
The recent move higher has pushed the US 100 index above both the 50- and 100-day simple moving averages (SMAs) and the August 16 downward sloping trendline, potentially confirming the bulls’ determination. However, when the market is sending such a homogenous message, chances are that something could break soon, signaling a potential trend change.
Should the bulls continue to push the market higher, the first resistance could come at the 23.6% Fibonacci retracement level of the November 22, 2021 – October 13 downtrend of 11,926. The 200-day SMA at 12,017 and the 12,083-12,226 range could potentially trouble the bulls then.
On the other hand, the bears' first move could be to push the US 100 index below the 11,428-11,472 area, populated by SMAs and the August 16 downward trendline. Upon successfully breaking this area, they could aim for the June 16 low of 11,037.
To sum up, the move higher enjoys the universal support of the market indicators, but the bears could try to reassert their position in the market by pushing the index below 11,428.
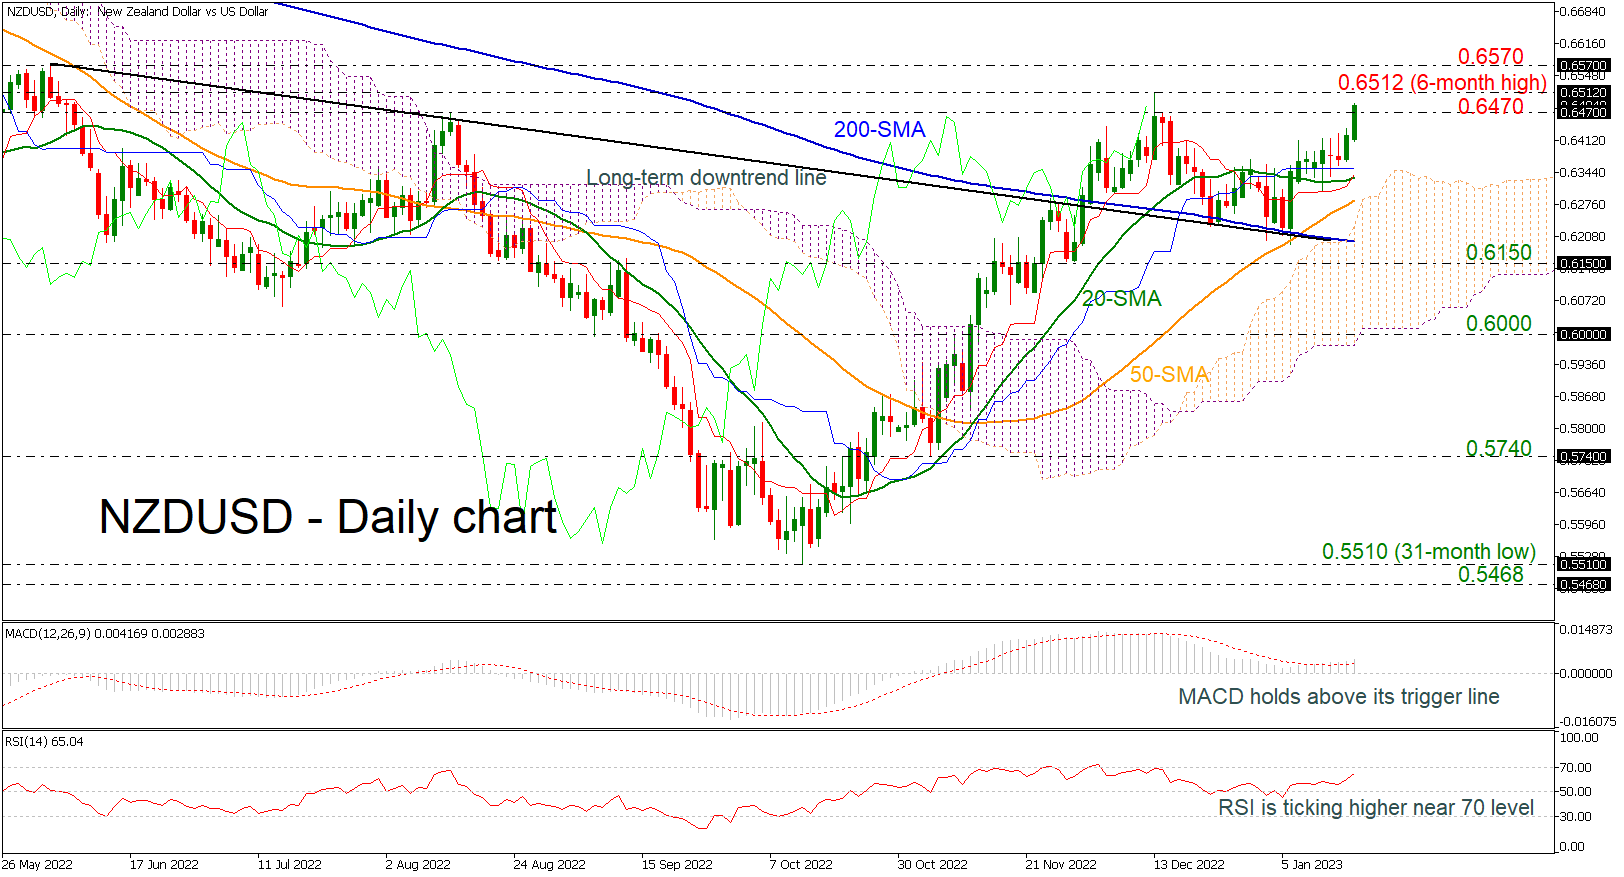
NZDUSD Bulls Face Big Challenge Around 0.6500
NZDUSD continues to rise above the Ichimoku cloud and the short-term simple moving averages (SMAs), remaining above the long-term downtrend line. According to the MACD, positive momentum could push for further gains as the indicator picks up steam above its red signal line. The RSI is also advancing, though, it is relatively close to the 70 overbought threshold.
More increases could drive the market towards the six-month high of 0.6512 ahead of the 0.6570 barrier, registered on May 29. Even higher, the price could challenge the 0.7170 resistance, taken from the peak in August 2021.
A reversal to the downside could stall at the 20- and the 40-day SMAs at 0.6330 and 0.6285 respectively before entering into the Ichimoku cloud and testing the crucial 200-day SMA at 0.6200. Further below, the 0.6150 support could also provide support, shifting the outlook back to bearish.
Regarding the long-term picture, the bullish outlook has built up as the pair continues to hold above the descending trend line.
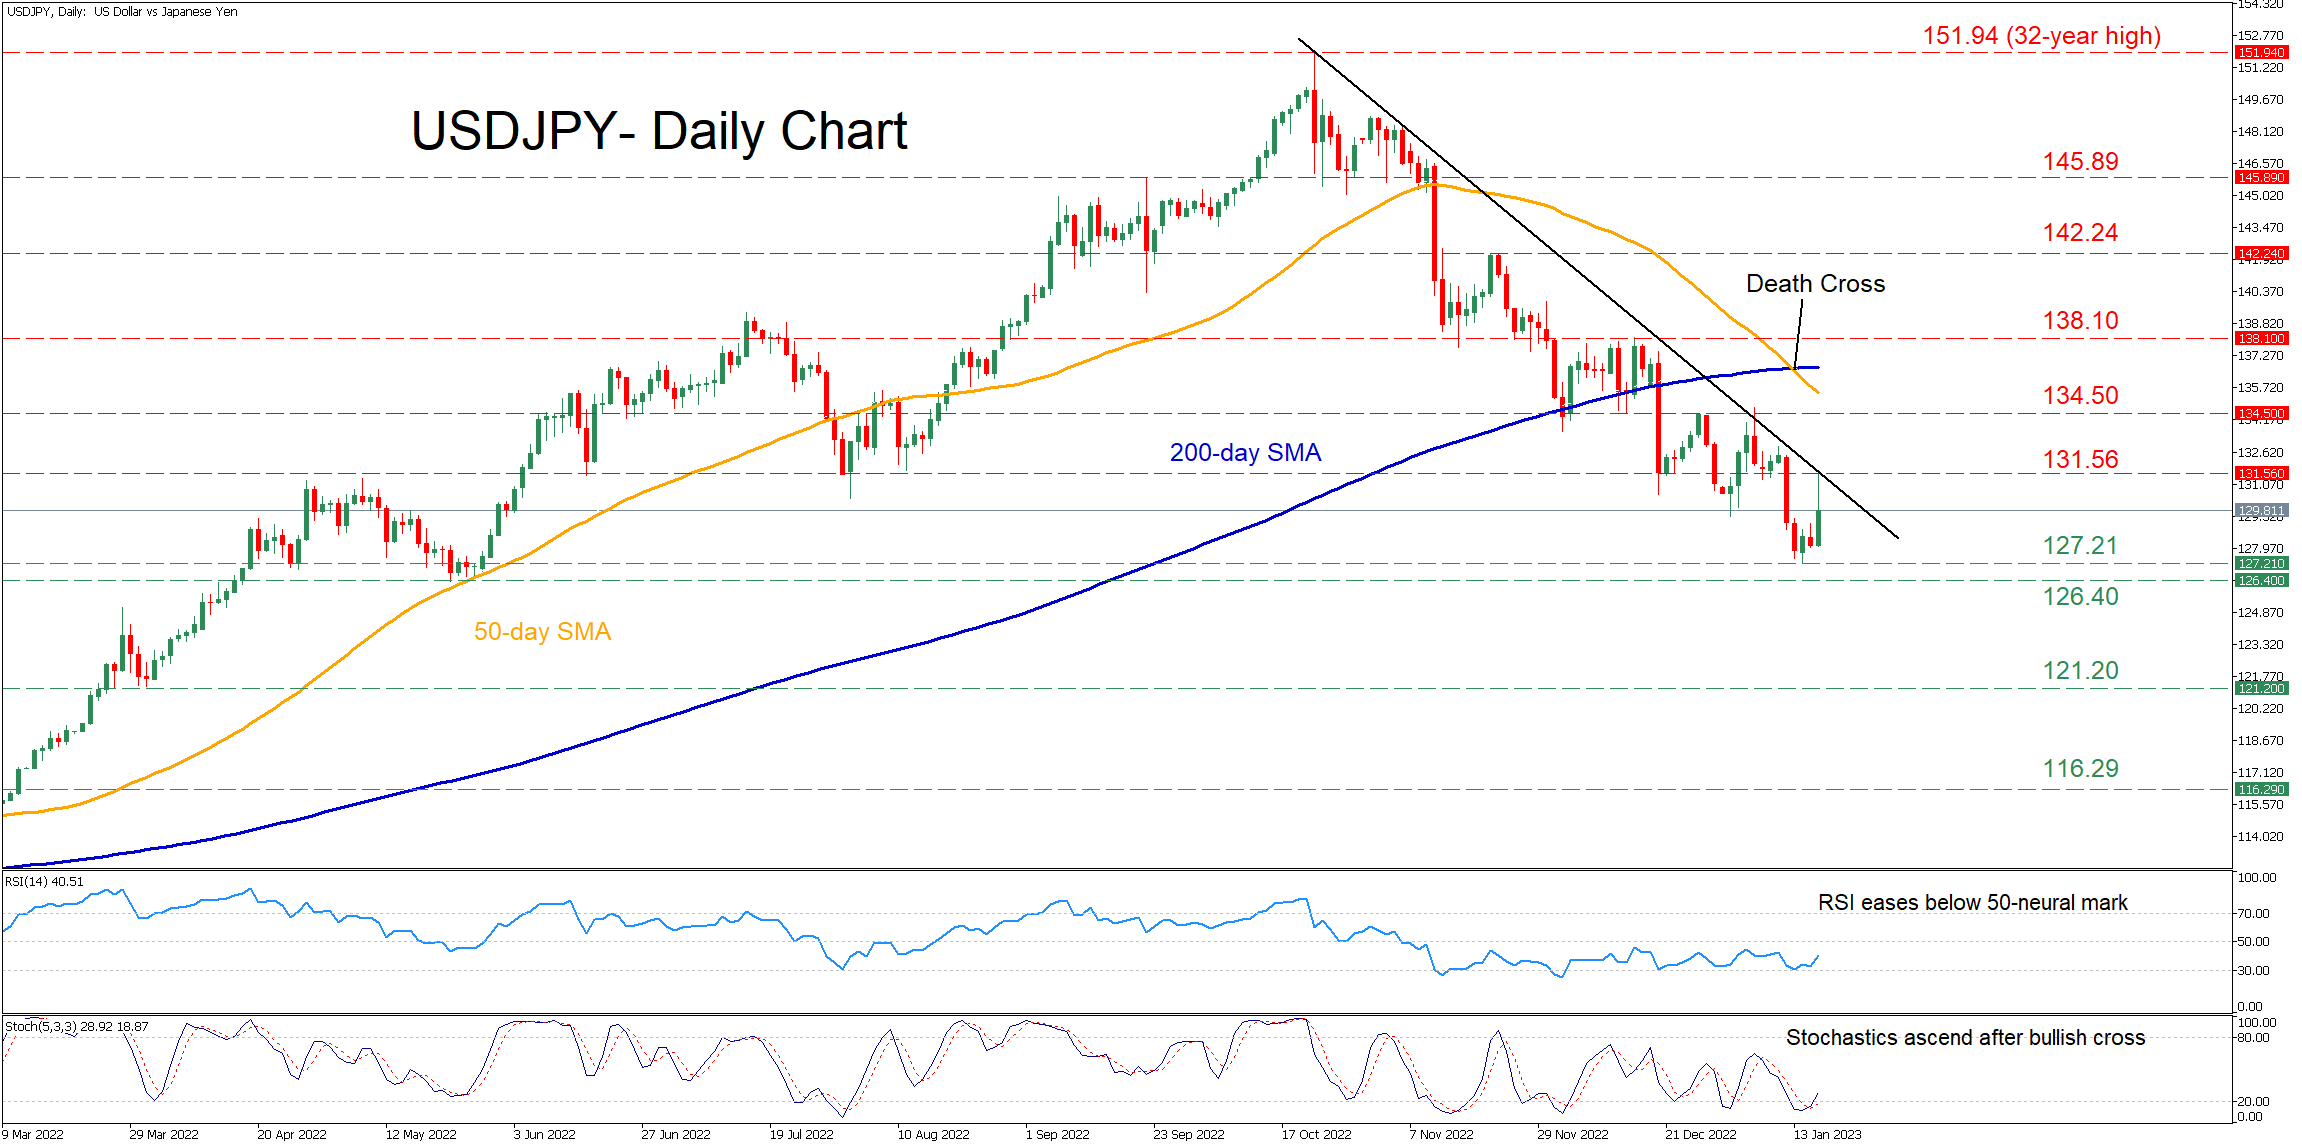
USDJPY Remains Suppressed by Restrictive Trendline
USDJPY realized massive gains in the past year, marching to a 32-year high of 151.94 in mid-October. Nevertheless, the pair has been experiencing a prolonged pullback since then, with the price hitting a fresh seven-month low of 127.21 before recouping some losses.
The momentum indicators currently suggest that bearish pressures are subsiding. Specifically, the RSI is ascending steeply but remains below the 50-neutral mark, while the stochastic oscillator is edging higher after posting a bullish cross in the oversold zone.
Should buying pressures intensify, the price could test the recent peak of 131.56, which overlaps with the descending trendline formed from the pair’s recent downside correction. Breaking above that zone, the bulls could aim for 134.50 before the spotlight turns to the December resistance region of 138.10. Even higher, the 142.24 hurdle could prove to be a tough one for the price to overcome.
On the flipside, if the price extends its retreat, the seven-month low of 127.21 might act as the first line of defense. Sliding beneath that floor, the pair could descend to challenge the May low of 126.40. Failing to halt there, the March support of 121.20 may provide downside protection.
In brief, USDJPY appears to be regaining some lost ground despite the completion of a death cross between the 50- and 200-day simple moving averages (SMAs). Hence, downside pressures could intensify in case the descending trendline rejects this latest bounce.
ECB Villeroy: Lagarde’s 50bps guidance still valid
ECB Governing Council member Francois Villeroy de Galhau said "we will have good news on headline inflation because energy prices are going down,"
But on interest rates, he said President Christine Lagarde's earlier 50bps guidance is "still valid". He added that it's too early to speculate on the size of March rate hike.
Also, Villeroy emphasized, "we must stay the course in battle against inflation", adding, he "cannot say where the terminal rate will be but should be there by the summer."
GBP/USD Pair Now Consolidating Near 1.2280
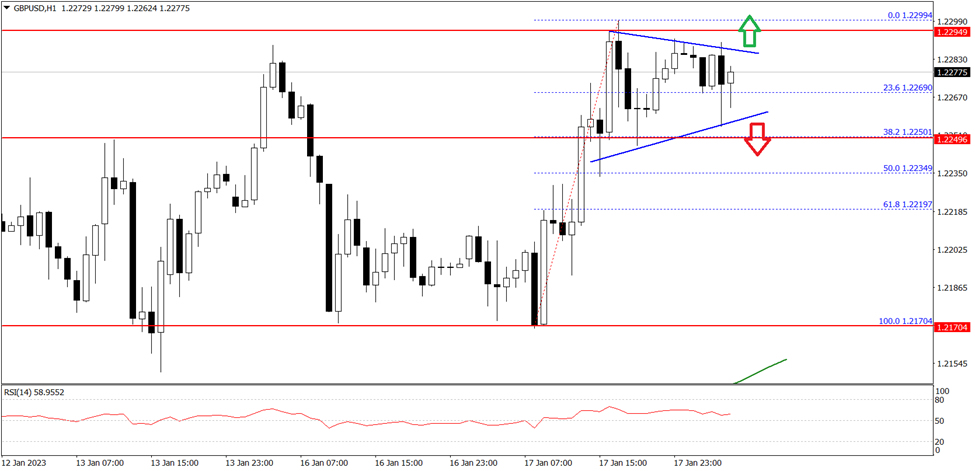
The British Pound started a fresh increase above the 1.2220 resistance zone against the US Dollar. The GBP/USD pair climbed above the 1.2250 resistance zone to move into a positive zone.
The pair even settled above the 1.2250 level and the 50 hourly simple moving average. It is now consolidating near the 1.2280 level, with an immediate resistance at 1.2290.
The first major resistance is near the 1.2300 level. If there is a clear upside break above the 1.2300 resistance, the pair could rise steadily towards the 1.2350 level in the near term. The next major resistance sits near 1.2420 on FXOpen.
On the downside, the first major support is near the 1.2265 level. The main support is forming near the 1.2250 level. A break below the 1.2250 support could push the pair towards the 1.2200 support.
FTSE 100 Keeps High Ground
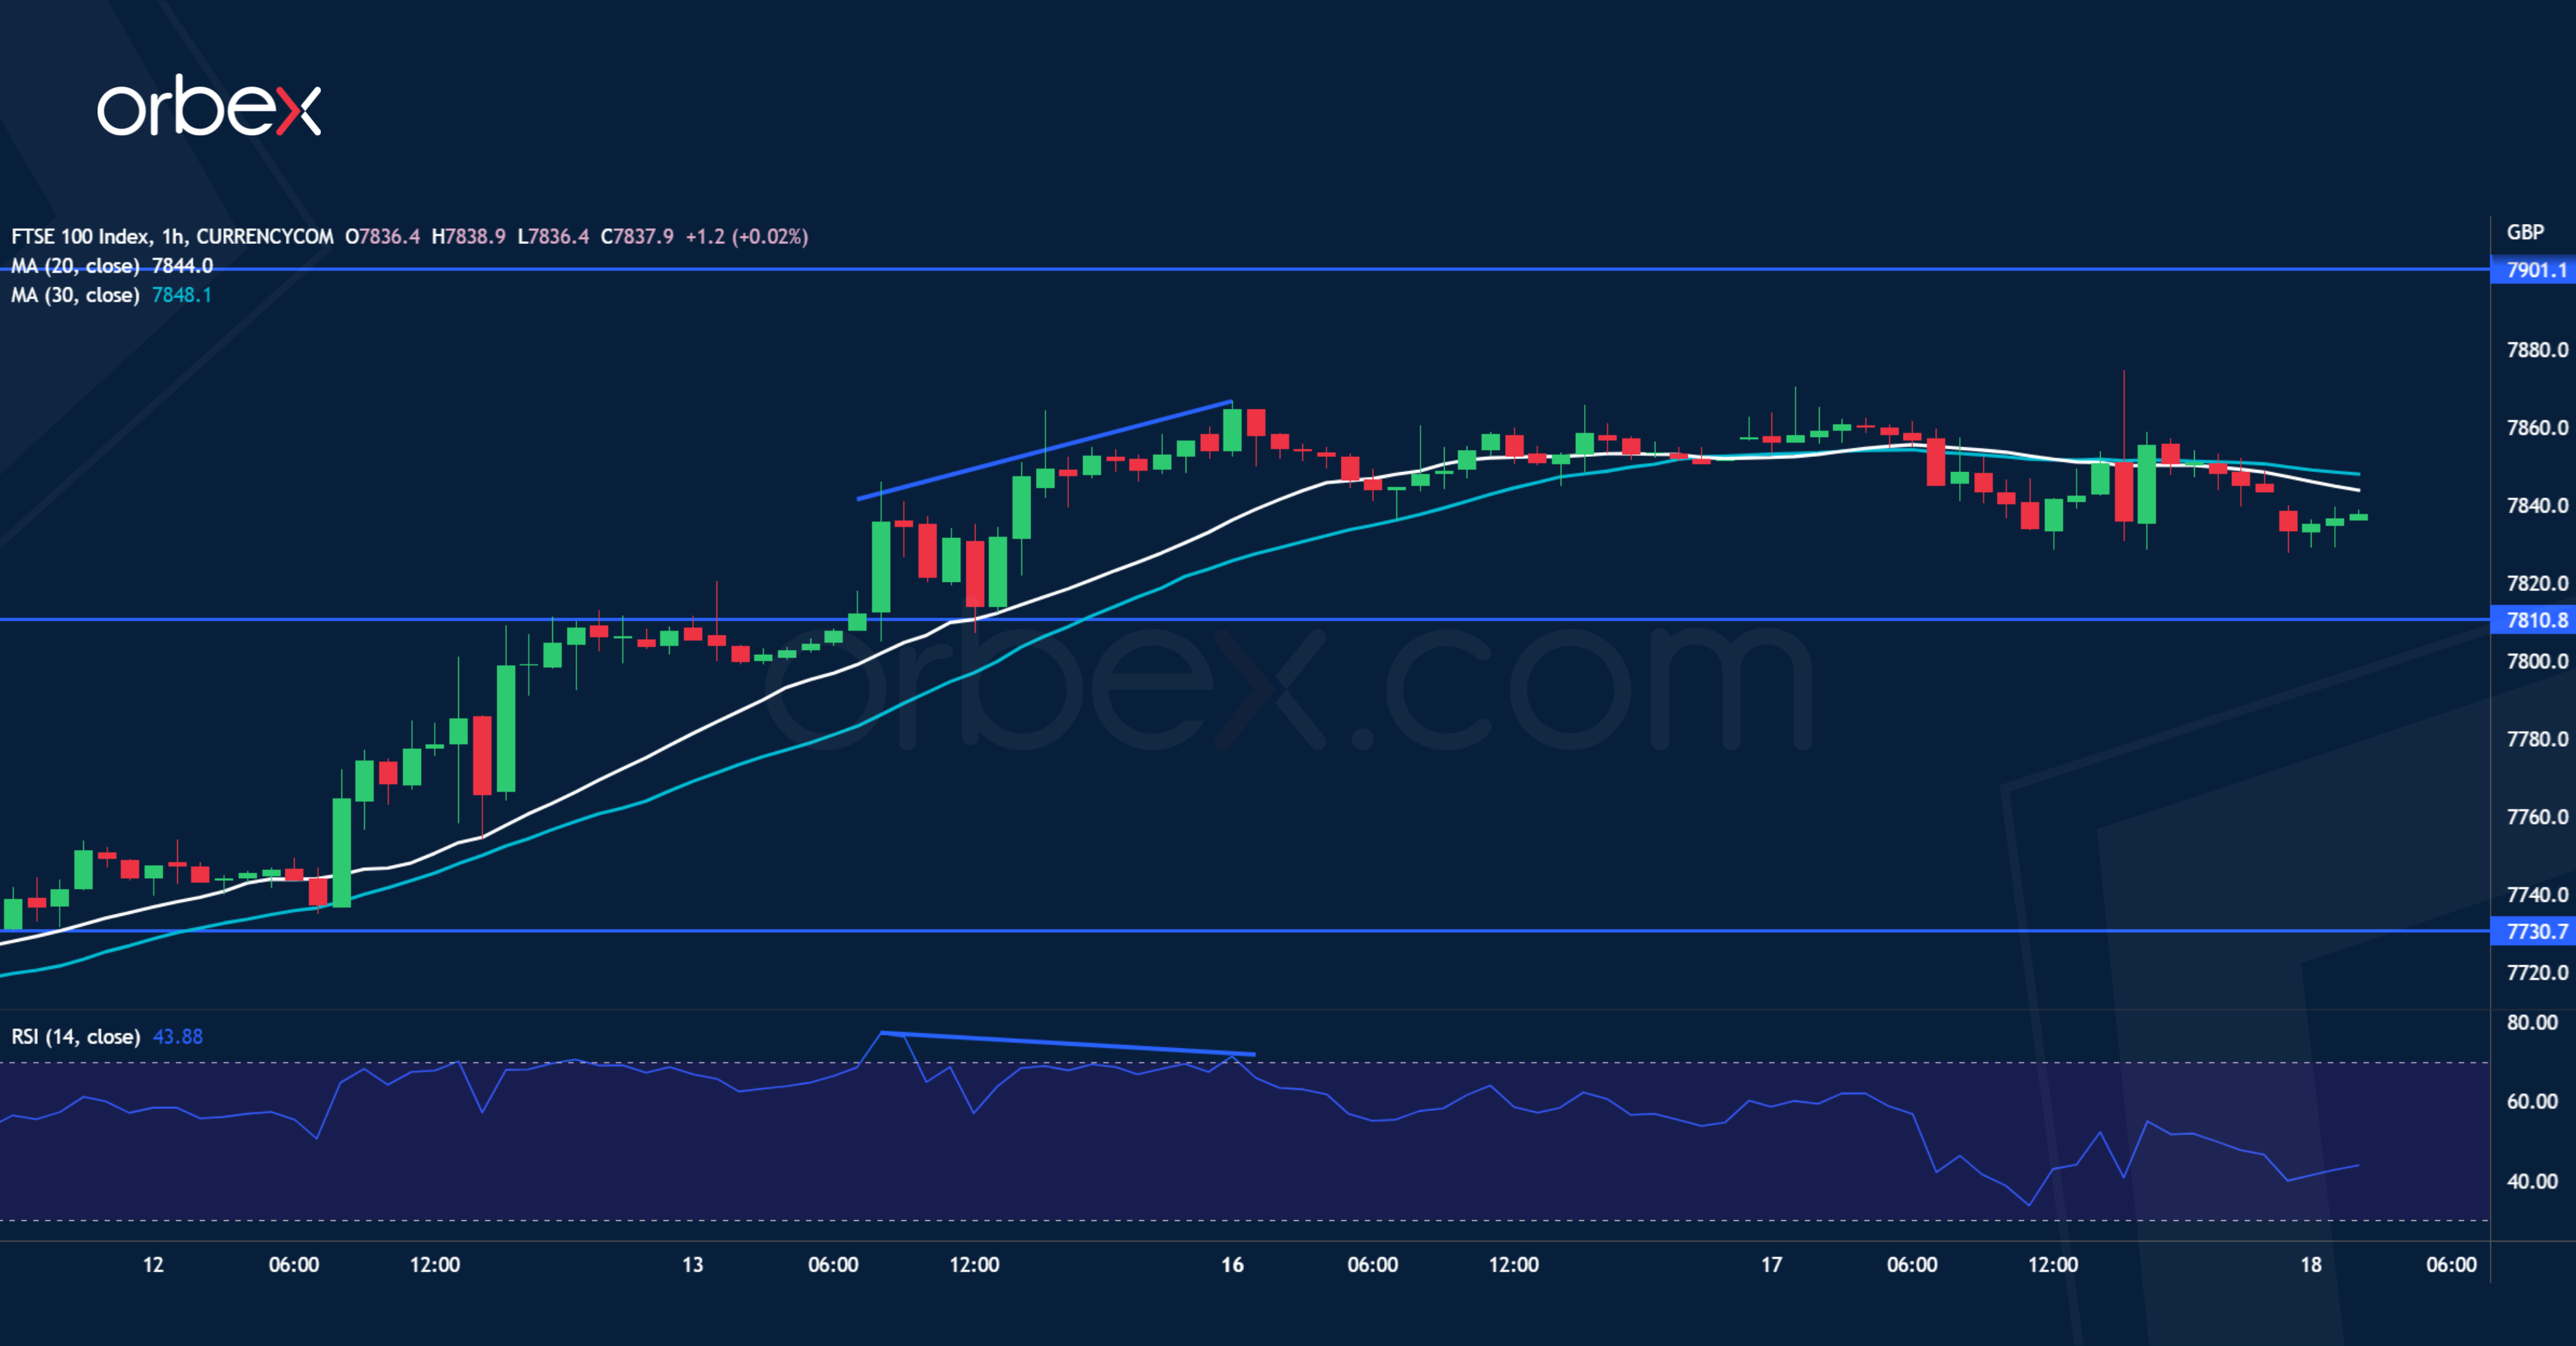
The FTSE 100 pushes higher as financial stocks roar. On the daily chart, the index has gone parabolic after breaking last year’s top of 7670. The RSI’s double top in the overbought area may lead to a slowdown in the momentum. The bearish RSI divergence on the hourly chart corroborates the possibility of exhaustion. 7810 is the first support to see whether the bulls can sustain their bids at these fresh high levels and push to 7900. A bearish breakout could trigger broader profit-taking and possibly mean reversion towards 7730.
NZD/USD Tests Resistance
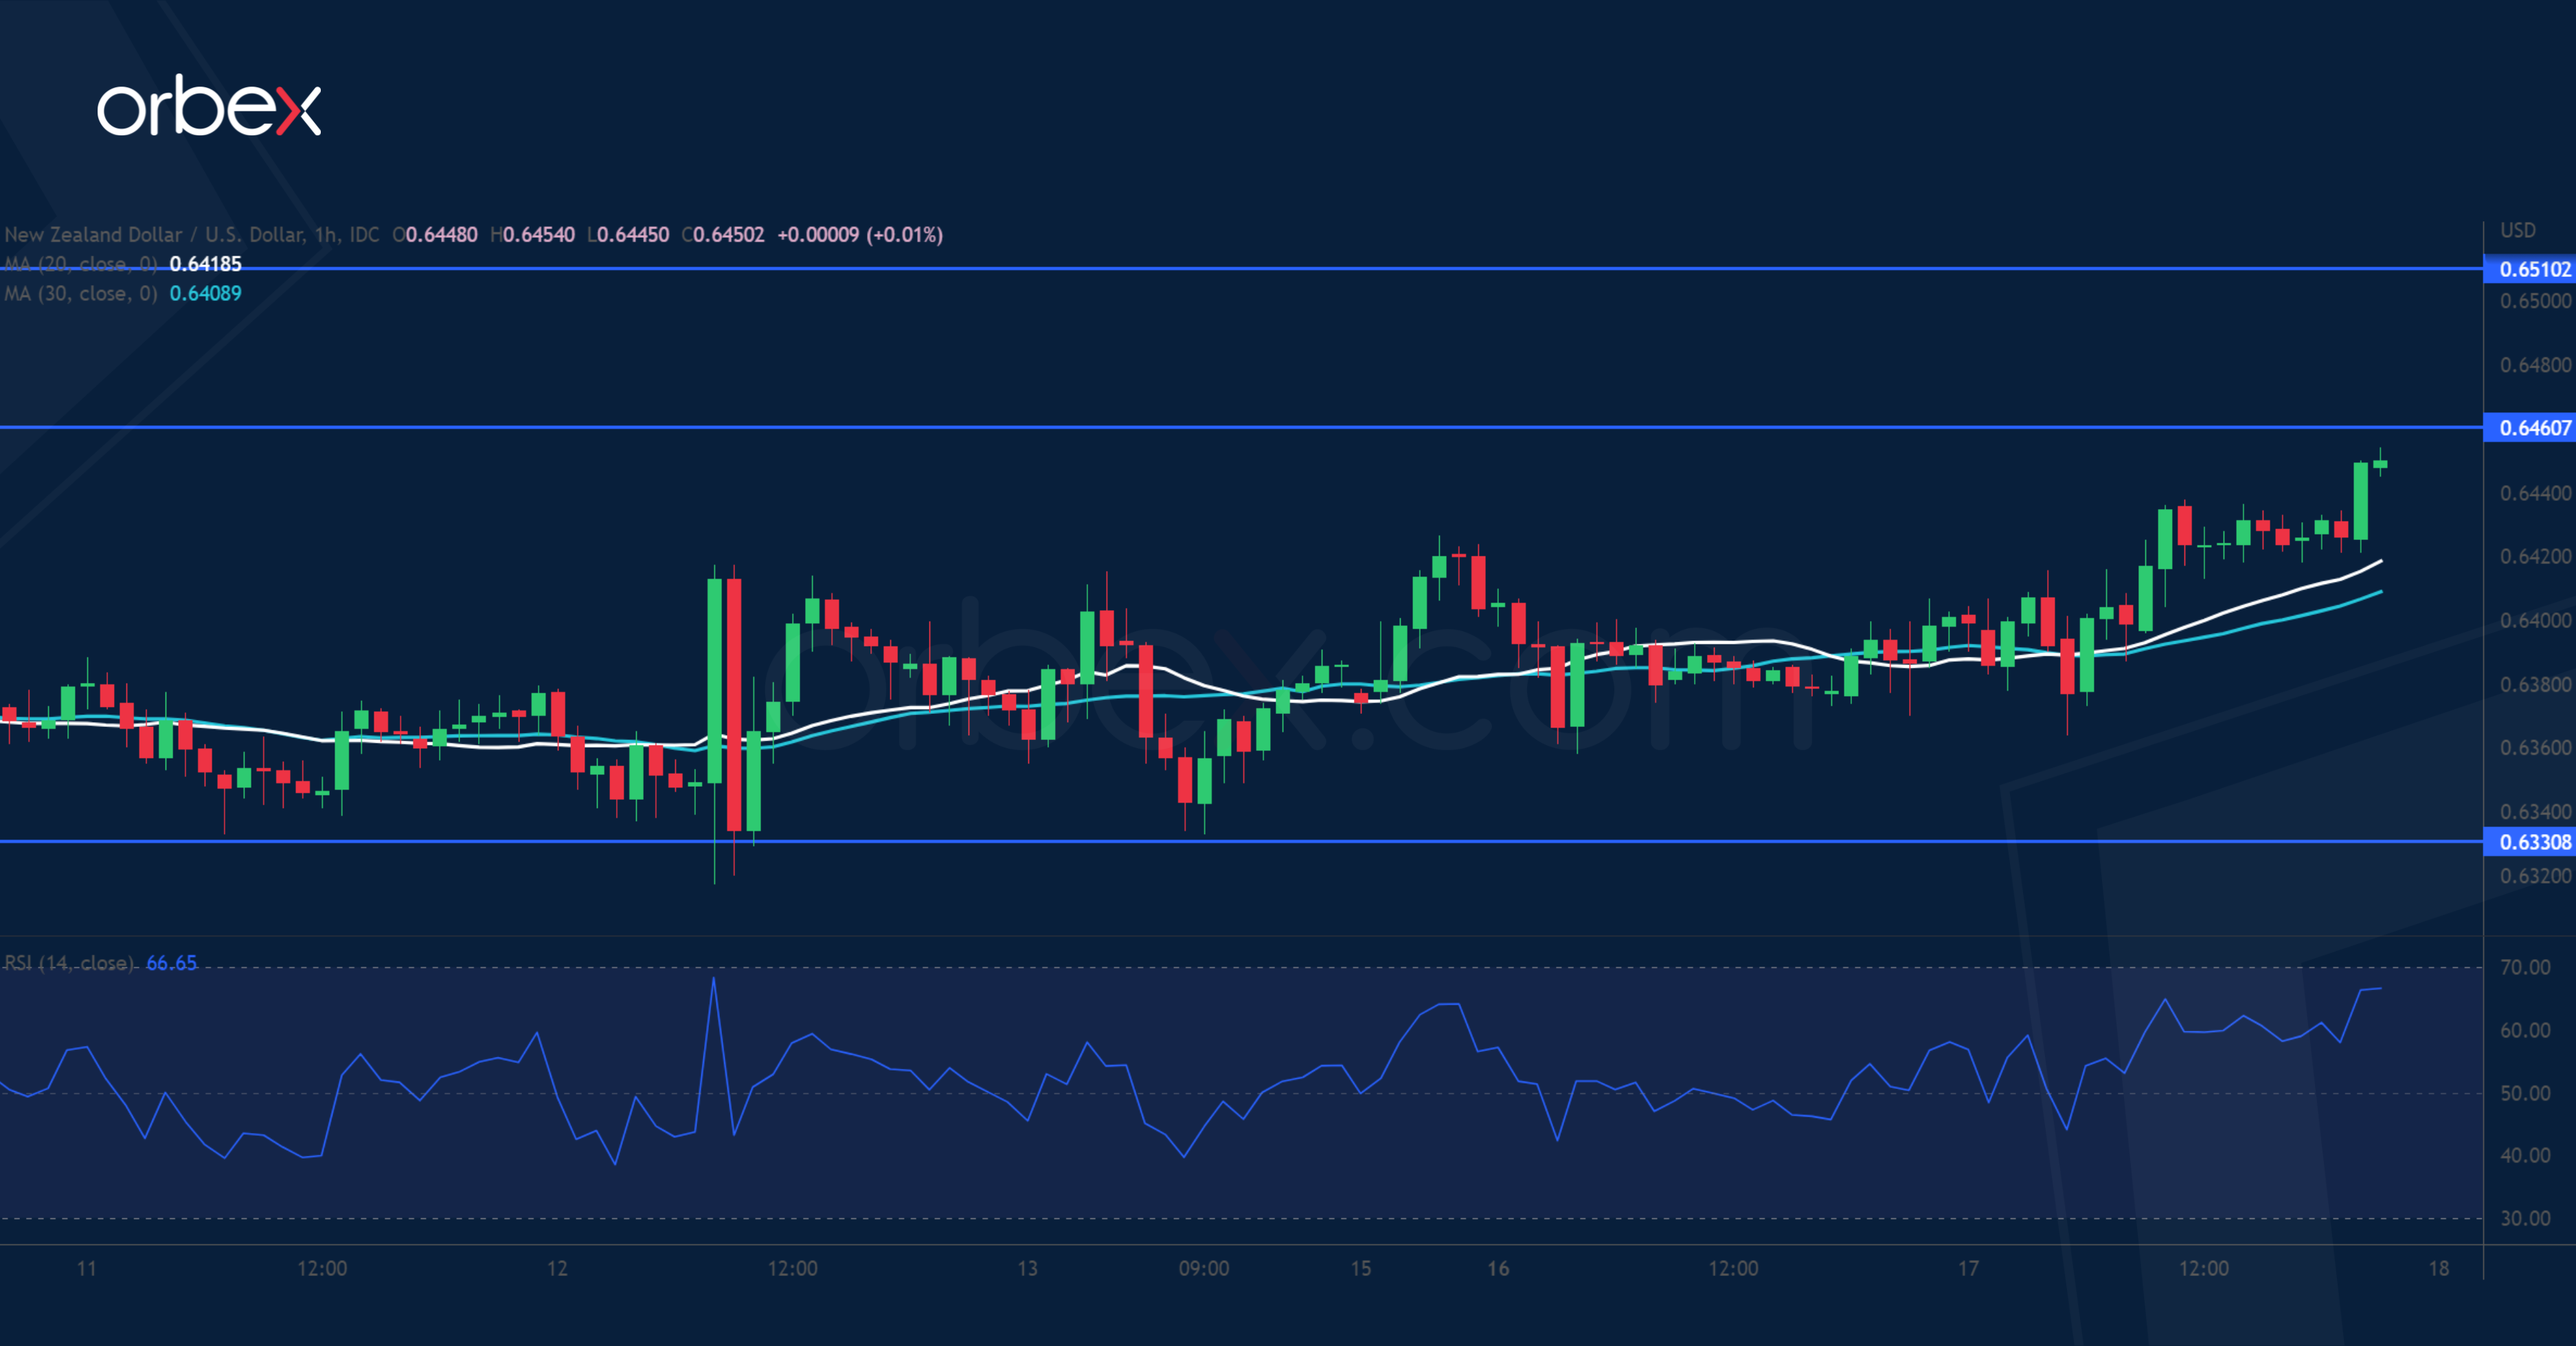
The New Zealand dollar rallies as overall risk appetite grows. The pair has consolidated its recent gains above the former resistance at 0.6350. The choppy rise reveals a lack of momentum as the price inches towards the supply zone around 0.6460. Its breach could pave the way for a bullish continuation above 0.6510. Otherwise, the bears may take over in the near term. 0.6330 is an area of congestion and its break would shake some buyers out and send the kiwi to the latest daily low at 0.6190.