Sample Category Title
Technical Outlook and Review
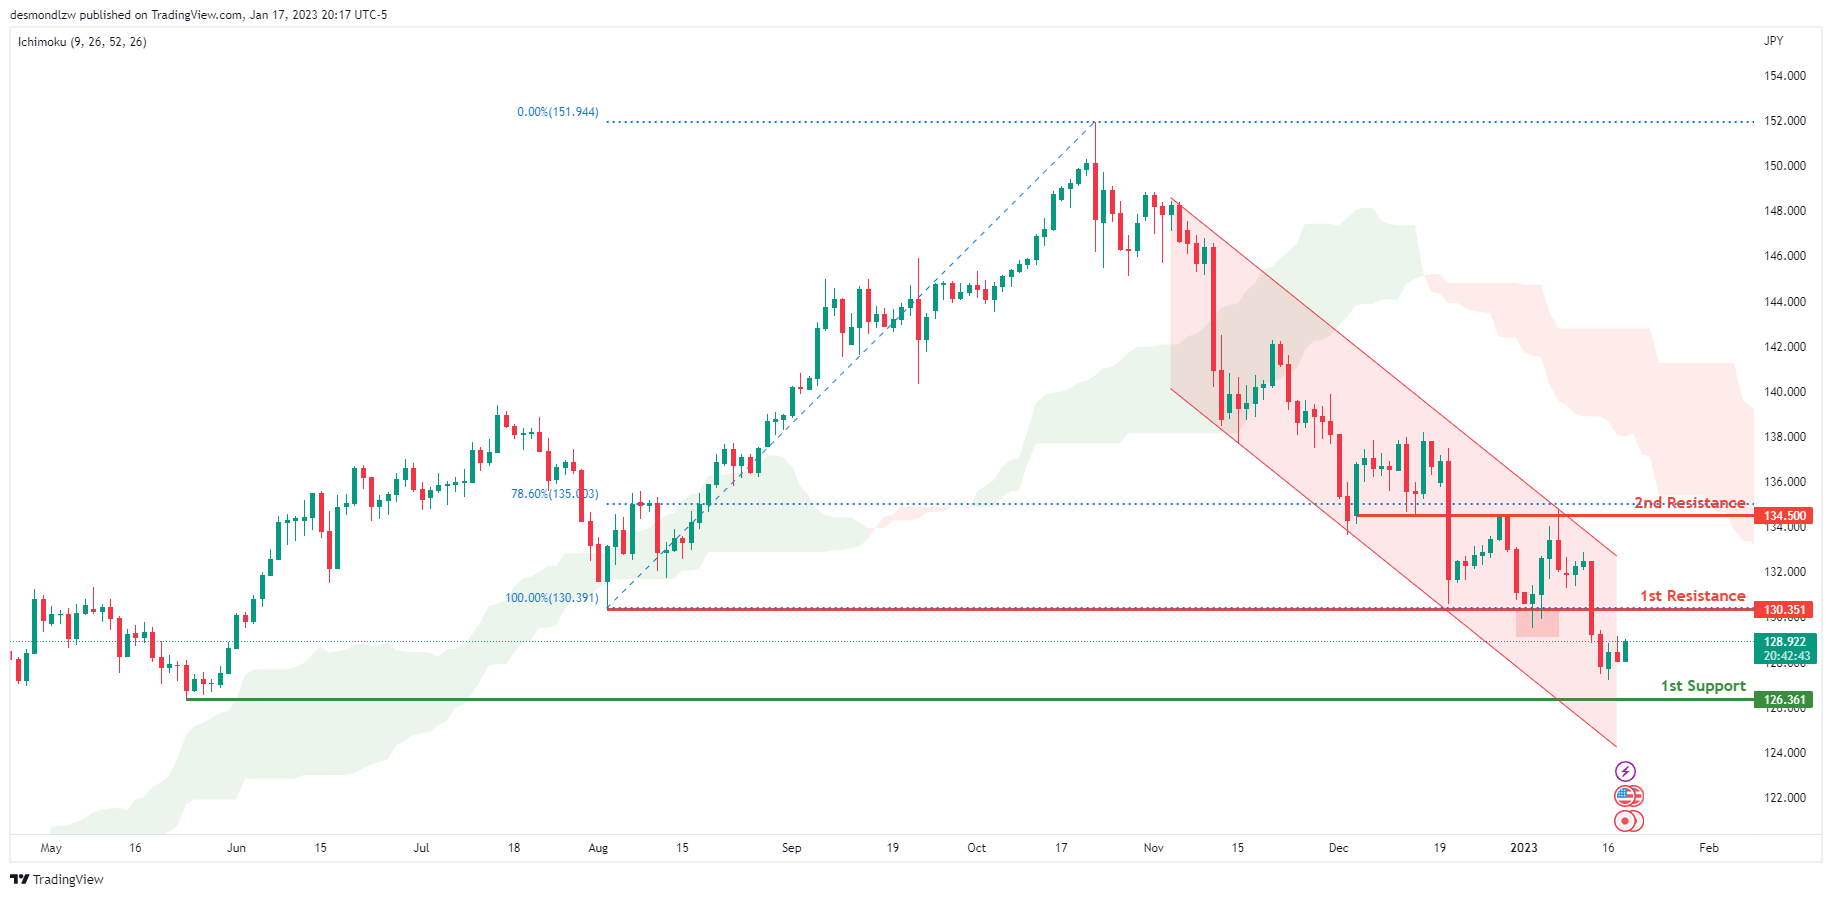
USD/JPY:
Looking at the Daily chart, my overall bias for USDJPY is bearish due to the current price being below the Ichimoku cloud, indicating a bearish market. To add confluence to this bias, price is also within a descending channel. If this bearish momentum continues, expect the price to possibly continue heading towards the 1st support level at 126.361, where the previous swing low is. In an alternate scenario, price could possibly head back up to retest the 1st resistance at 130.351, where the previous swing low is.
Areas of consideration:
- H4 time frame, 1st resistance at 130.351
- H4 time frame, 1st support at 126.361
DXY:
Looking at the Daily chart, my overall bias for DXY is bearish due to the current price being below the Ichimoku cloud, indicating a bearish market. If this bearish momentum continues, expect the price to possibly continue heading towards the 1st support at 101.300, where the previous low is. . In an alternative scenario, price could head back up to retest the 1st resistance at 103.463, where the 23.6% Fibonacci line is.
Areas of consideration:
- H4 time frame, 1st resistance at 103.463
- H4 time frame, 1st support at 101.300
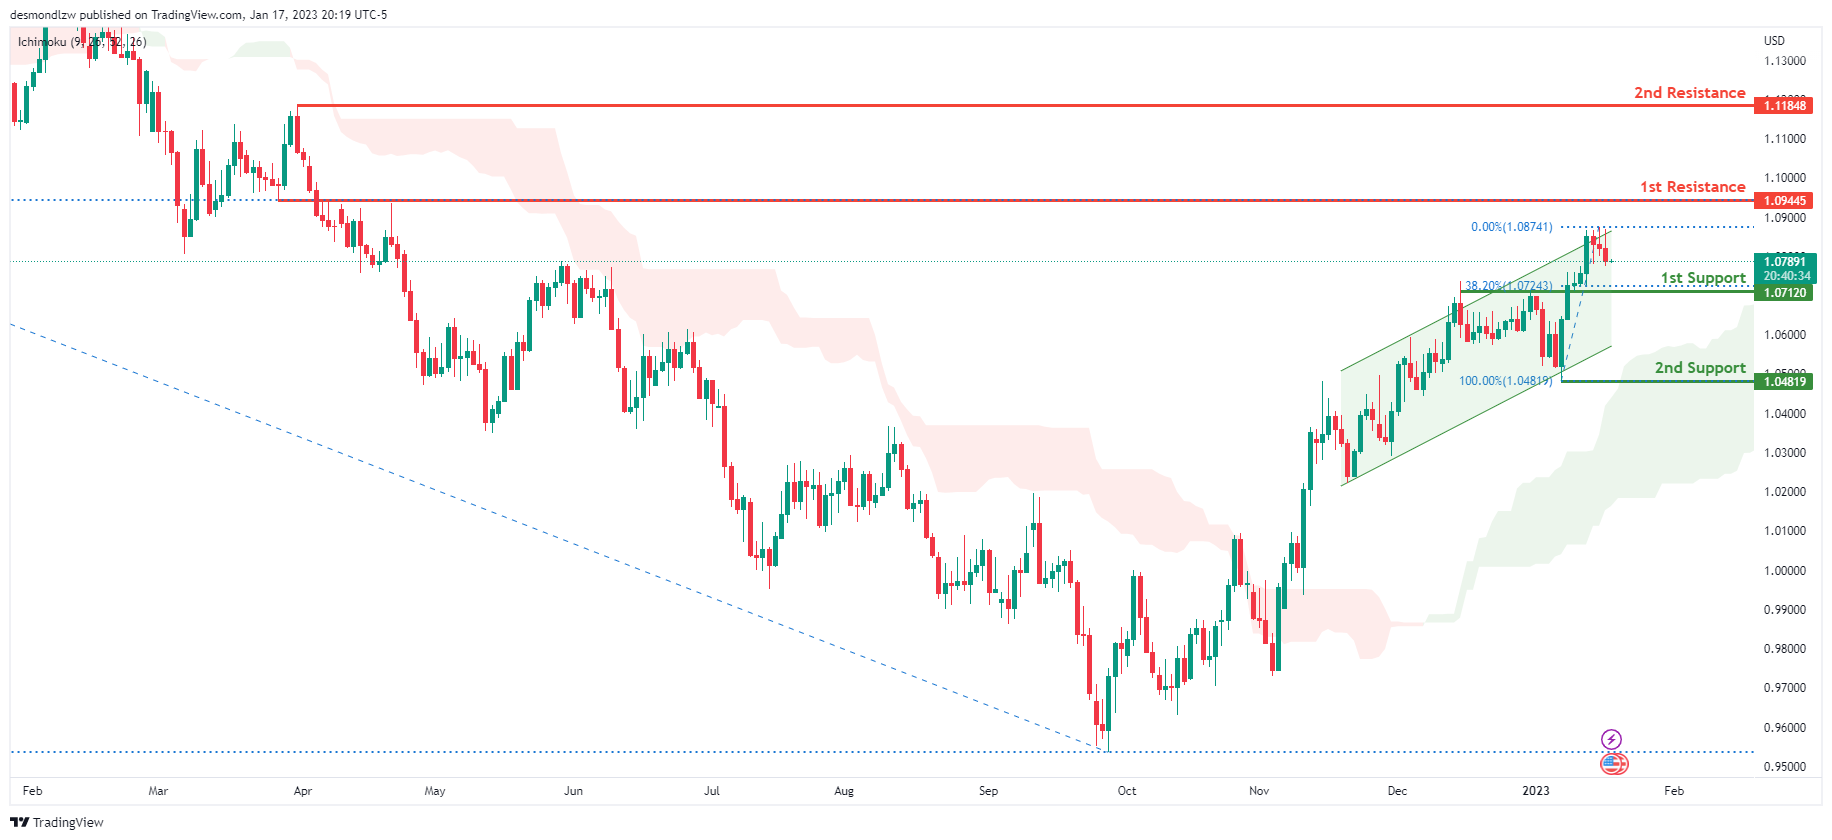
EUR/USD:
Looking at the Daily chart, my overall bias for EURUSD is bullish due to the current price being above the Ichimoku cloud, indicating a bullish market structure. To add confluence to this bias, price is also within an ascending channel. If this bullish momentum continues, expect the price to possibly continue heading towards the 1st resistance at 1.09445, where the 50% Fibonacci line is. In an alternate scenario, price could possibly head back down to retest the 1st support level at 1.07120, where the 38.2% Fibonacci line is.
Areas of consideration :
- H4 1st resistance at 1.09445
- H4 1st support at 1.07120
GBP/USD:
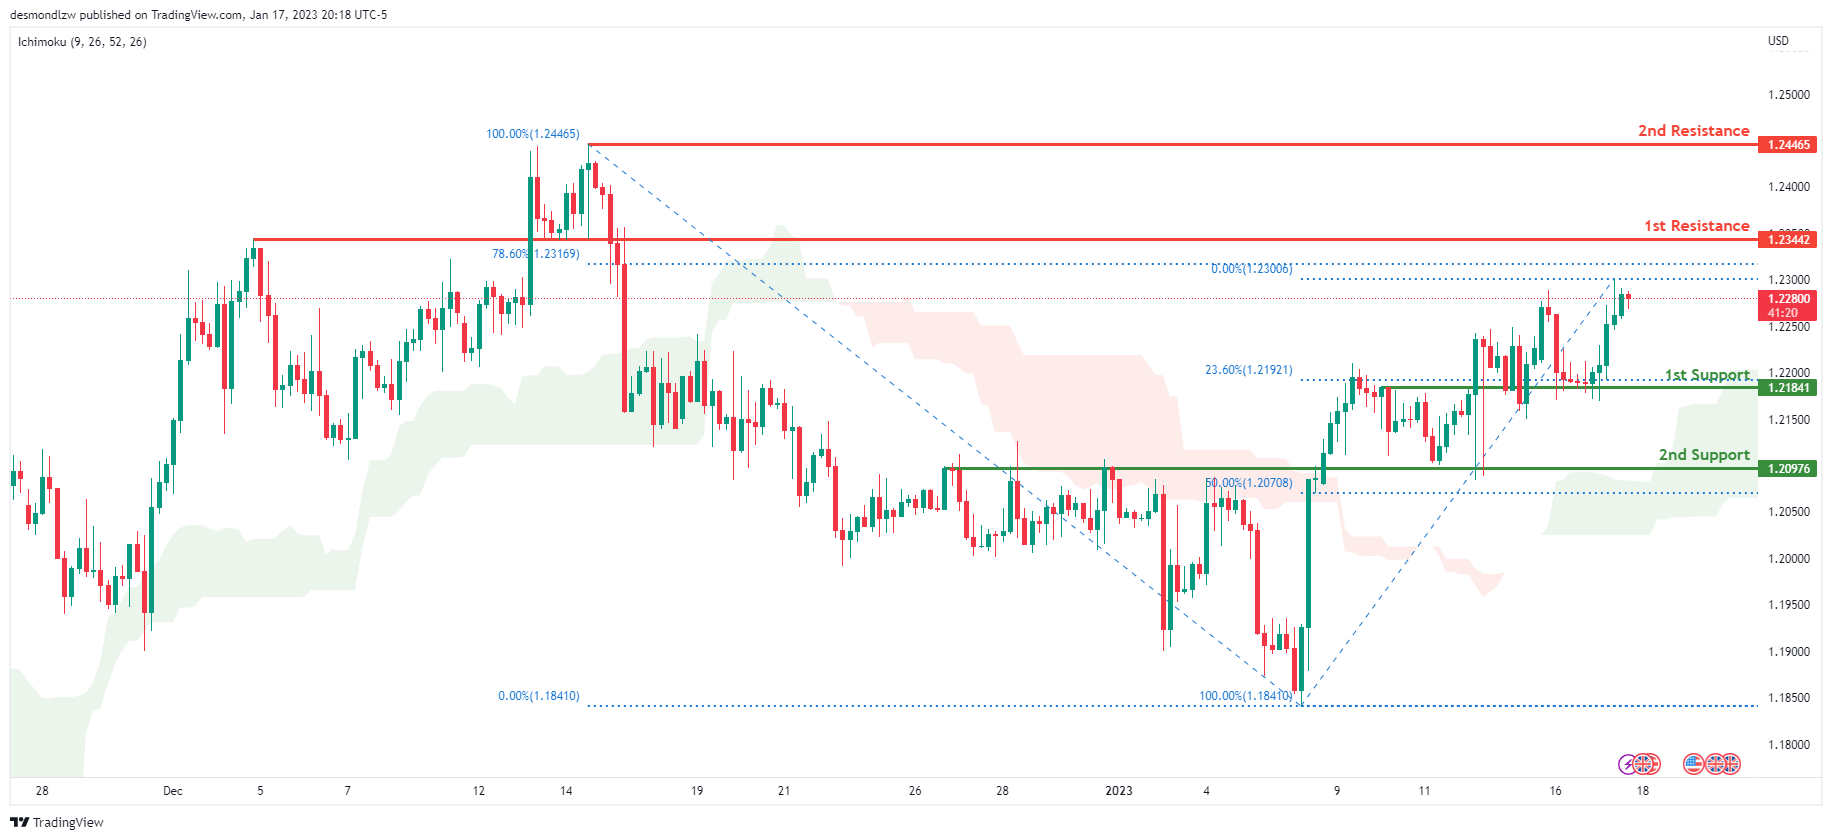
Looking at the H4 chart, my overall bias for GBPUSD is bullish due to the current price being above the Ichimoku cloud, indicating a bullish market. If this bullish momentum continues, expect price to possibly continue heading towards the 1st resistance line at 1.23442, where the 78.6% Fibonacci line is. In an alternate scenario, price could possibly head back down and break the 1st support at 1.21841, where the 23.6% Fibonacci line is, before heading towards the 2nd support at 1.20976, where the 50% Fibonacci line is.
Areas of consideration:
- H4 1st resistance at 1.23442
- H4 1st support at 1.21841
- H4 2nd support at 1.20976
USD/CHF:
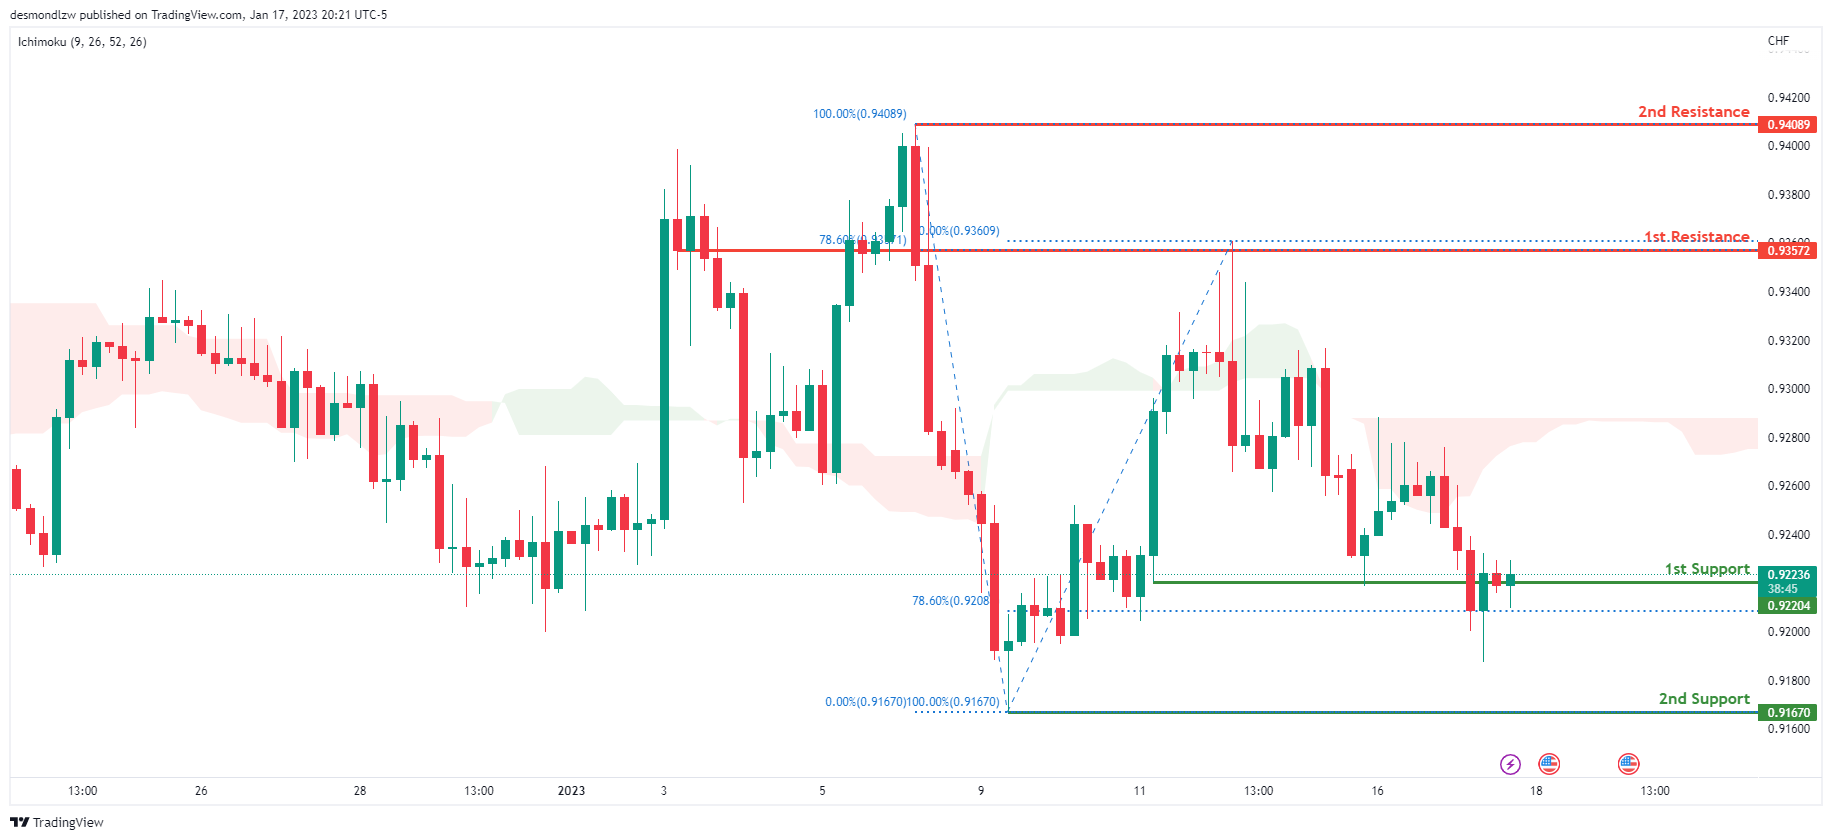
Looking at the H4 chart, my overall bias for USDCHF is bearish due to the current price crossing below the Ichimoku cloud, indicating a bearish market. If the current bearish trend continues, expect the price to possibly head back down to retest the 1st support at 0.92204, slightly above where the 78.6% Fibonacci line is. In an alternative scenario, price could possibly head towards the 1st resistance at 0.93572, where the 78.6% Fibonacci line is.
Areas of consideration
- H4 1st support at 0.92204
- H4 1st resistance at 0.93572
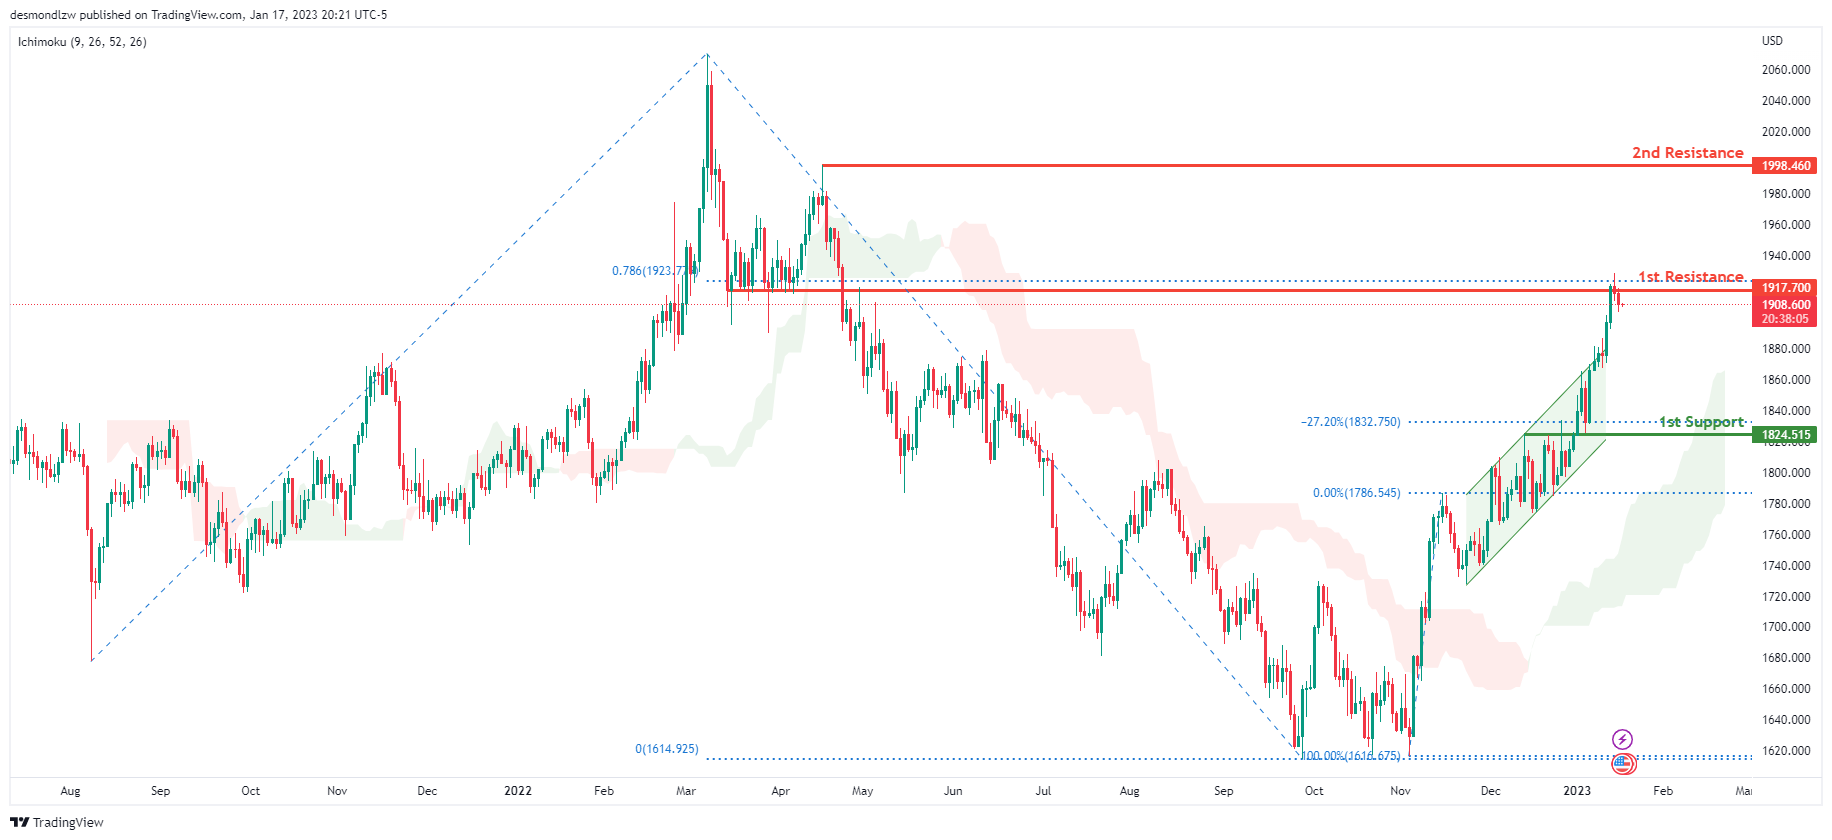
XAU/USD (GOLD):
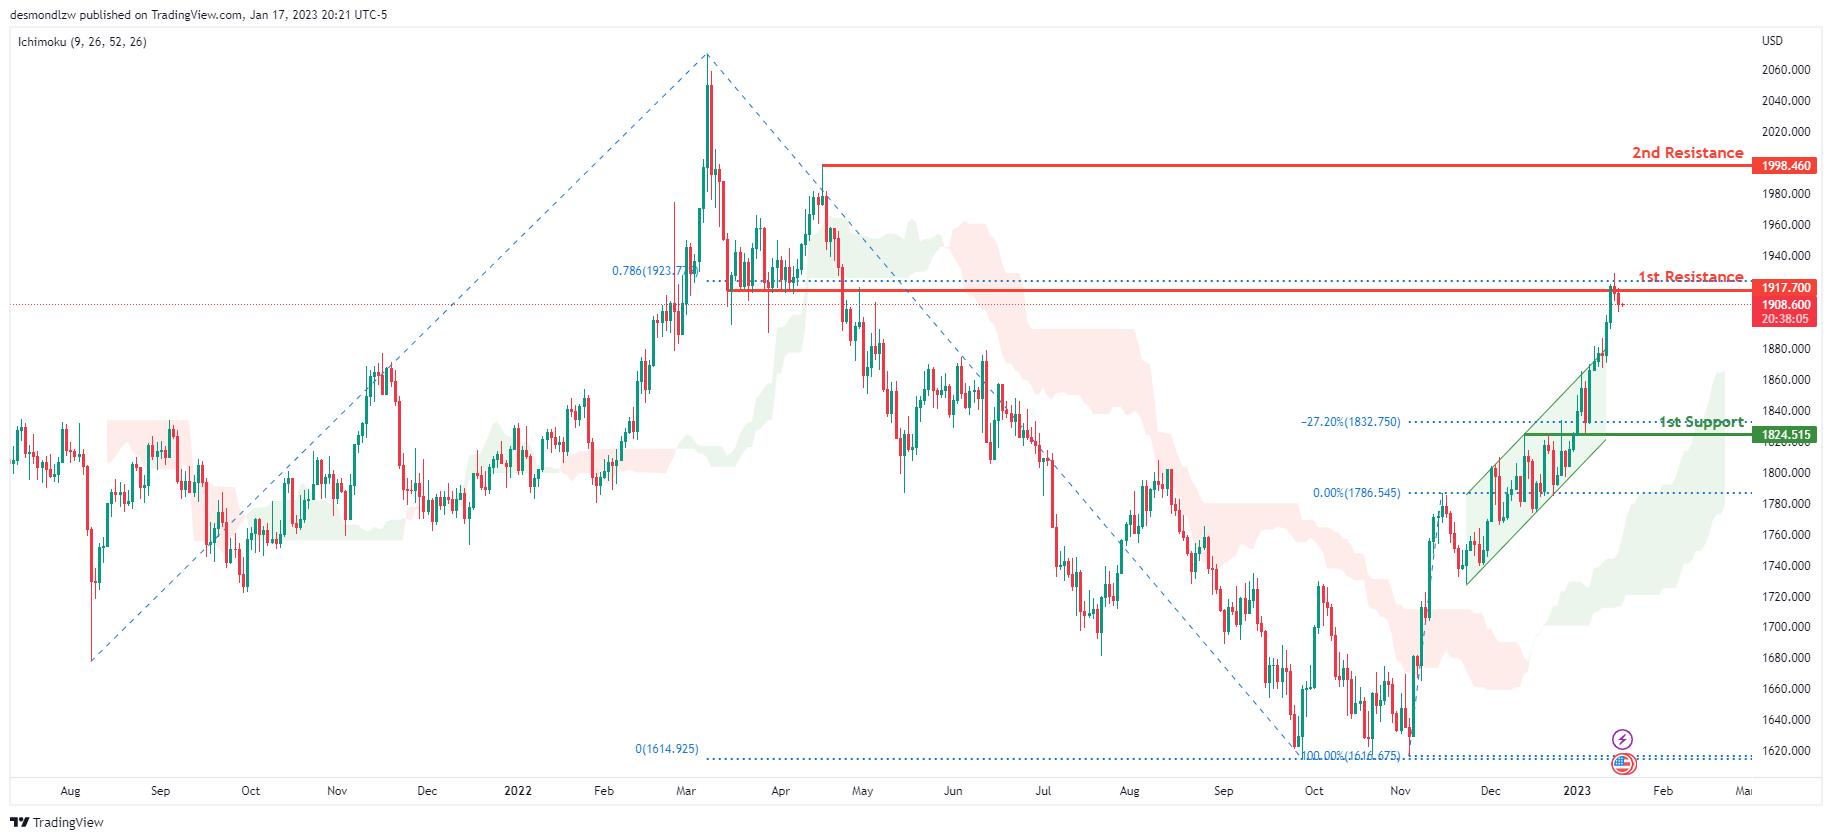
Looking at the Daily chart, my overall bias for XAUUSD is bullish due to the current price crossing above the Ichimoku cloud, indicating a bullish market. To add support to this bias, price has also broken above the bullish ascending channel. If this bullish momentum continues, expect the price to possibly break the 1st resistance at 1917.700 where the 78.6% Fibonacci projection line is, before heading towards the 2nd resistance at 1998.460, where the previous swing high is. In an alternative scenario, price could possibly head back down to retest the 1st support at 1824.515 where the -27.2% Fibonacci expansion line is.
Areas of consideration:
- H4 time frame, 1st resistance at 1917.700
- H4 time frame, 2nd resistance at 1998.460
- H4 time frame, 1st support at 1824.515
- H4 time frame, 2nd support at 1824.515
AUD/USD:
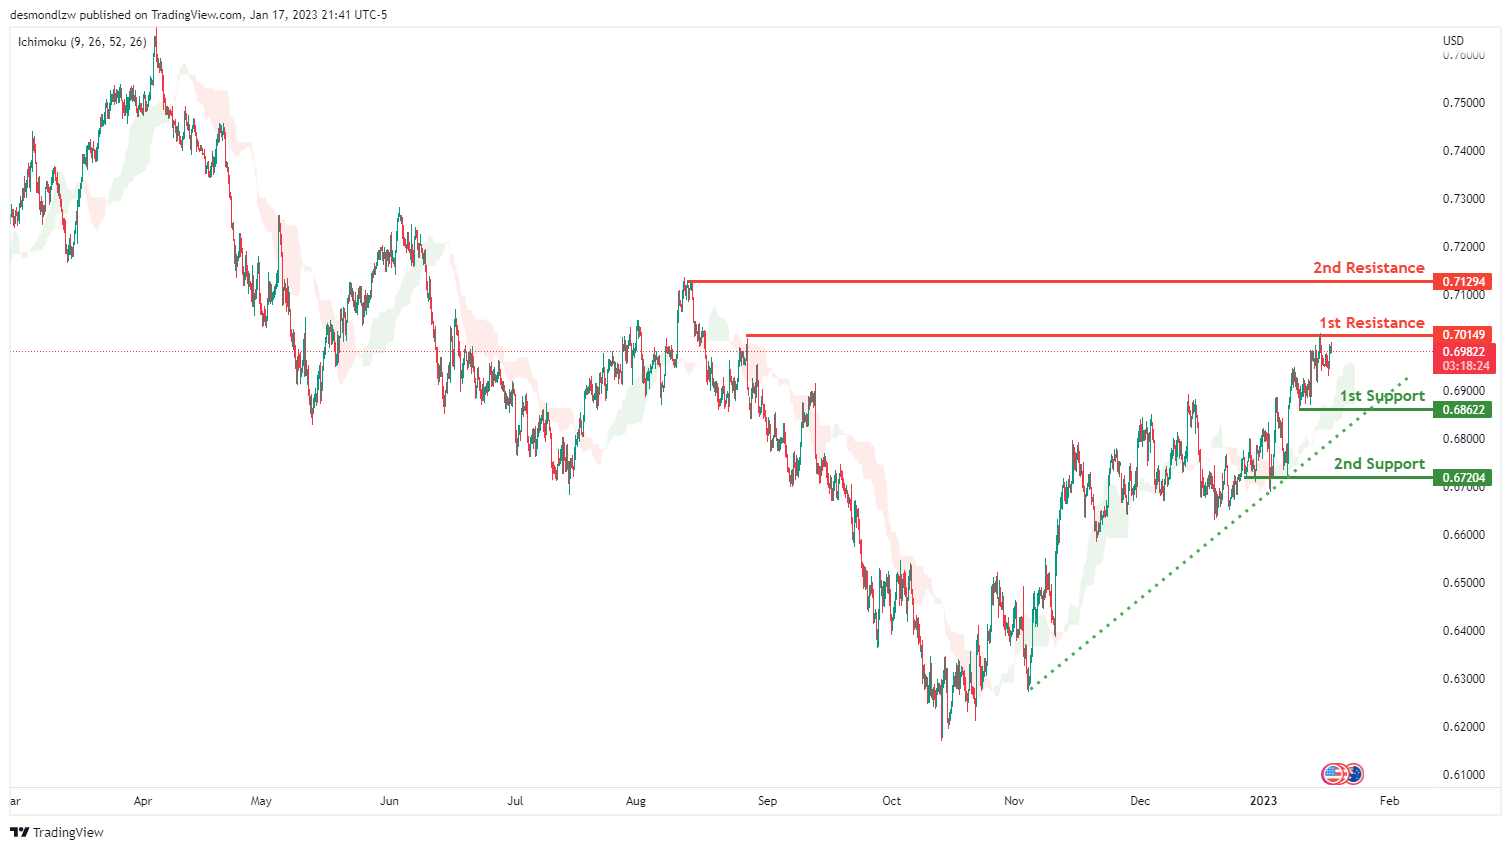
Looking at the H4 chart, we can see that the 1st support is at 0.71294 which is an overlap resistance .There is an ascending trend line that starts from 3rd JAN 2023 which suggests that there is bullish momentum. Price is also above our Ichimoku cloud suggesting further bullish momentum. 1st resistance is at 0.70149 which is an overlap resistance. 2nd resistance is slightly higher at 0.71294
Areas of consideration
- H4, 1st resistance at 0.70149
- H4, 2nd resistance at 0.71294
- H4, 1st support at 0.71294
NZD/USD:
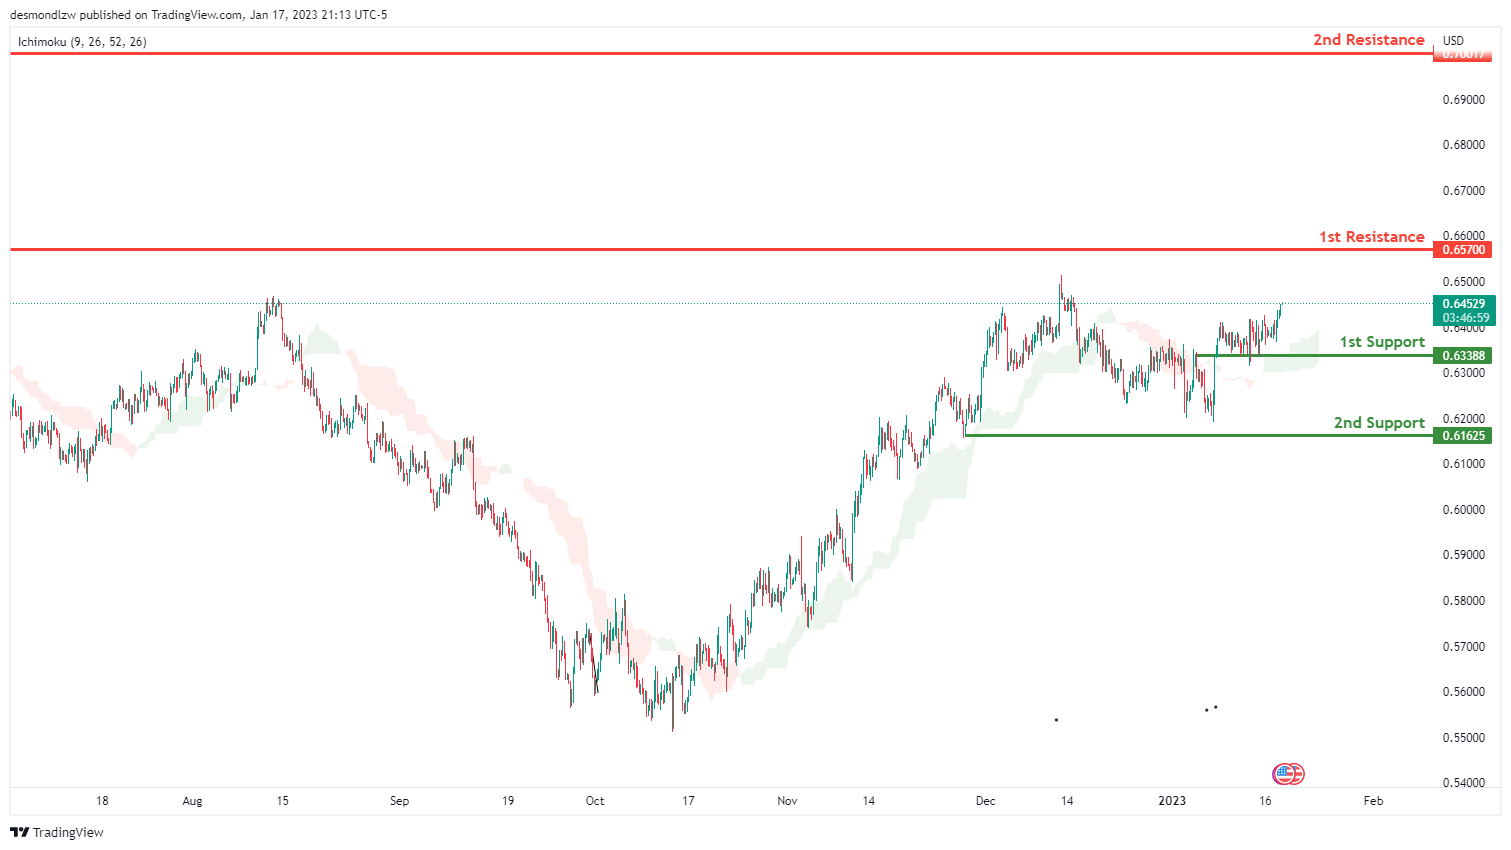
Looking at the H4 chart, we can see that the 1st support is at 0.63388 which is an overlap support. If price breaks this level, we could see it drop to 2nd support down at 0.61625.
For the resistance, our 1st resistance is at 0.65700 which is an recent swing high resistance . If price breaks this level, it could go up to the 2nd resistance at 0.70017 which is the highest price since jun 2022.
Areas of consideration:
- H4 time frame, 1st resistance at 0.65700
- H4 time frame, 2nd resistance at 0.70017
- H4 time frame, 1st support at 0.63388
- H4 time frame, 2nd support at 0.61625
USD/CAD:
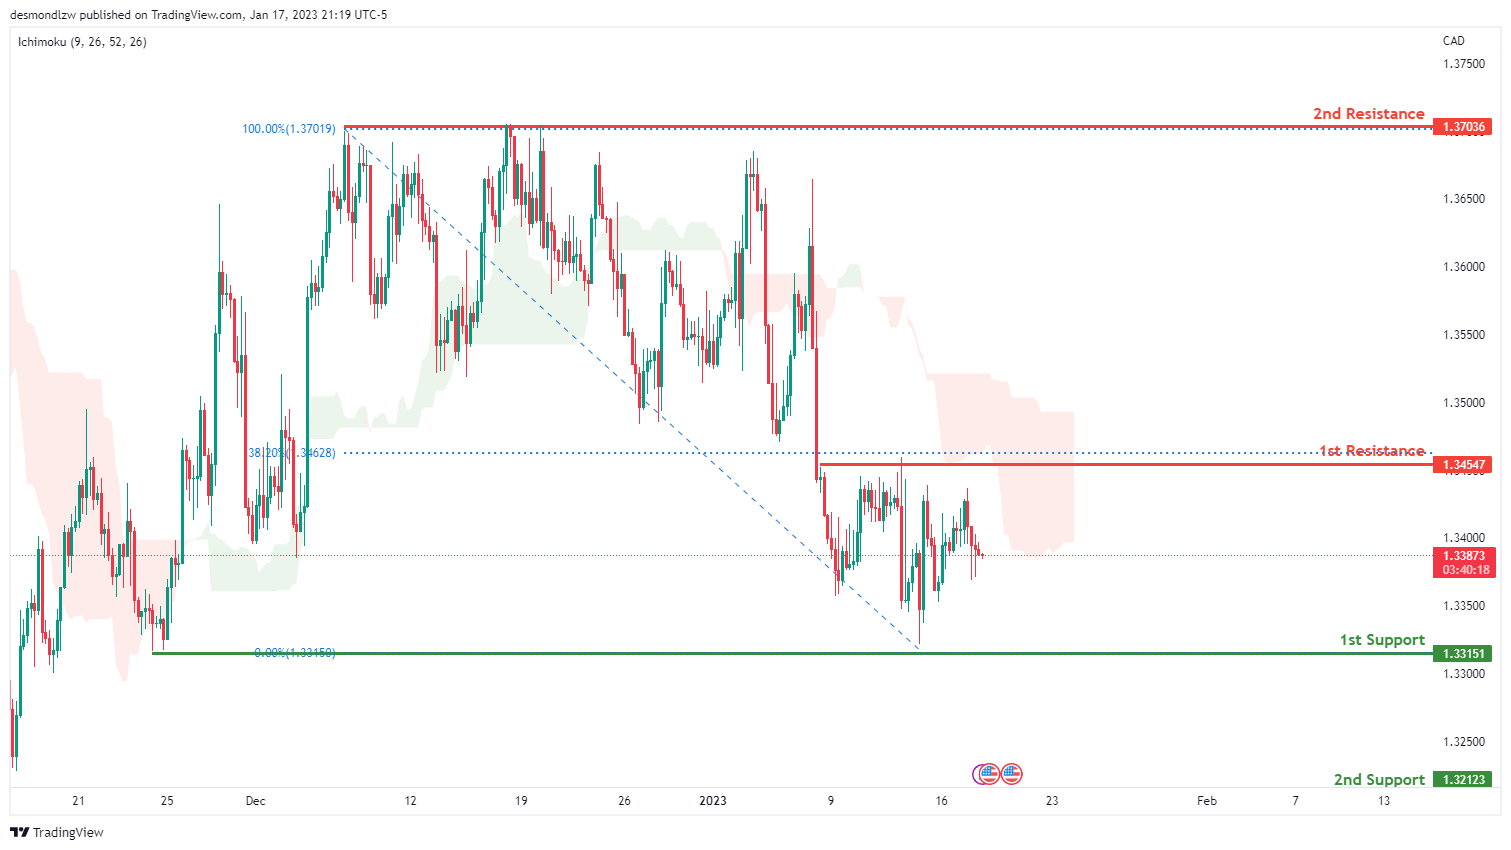
On the H4 chart, the 1st support is at 1.33151 which is the recent swing low support . And the 2nd support 1.32123 which is an overlap support. .
In terms of resistance, the 1st resistance we can see is at 1.34547 which is an overlap resistance that happens to coincide with the 38.2% fibonacci retracement. If price breaks this level, it could go up to the 2nd resistance at 1.37036 which is a recent swing high resistance
Areas of consideration:
- H4 time frame, 1st resistance at 1.34547
- H4 time frame. 2nd resistance at 1.37036
- H4 time frame, 1st support at 1.33151
- H4 time frame, 2nd support at 1.32123
OIL:
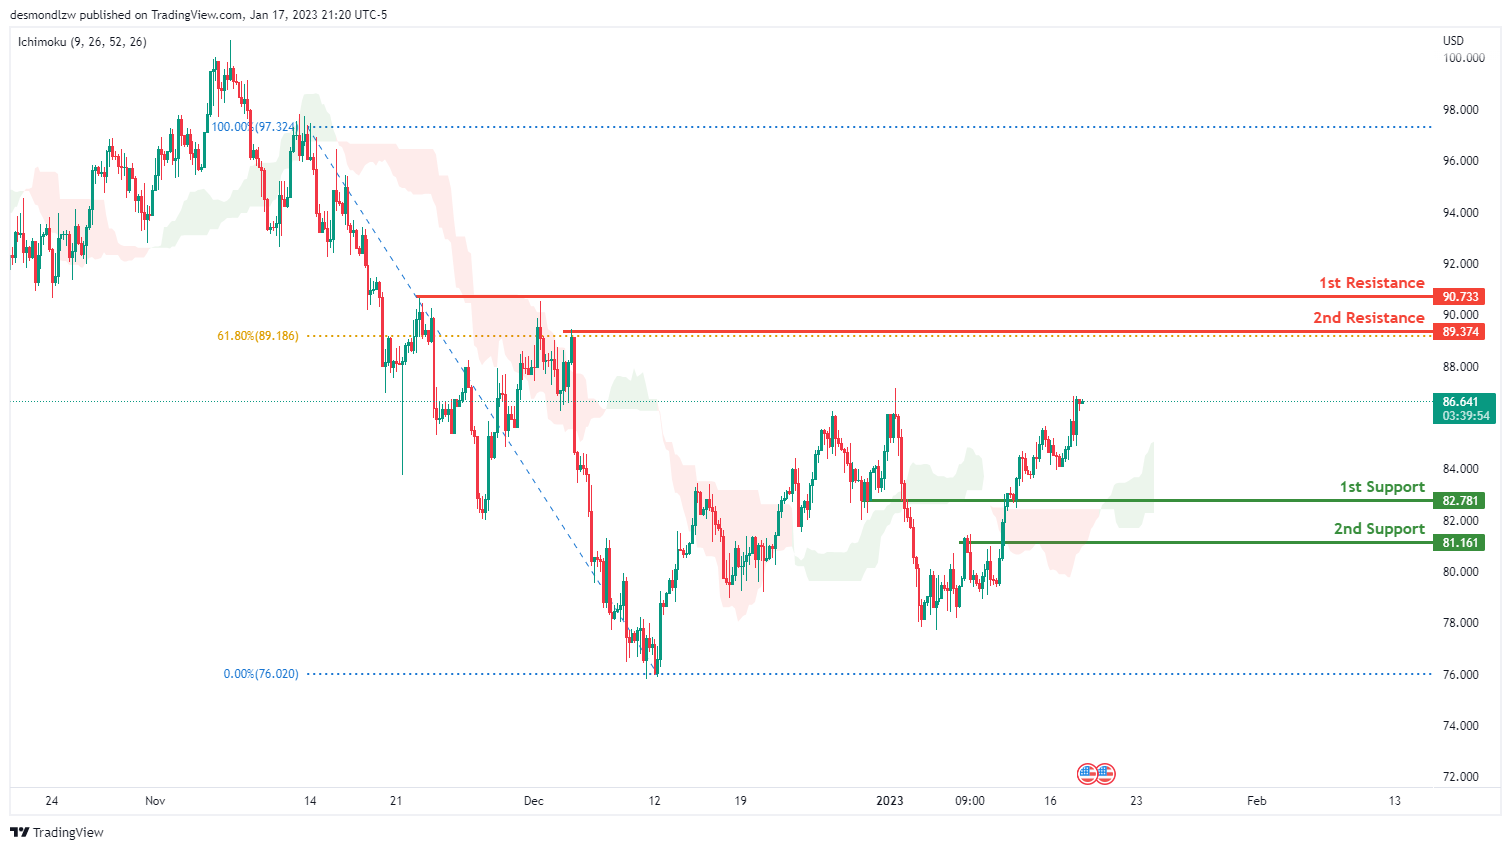
Looking at the H4 chart, we can see that the 1st resistance is at 86.289 If the price breaks this level, we could see the price head up to our 2nd resistance level at 88.676 which is in line with the 50% fibonacci retracement.
In terms of support, we can see our 1st support at 82.409 which is overlap support. Breaking this level would trigger a further drop to our 2nd support at 79.435
Areas of consideration:
- H4 time frame, 2nd resistance at 88.676
- H4 time frame, 1st resistance at 86.289
- H4 time frame,1st support at 82.409
- Hr time frame, 2nd support at 79.435
Dow Jones Industrial Average:
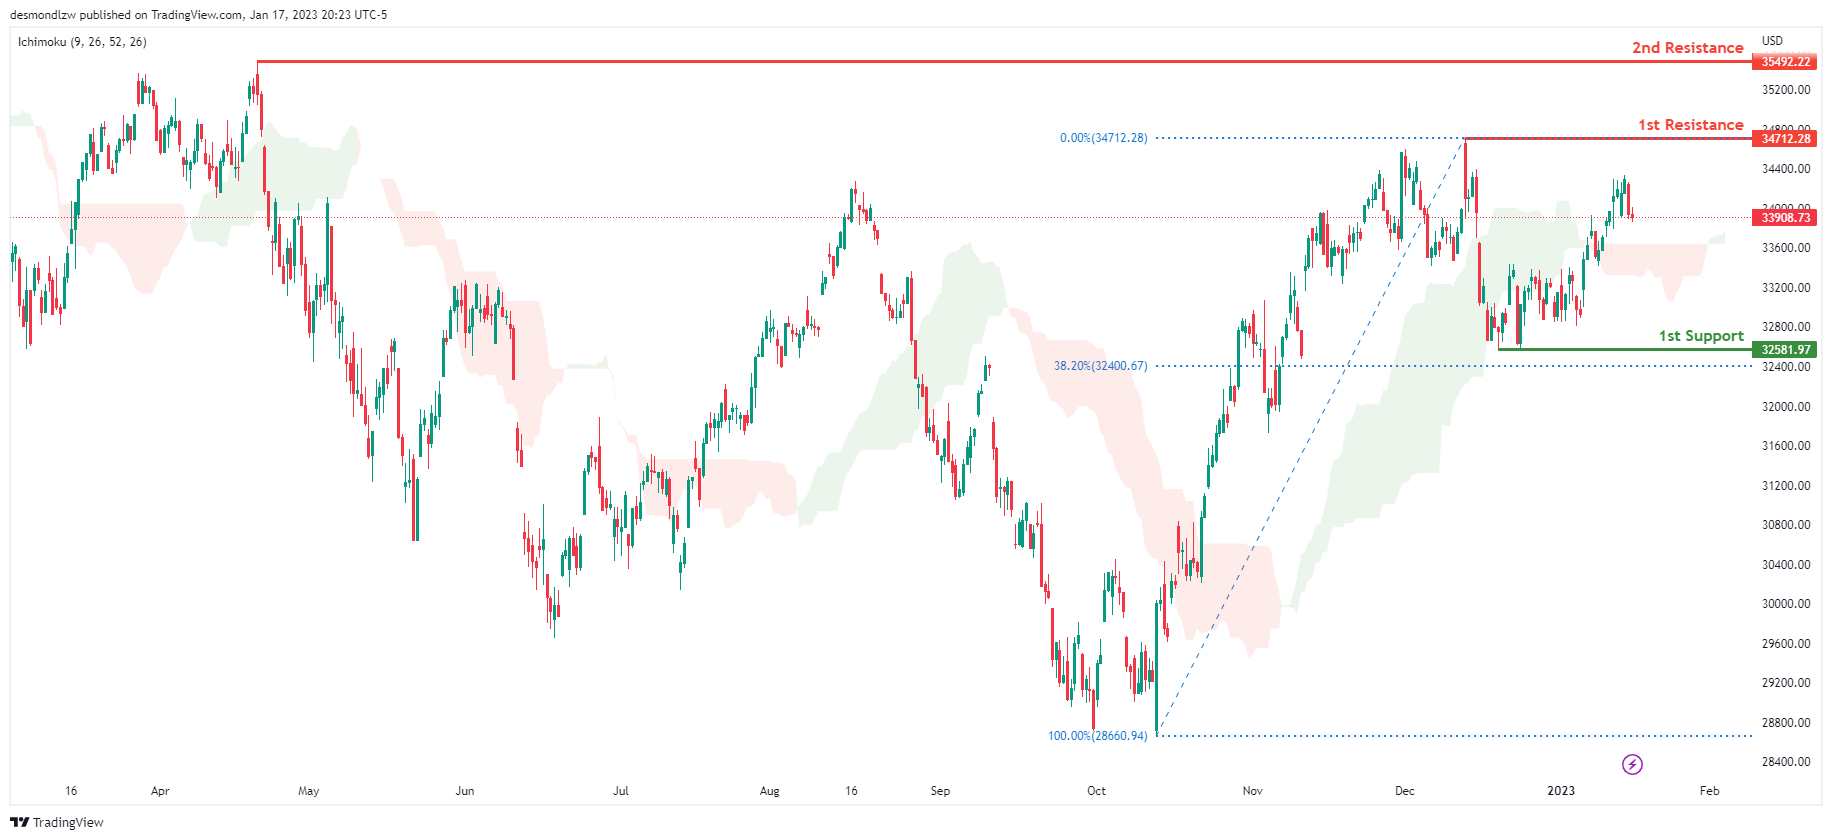
On the H4 chart, the overall bias for DJI is bullish. To add confluence to this, the price is crossing above the Ichimoku cloud which indicates a bullish market. If this bullish momentum continues, expect the price to possibly continue heading towards the 1st resistance line at 34712.28, where the recent swing high is. In an alternative scenario, price could possibly head back down towards the 1st support at 32581.97, slightly above where the 38.2% Fibonacci line is.
Areas of consideration:
- H4 time frame, 1st support at 32581.97
- H4 time frame, 1st Resistance at 34712.28
DAX:
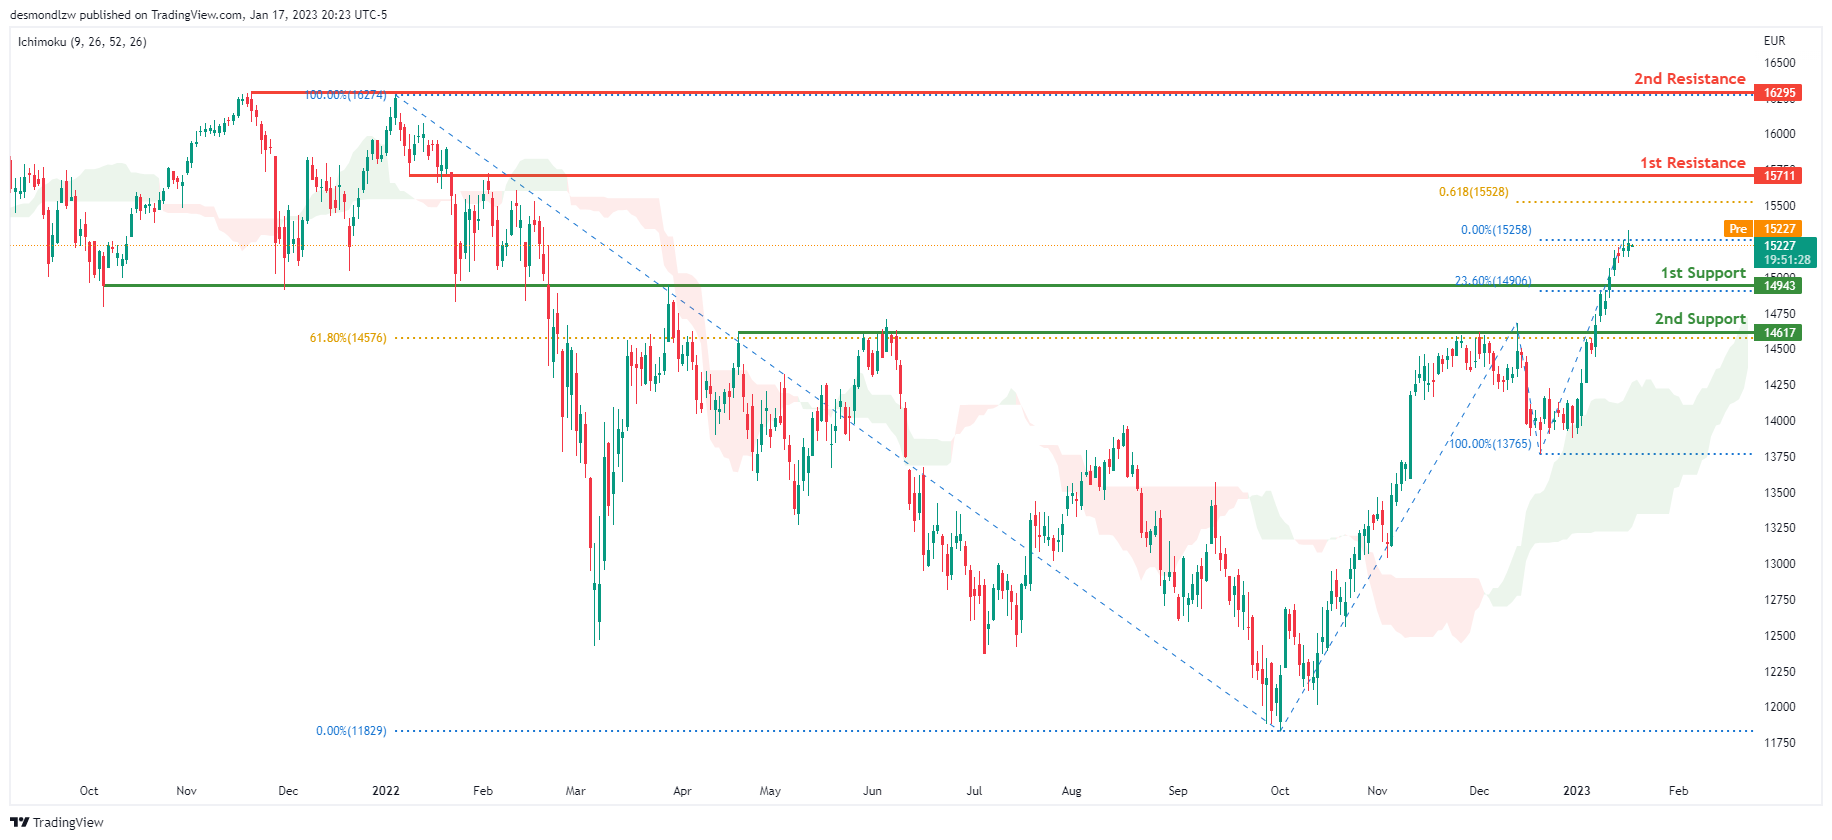
Looking at the Daily chart, my overall bias for DAX is bullish due to the current price crossing above the Ichimoku cloud, indicating a bullish market. If this bullish momentum continues, expect the price to possibly head towards the 1st resistance line at 15711, where the 61.8% Fibonacci projection line is. In an alternative scenario, price could possibly head down to retest the 1st support at 14943, where the 23.6% Fibonacci line is.
Areas of consideration:
- H4 time frame, 1st resistance is at 15711
- H4 time frame, 1st support is at 14943
ETHUSD:
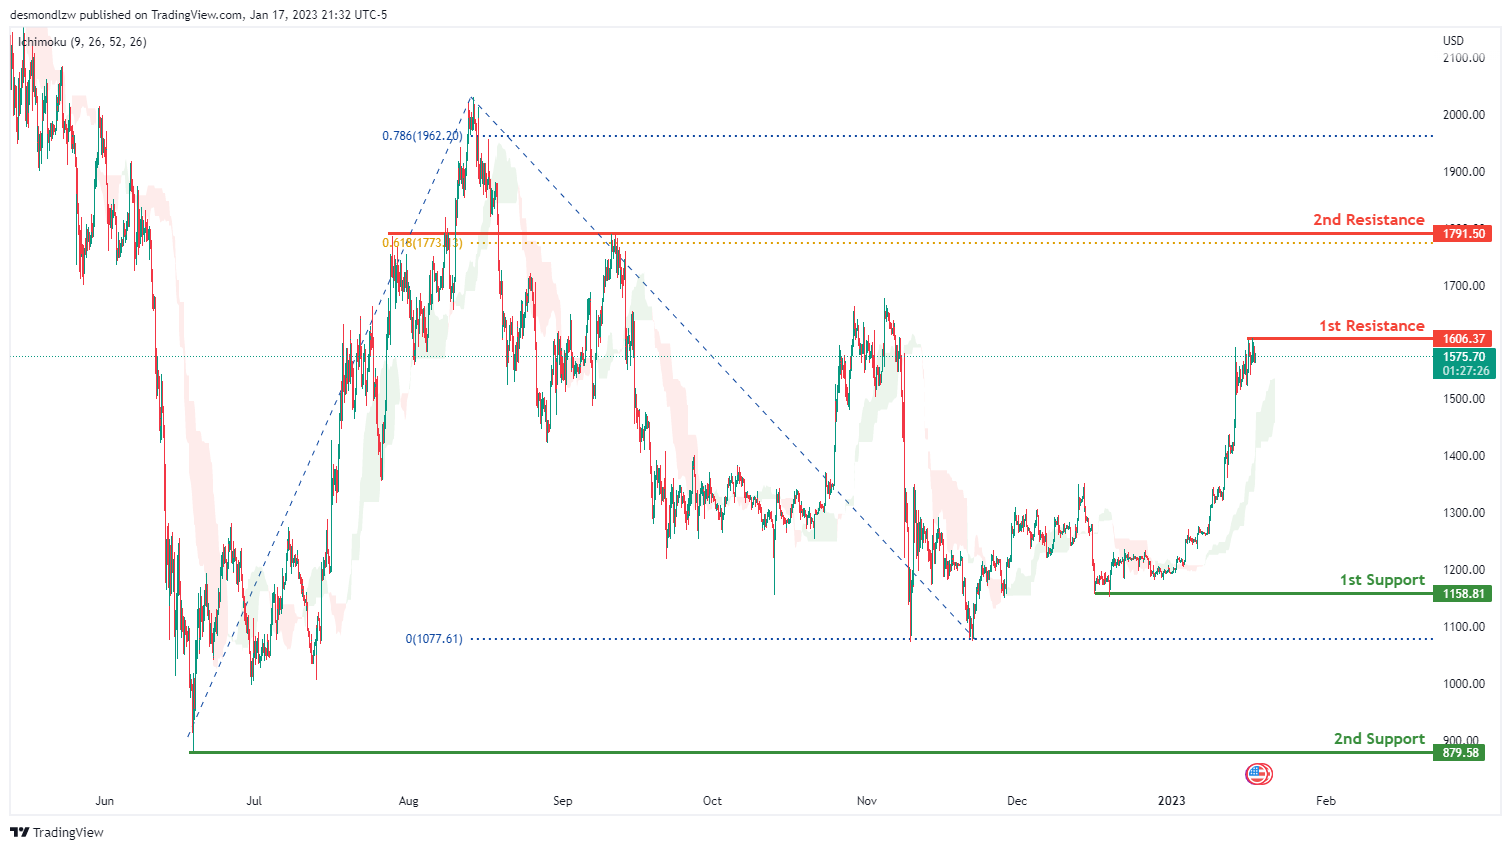
Looking at the H4 chart, my overall bias for ETHUSD is bullish due to the current price crossing above the Ichimoku cloud, indicating a bullish market. If this bullish momentum continues, expect the price to break the 1st resistance at 1606.37 and head u to the 2nd resistance at 1791.50 where the 61.8% Fibonacci projection and the previous swing high is. In an alternative scenario, the price could head back down to retest the 1st support at 1158.81. If the price break through the 1st support line, the price may further down to the 2nd support line 879.58 .
Areas of consideration:
- H4 time frame, 1st resistance of 1791.50
- H4 time frame, 1st resistance of 1606.37
- H4 time frame, 1st support at 1511.21
- H4 time frame, 2nd support at 879.58
BTCUSD:
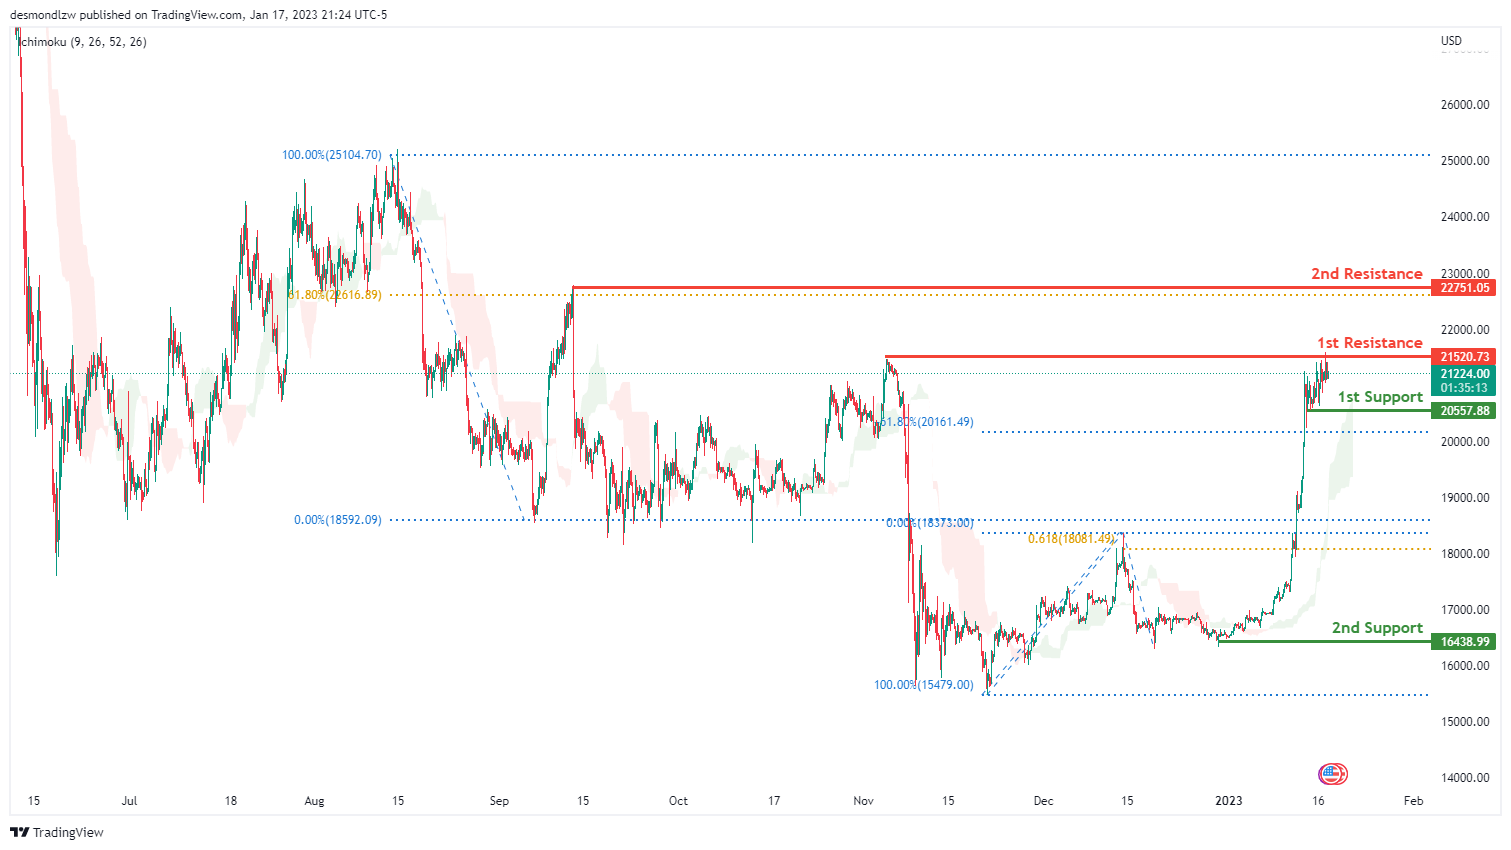
Looking at the H4 chart, my overall bias for BTCUSD is bullish due to the current price being above the Ichimoku cloud, indicating a bullish market. If this bullish momentum continues, expect the price to possibly break the 1st resistance at 21520.73, which is the key level that the price attempts to break, before heading towards the 2nd resistance at 22751.05, where the 61.8% Fibonacci line is. In an alternative scenario, the price could possibly head back down to retest the 1st support at 20557.88.
Areas of consideration:
- H4 time frame, 1st resistance 21520.73
- H4 time frame, 2nd resistance 22751.05
- H4 time frame, 1st support at 20557.88.
S&P 500:
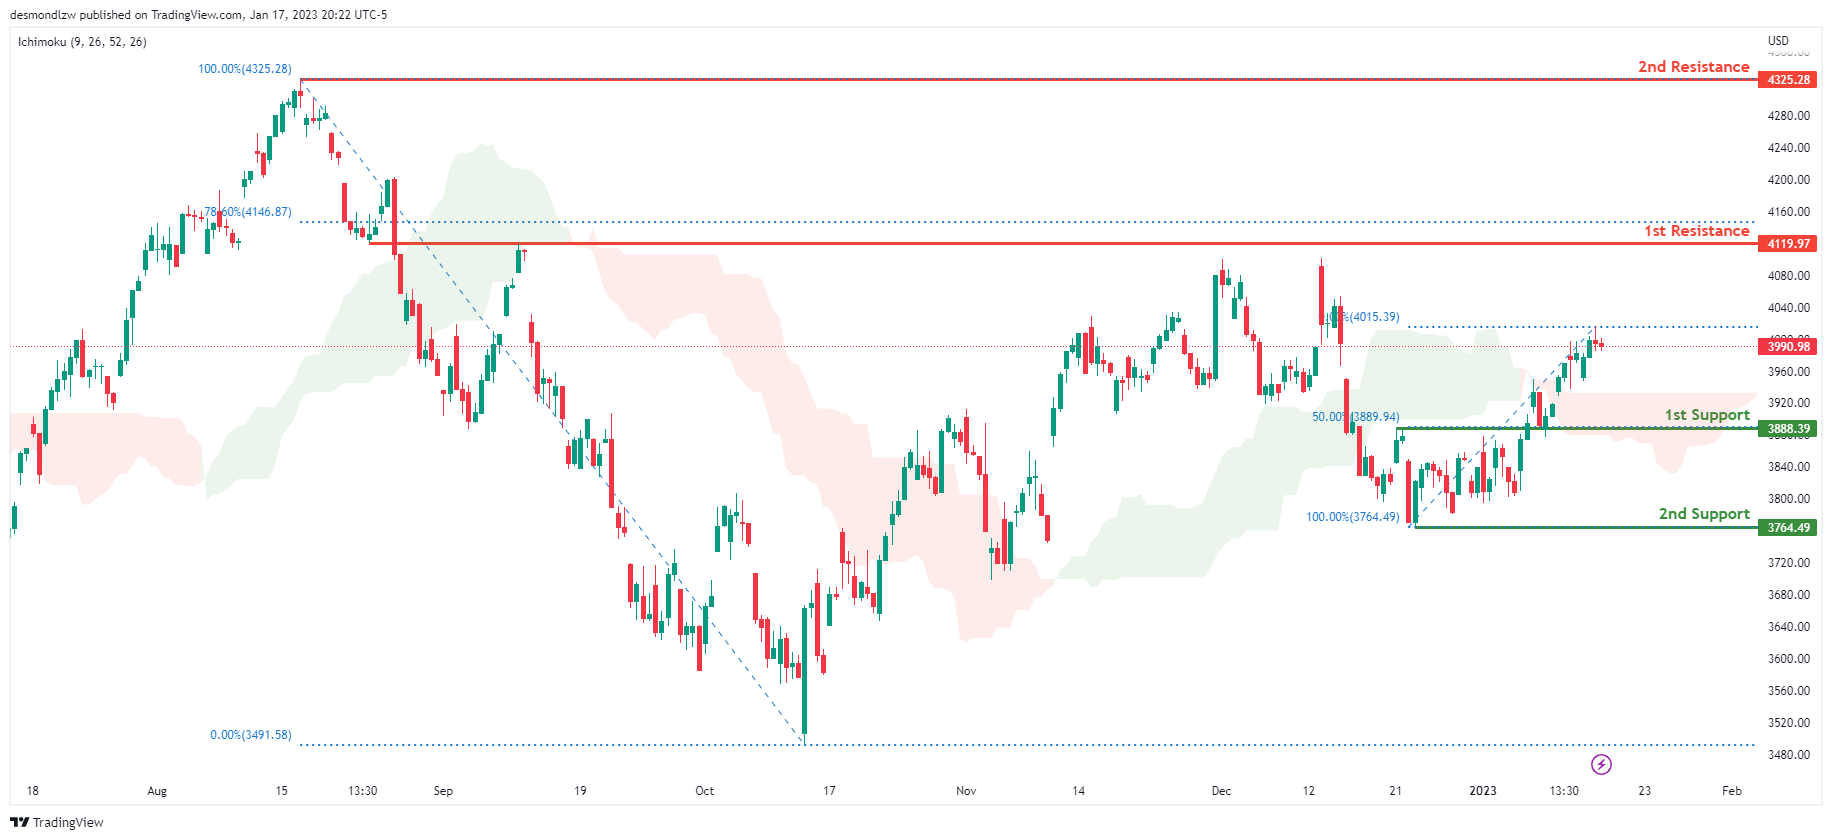
Looking at the H4 chart, my overall bias for S&P500 is bullish due to the current price being above the Ichimoku cloud, indicating a bullish market. If this bullish momentum continues, expect the price to continue heading towards the 1st resistance at 4119.97, where the 78.6% Fibonacci line is. In an alternative scenario, price could possibly head back down to retest the 1st support at 3888.39, where the 50% Fibonacci line is.
Areas of consideration:
- H4 time frame, 1st support at 3888.39
- H4 time frame, 1st resistance at 4119.97
GBP/JPY Daily Outlook
Daily Pivots: (S1) 156.57; (P) 157.30; (R1) 158.22; More...
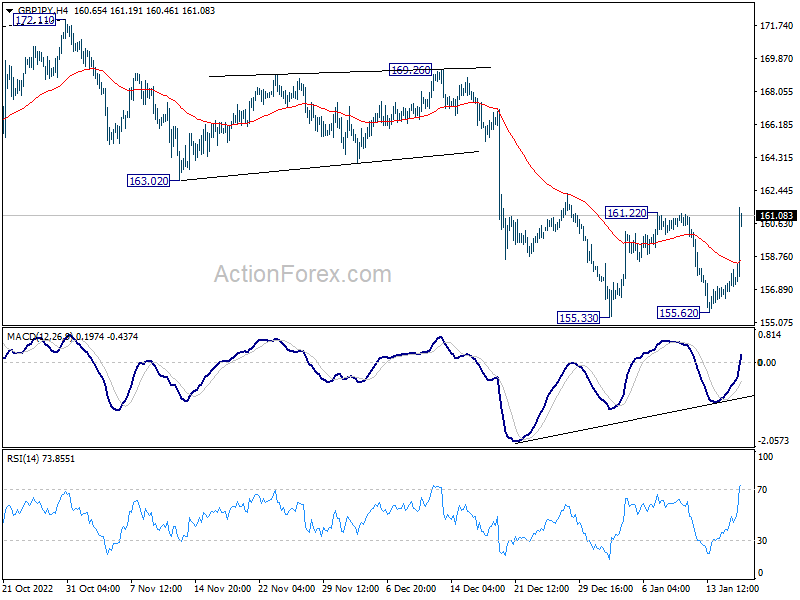
GBP/JPY's break of 161.22 resistance suggests short term bottoming at 155.33. Intraday bias is back on the upside. Sustained trading above 55 day EMA (now at 162.39) will argue that whole correction from 172.11 has completed. Further rally should then be seen back to 169.26/172.11 resistance zone. Nevertheless, rejection by 55 day EMA will retain near term bearishness for another fall through 155.33 at a later stage.
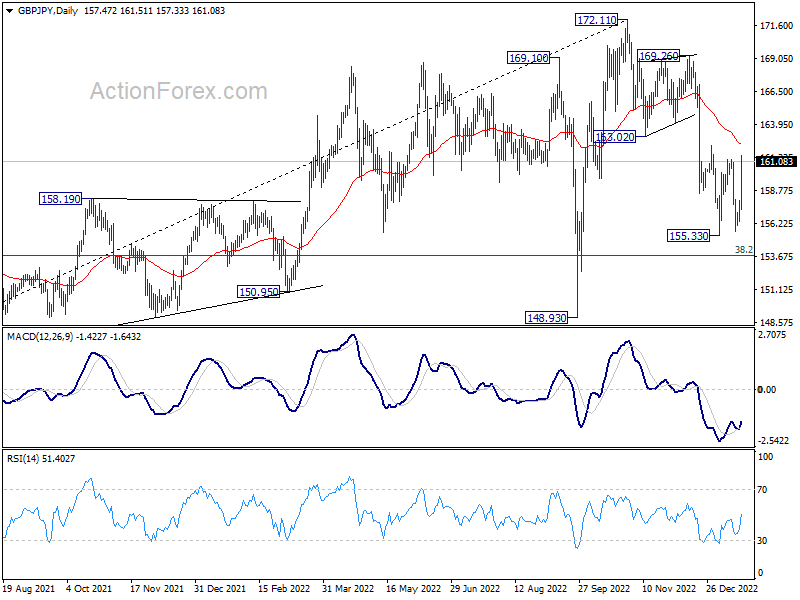
In the bigger picture, as long as 163.02 support turned resistance holds, decline from 172.11 medium term top is expected to continue to 38.2% retracement of 123.94 to 172.11 at 153.70. Sustained break there will raise the change of trend reversal and target 61.8% retracement at 142.34. Nevertheless, break of 163.02 support turned resistance will argue that the decline has completed, and retain medium term bullishness.
EUR/JPY Daily Outlook
Daily Pivots: (S1) 137.77; (P) 138.70; (R1) 139.19; More....
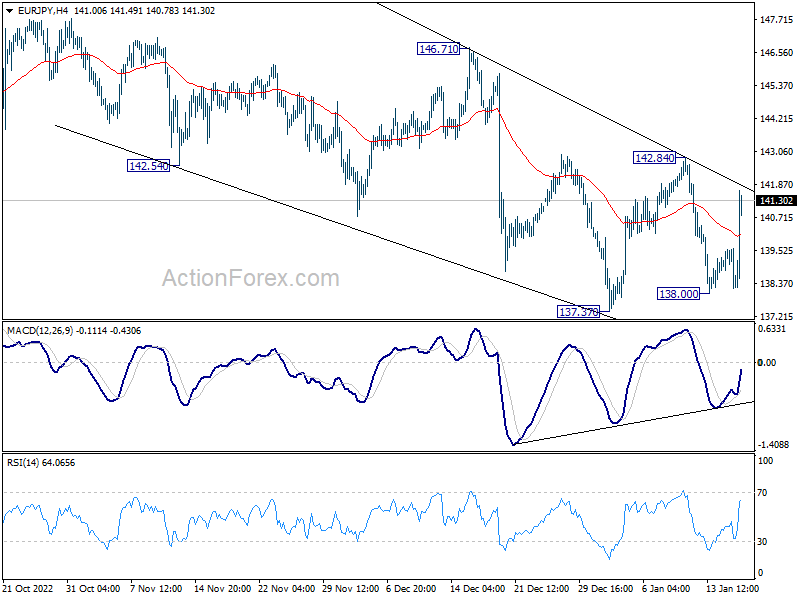
EUR/JPY rebounded strongly today but stays below 142.84 resistance. Intraday bias remains neutral first. On the downside, break of 138.00 support should resume whole decline from 148.38 to 135.40 fibonacci level next. however, firm break of 142.84 will argue that the correction from 148.38 has completed, and bring stronger rise back to 146.71 resistance.
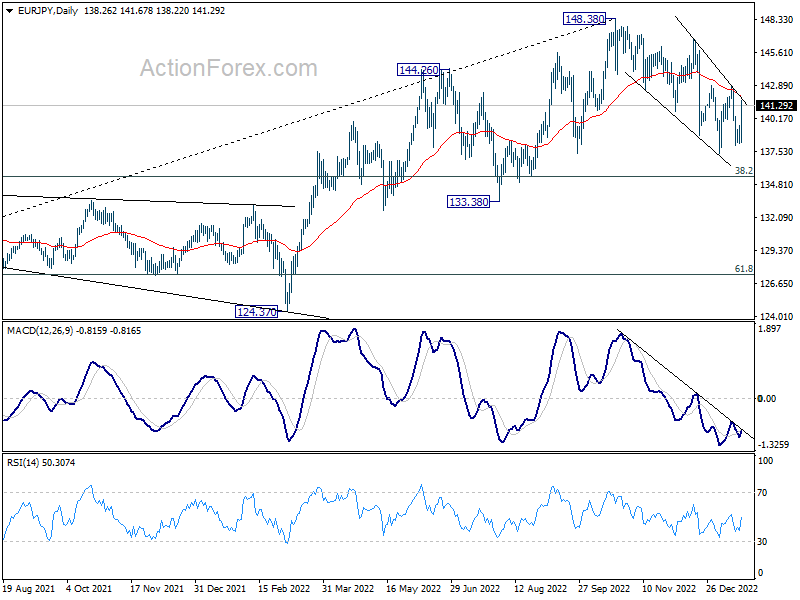
In the bigger picture, as long as 55 week EMA (now at 138.64) holds, larger up trend from 114.42 (2020 low) is still in progress for 149.76 long term resistance. However, firm break of 55 week EMA will bring deeper fall to 38.2% retracement of 114.42 to 148.38 at 135.40. Sustained break there will raise the chance of trend reversal, and target 61.8% retracement at 127.39.
EUR/GBP Daily Outlook
Daily Pivots: (S1) 0.8743; (P) 0.8815; (R1) 0.8852; More...
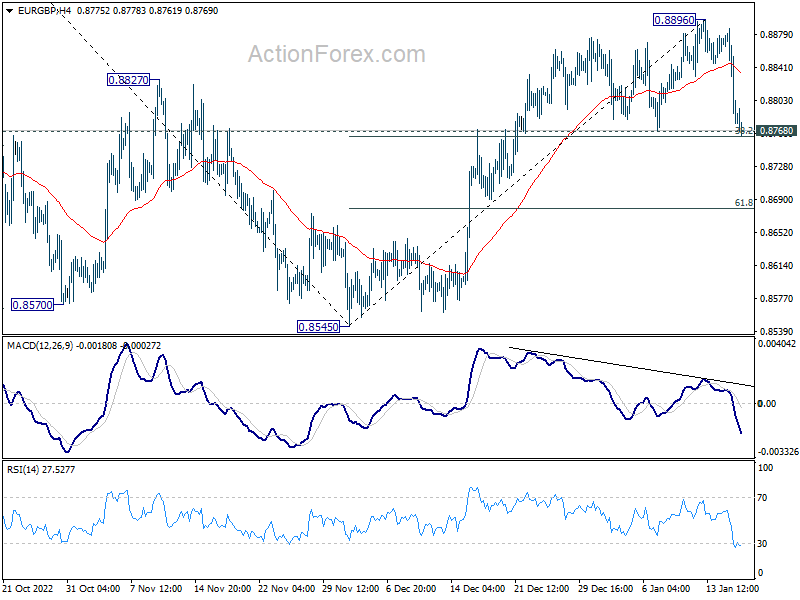
Immediate focus is now on 0.8768 support in EUR/GBP. Sustained break of 0.8768, and 38.2% retracement of 0.8545 to 0.8896 at 0.8762, will argue that whole rebound from 0.9545 has completed. Deeper fall would be seen back to 61.8% retracement at 0.8679, and possibly further to retest 0.8545 low. On the upside, break of 0.8896 will resume the rally from 0.8545 to 61.8% projection of 0.8545 to 0.8876 from 0.8768 at 0.8973.
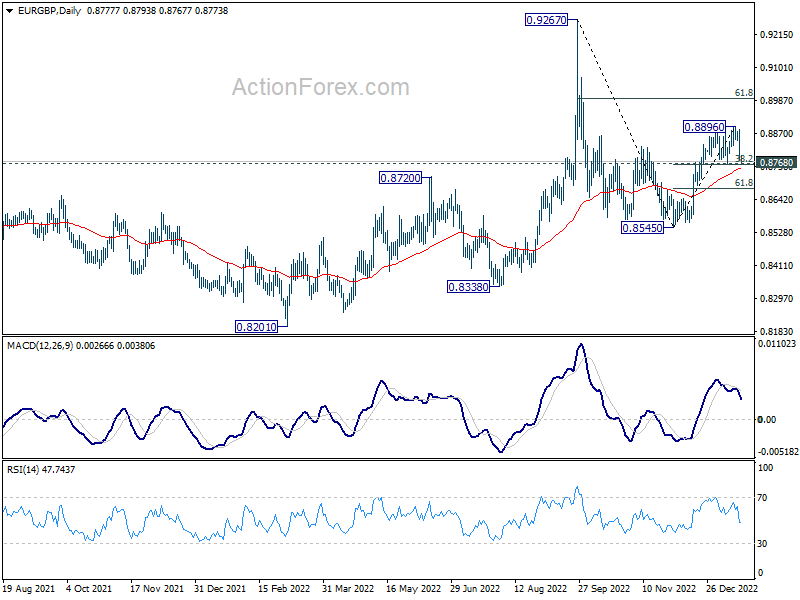
In the bigger picture, with 55 week EMA (now at 0.8618) intact, the favored case is that rise from 0.8545 is part of the whole up trend from 0.8201 (2022 low). Sustained trading above 61.8% retracement of 0.9276 to 0.8545 at 0.8997 will pave the way to retest 0.9267 high next. However, break of 0.8768 support will dampen this view and bring retest of 0.8545 low instead.
EUR/AUD Daily Outlook
Daily Pivots: (S1) 1.5372; (P) 1.5498; (R1) 1.5567; More...
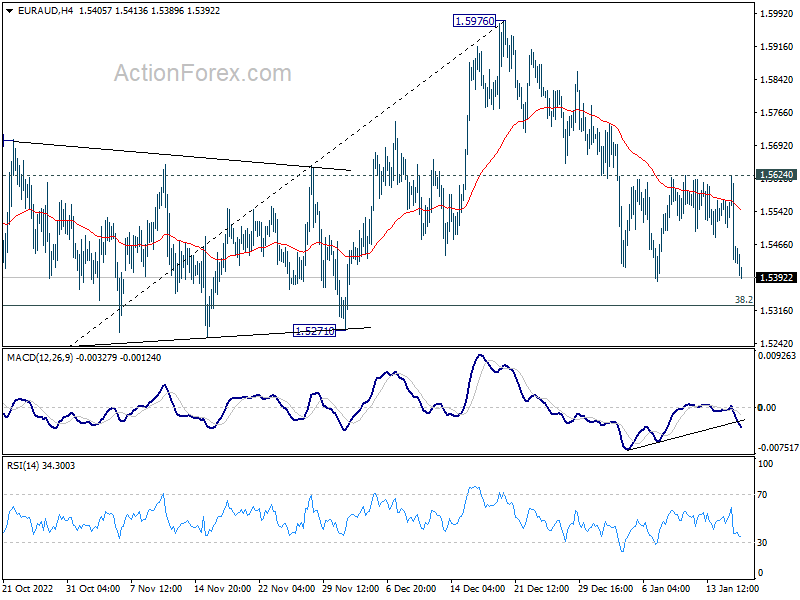
No change in EUR/AUD's outlook and intraday bias remains neutral. Another fall cannot be ruled out, but strong support could be seen from 38.2% retracement of 1.4281 to 1.5976 at 1.5329 to complete the correction from 1.5976. Firm break of 1.5614 minor resistance will turn bias back to the upside for retesting 1.5976. However, sustained trading below 1.5329 will carry larger bearish implication and target 61.8% retracement at 1.4928.
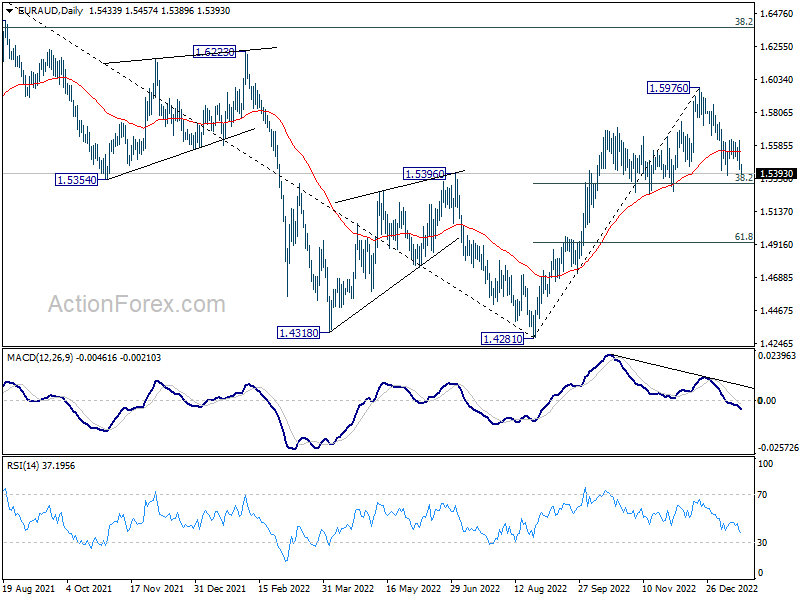
In the bigger picture, it's still early to confirm if rise from 1.4281 represents bullish trend reversal. But as long as 1.5271 support holds, such rally is in favor to continue. Break of 1.5976 will target 1.6434 key resistance next. On the other hand, firm break of 1.5271 will retain medium term bearishness instead.
EUR/CHF Daily Outlook
Daily Pivots: (S1) 0.9912; (P) 0.9970; (R1) 1.0005; More....
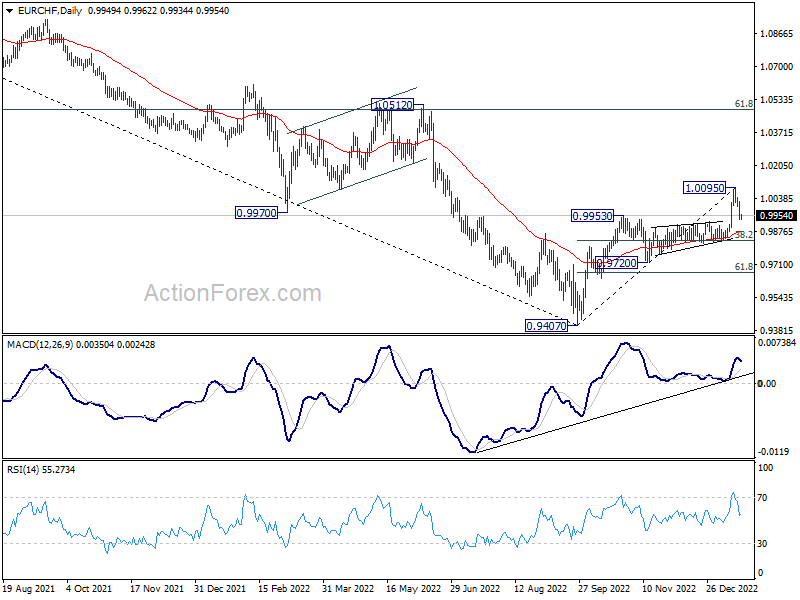
EUR/CHF's break of 0.9953 resistance turned support indicates short term topping at 1.0095. Intraday bias is mildly on the downside for 55 day EMA (now at 0.9877), or further to 38.2% retracement of 0.9407 to 1.0095 at 0.9832. On the upside, above 0.9998 minor resistance will turn bias back to the upside for retesting 1.0095 high instead.
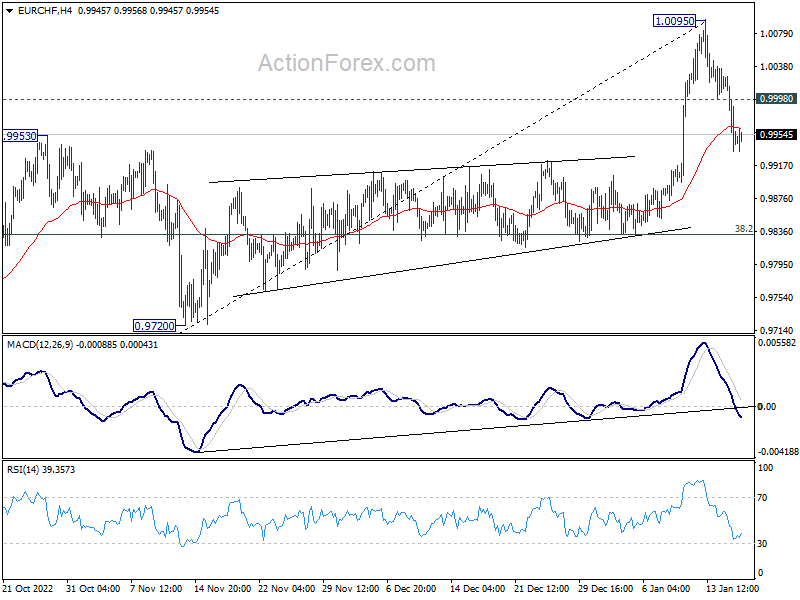
In the bigger picture, break of 38.2% retracement of 1.1149 to 0.9407 at 1.0072 and 55 week EMA (now at 1.0041) is taken as an initial sign of long term bullish reversal. Further rally is expected as long as 55 days EMA (now at 0.9866) holds. Next target is 1.0505 cluster resistance (2020 low at 1.0505, 61.8% retracement of 1.1149 to 0.9407 at 1.1484). Reactions from there should reveal long term momentum.
AUD/USD Daily Report
Daily Pivots: (S1) 0.6945; (P) 0.6971; (R1) 0.7013; More...
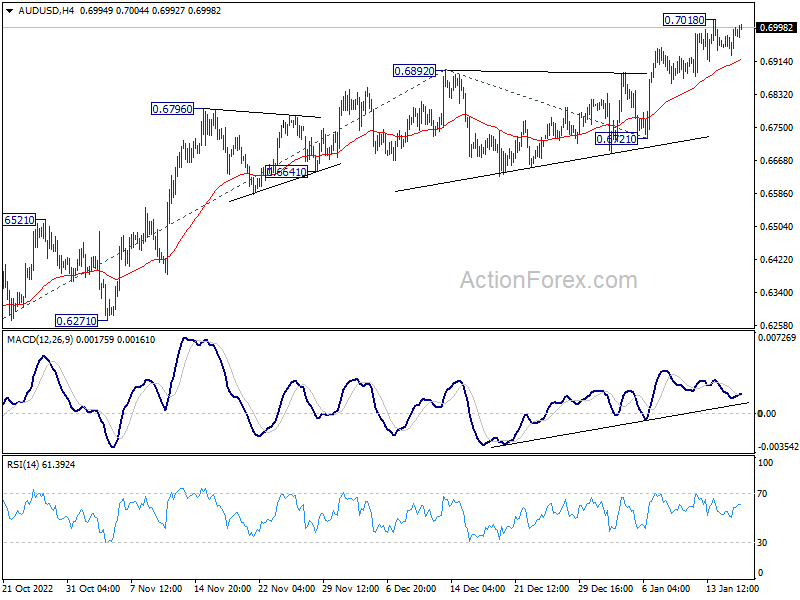
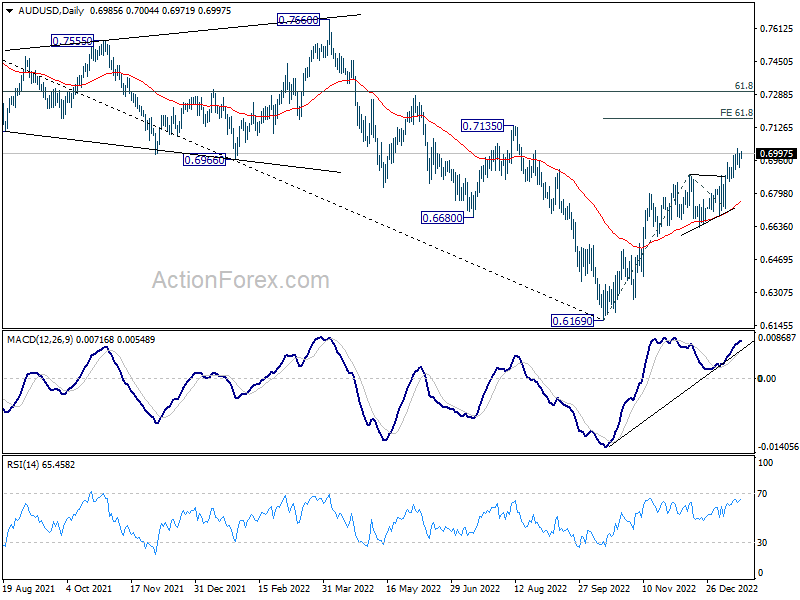
Intraday bias in AUD/USD remains neutral as consolidation continues below 0.7018. Outlook will stay bullish as long as 0.6721 support holds. Break of 0.7018 will resume larger rise from 0.6169 to 61.8% projection of 0.6169 to 0.6892 from 0.6721 at 0.7168.
In the bigger picture, corrective decline from 0.8006 (2021 high) should have completed with three waves down to 0.6169 (2022 low). Further rally should be seen to 61.8% retracement of 0.8006 to 0.6169 at 0.7304. Sustained break there will pave the way to retest 0.8006. This will now remain the favored case as long as 0.6721 support holds.
USD/CAD Daily Outlook
Daily Pivots: (S1) 1.3360; (P) 1.3399; (R1) 1.3428; More....
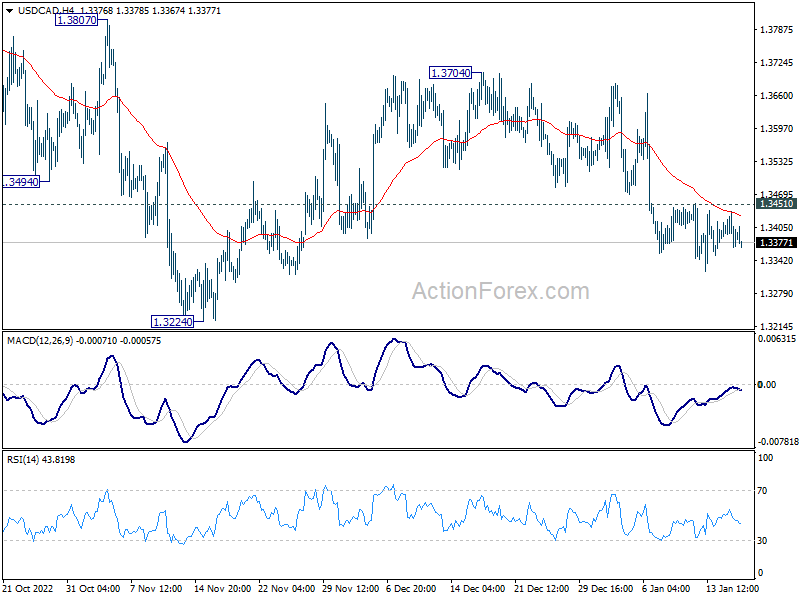
Intraday bias in USD/CAD stays neutral at this point. While further decline could be seen, downside should be contained above 1.3224 key support level. Above 1.3451 minor resistance will turn bias back to the upside for 1.3704 resistance. However, sustained break of 1.3222/4 cluster support will resume the whole fall from 1.3976 and carry larger bearish implications.
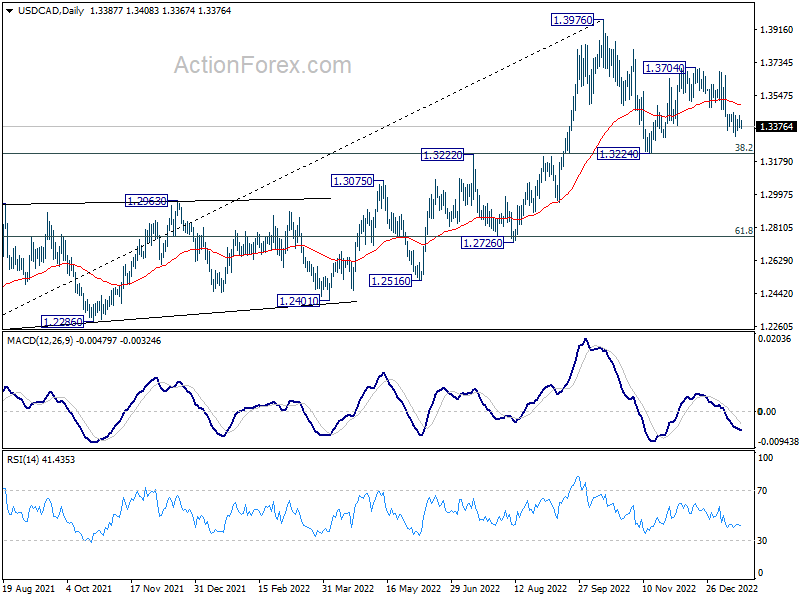
In the bigger picture, as long as 1.3222 cluster support (38.2% retracement of 1.2005 to 1.3976 at 1.3223) holds, larger up trend from 1.2005 (2021 low) is still expected to resume through 1.3976 high at a later stage. However, firm break of 1.3222/3 will indicate that the trend might have reversed. Deeper fall would be seen to next cluster support at 1.2726 (61.8% retracement at 1.2758).
EUR/USD Daily Outlook
Daily Pivots: (S1) 1.0752; (P) 1.0811; (R1) 1.0846; More...
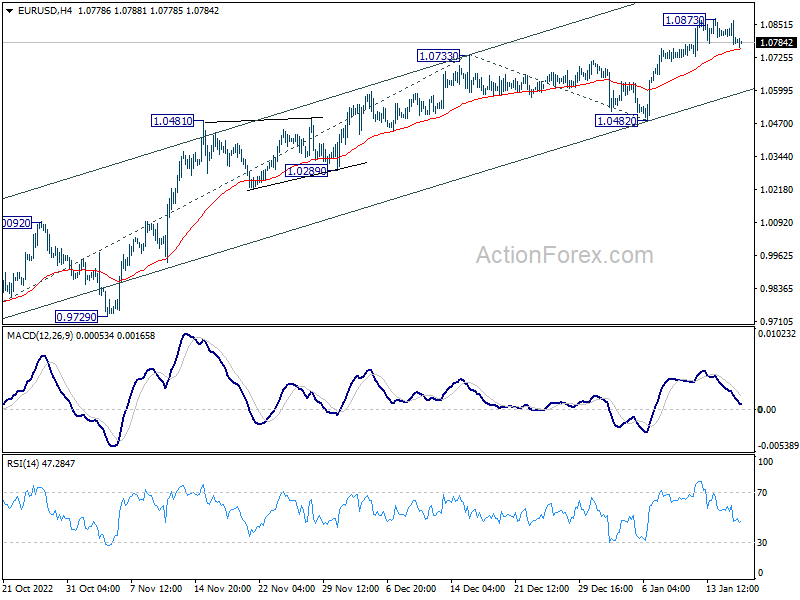
EUR/USD is staying in consolidation from 1.0873 and intraday bias remains neutral. Further rally is expected as long as 1.0482 support holds. On the upside, break of 1.0873 will resume larger rally from 0.9534 to 61.8% projection of 0.9630 to 1.0733 from 1.0482 at 1.1164 next.
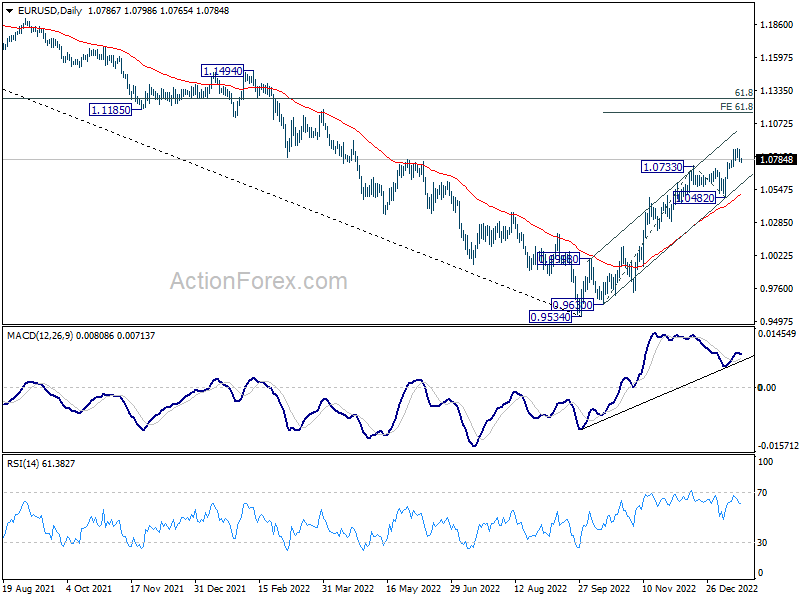
In the bigger picture, current development suggests that the rally from 0.9534 low (2022 low) is a medium term up trend rather than a correction. Further rally is in favor to 61.8% retracement of 1.2348 (2021 high) to 0.9534 at 1.1273 next. This will remain the favored case as long as 1.0482 support holds.
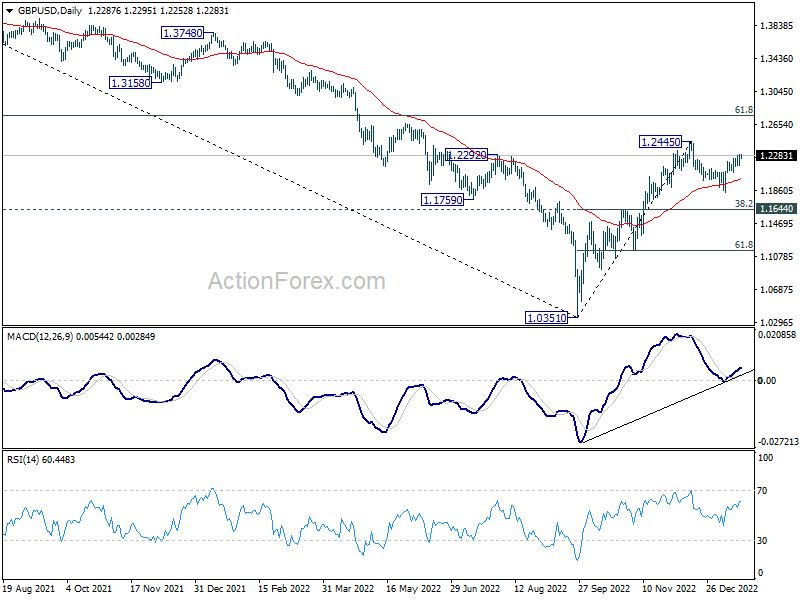
GBP/USD Daily Outlook
Daily Pivots: (S1) 1.2206; (P) 1.2253; (R1) 1.2336; More...
Intraday bias in GBP/USD stays on the upside at this point. Rise from 1.1840 is in progress for retesting 1.2445 high. Firm break there will resume whole rally from 1.0351 to 1.2759 fibonacci level. On the downside, break of 1.2168 minor support will turn intraday bias neutral again.
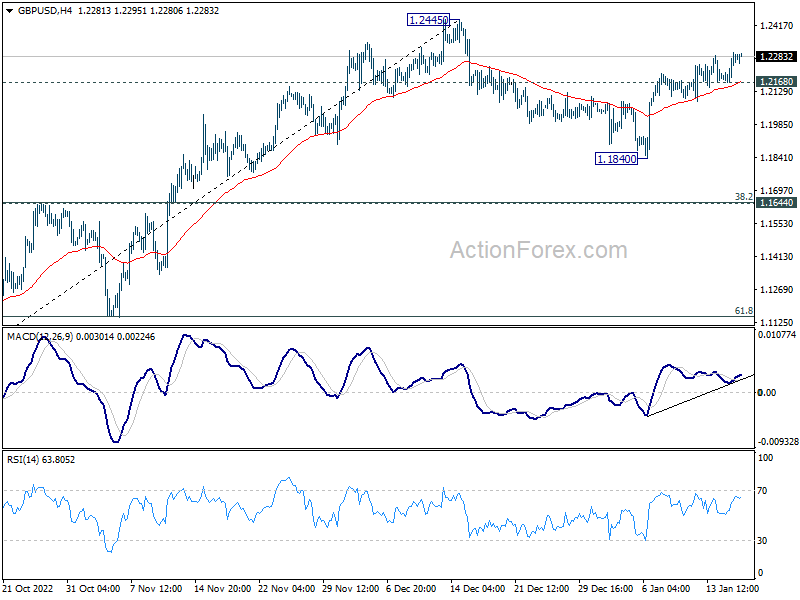
In the bigger picture, rise from 1.0351 medium term bottom is at least correcting whole down trend from 1.4248 (2021 high). Further rise is expected as long as 1.1644 resistance turned support holds. Next target is 61.8% retracement of 1.4248 to 1.0351 at 1.2759. Sustained break there will pave the way back to 1.4248.