Sample Category Title
Australia employment grew 64k in Nov, participation rate back at record high
Australia employment grew 64.0k in November, much better than expectation of 19.4k. Unemployment rate was unchanged at 3.4%, matched expectations. Participation rate rose 0.2% to 66.8%. Monthly hours worked dropped -0.4% mom.
Bjorn Jarvis, head of labour statistics at the ABS, said: "The participation rate increased by 0.2 percentage points to 66.8 per cent in November, returning to the record high we saw in June 2022. It was 1.0 percentage point higher than before the pandemic."
"The record high participation rate continues to show that it is a tight labour market, especially when coupled with very low unemployment."
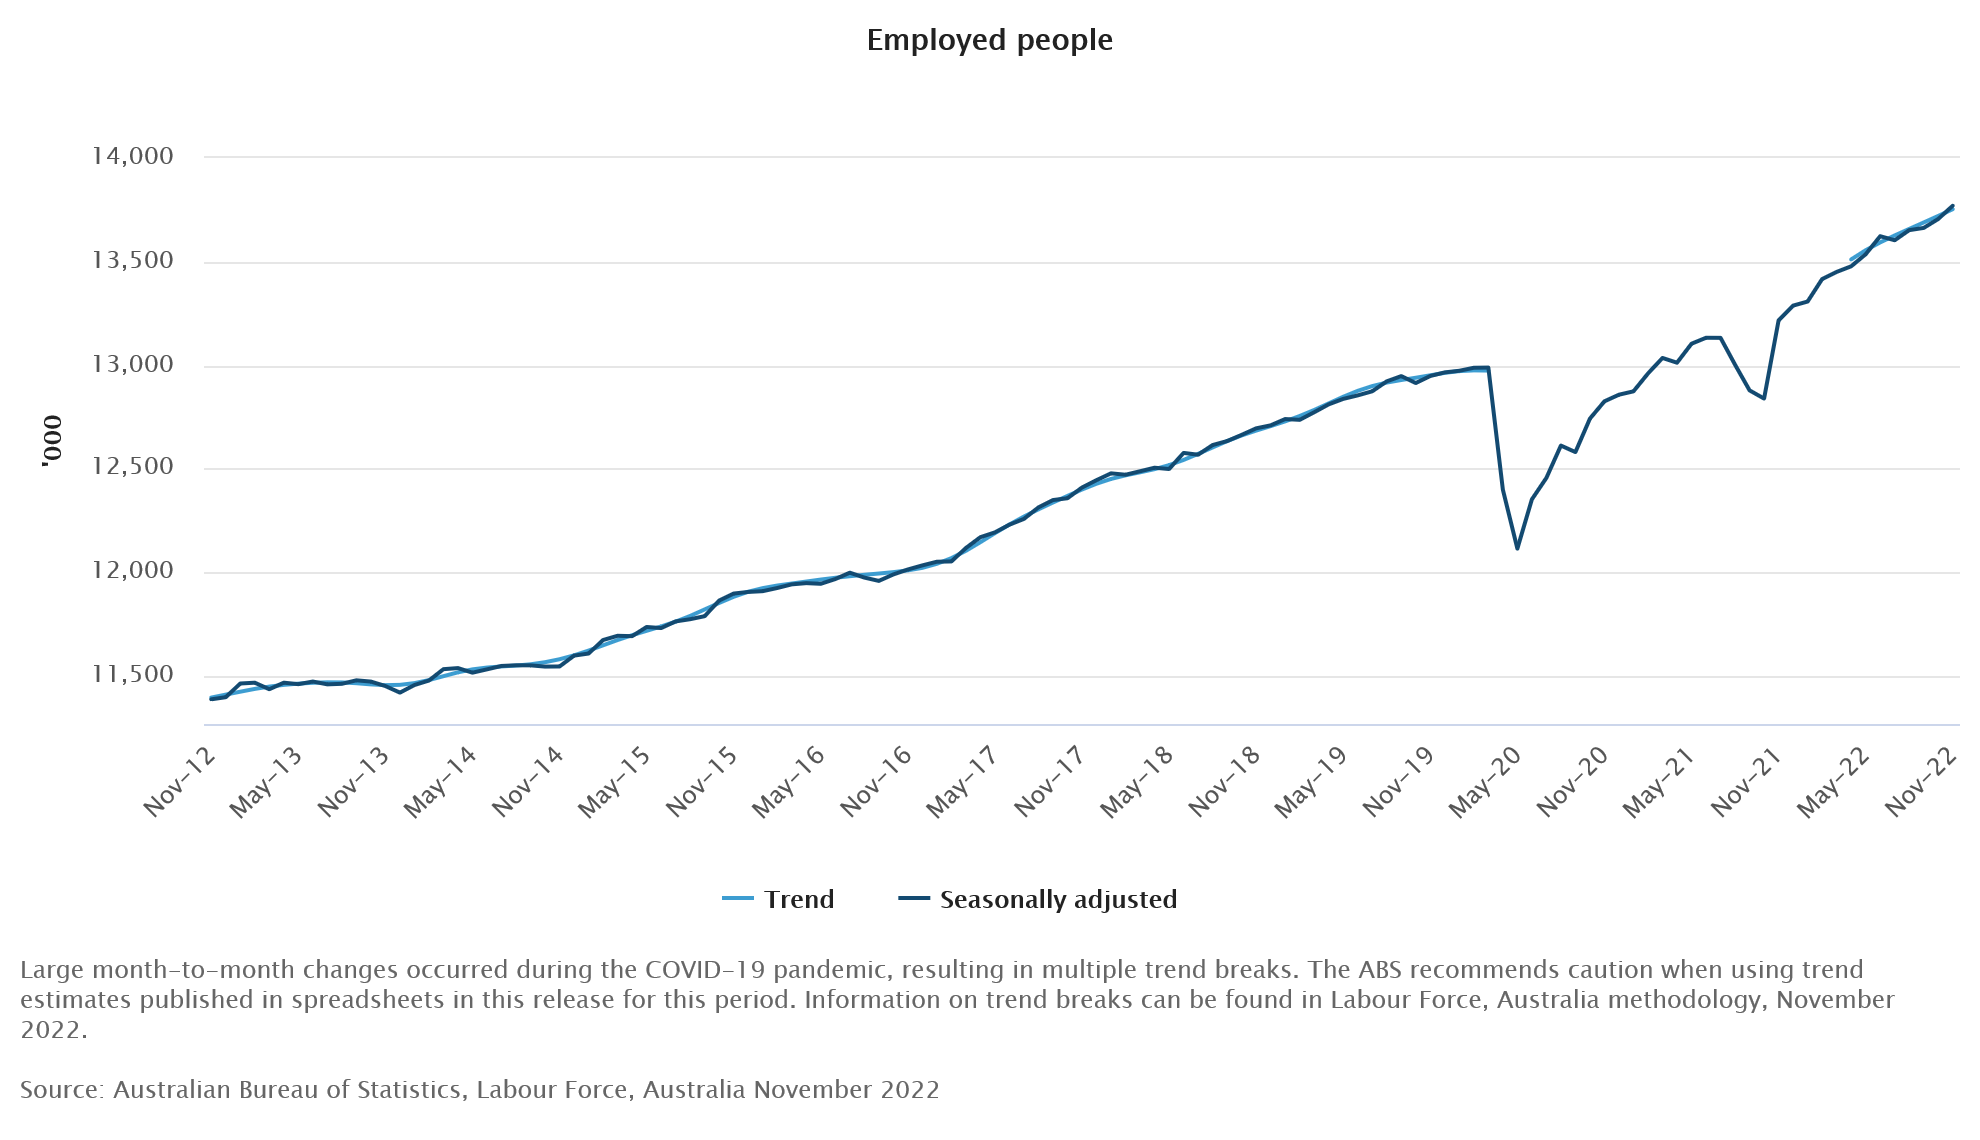
Australia November Labour Force; Employment Sets a Cracking Pace Heading into Christmas
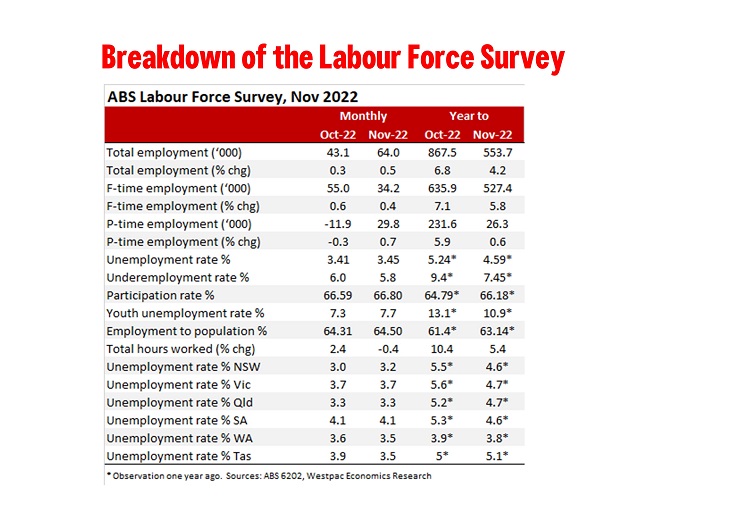
Total employment: 64k from 43.1k (revised from 32.2k); unemployment rate: 3.4% from 3.4% (unrevised 3.4%); participation rate: 66.8% from 66.6% (revised 66.5%). A strong update not just because of the larger than expected gain in employment, and a robust lift in participation to a new record high, but also the upward revisions to both employment and participation.
The 0.5% gain in employment lifted the three-month average increase to just under 40k per month but due to base effect employment growth in the year moderated to 553.7k/4.2%yr from 867.5k/6.8%yr. It also lifted the employment/population ratio to a new record high of 64.5%.
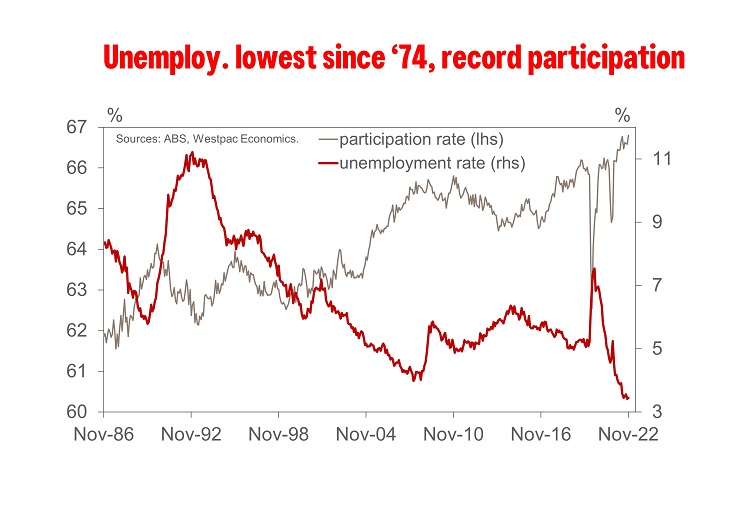
The participation rate increased by 0.2ppt to 66.8% November, returning to the previous record back in June 2022 when it was 1.0ppt higher than before the pandemic. Female participation also returned to the historical high of June, lifting 0.2ppt to 62.4% per cent. Male participation rate also rose 0.2ppt to 71.3%.
Australian has the tightest labour market seen in a generation (at least) highlighted not just by the lowest unemployment rate since November 1974 (3.4%) but a record high in both participation and the employment to population ratio.
The lift in participation saw the labour force grow 71.3k, more than matching the gain in employment holding the unemployment rate flat at 3.4%; at two decimal place the unemployment rate rose to 3.45% from 3.41% so it only just rounded down.
Our year end forecast for 3.3% (quarter average) is now quite hard to achieve but not because of poor employment outcomes but rather to higher than expected participation thus the labour market is set to end the year in a stronger than expected position.
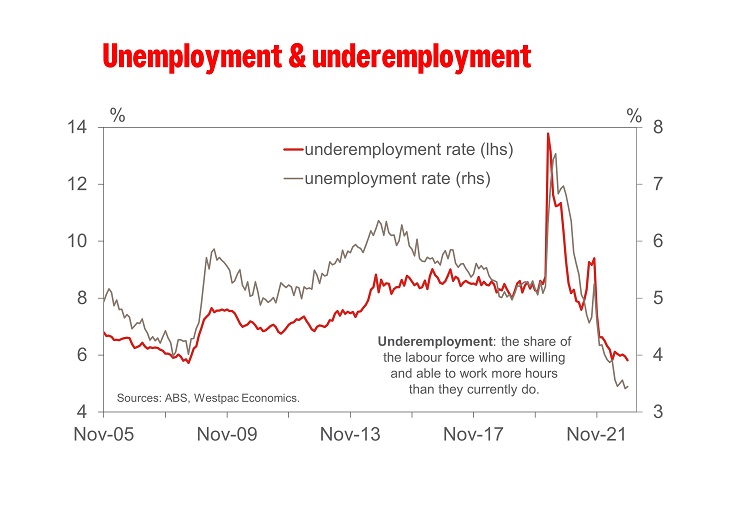
Underemployment, those employed who are willing and able to work more hours if offered them, fell 0.2ppt to 5.8%. Underemployment has been lagging the improvement in unemployment which may have been an indicator that the labour market was not as strong as it first appeared – if the labour market was that tight why were the underemployed being worked harder? We did think that misallocation, underemployed workers were in sectors, or with skills, that were is less demand. Give the recent fall maybe this was part of the story and thus a timing issues as labour is not perfectly mobile or substitutable.
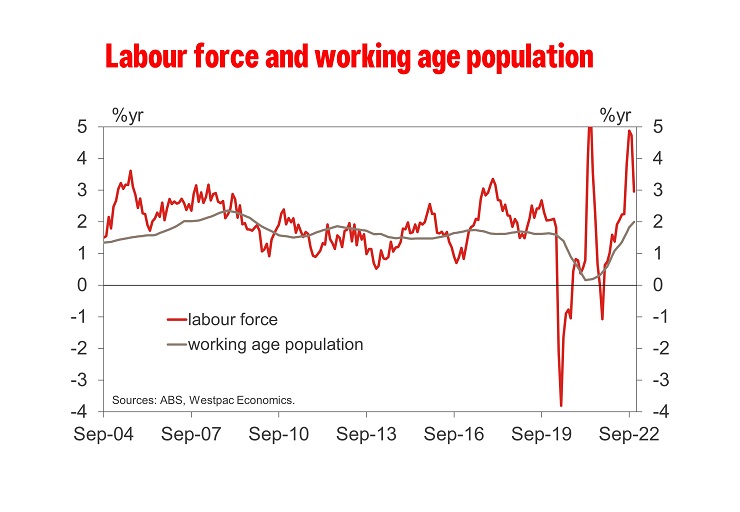
Monthly hours worked decreased by 0.4% in November but following on from a 2.4% surge in October the recovery in hours worked remains ahead of employment. Despite the relatively strong growth in hours worked during 2022, there continued to be a higher than usual number of people working reduced hours due to illness. In November, the number of people working reduced hours due to illness grew by 50k, to 520k which is still around a third higher than we usually see at this time of the year.
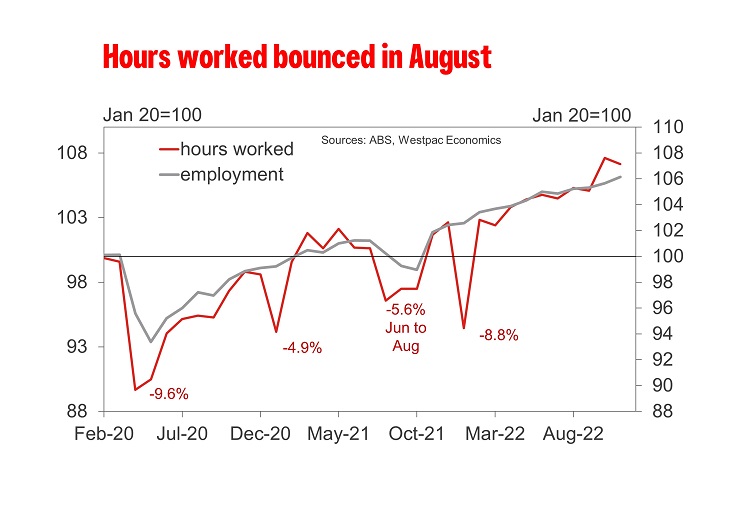
We again note that the Labour Force Survey continues to report a pickup in immigration with growth in the working age population lifting. From around 20k per month last December it lifted to 38.8k in October and lifted by a similar amount in November. Annual growth in working age population has now lifted from just 0.6%yr in December to 2.0%yr which is stronger than the pre-Covid pace of between 1.6%yr to 1.7%yr.
Technical Outlook and Review
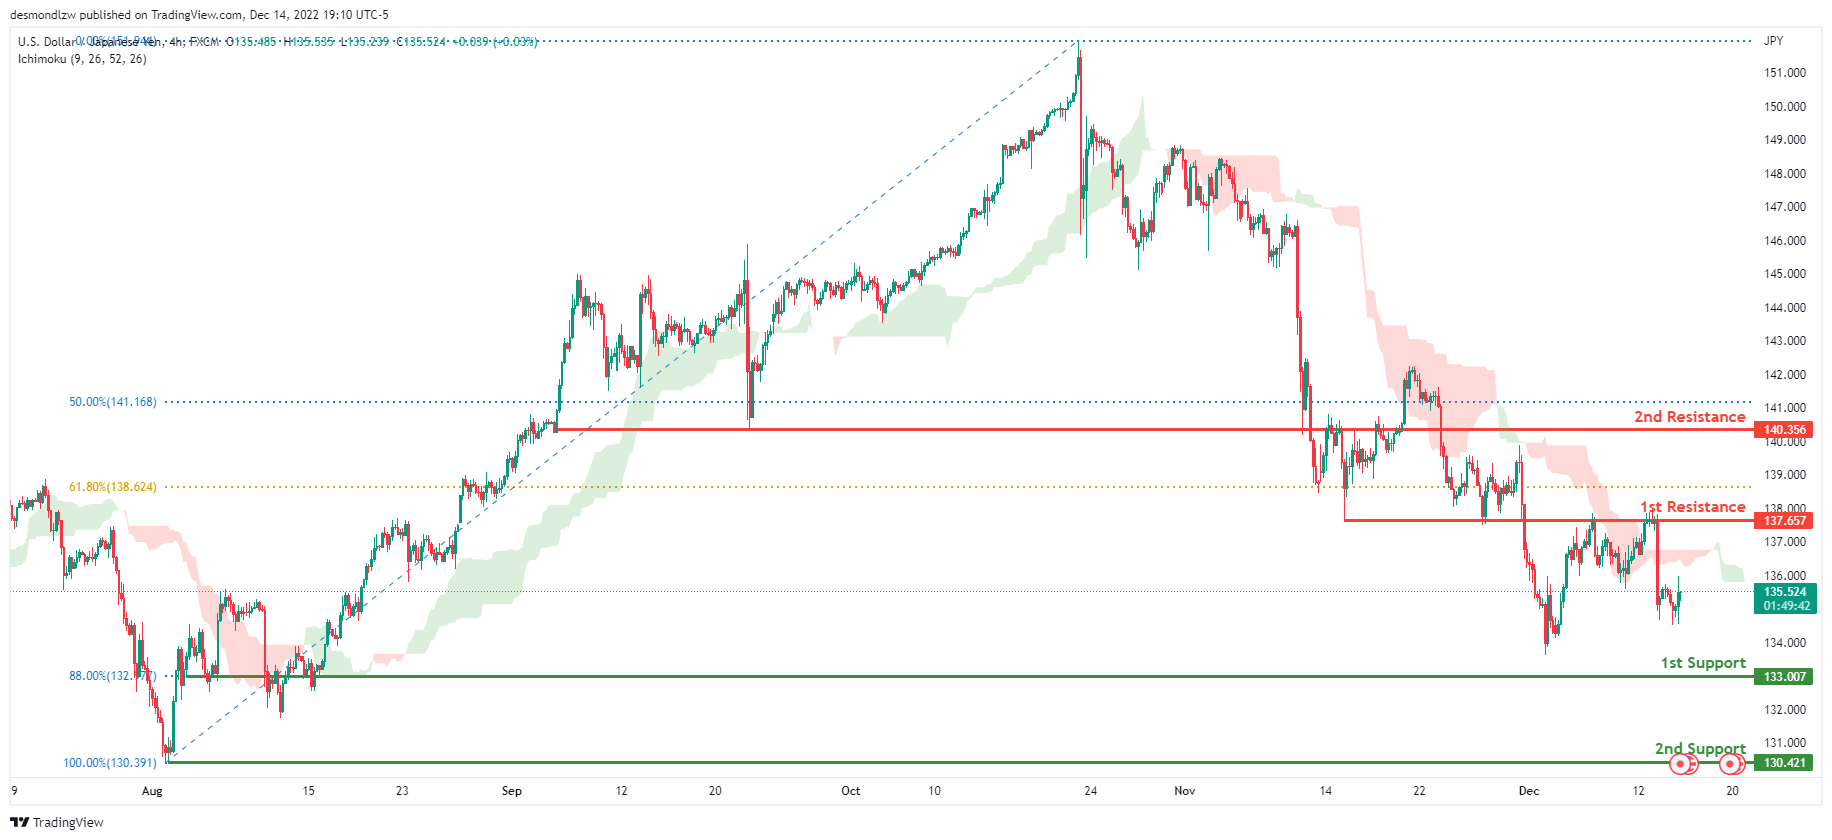
USD/JPY:
The current general bias for USDJPY on the H4 chart is bearish. To add confluence to this, the price is crossing under the Ichimoku cloud which indicates a bearish market. If the bearish momentum continues, expect USDJPY to continue heading towards the 1st support at 133.007 where the 88% Fibonacci line is. In an alternative scenario, price could head back up to retest the 1st resistance line at 137.657, where the 61.8% Fibonacci line and previous low are located.
Areas of consideration:
- H4 time frame, 1st resistance at 137.657
- H4 time frame, 1st support at 133.007
DXY:
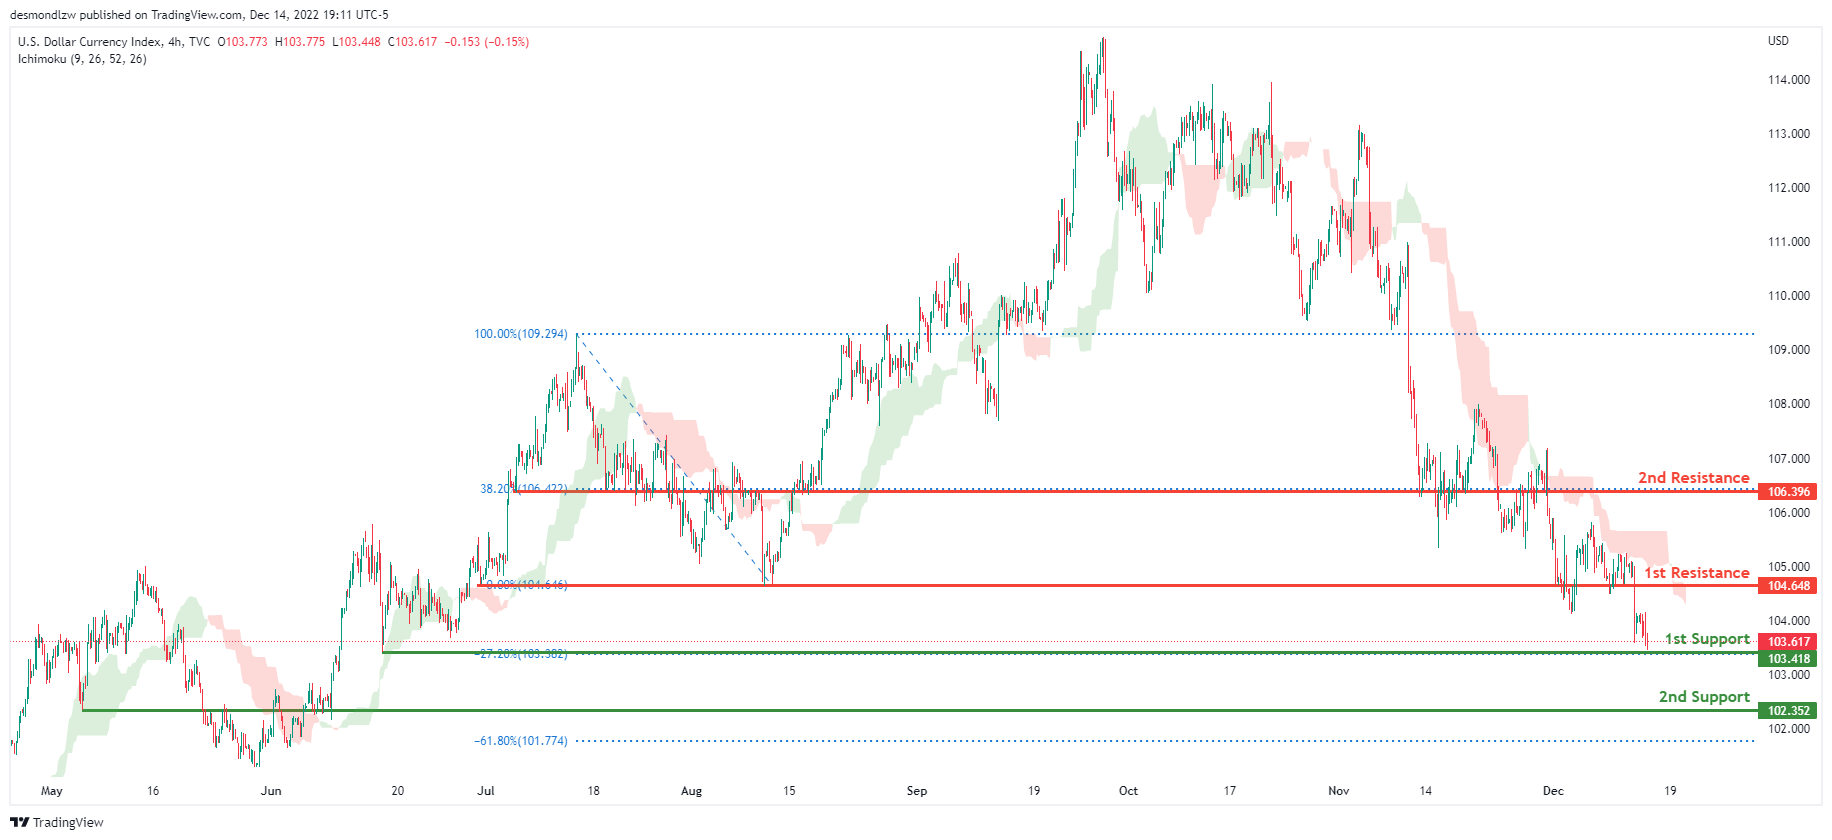
On the H4 chart, the overall bias for DXY is bearish. To add confluence to this, the price is below the Ichimoku cloud which indicates a bearish market. If this bearish momentum continues, expect the price to possibly break the 1st support line at 103.418, where the -27.2% Fibonacci expansion line is before heading towards the 2nd support at 102.352, where the -61.8% Fibonacci expansion line is. In an alternative scenario, price could head back up and retest the 1st resistance line resistance at 104.648, where the previous swing low is.
Areas of consideration:
- H4 time frame, 1st resistance at 104.648
- H4 time frame, 1st support at 103.418
- H4 time frame, 2nd support at 102.352
EUR/USD:
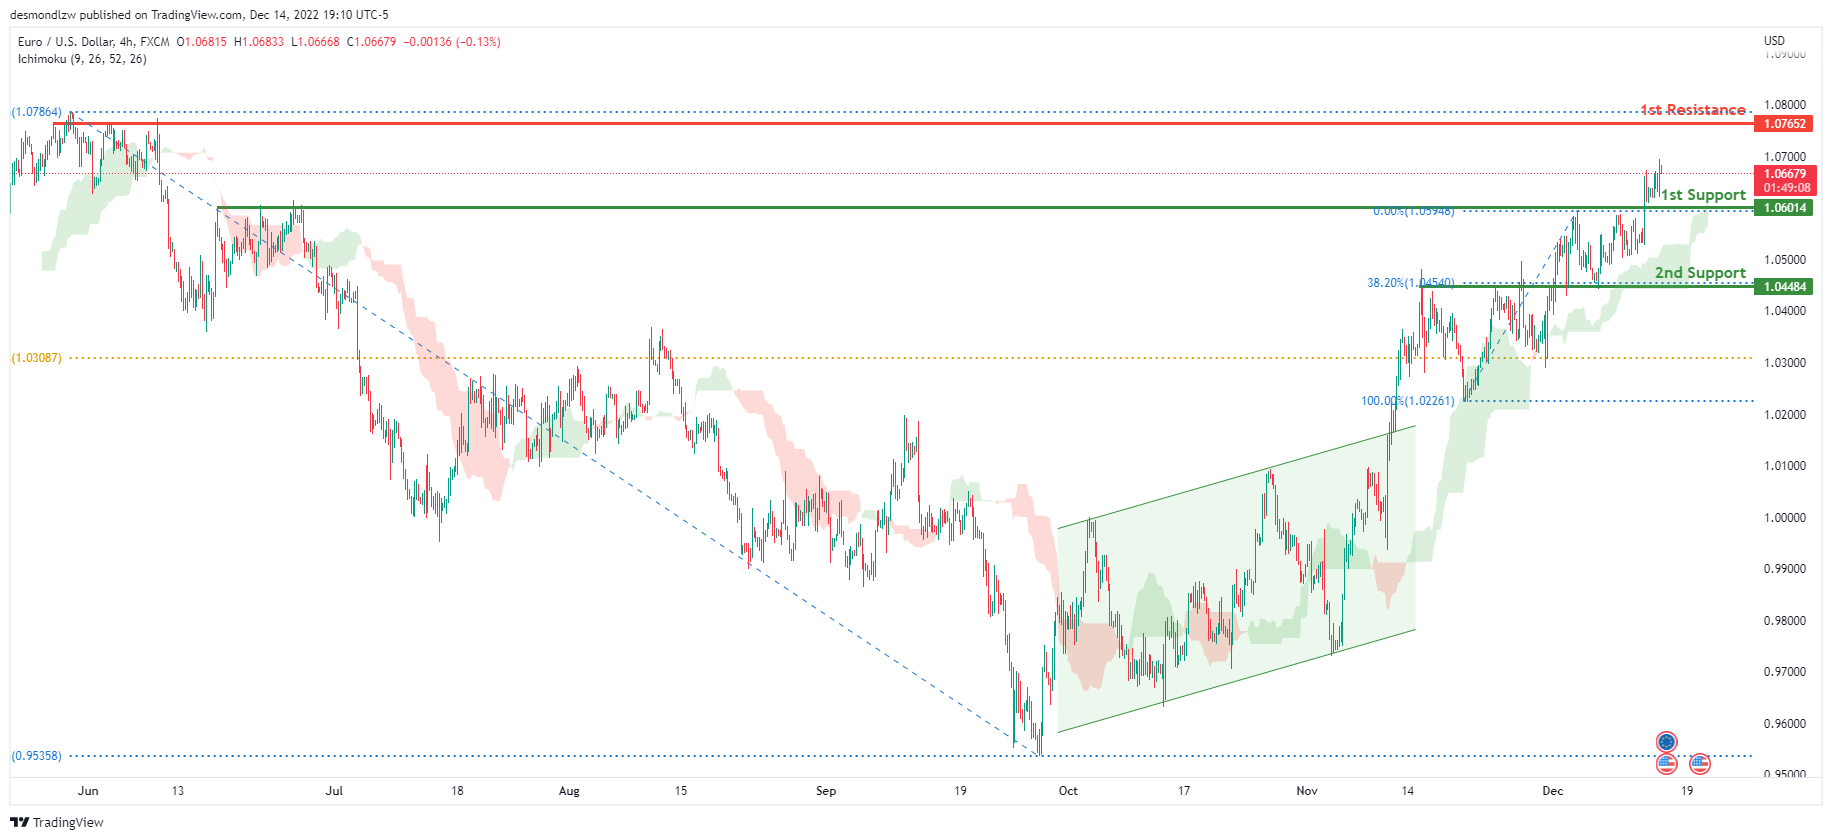
Looking at the H4 chart, my overall bias for EURUSD is bullish due to the current price being above the Ichimoku cloud, indicating a bullish market. To add confluence to this bias, price has also broken above the ascending bullish channel. If this bullish momentum continues, expect the price to possibly head towards the 1st resistance at 1.07652, where the previous swing high is. In an alternate scenario, price could possibly head back down to retest the 1st support level at 1.06014, where the previous swing high and 78.6% Fibonacci line are located.
Areas of consideration :
- H4 1st resistance at 1.07652
- H4 1st support at 1.06014
GBP/USD:
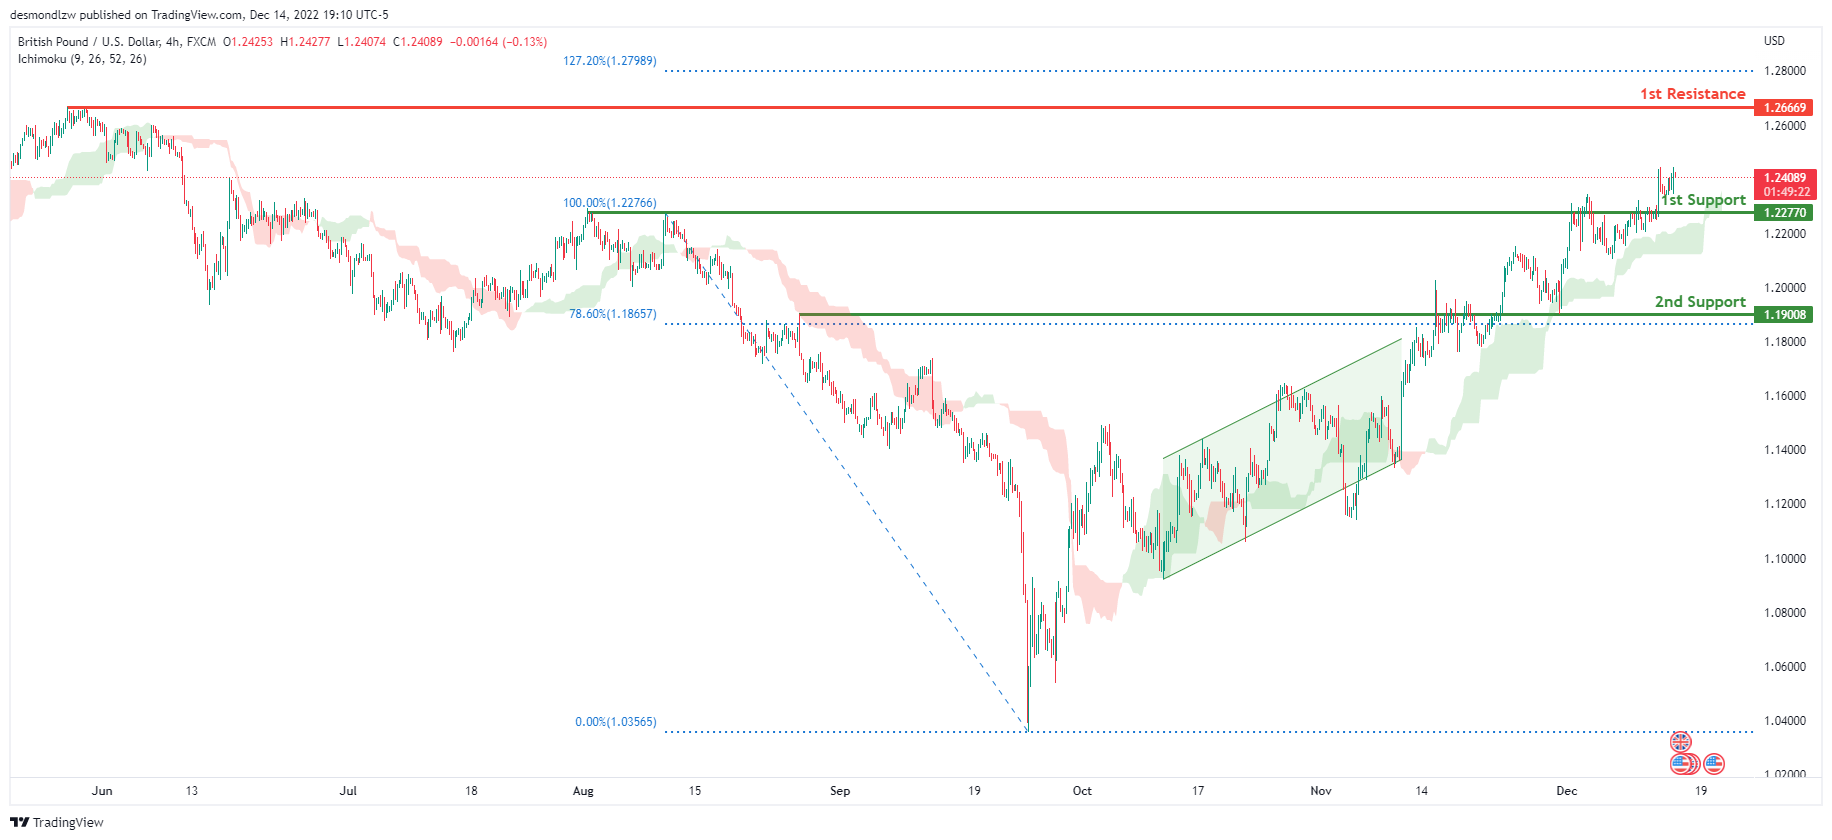
Looking at the H4 chart, my overall bias for GBPUSD is bullish due to the current price being above the Ichimoku cloud, indicating a bullish market. Expecting price to head back up to possibly continue heading towards the 1st resistance at 1.26669, where the previous swing high is. In an alternative scenario, price could possibly head back down to retest the 1st support at 1.22770, where the previous swing high is.
Areas of consideration:
- H4 1st resistance at 1.26669
- H4 1st support at 1.22770
USD/CHF:
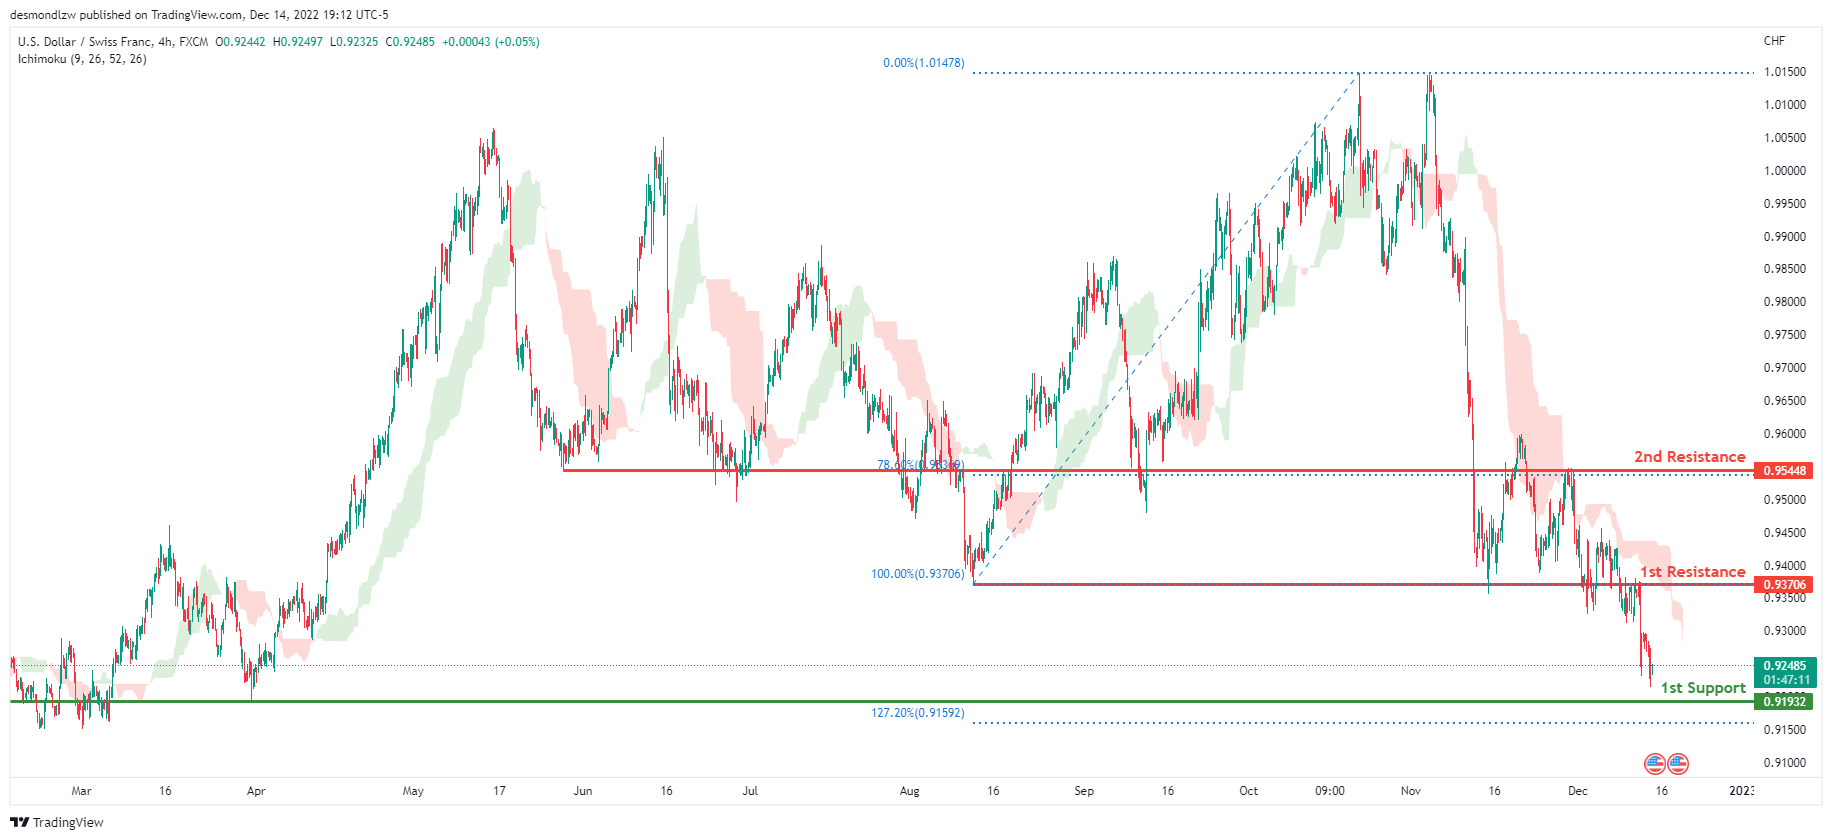
The overall bias for USDCHF on the H4 chart is bearish. In addition, the price is below the Ichimoku cloud, indicating a bearish market. If the current bearish trend continues, expect the price to head back down towards the 1st support line at 0.91932, where the previous swing low and 12.72% Fibonacci extension line is . In an alternative scenario, price could possibly head up towards the 1st resistance at 0.93706, where the previous swing low is .
Areas of consideration
- H4 1st support at 0.91932
- H4 1st resistance at 0.93706
XAU/USD (GOLD):
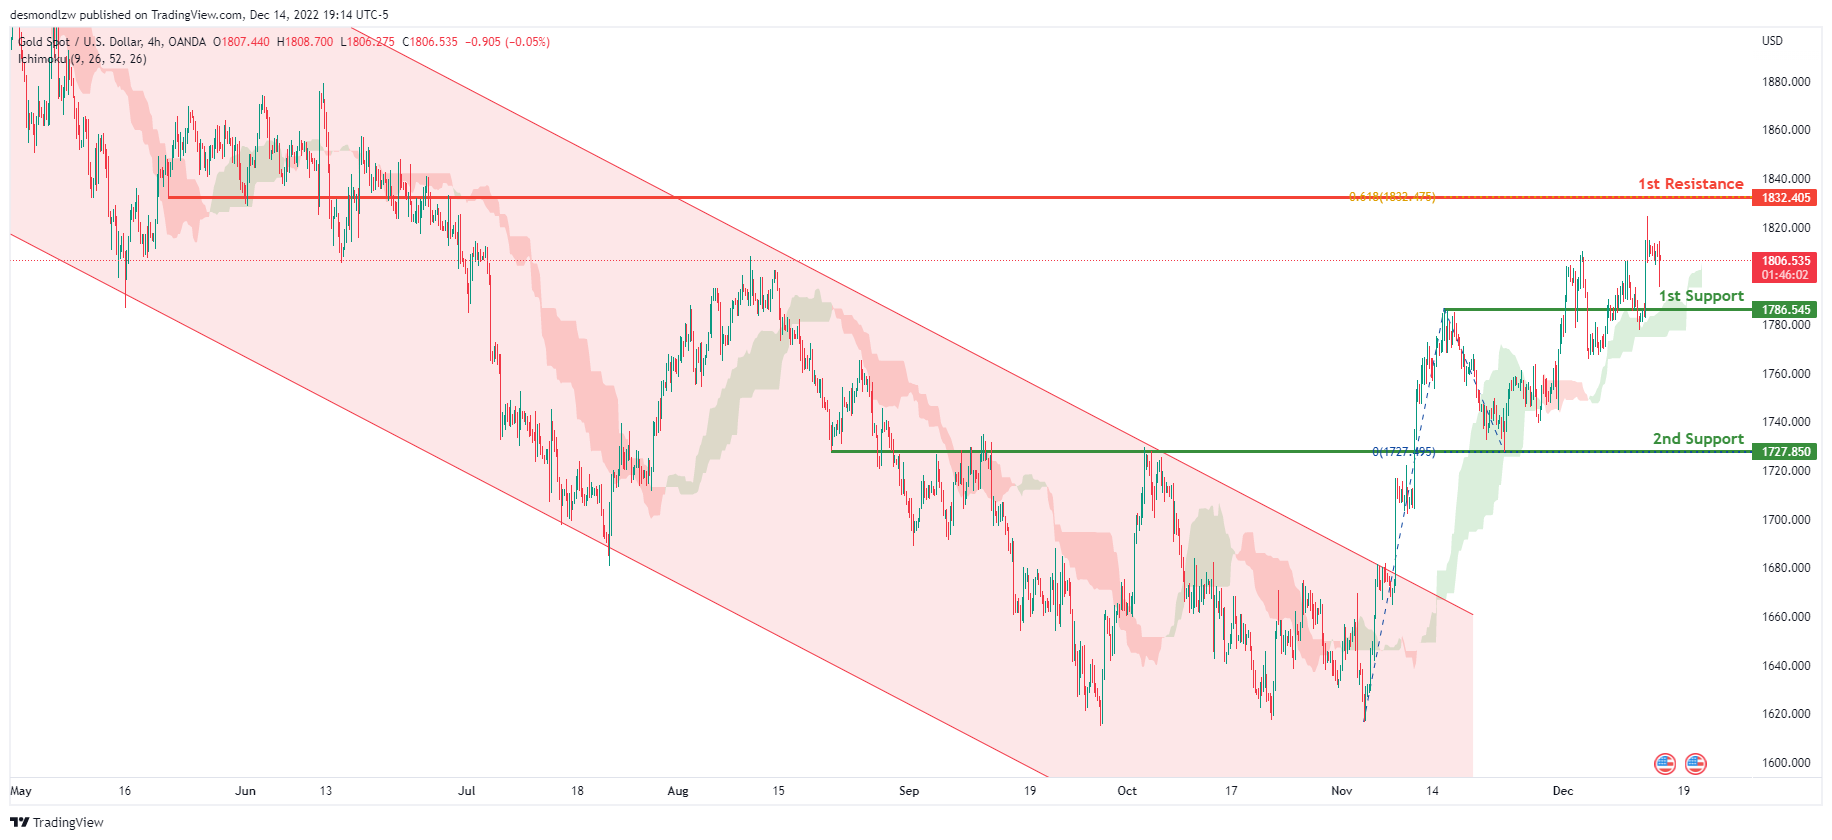
Looking at the H4 chart, my overall bias for XAUUSD is bullish due to the current price crossing above the Ichimoku cloud, indicating a bullish market. If this bullish momentum continues, expect the price to possibly continue heading towards the 1st resistance at 1832.405, where the 61.8% Fibonacci projection line is. In an alternate scenario, price could possibly head back down towards the 1st support level at 1786.545, where the previous swing high is located
Areas of consideration:
- H4 time frame, 1st resistance at 1832.405
- H4 time frame, 1st support at 1786.545
AUD/USD:
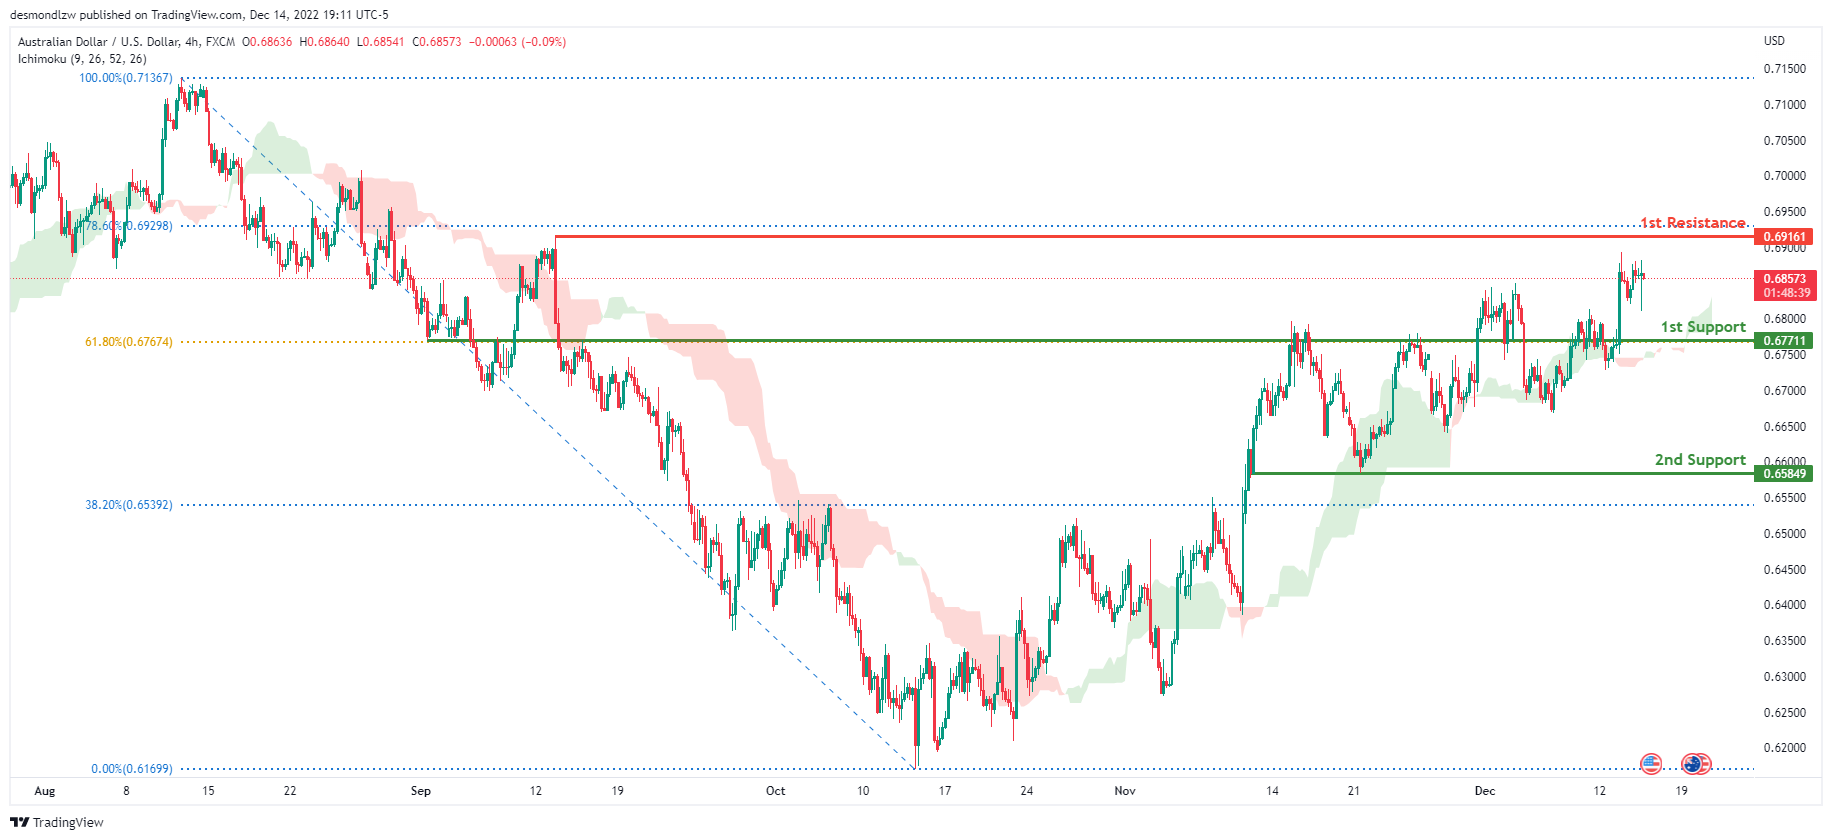
Looking at the H4 chart, my overall bias for AUDUSD is bullish due to the current price being above the Ichimoku cloud, indicating a bullish market. If this bullish momentum continues, expect the price to continue heading towards the 1st resistance at 0.69161, where the 78.6% Fibonacci line is. In an alternative scenario, price could possibly head back down towards the 1st support line at 0.67711, where the 61.8% Fibonacci line is
Areas of consideration
- H4, 1st resistance at 0.69161
- H4, 1st support at 0.67711
NZD/USD:
Looking at the H4 chart, my overall bias for NZDUSD is bullish due to the current price being above the Ichimoku cloud, indicating a bullish market.
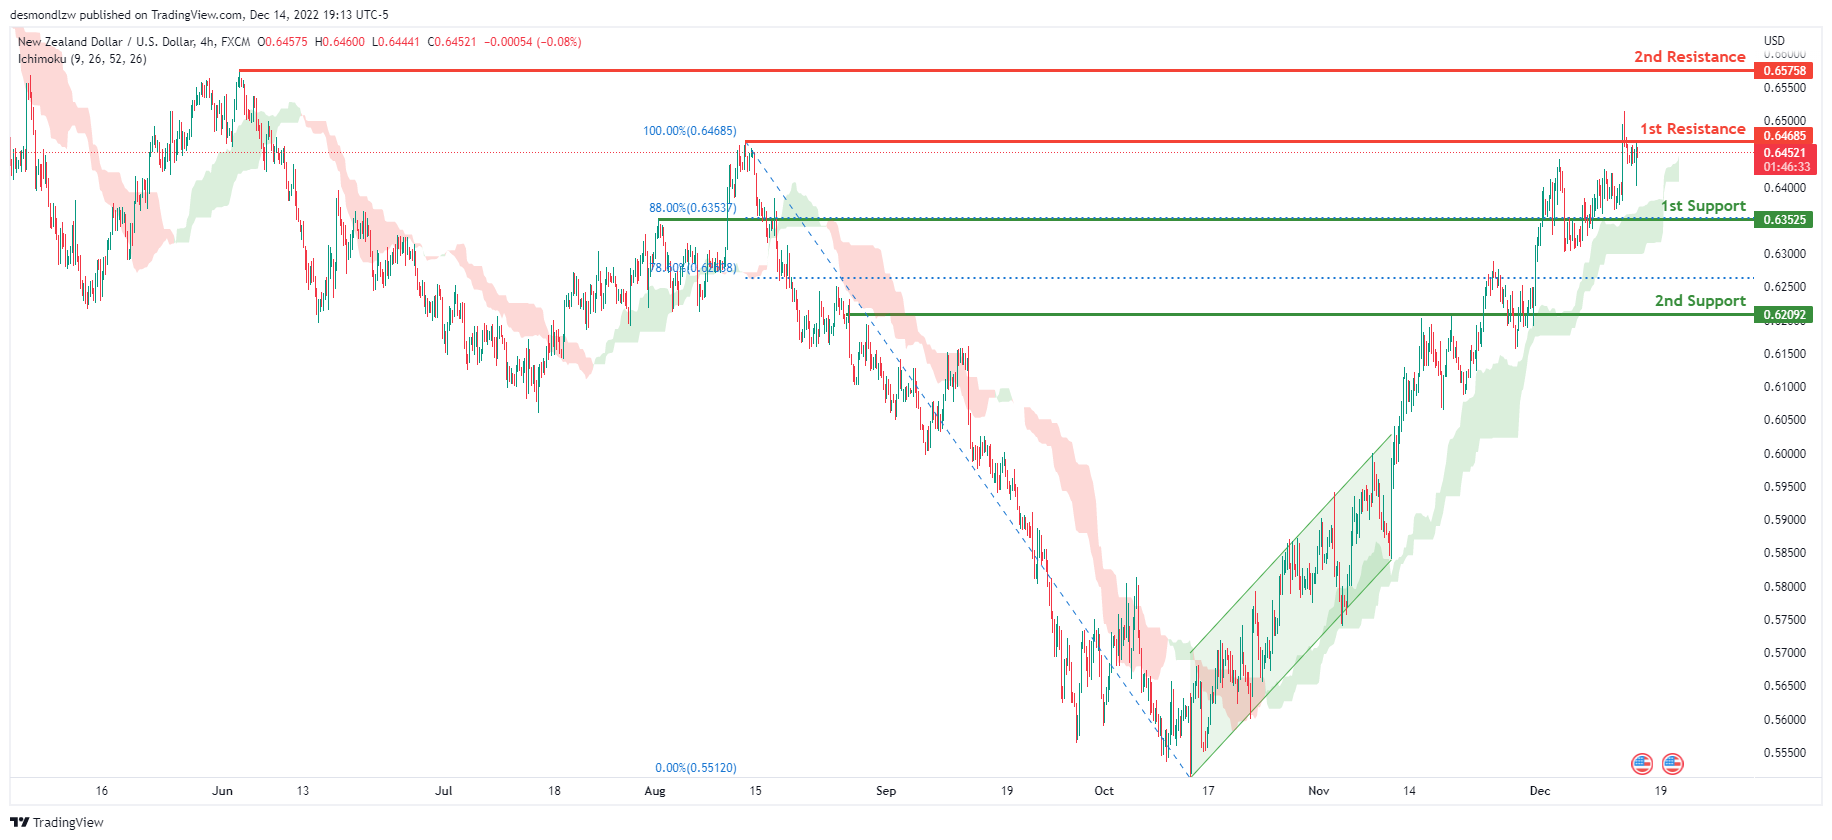
To add confluence to this bias, price has broken out of the ascending channel. If this bullish momentum continues, expect the price to possibly break the 1st resistance line at 0.64685, where the previous swing high is before heading towards the 2nd resistance at 0.65758, where the previous swing high is. Alternatively, the price may head back down towards the 1st support at 0.63525, where the 88% Fibonacci line is.
Areas of consideration:
- H4 time frame, 1st resistance at 0.64685
- H4 time frame, 2nd resistance at 0.65758
- H4 time frame, 1st support at 0.63525
USD/CAD:
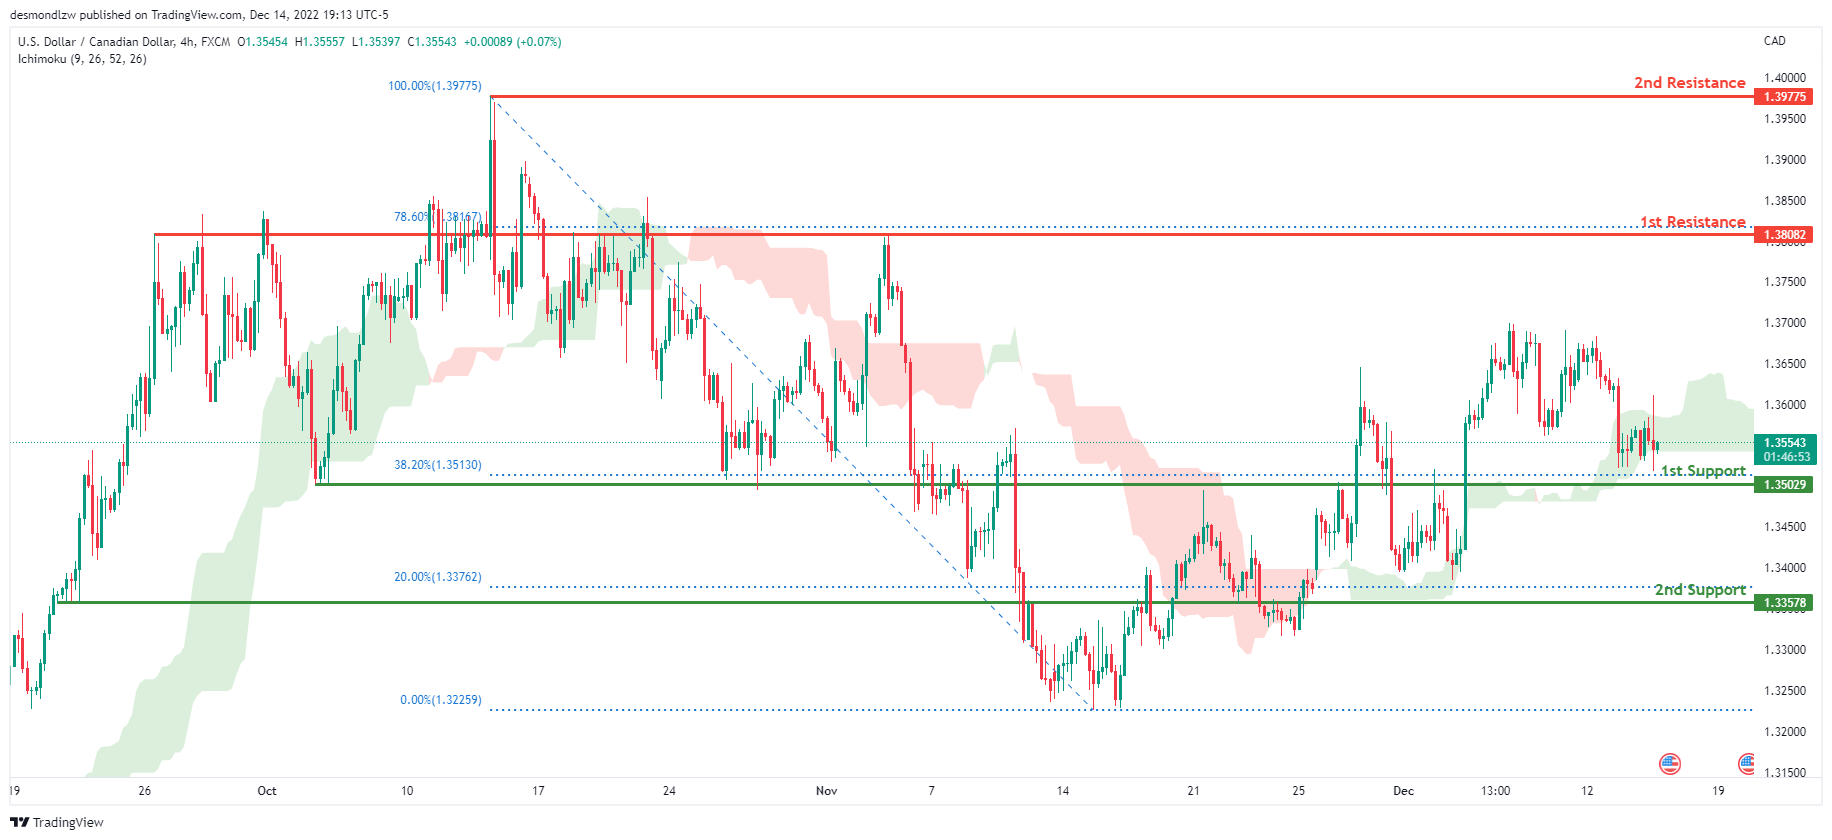
On the H4 chart, the overall bias for USDCAD is bullish. To add confluence to this, the price is crossing above the Ichimoku cloud which indicates a bullish market. If this bullish momentum continues, expect the price to head towards 1st resistance line at 1.38082, where the 78.6% Fibonacci line is. In an alternative scenario, price could head back down to retest the 1st support at 1.35029, where the 38.2% Fibonacci line is.
Areas of consideration:
- H4 time frame, 1st resistance at 1.38082
- H4 time frame, 2nd resistance at 1.39775
- H4 time frame, 1st support at 1.35029
OIL:
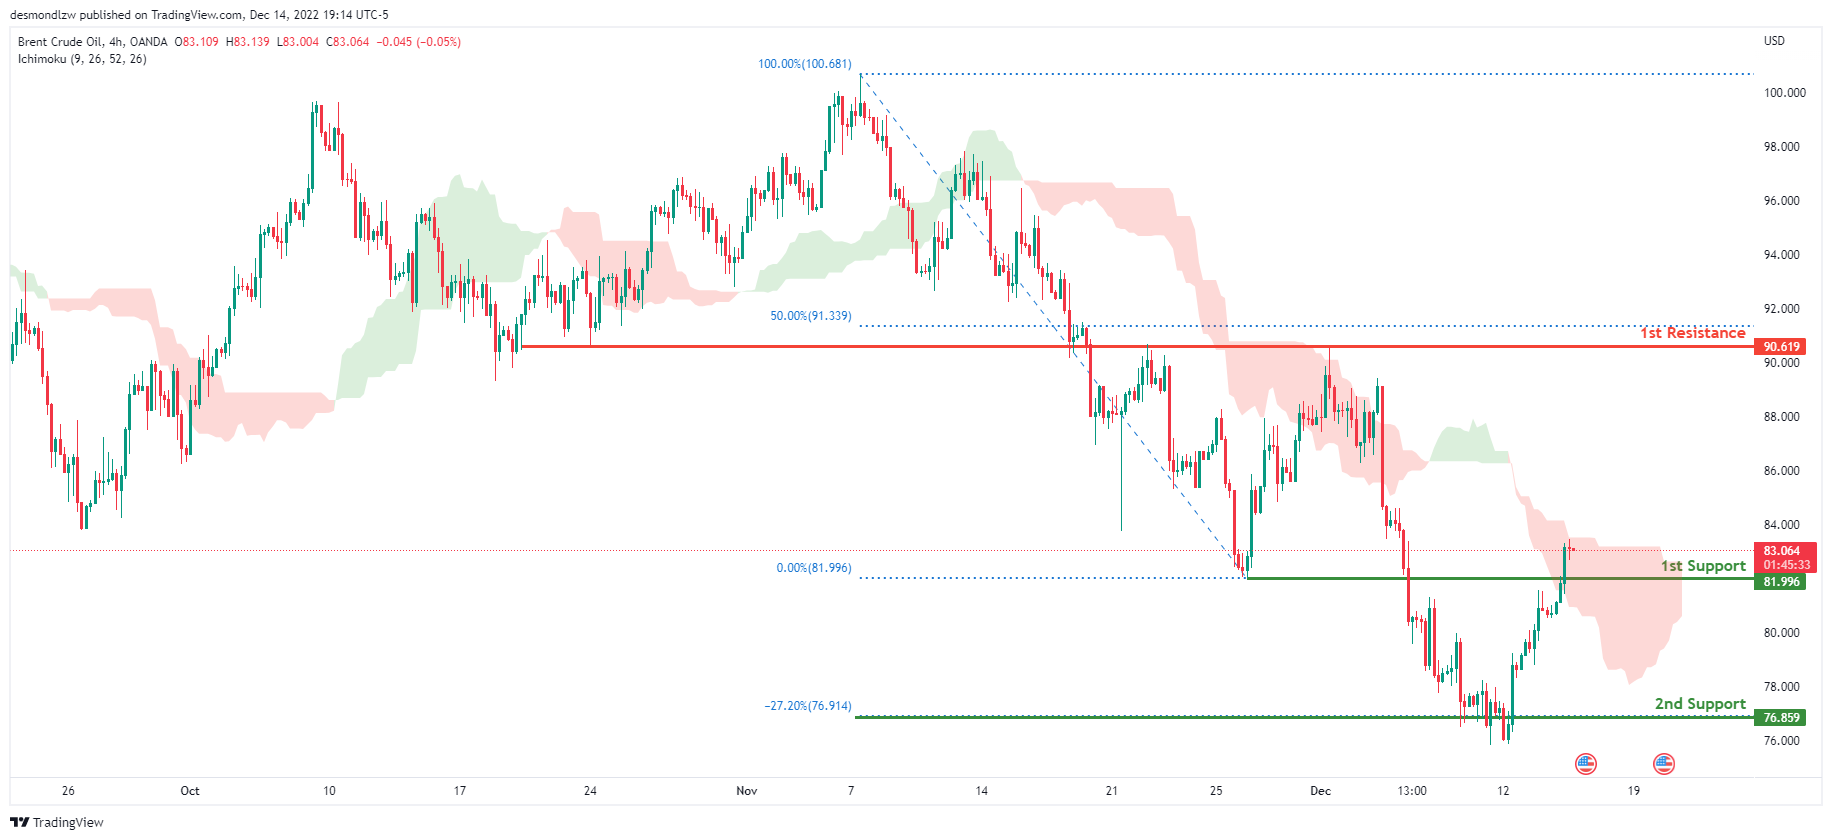
Looking at the H4 chart, my overall bias for BCOUSD is bullish due to the current price crossing above the Ichimoku cloud, indicating a possible shift to bullish market structure. If this bullish momentum continues, expect the price to possibly head towards the 1st resistance at 90.619, where the 50% Fibonacci line is. In an alternate scenario, price could possibly head back down to retest the 1st support line at 81.996, where the previous low is located.
Areas of consideration:
- H4 time frame, 1st resistance at 90.619
- H4 time frame, 1st support at 81.996
Dow Jones Industrial Average:
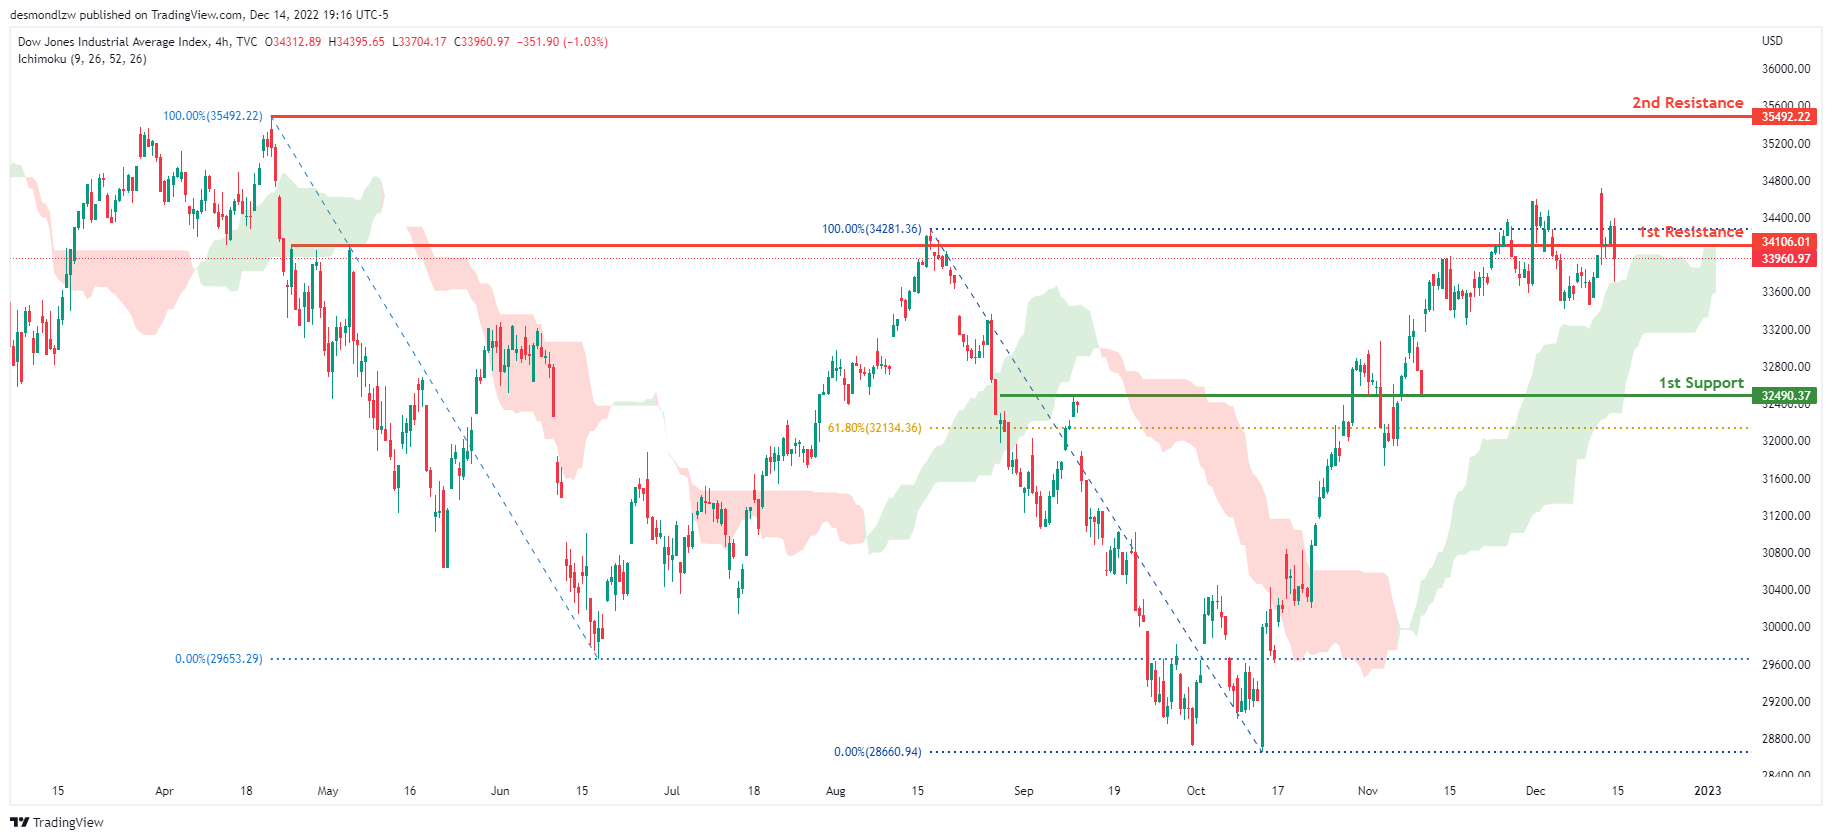
On the H4 chart, the overall bias for DJI is bullish. To add confluence to this, the price is above the Ichimoku cloud which indicates a bullish market. If this bullish momentum continues, expect the price to possibly break the 1st resistance line at 34106.01, where the previous swing high is before heading towards the 2nd resistance line at 35492.22, where the previous swing high is. In an alternative scenario, price could head back down towards the 1st support at 32490.37, where the 61.8% Fibonacci line is.
Areas of consideration:
- H4 time frame, 1st support at 32490.37
- H4 time frame, 1st Resistance at 34106.01
- H4 time frame, 2nd Resistance at 35492.22
DAX:
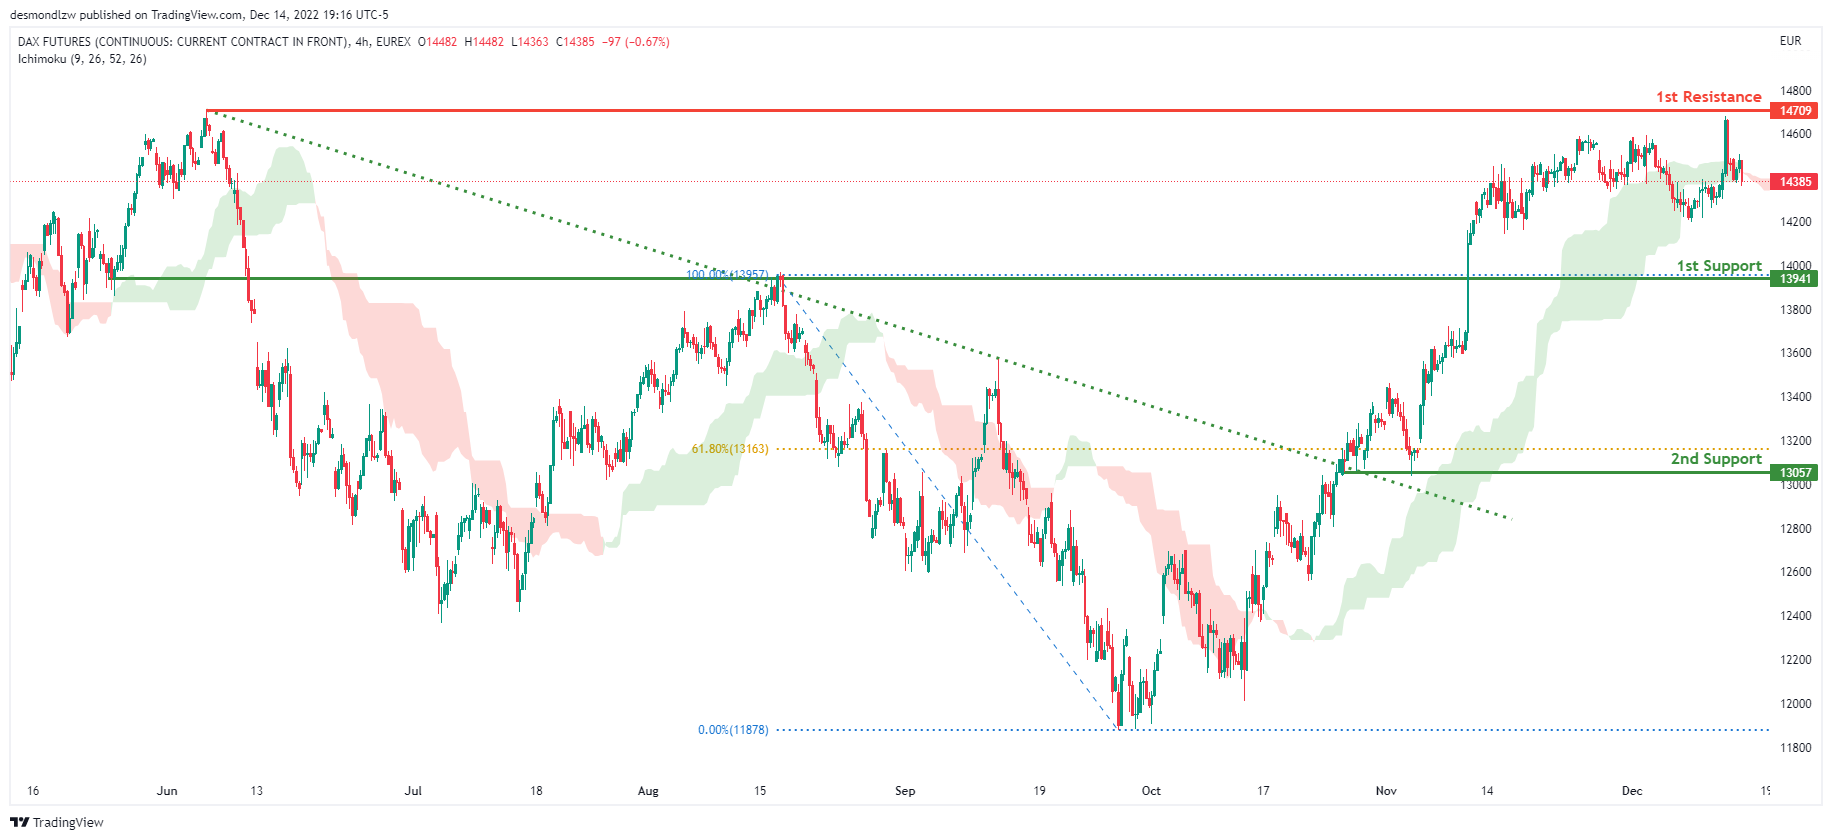
The H4 chart shows a bullish bias, with price breaking through the descending trendline and rising above the Ichimoku cloud. Price is expected to maintain its bullish momentum and rise to the first resistance level at 14709, where the previous swing high is located. Alternatively, the price could fall to the first support level at 13941, where the previous swing high was.
Areas of consideration:
- H4 time frame, 1st resistance is at 14709
- H4 time frame, 1st support is at 13941
ETHUSD:
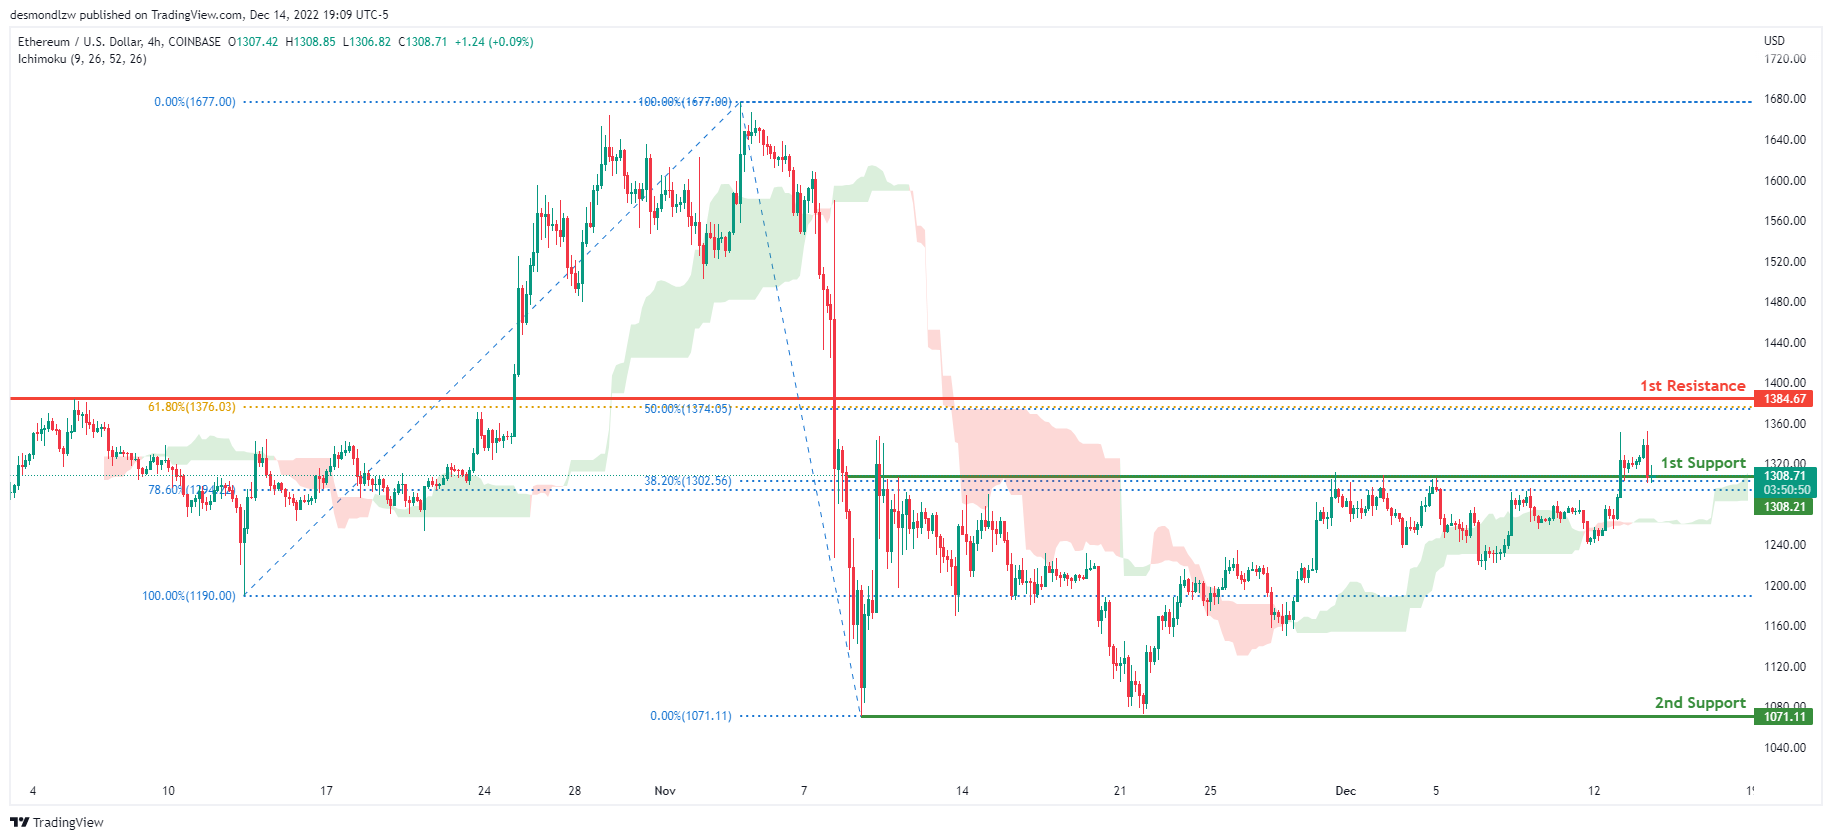
Looking at the H4 chart, my overall bias for ETHUSD is bullish due to the current price being above the Ichimoku cloud, indicating a bullish market. Expecting price to possibly head towards the 1st resistance at 1384.67, where the 50% and 61.8% Fibonacci lines are. In an alternative scenario, price could break the 1st support at 1308.21, where the 38.2% and 78.6% Fibonacci lines are before heading towards the 2nd support at 1071.11, where the previous swing low is.
Areas of consideration:
- H4 time frame, 1st resistance of 1384.67
- H4 time frame, 1st support at 1308.21
- H4 time frame, 2nd support at 1071.11
BTCUSD:
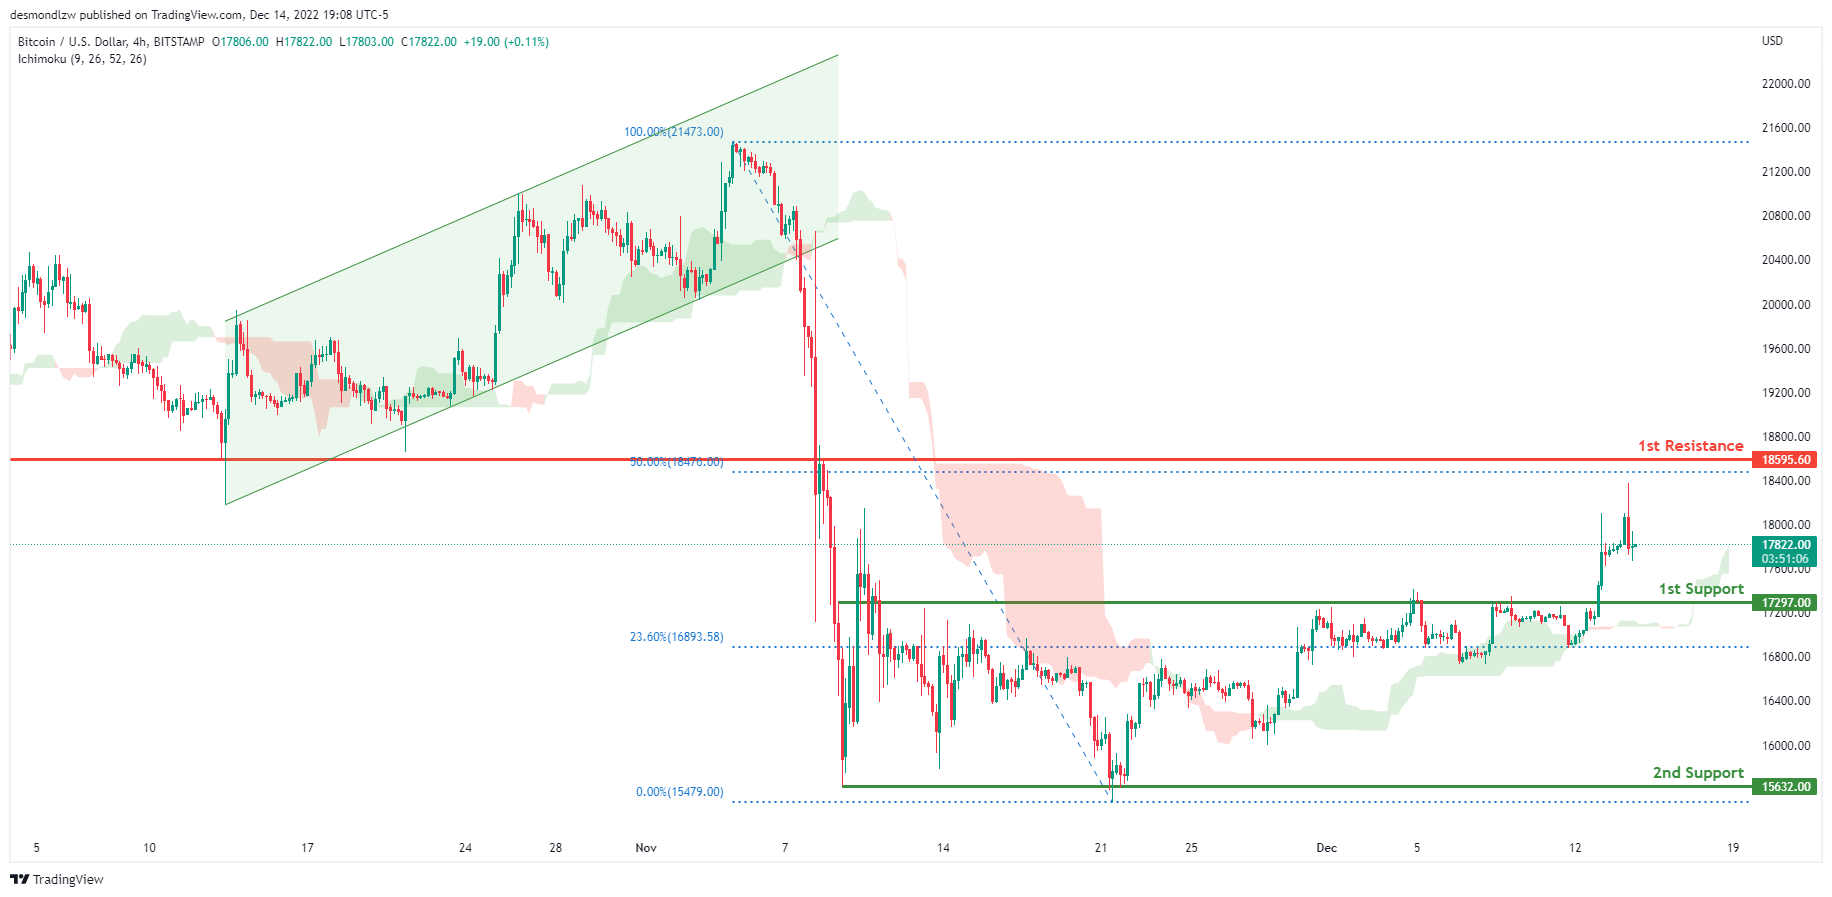
Looking at the H4 chart, my overall bias for BTCUSD is bullish due to the current price being above the Ichimoku cloud, indicating a bullish market. Expecting price to possibly head up towards the 1st resistance at 18173.33, where the previous swing low is and 50% Fibonacci line are. In an alternative scenario, price could possibly head back down towards the 1st support at 17297.00, where the 23.6% Fibonacci line is.
Areas of consideration:
- H4 time frame, 1st resistance 18173.33
- H4 time frame, 1st support at 17297.00
S&P 500:
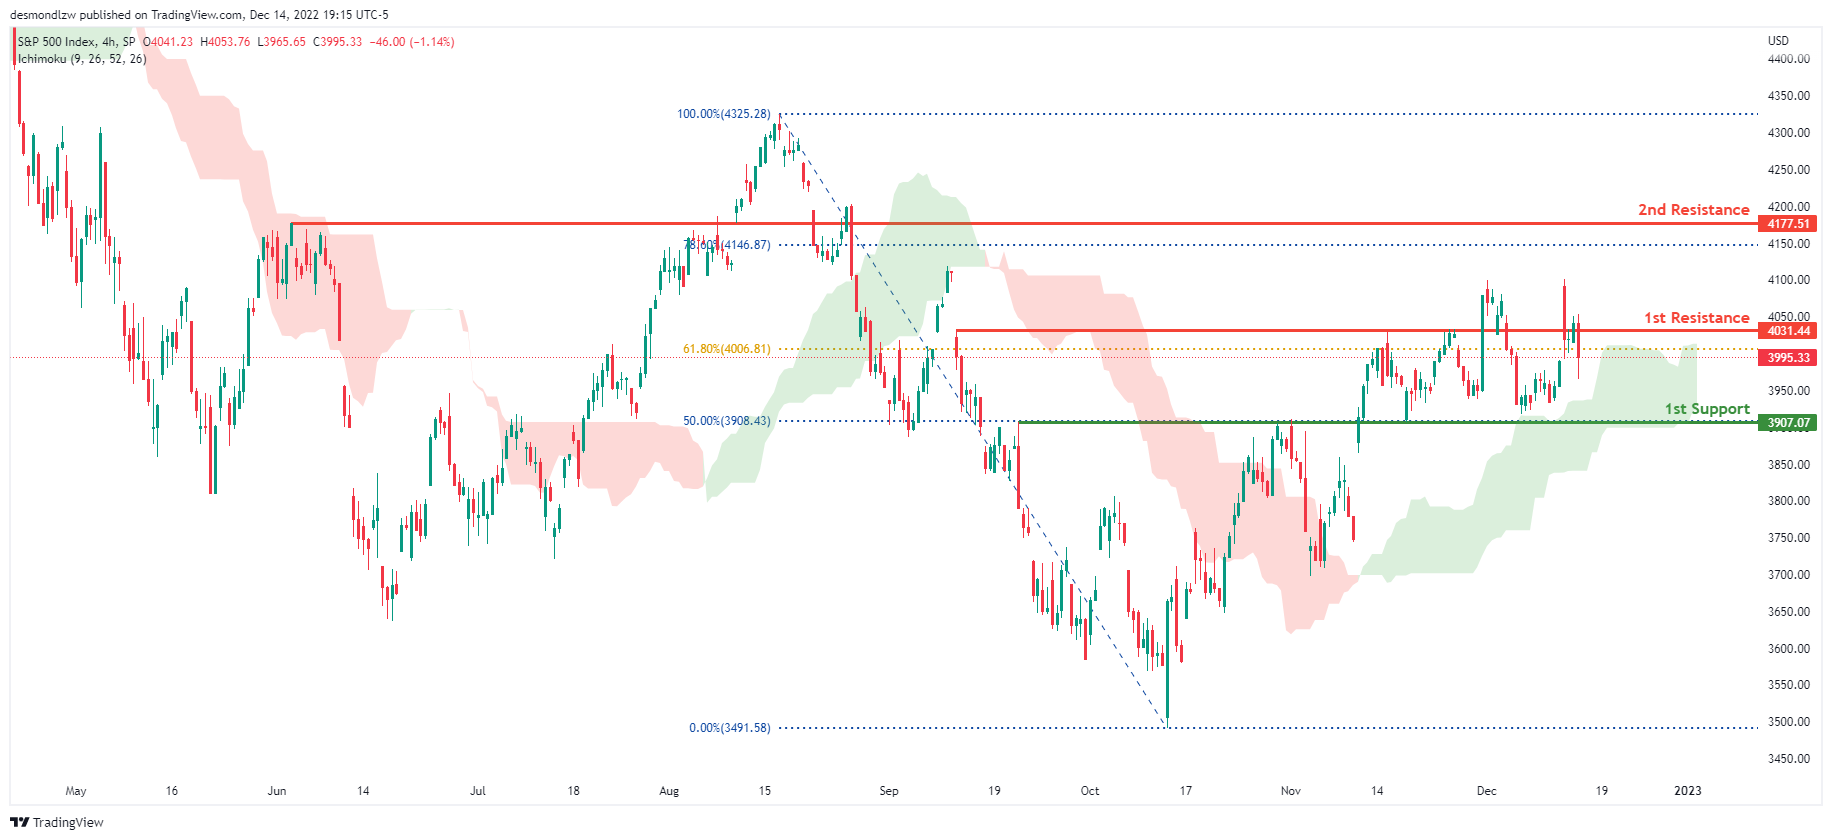
The overall bias for the S&500 on the H4 chart is bullish, with prices above the Ichimoku cloud. If the bullish momentum continues, the expected price to possibly break the 1st resistance line is at 4031.44, where the 61.8% Fibonacci line is located before heading towards the 2nd resistance line at 4177.51, where the 78.6% Fibonacci line is. In an alternate scenario, price could return to the 1st support line at 3907.07, where the 50% Fibonacci line is located.
Areas of consideration:
- H4 time frame, 1st support at 3907.07
- H4 time frame, 1st resistance at 4031.44
- H4 time frame, 2nd resistance at 4177.51
USD/CHF Could Extend Losses, BoE Rate Decision Next
Key Highlights
- USD/CHF declined below the 0.9400 and 0.9350 support levels.
- A major bearish trend line is forming with resistance near 0.9320 on the 4-hours chart.
- The Fed increased interest rate by 0.50 percentage point.
- The BoE interest rate decision is scheduled today (forecast 3.5%, versus 3.0% previous).
USD/CHF Technical Analysis
The US Dollar started a fresh decline from well above the 0.9500 level against the Swiss Franc. USD/CHF gained pace below the 0.9400 and 0.9380 support levels.
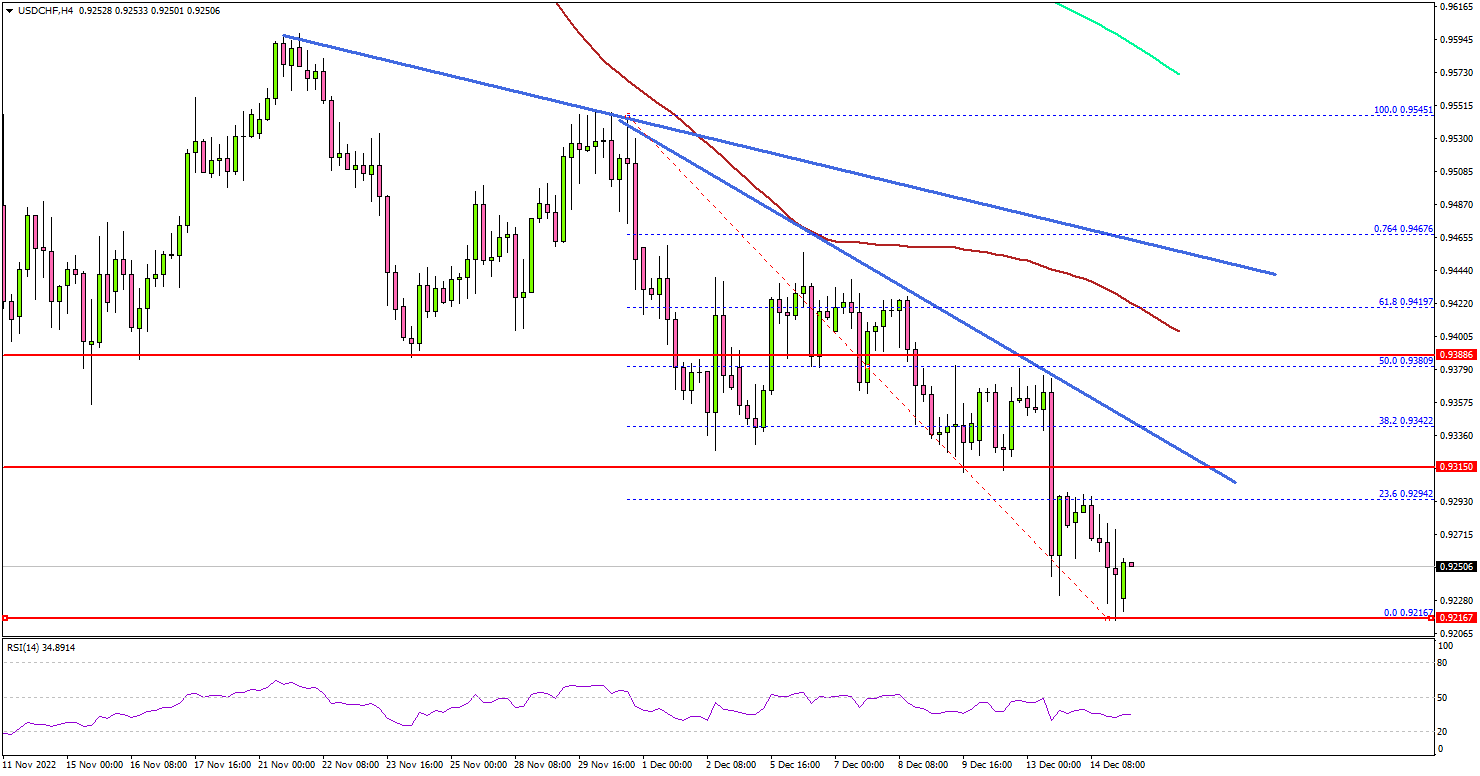
Looking at the 4-hours chart, the pair settled well below the 0.9400 level, the 100 simple moving average (red, 4-hours), and the 200 simple moving average (green, 4-hours).
It even broke the 0.9300 level and tested the 0.9230 support zone. It is now consolidating losses and remains at a risk of more losses below the 0.9200 support zone. The next major support is near the 0.9165 zone.
Any more losses might send the pair towards the 0.9120 support zone. On the upside, the pair is facing resistance near the 0.9320.
There is also a major bearish trend line forming with resistance near 0.9320 on the same chart. The next major resistance may perhaps be near 0.9350. A clear move above the 0.9350 resistance might start another decent increase.
In the stated case, USD/CHF may perhaps test 0.9400. Any more gains could set the pace for a move towards the 0.9500 resistance zone.
Looking at EUR/USD, the pair gained pace above the 1.0620 level and dips likely to remain supported in the coming days.
Economic Releases
- SNB Interest Rate Decision - Forecast 1%, versus 0.5% previous.
- BoE Interest Rate Decision - Forecast 3.5%, versus 3.0% previous.
- US Retail Sales for Nov 2022 (MoM) – Forecast -0.1%, versus +1.3% previous.
Fed Review: FOMC Signals Fed Funds above 5% in 2023
Fed Review: FOMC Signals Fed Funds above 5% in 2023
- The US Federal Reserve hiked the Fed Funds Rate by 50bp as widely anticipated. The updated 'dots' signal policy rates above 5% in 2023.
- EUR/USD recovered near pre-meeting levels despite the hawkish rate projections, as Powell left the door open for less hikes if warranted by data.
- Resilient consumption, tight labour markets and still high underlying price pressures support the case for further hikes in Q1. We maintain our forecast of 50bp in February and 25bp in March unchanged.
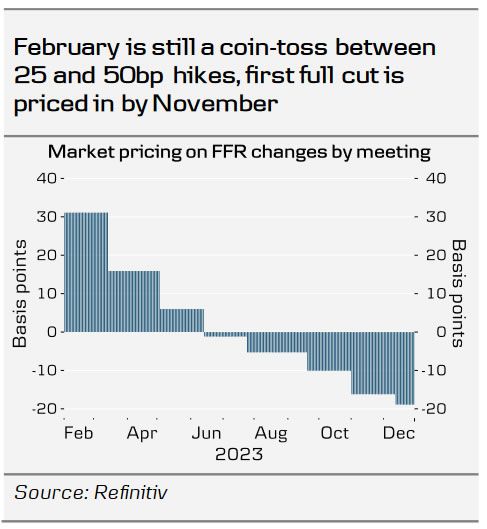
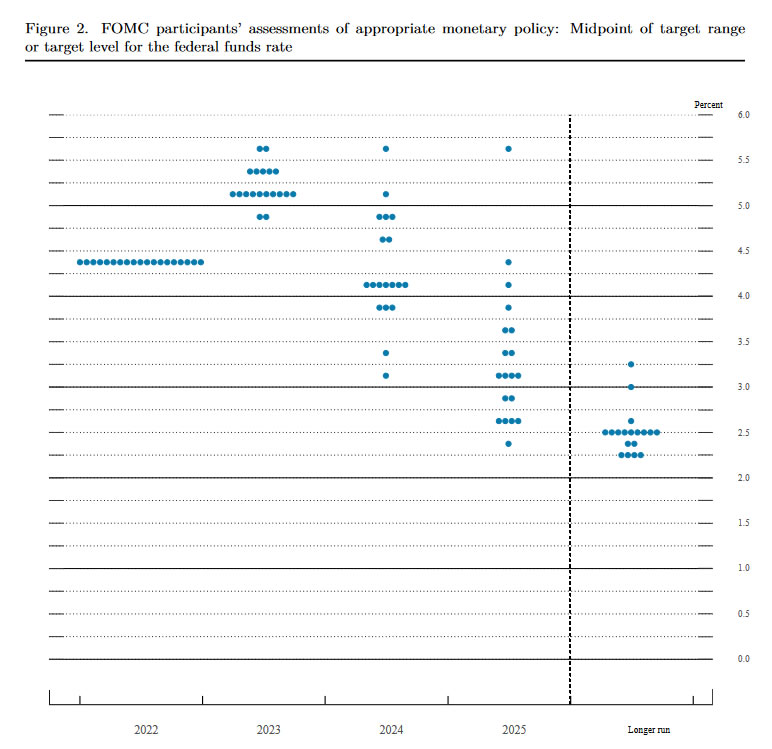
Although 17 out the 19 individual estimates saw Fed Funds Rate above 5% in 2023, the initial hawkish market reaction faded over the press conference, as Powell left the door open for more modest hikes, if warranted by the weaker incoming data. While we did see decent curve flattening and a set-back to equities, the USD gain was still fairly modest.
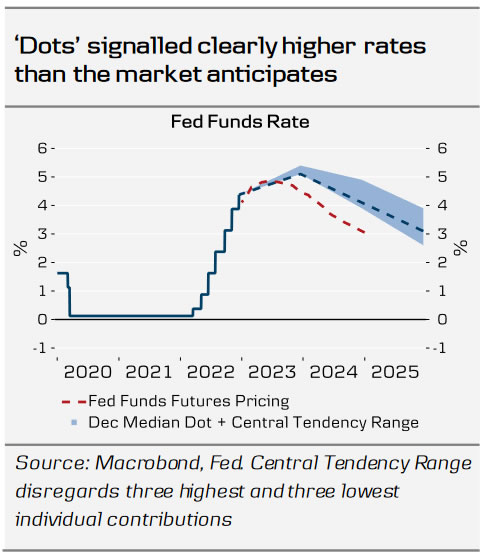
That said, Powell emphasized that labour market conditions still remain 'extremely' tight, and that Fed would be closely following core services ex. shelter inflation for gauging the underlying price pressures. As we highlighted in Global Inflation Watch - Mixed inflation signals in November, 14 December, the most wage-sensitive sectors continued to signal even accelerating inflation pressures in November, despite the overall soft CPI print.
Communicating inflation developments will become increasingly challenging next year, as the negative base effects from energy, used cars and health insurance combined with the delayed development in shelter prices will mask the broader underlying inflation.
Powell highlighted, that the current wage data showed few signs progress towards returning to levels better consistent with Fed's 2% target. We agree, and while markets tend to focus more on the short-term inflation developments, the key risk for Fed is that even if inflation comes down sharply next year, it will not come down for good. As of now, average hourly earnings, JOLTs job openings and employment cost index all point towards inflation remaining closer to 4% than 2%. Powell also once again emphasized the asymmetric balance of risks favouring hiking rates more, rather than less: recession can be dealt with by easing financial conditions, but CBs have few good tools against stagflation.
For now, Fed's focus has shifted from the near-term hiking pace to determining how long policy needs to be maintained restrictive. The entire real interest rate curve is now clearly on positive levels, which suggests that as long as inflation expectations remain stable, Fed does not need to hike rates much higher than what has now been communicated. The lower CPI prints give a sense that Fed is moving to the right direction. We maintain our call for terminal rate at 5.00-5.25%, well in line with the new projections.
While Powell noted that Fed looks through short-term volatility in financial conditions, we think the recent easing supports the case for inflation risks still being tilted to the upside. We continue to see modest near-term upside risks to USD rates, and forecast EUR/USD moving lower in 2023, as broad USD strength plays a key role in maintaining financial conditions restrictive.
FOMC press conference live stream
https://www.youtube.com/watch?v=Ho2iJXlcmR8
Fed hikes 50bps, rate to hit 5.1% in 2023
Fed raises interest rate by 50bps to 4.25-4.50% as widely expected. The decision was unanimous.
Tightening bias is maintained as "the Committee anticipates that ongoing increases in the target range will be appropriate in order to attain a stance of monetary policy that is sufficiently restrictive to return inflation to 2 percent over time".
In the new median economic projections:
- Federal funds rate is projected to hit 5.1% in 2023, then falls back to 4.1% in 2024, and then 3.1% in 2015.
- Real GDP growth was revised down from 1.2% to 0.5% in 2023, from 1.7% to 1.6% in 2024, and unchanged at 1.8% in 2025.
- Unemployment rate was revised up from 4.4% to 4.6% in 2023, from 4.4^ to 4.6% in 2024, and from 4.3% to 4.5% in 2025.
- PCE inflation was revised up from 2.8% to 3.1% in 2023, 2.3% to 2.5% in 2024, a and from 2.0% to 2.1% in 2025.
- Core PCE inflation was revised up from 3.1% to 3.5% in 2023, 2.3% to 2.5% in 2024 and unchanged at 2.1% in 2025.
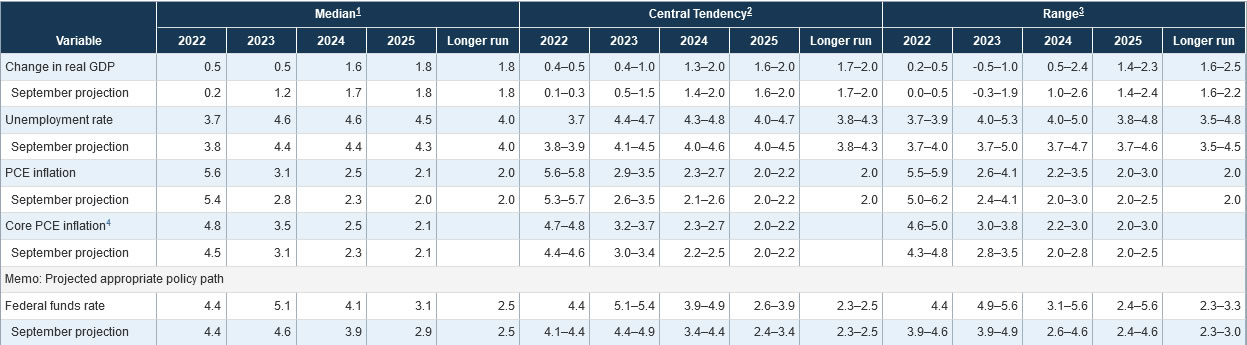
In the "dot plot"
- 17 policy makers expect interest rate to climb to 5.125% and above in 2023, with 7 expects 5.375% and above.
- 12 policy makers expect interest to fall back to 4.125% in 2024 and below.
(FED) Federal Reserve Issues FOMC Statement
Recent indicators point to modest growth in spending and production. Job gains have been robust in recent months, and the unemployment rate has remained low. Inflation remains elevated, reflecting supply and demand imbalances related to the pandemic, higher food and energy prices, and broader price pressures.
Russia's war against Ukraine is causing tremendous human and economic hardship. The war and related events are contributing to upward pressure on inflation and are weighing on global economic activity. The Committee is highly attentive to inflation risks.
The Committee seeks to achieve maximum employment and inflation at the rate of 2 percent over the longer run. In support of these goals, the Committee decided to raise the target range for the federal funds rate to 4-1/4 to 4-1/2 percent. The Committee anticipates that ongoing increases in the target range will be appropriate in order to attain a stance of monetary policy that is sufficiently restrictive to return inflation to 2 percent over time. In determining the pace of future increases in the target range, the Committee will take into account the cumulative tightening of monetary policy, the lags with which monetary policy affects economic activity and inflation, and economic and financial developments. In addition, the Committee will continue reducing its holdings of Treasury securities and agency debt and agency mortgage-backed securities, as described in the Plans for Reducing the Size of the Federal Reserve's Balance Sheet that were issued in May. The Committee is strongly committed to returning inflation to its 2 percent objective.
In assessing the appropriate stance of monetary policy, the Committee will continue to monitor the implications of incoming information for the economic outlook. The Committee would be prepared to adjust the stance of monetary policy as appropriate if risks emerge that could impede the attainment of the Committee's goals. The Committee's assessments will take into account a wide range of information, including readings on public health, labor market conditions, inflation pressures and inflation expectations, and financial and international developments.
Voting for the monetary policy action were Jerome H. Powell, Chair; John C. Williams, Vice Chair; Michael S. Barr; Michelle W. Bowman; Lael Brainard; James Bullard; Susan M. Collins; Lisa D. Cook; Esther L. George; Philip N. Jefferson; Loretta J. Mester; and Christopher J. Waller.
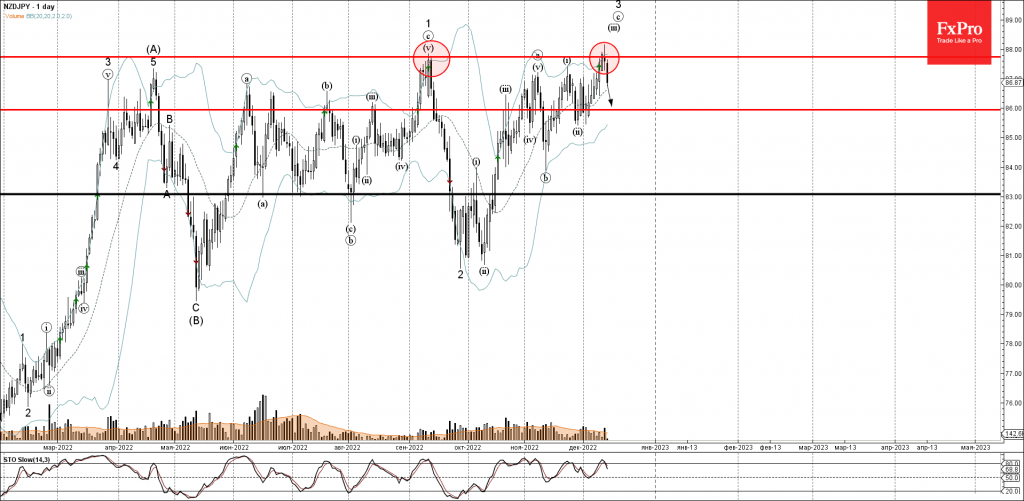
NZDJPY Wave Analysis
- NZDJPY reversed from resistance level 87.73
- Likely to fall to support level 86.00
NZDJPY recently reversed down from the major resistance level 87.73 (which stopped the previous sharp uptrend in September), intersecting with the upper daily Bollinger Band.
The downward reversal from the resistance level 87.73 stopped the earlier short-term impulse waves (iii) and 3, which belong to the higher order impulse wave (C) from May.
Given the bearish NZD sentiment seen today, NZDJPY can be expected to fall further toward the next support level 86.00.