Sample Category Title
Canada manufacturing sales rose 2.8% mom in Oct, driven by higher prices
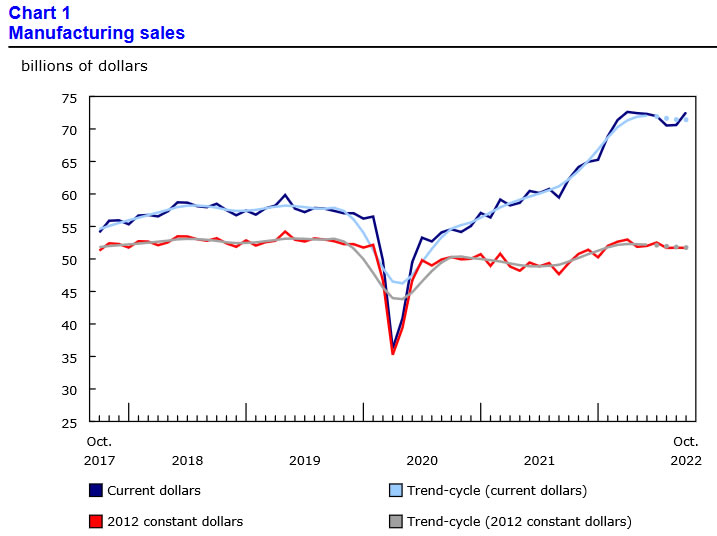
Canada manufacturing sales rose 2.8% mom to CAD 72.6B in October, above expectation of 1.9% mom.
Sales increased in 12 of 21 industries, led by the petroleum and coal (+12.7%), food (+2.9%), chemical (+4.9%) and miscellaneous manufacturing (+13.3%) industries. Meanwhile, motor vehicles (-3.2%) and machinery (-1.7%) posted the largest monthly declines.
But Statistics Canada also noted: "Sales in constant dollars were unchanged in October, indicating that the entire increase in current dollar sales was driven by higher prices as the Industrial Product Price Index rose 2.4% in October."
NZD/USD Awaits Fed, GDP
Federal Reserve expected to hike by 50 bp
All eyes are on the Federal Reserve, which winds up its policy meeting later today. Policy makers are expected to raise rates by 50 basis points at this final meeting of 2022, with an outside chance of a more aggressive 75 basis point hike. This year has set a record for tightening, but despite that, the Fed stills finds itself in an uphill battle to convince the markets that it remains in a hawkish mode. The dramatic inflation report on Tuesday was softer than expected at 7.1%, once again raising risk appetite and sending the US dollar sharply lower.
Any drop in inflation is welcome news for the Fed, but let’s not forget that inflation is still more than three times the Fed target of 2%. The Fed has reiterated that it is committed to curbing inflation and has not given any indications of winding up the current tightening cycle, stating that it expects the terminal rate to be “somewhat higher” than anticipated in September. Despite this, speculation is growing that the Fed might deliver one more rate hike in February, perhaps by 25 bp, and then call it quits.
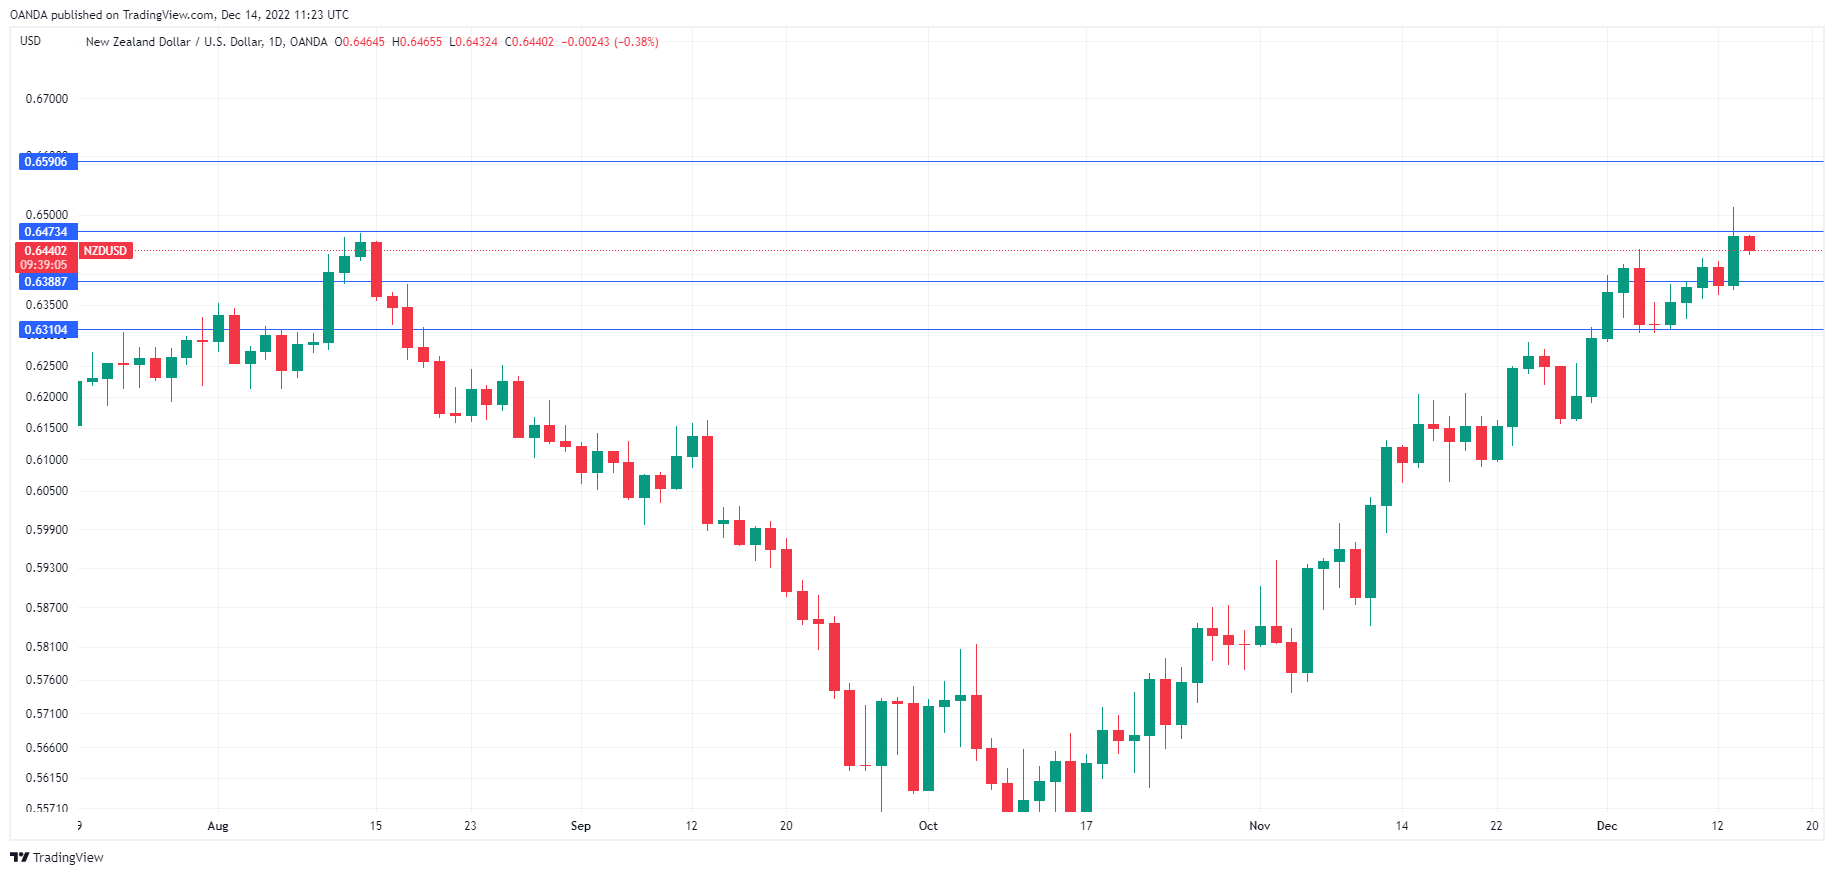
New Zealand releases fourth-quarter GDP later today, and the markets are bracing for a weak gain of 0.8% q/q. This follows the 1.2% gain in Q3, as the economy was boosted by the booming tourist trade as the border reopened. The New Zealand dollar has recovered nicely, gaining about 400 points against the US dollar since October 1st. The Reserve Bank of New Zealand will be on a long break, as the next policy meeting is not until February 22nd. We could see some volatility from NZD/USD in today’s North American session, with the Fed rate announcement and the New Zealand GDP release.
NZD/USD Technical
- 0.6472 is a weak resistance line. Above, there is resistance at 0.6591
- There is support at 0.6388 and 0.6311
USD/JPY Air Started a Fresh Decline from 140.00
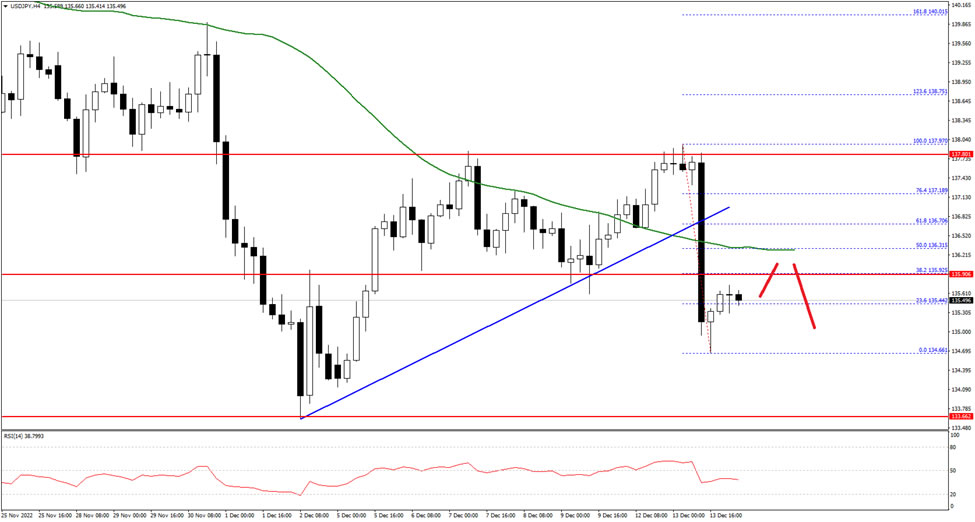
The US Dollar started a fresh decline from the 140.00 resistance zone against the Japanese Yen. The USD/JPY pair traded below the 138.00 level to move into a bearish zone.
Recently, the pair traded as low as 134.66 and is currently consolidating losses below the 50 hourly simple moving average. An immediate resistance on the upside is near the 135.92 level.
The next major resistance is near the 136.30 zone and the 50 hourly simple moving average. A clear break above the 136.30 resistance could push the price towards 137.00 on FXOpen. The next major resistance is near the 137.50 level.
On the downside, an initial support is near the 135.00 zone. The next major support sits near the 134.50 level, below which there is a risk of more downsides towards the 133.80 level.
NZDUSD Eases after the Rally to 6-Month High
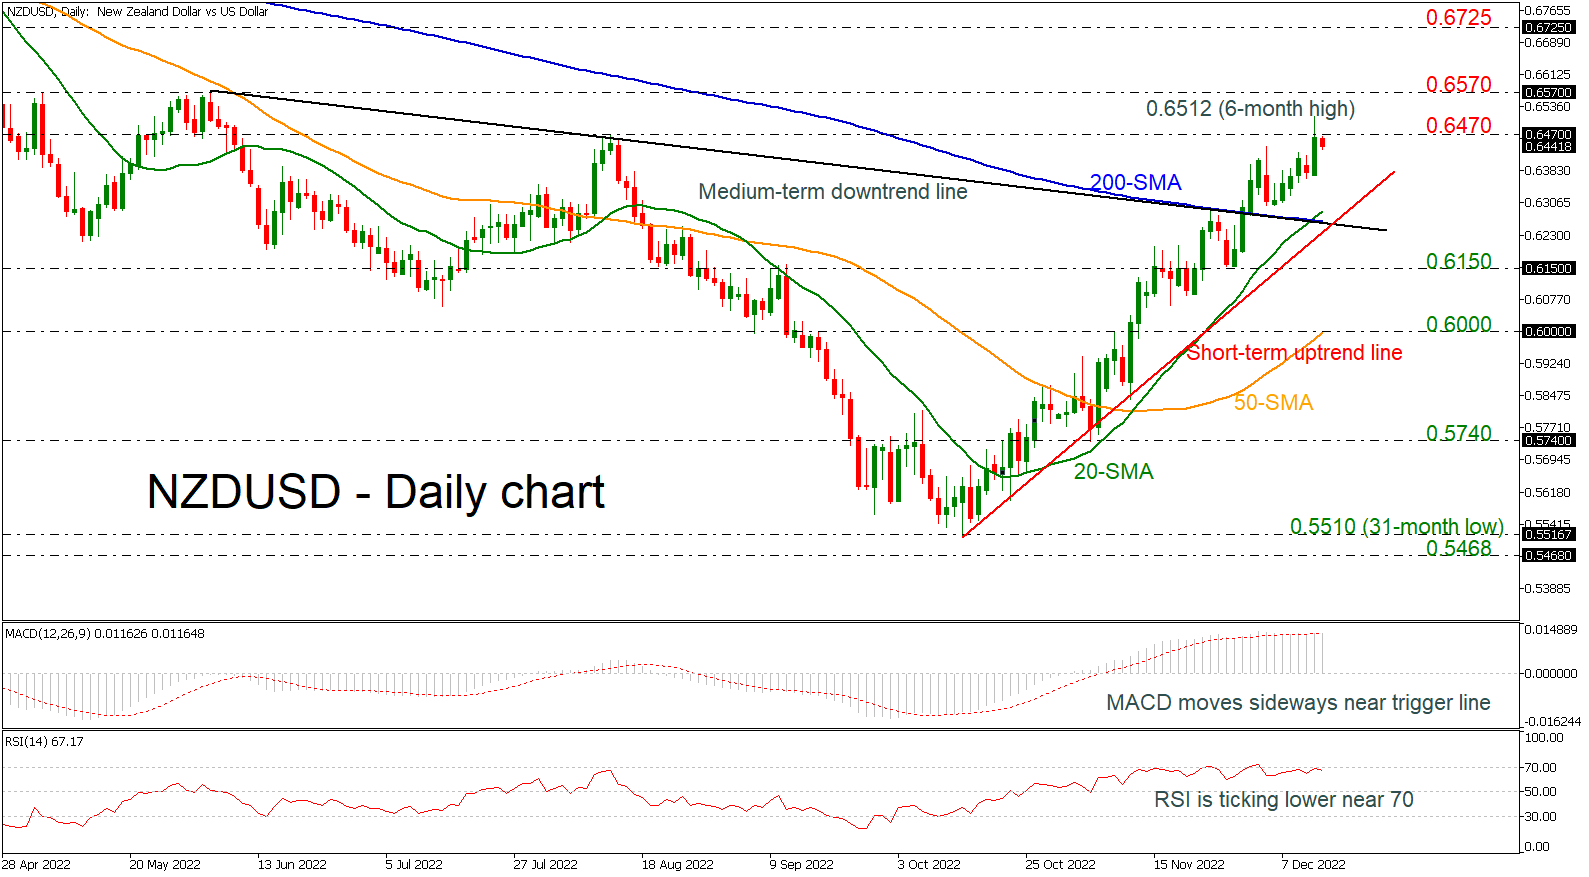
NZDUSD continued the impressive rally that started after the bounce off the 31-month low of 0.5510 during yesterday’s session, surging towards a new six-month peak of 0.6512. The pair penetrated the medium-term downtrend line to the upside in the preceding sessions, creating a steep short-term ascending trend line.
However, the MACD oscillator is moving sideways mirroring the downside retracement from the aforementioned high and today’s negative reaction, while the RSI is pointing slightly down near the overbought region.
In the event of a downside reversal, the golden cross within the 20- and the 200-day simple moving averages (SMA) at 0.6270 may ease the selling pressure ahead of the uptrend line at 0.6230. Failure to rebound off the latter, could take the pair to the 0.6150 support and the 50-day SMA, which coincides with the 0.6000 key level into view.
Alternatively, a continuation of the buying interest could open the way for a test of the 0.6570 barrier, achieved on June 3. Even higher, the 200-weekly SMA at 0.6625 may halt the positive movements.
All in all, NZDUSD is in a bullish territory in the short- and medium-term timeframes and only a drop beneath the 200-day SMA may switch the outlook back to bearish.
EURGBP Trades in a Sideways Manner
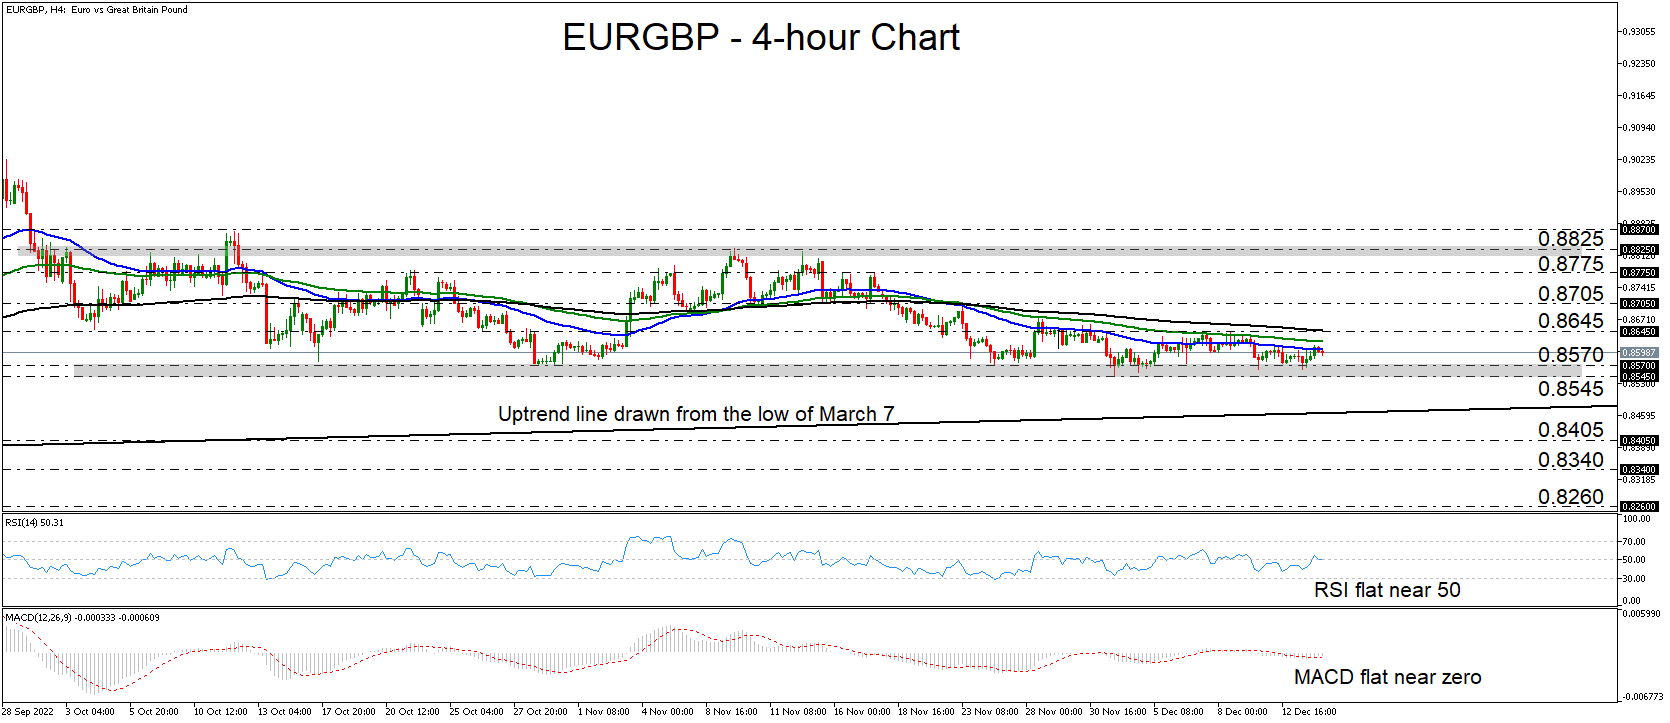
EURGBP has been trading in a quiet mode since Friday, hovering slightly above the 0.8545/70 zone, which has been providing strong support since September. That area is also acting as the lower bound of a sideways range the pair has been trading in since early October, with the upper bound being at 0.8825. This, combined with the fact that all three of the plotted moving averages point sideways, paints a neutral picture for now.
Adding to the trendless narrative are both the RSI and the MACD. The former is lying near its equilibrium 50 barrier, while the latter is running near both its zero and trigger lines, pointing sideways.
Given that in the bigger picture the pair is trading above an uptrend line taken from the low of March 7, the chances of a rebound – even within the aforementioned range – may be larger than the chances of a drop lower. A break above the crossroads of the 0.8645 barrier and the 200-period exponential moving average (EMA) may confirm the notion and allow advances towards 0.8705 or 0.8775, marked by the highs of November 23 and 17 respectively.
Should the bears reclaim control and take the pair below the longer-term uptrend line, a break below 0.8405 may be needed to signal that the outlook has notably darkened. Such a dip could initially pave the way towards the low of August 2 at 0.8340, the break of which could carry extensions towards the 0.8260 territory, near the low of April 14.
Putting everything together, EURGBP has been trading in a sideways manner since October, but in the bigger picture it holds above an uptrend line taken from back in March. Thus, this adds to the chances of a rebound soon, even within the short-term range.
Pound Shrugs as UK Inflation Dips
There was good news on the UK inflation front, as the November data pointed to a drop in inflation. CPI fell to 10.7% y/y, down from 11.1% in October and below the consensus of 10.9%. Core CPI eased to 6.3% y/y, down from 6.5% a month earlier, which was also the consensus. Even with the welcome drop in inflation, it still remains in double digits and is more than five times the Bank of England’s target of 2%.
The British pound is almost unchanged today, despite the drop in inflation. This is in sharp contrast to the reaction on Tuesday to the drop in US inflation, which fell to 7.3% and was softer than expected. The US dollar was about 1% lower against the majors, as once again a soft inflation report raised hopes that the end of the Fed’s tightening cycle is not far off.
All eyes on Federal Reserve
The Fed will announce the benchmark rate later today, after Tuesday’s dramatic CPI report. Inflation fell to 7.1%, down from 7.7% and below the consensus of 7.3%. This hasn’t changed the pricing of an 80% likelihood that the Fed will deliver a 50-basis point hike. The markets will be listening carefully to the tone of Jerome Powell’s rate statement and follow-up remarks, hoping for clues about the next meeting in February. There is a strong chance that the Fed will hike by 25 bp in February and then end the current rate-hike cycle at a terminal rate of 4.75%, on the lower side of the 4.75% to 5.25% range that is considered most likely.
BoE rate decision next
The BoE meets on Thursday and is expected to deliver a 50-basis point hike, which would raise the benchmark rate to 3.50%. This week’s employment and inflation numbers were within market expectations, and a stronger pound has also helped lower the need for a more aggressive 75-bp move. We could see some disagreement among MPC members in today’s vote, which could shed some light on where the BoE goes from here.
Thursday’s rate decision is the final one of the year, with the next meeting not until February 2nd. The most likely scenarios are for a hike of either 25 or 50 points. There is speculation that the February meeting could mark the end of the current tightening cycle, but I am sceptical unless inflation has fallen dramatically by then.
GBP/USD Technical
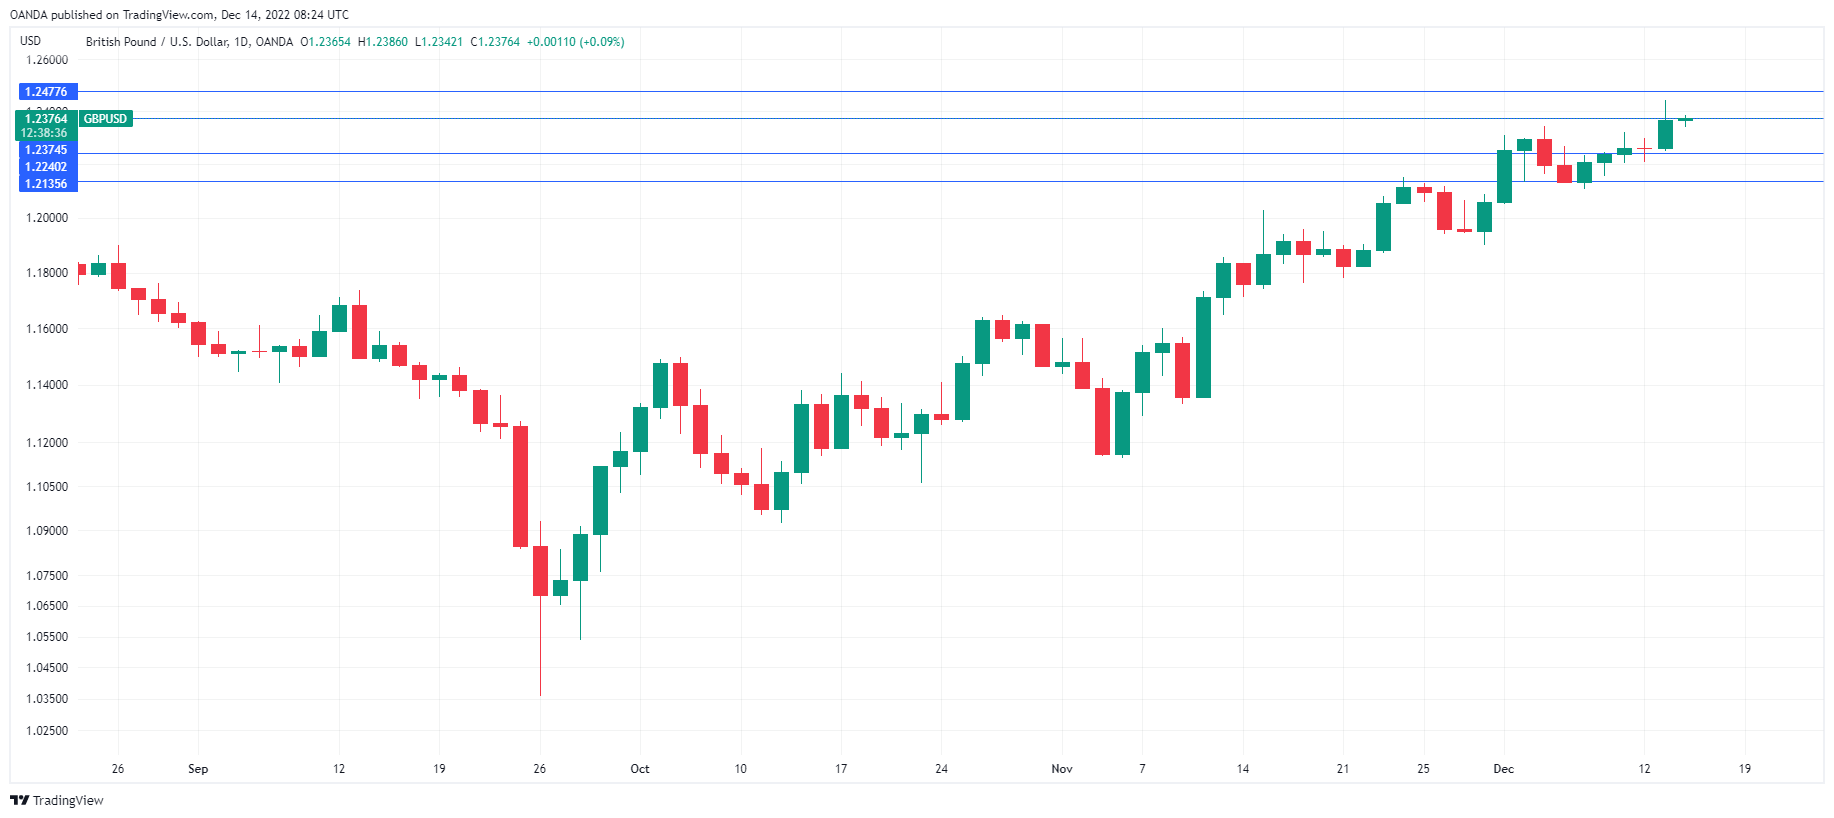
- 1.2240 and 1.2136 are the next support levels
- GBP/USD is testing resistance at 1.2374. Next, there is resistance at 1.2478
Eurozone industrial production down -2.0% mom in Oct, EU down -1.9% mom
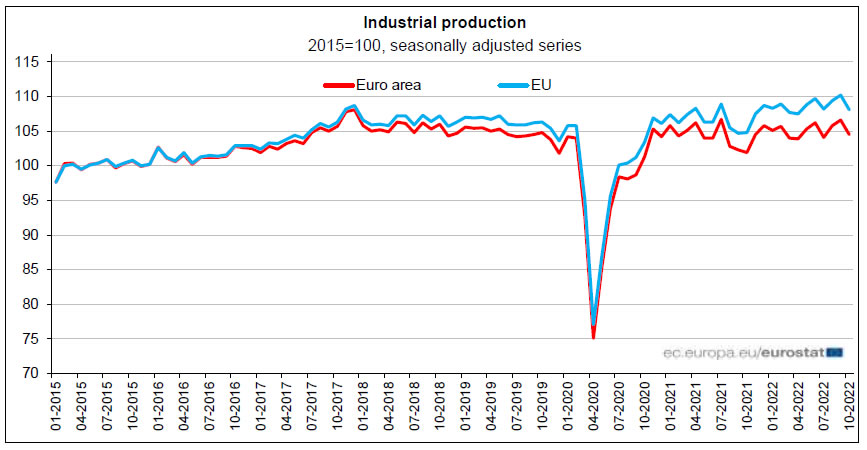
Eurozone industrial production dropped -2.0% mom in October, worse than expectation of -1.4% mom. Production of energy fell by -3.9%, durable consumer goods by -1.9%, intermediate goods by -1.3% and capital goods by -0.6%, while production of non-durable consumer goods rose by 0.3%.
EU industrial production dropped -1.9% mom. Among Member States for which data are available, the largest monthly decreases were registered in Ireland (-10.7%), Luxembourg (-4.4%) and Czechia (-3.7%). Increases were observed in Slovakia (+1.3%), Lithuania (+1.1%), Greece (+0.5%) and Austria (+0.2%).
Ifo: Germany economy to contract in Q4 and Q1
Ifo said the German economy is "suffering from huge supply shocks". Price press is "not expected to ease until 2024, and then only slowly". Overall inflation is expected to fall from 7.8% in 2022 to 6.4% in 2023. However, core inflation is expected to rise from 4.8% to 5.8% next year.
Ifo also said Germany GDP is forecast to grow 1.8% in 2022, contract slightly by -0.1% in 2023, and back at 1.6% in 2024. Economy output to expected to fall by -0.3% qoq and -0.4% qoq in the two quarters of the 2022-23 winter half-year (i.e. Q4 and Q1). Thus, Germany will be technically in a recession. But starting in spring 2023, the economy is expected recovery and growth at stronger rates in the second half .
Fed Pivot May Send US Stocks on Path to Bull Market
Stocks were given a shot in the arm by yesterday’s cooler-than-expected US CPI data. However, greater appetite for risk assets would still need to be validated by a Federal Reserve that’s more open to easing up on its aggressive battle against inflation.
The FOMC is expected to downshift to a 50-basis point hike today amid signs that inflation is moderating, while noting the lag in monetary policy actions’ impact on the real economy. Surer signals about the Fed’s eventual pivot are likely to spur further gains in risk assets, potentially sending the S&P 500 on a ‘Santa rally’ and into a fresh bull market.
However, markets have been culpable of hearing only what they want to hear, fixating on the Fed’s eventual pivot rather than Chair Powell’s reluctance to prematurely end the central bank’s rate hike campaign. If markets are forced to reconcile with the Fed’s hawkish intentions, either by way of a higher median rate in the FOMC dot plot or a more aggressive tone adopted by Chair Powell, that may prompt the unwinding of stocks’ recent gains, while bolstering the US dollar.
USDJPY Unable to Break Below 200-day SMA
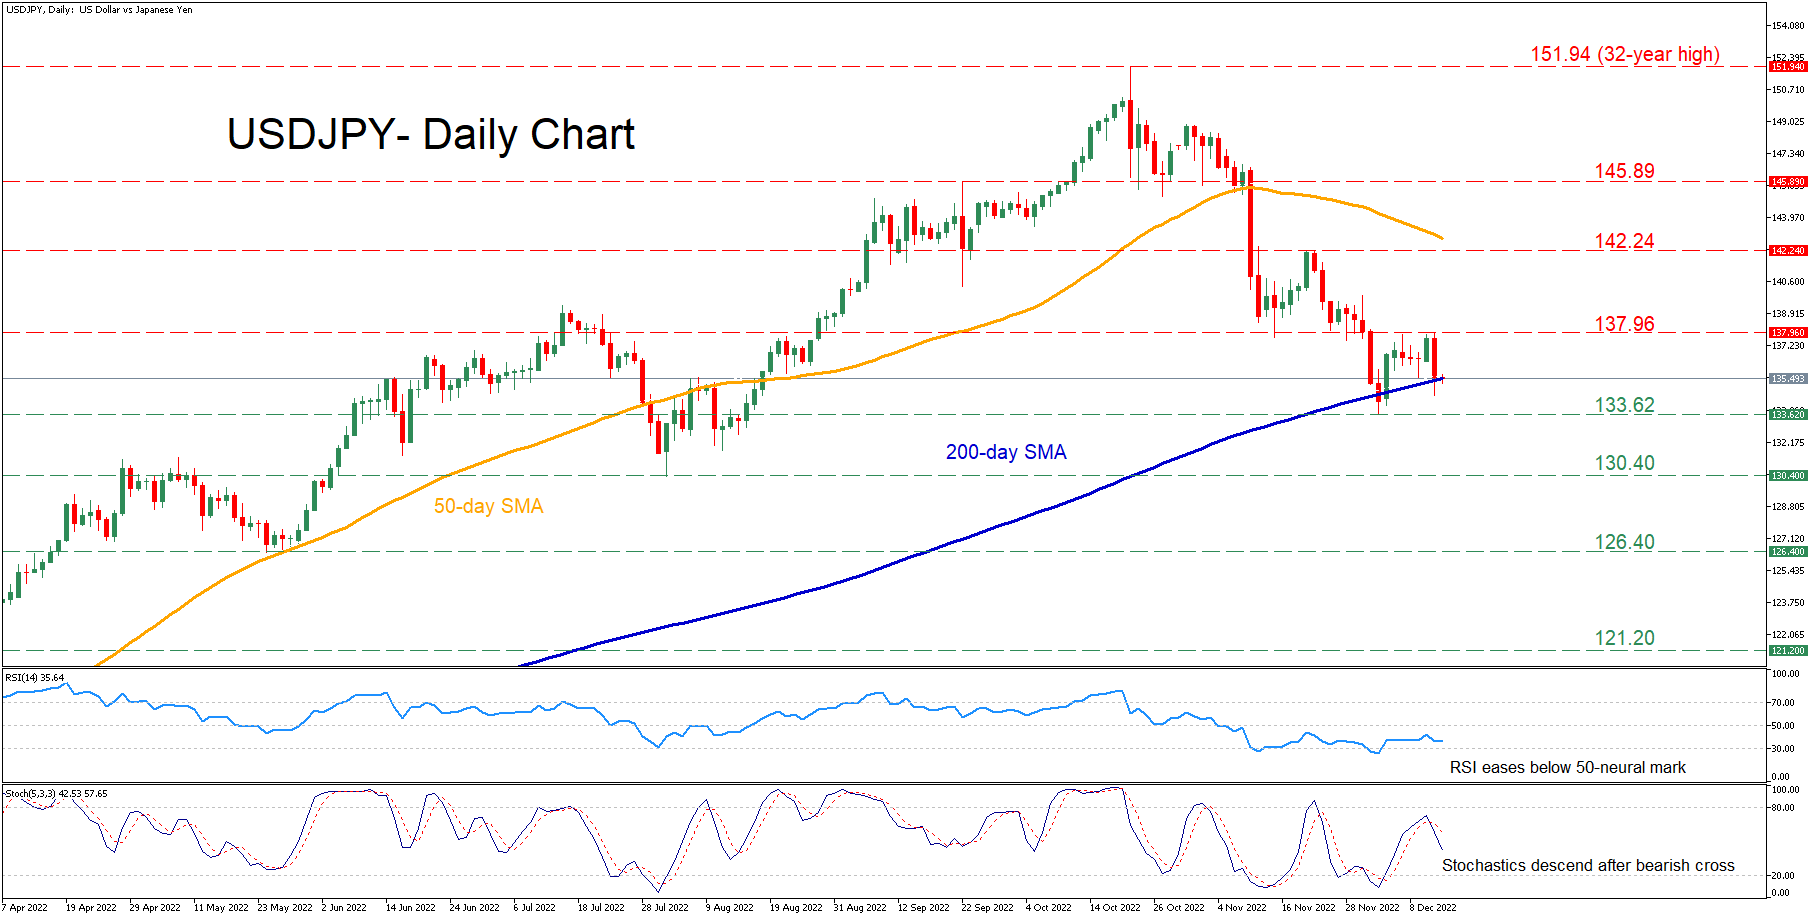
USDJPY has been in a prolonged uptrend for almost two years, crossing above its historical resistance levels to post a 32-year high of 151.94 in October. However, the pair has declined moderately from its recent multi-year peak, with the 200-day simple moving average (SMA) currently acting as a strong floor.
The momentum indicators currently suggest that bearish forces are in control. Specifically, the RSI is hovering below its 50-neutral mark, while the stochastic oscillator is descending after posting a bearish cross.
If sellers eventually manage to push the price below the 200-day SMA, initial support could be found at the recent low of 133.62. Piercing through that wall, the bears might aim for the August low of 130.40. Failing to halt there, the May bottom of 126.40 could provide further downside protection.
To the upside, should buying forces intensify, the pair could challenge the recent resistance region of 137.96. Breaking above that zone, the price could then ascend to challenge 142.24 before the September peak of 145.89 comes under examination. An upside violation of the latter may set the stage for the 32-year high of 151.94.
In brief, despite the persistent downside pressures, it seems that USDJPY is unable to breach the crucial 200-day SMA. Hence, if the pair extends its streak of consecutive failed attempts, there could be an upside correction on the cards.