Sample Category Title
NZD/USD: Has the Formation of a Bullish Primary Impulse Been Completed?
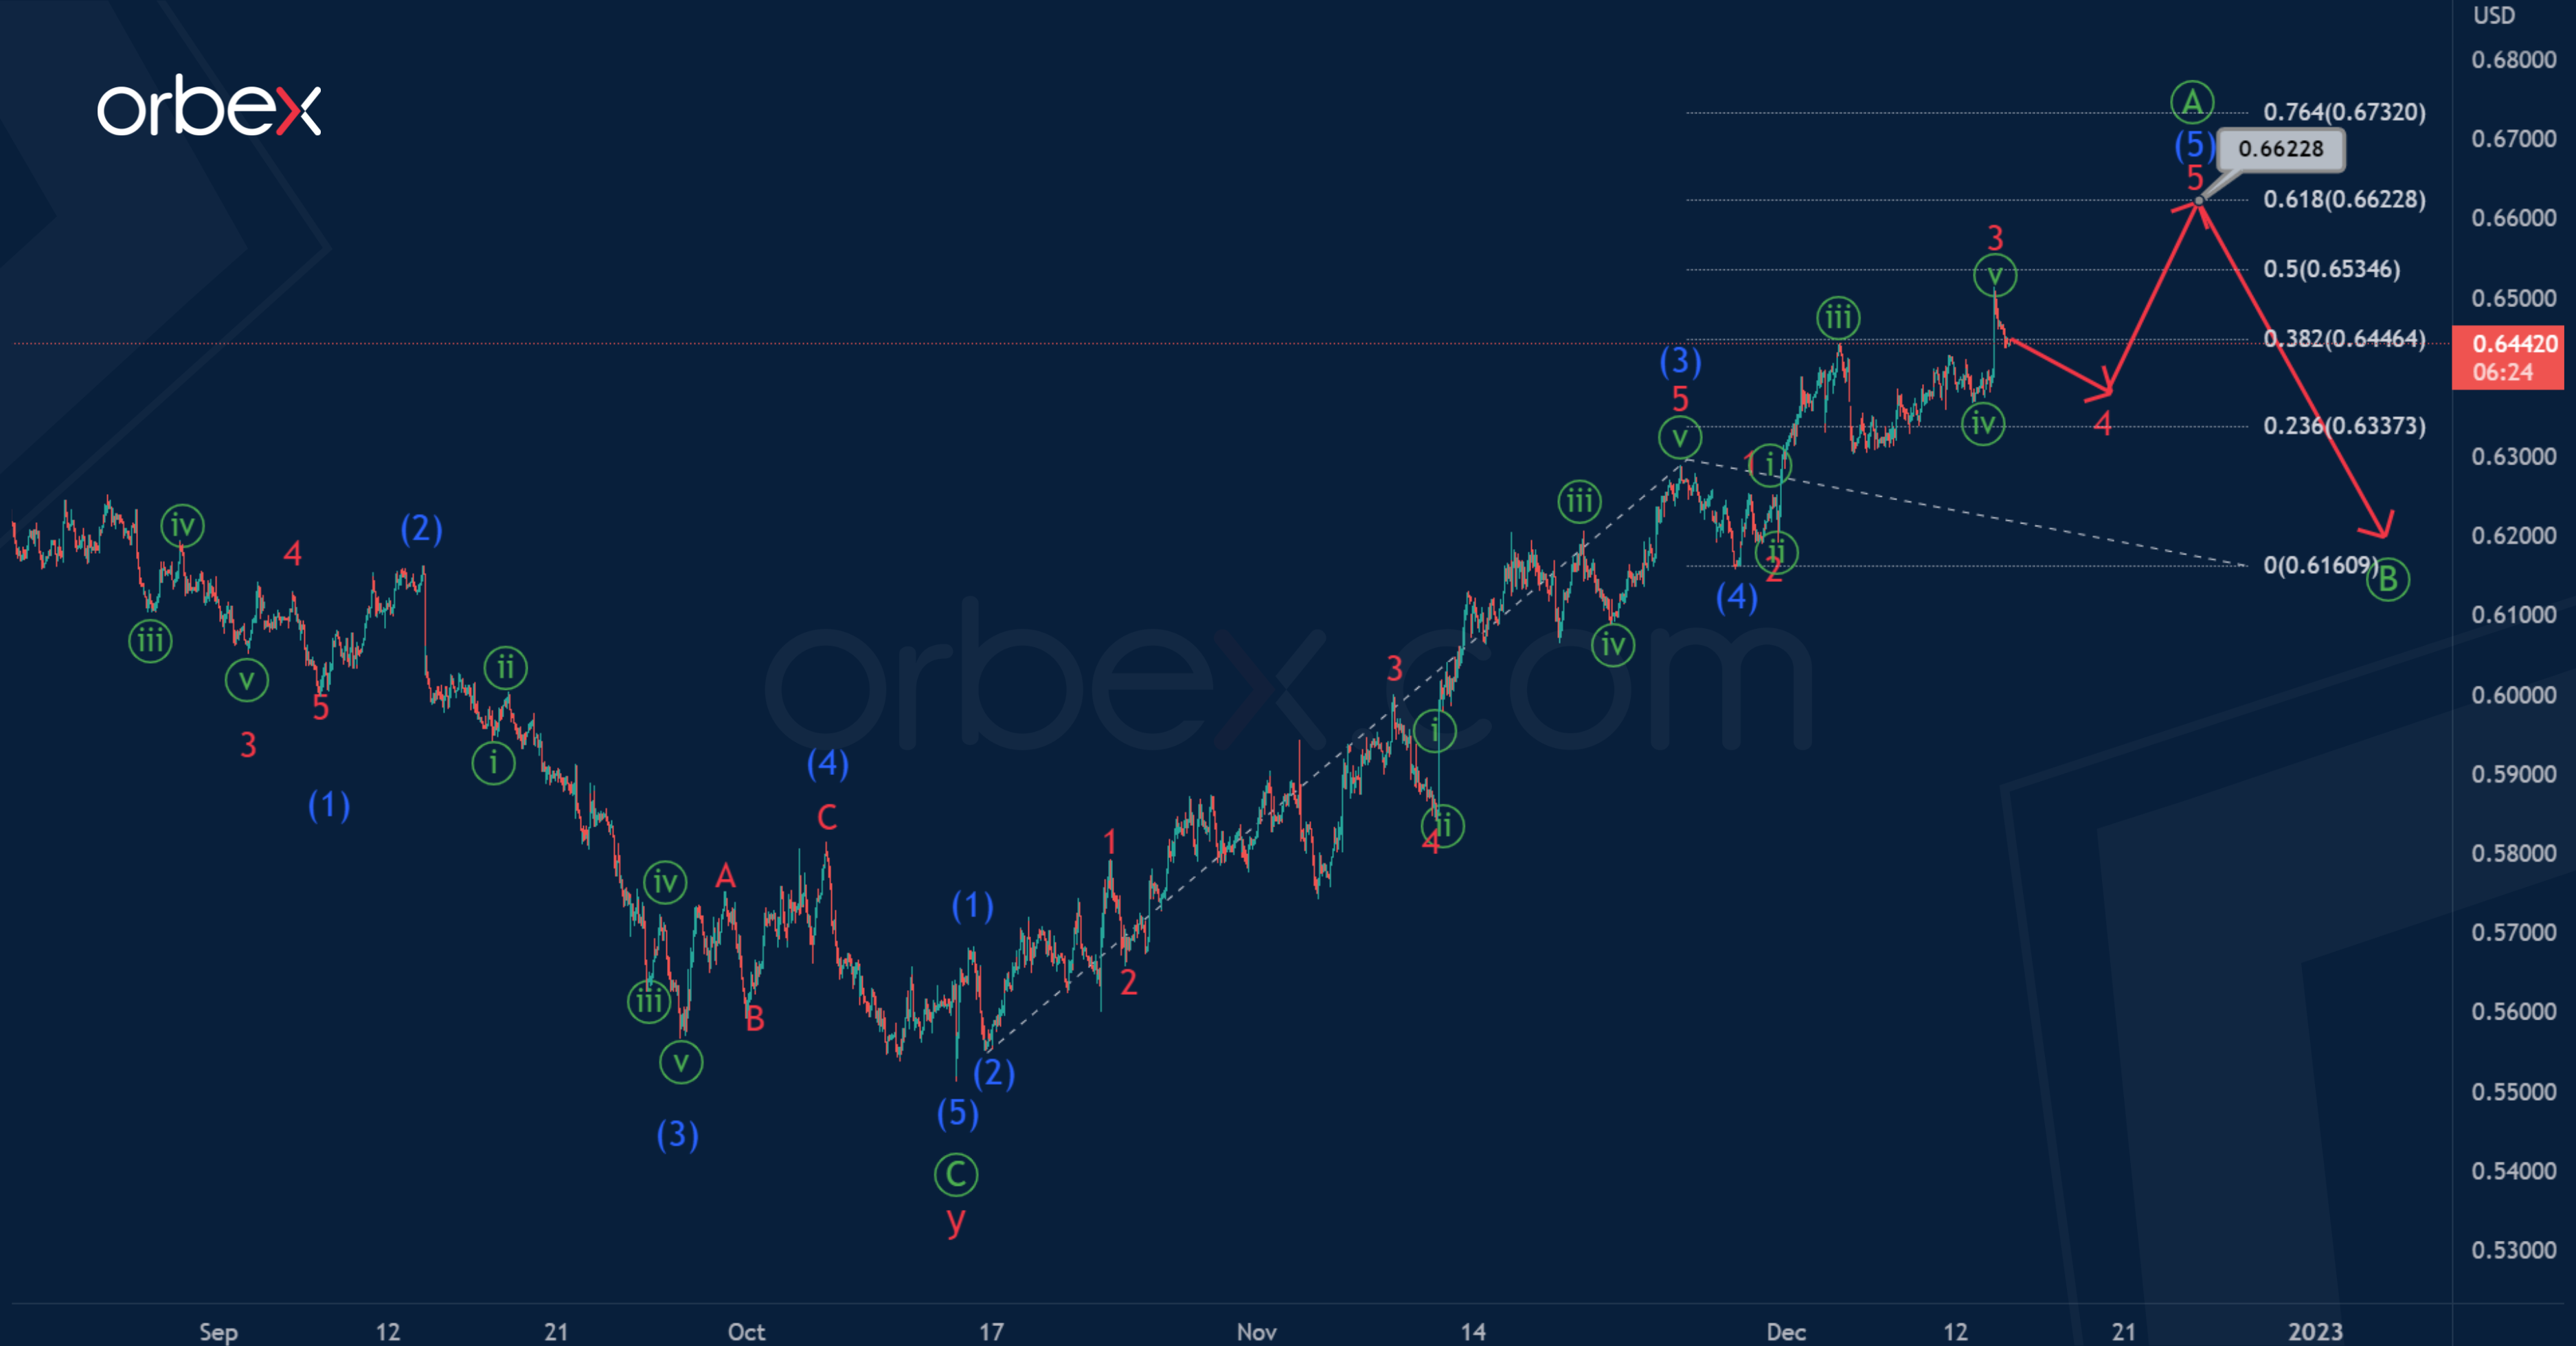
A closer look at the 1H timeframe shows that the NZDUSD market has already completed the formation of a cycle actionary wave y.
Thus, in the last section of the chart, we can see the formation of a new bullish trend. Most likely, there is a construction of the primary wave Ⓐ, which may take the form of an impulse of the intermediate degree (1)-(2)-(3)-(4)-(5). An approximate scheme of possible future movement is shown on the chart.
It is assumed that the bulls will push the market to 0.662. At that level, intermediate wave (5) will be at 61.8% of intermediate impulse wave (3).
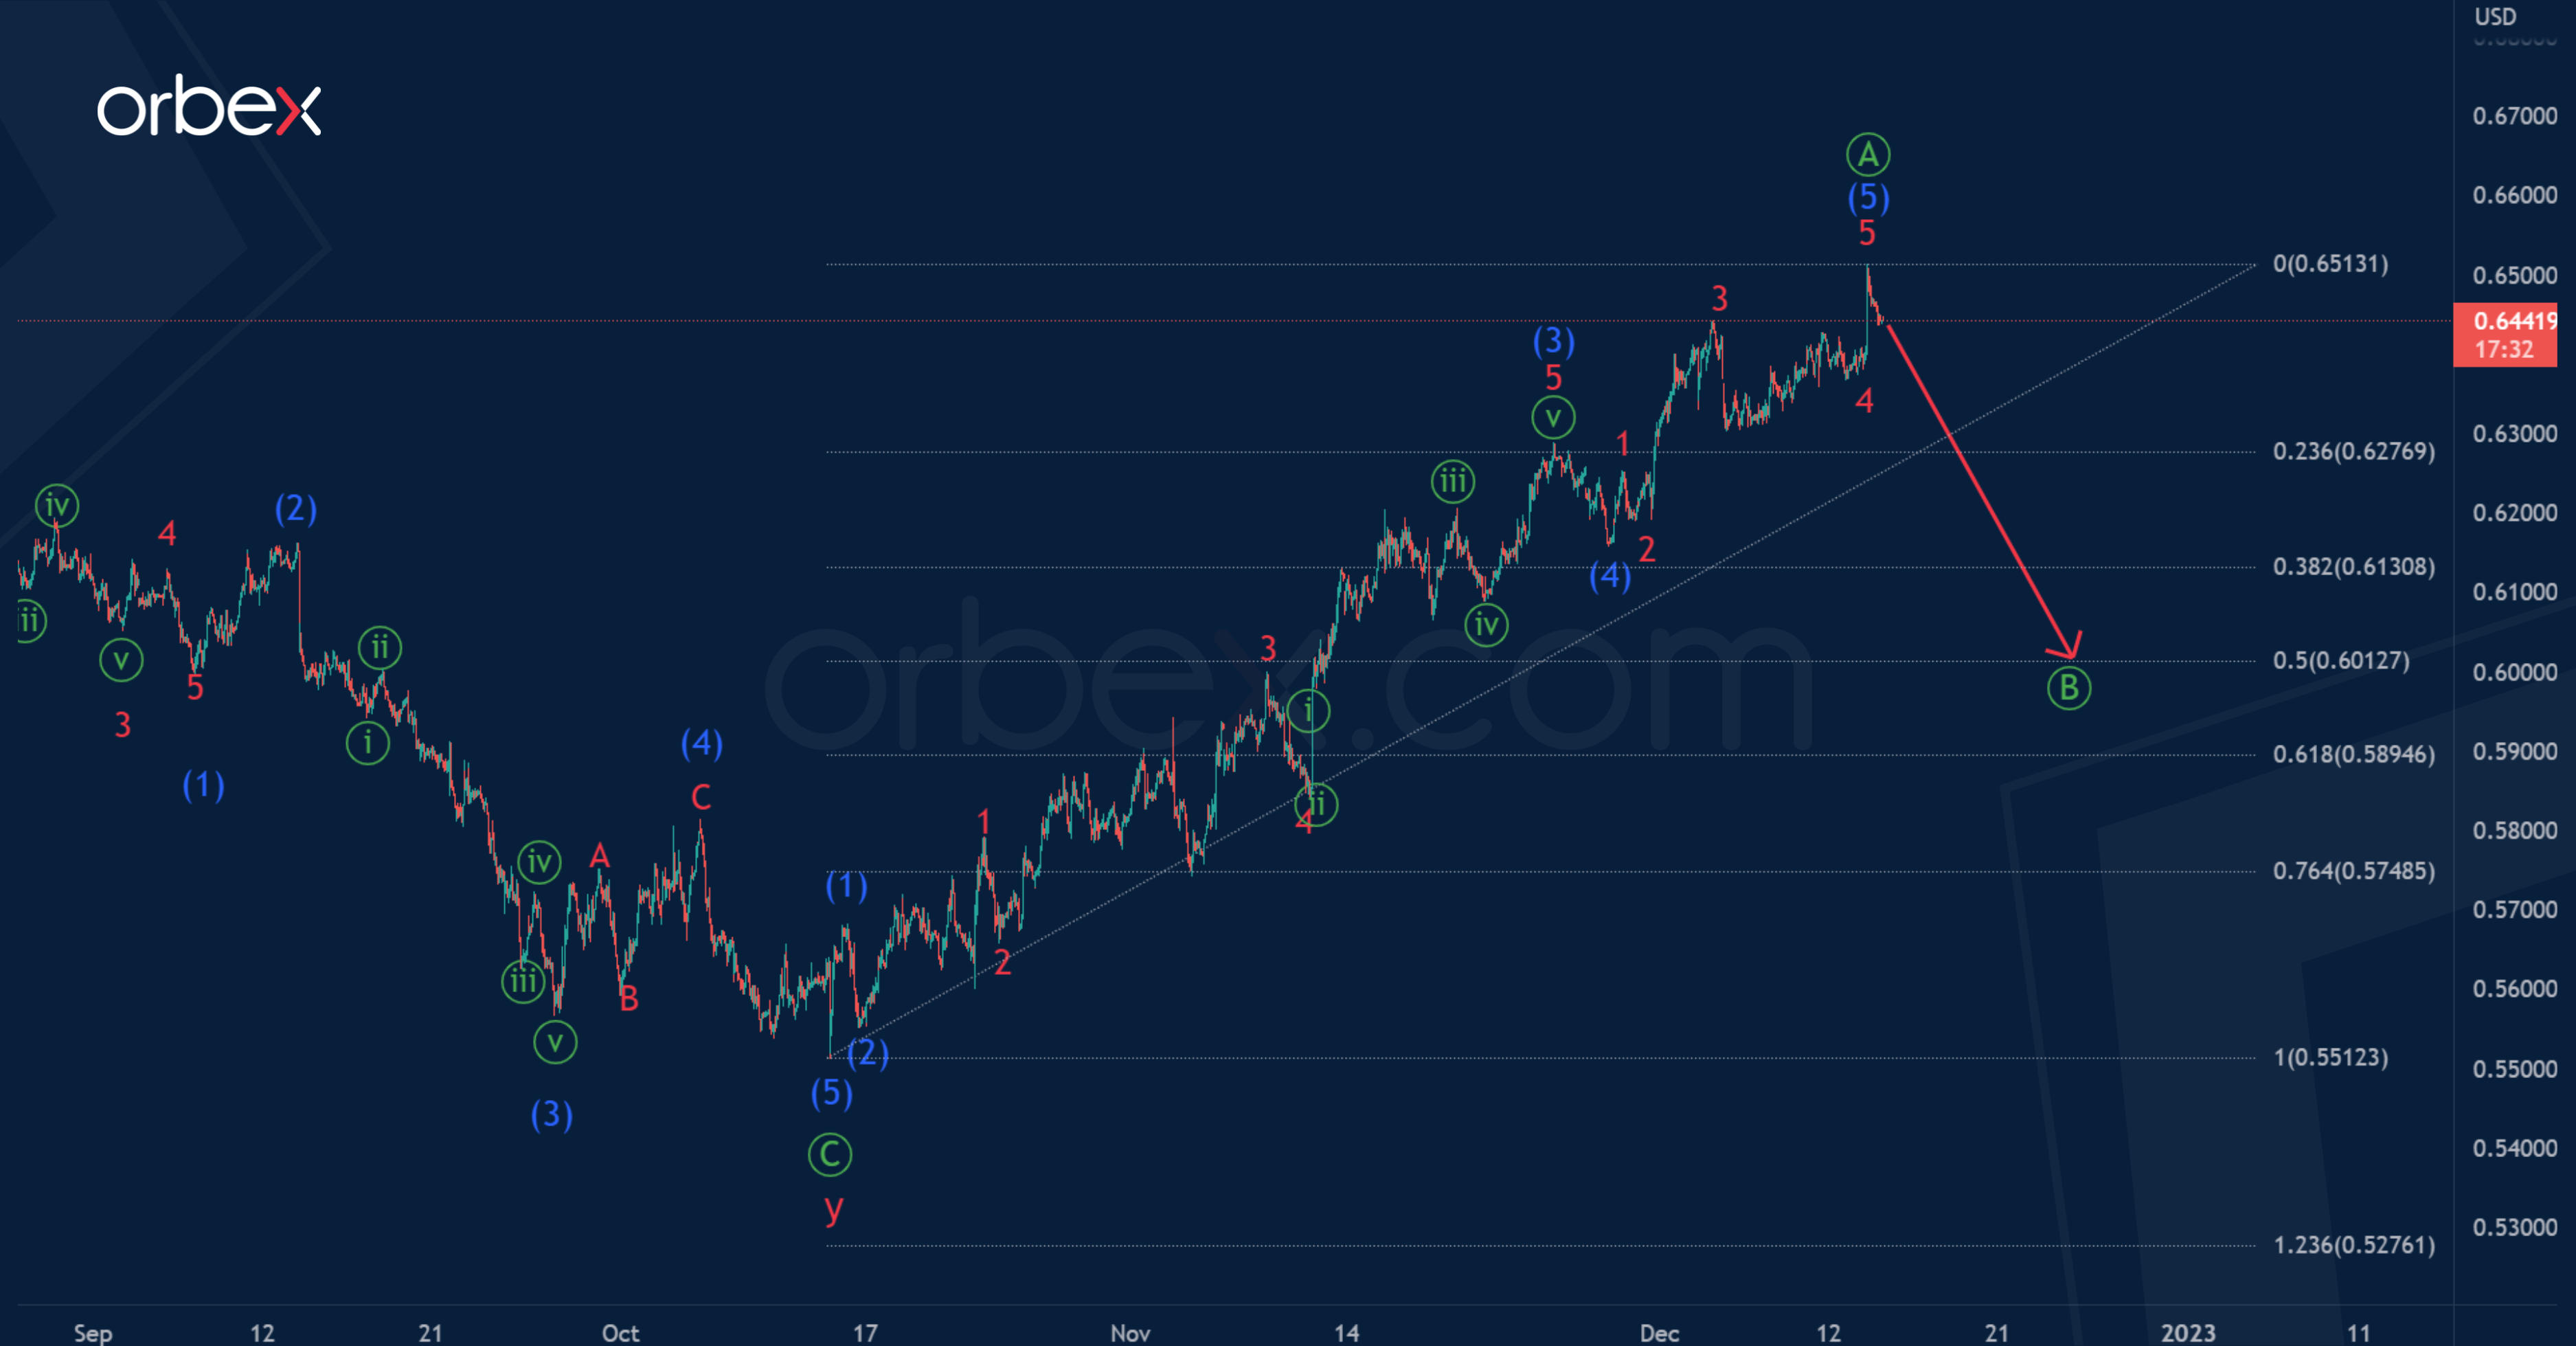
An alternative scenario suggests that the primary wave Ⓐ is fully completed. This is an intermediate impulse (1)-(2)-(3)-(4)-(5).
Thus, the beginning of a bearish correction Ⓑ is expected in the near future, which is the second part of the expected zigzag Ⓐ-Ⓑ-Ⓒ.
Most likely, the price in a potential correction Ⓑ will fall to 0.601. At that level, it will be at 50% of primary impulse Ⓐ.
UK 100 Finds Support
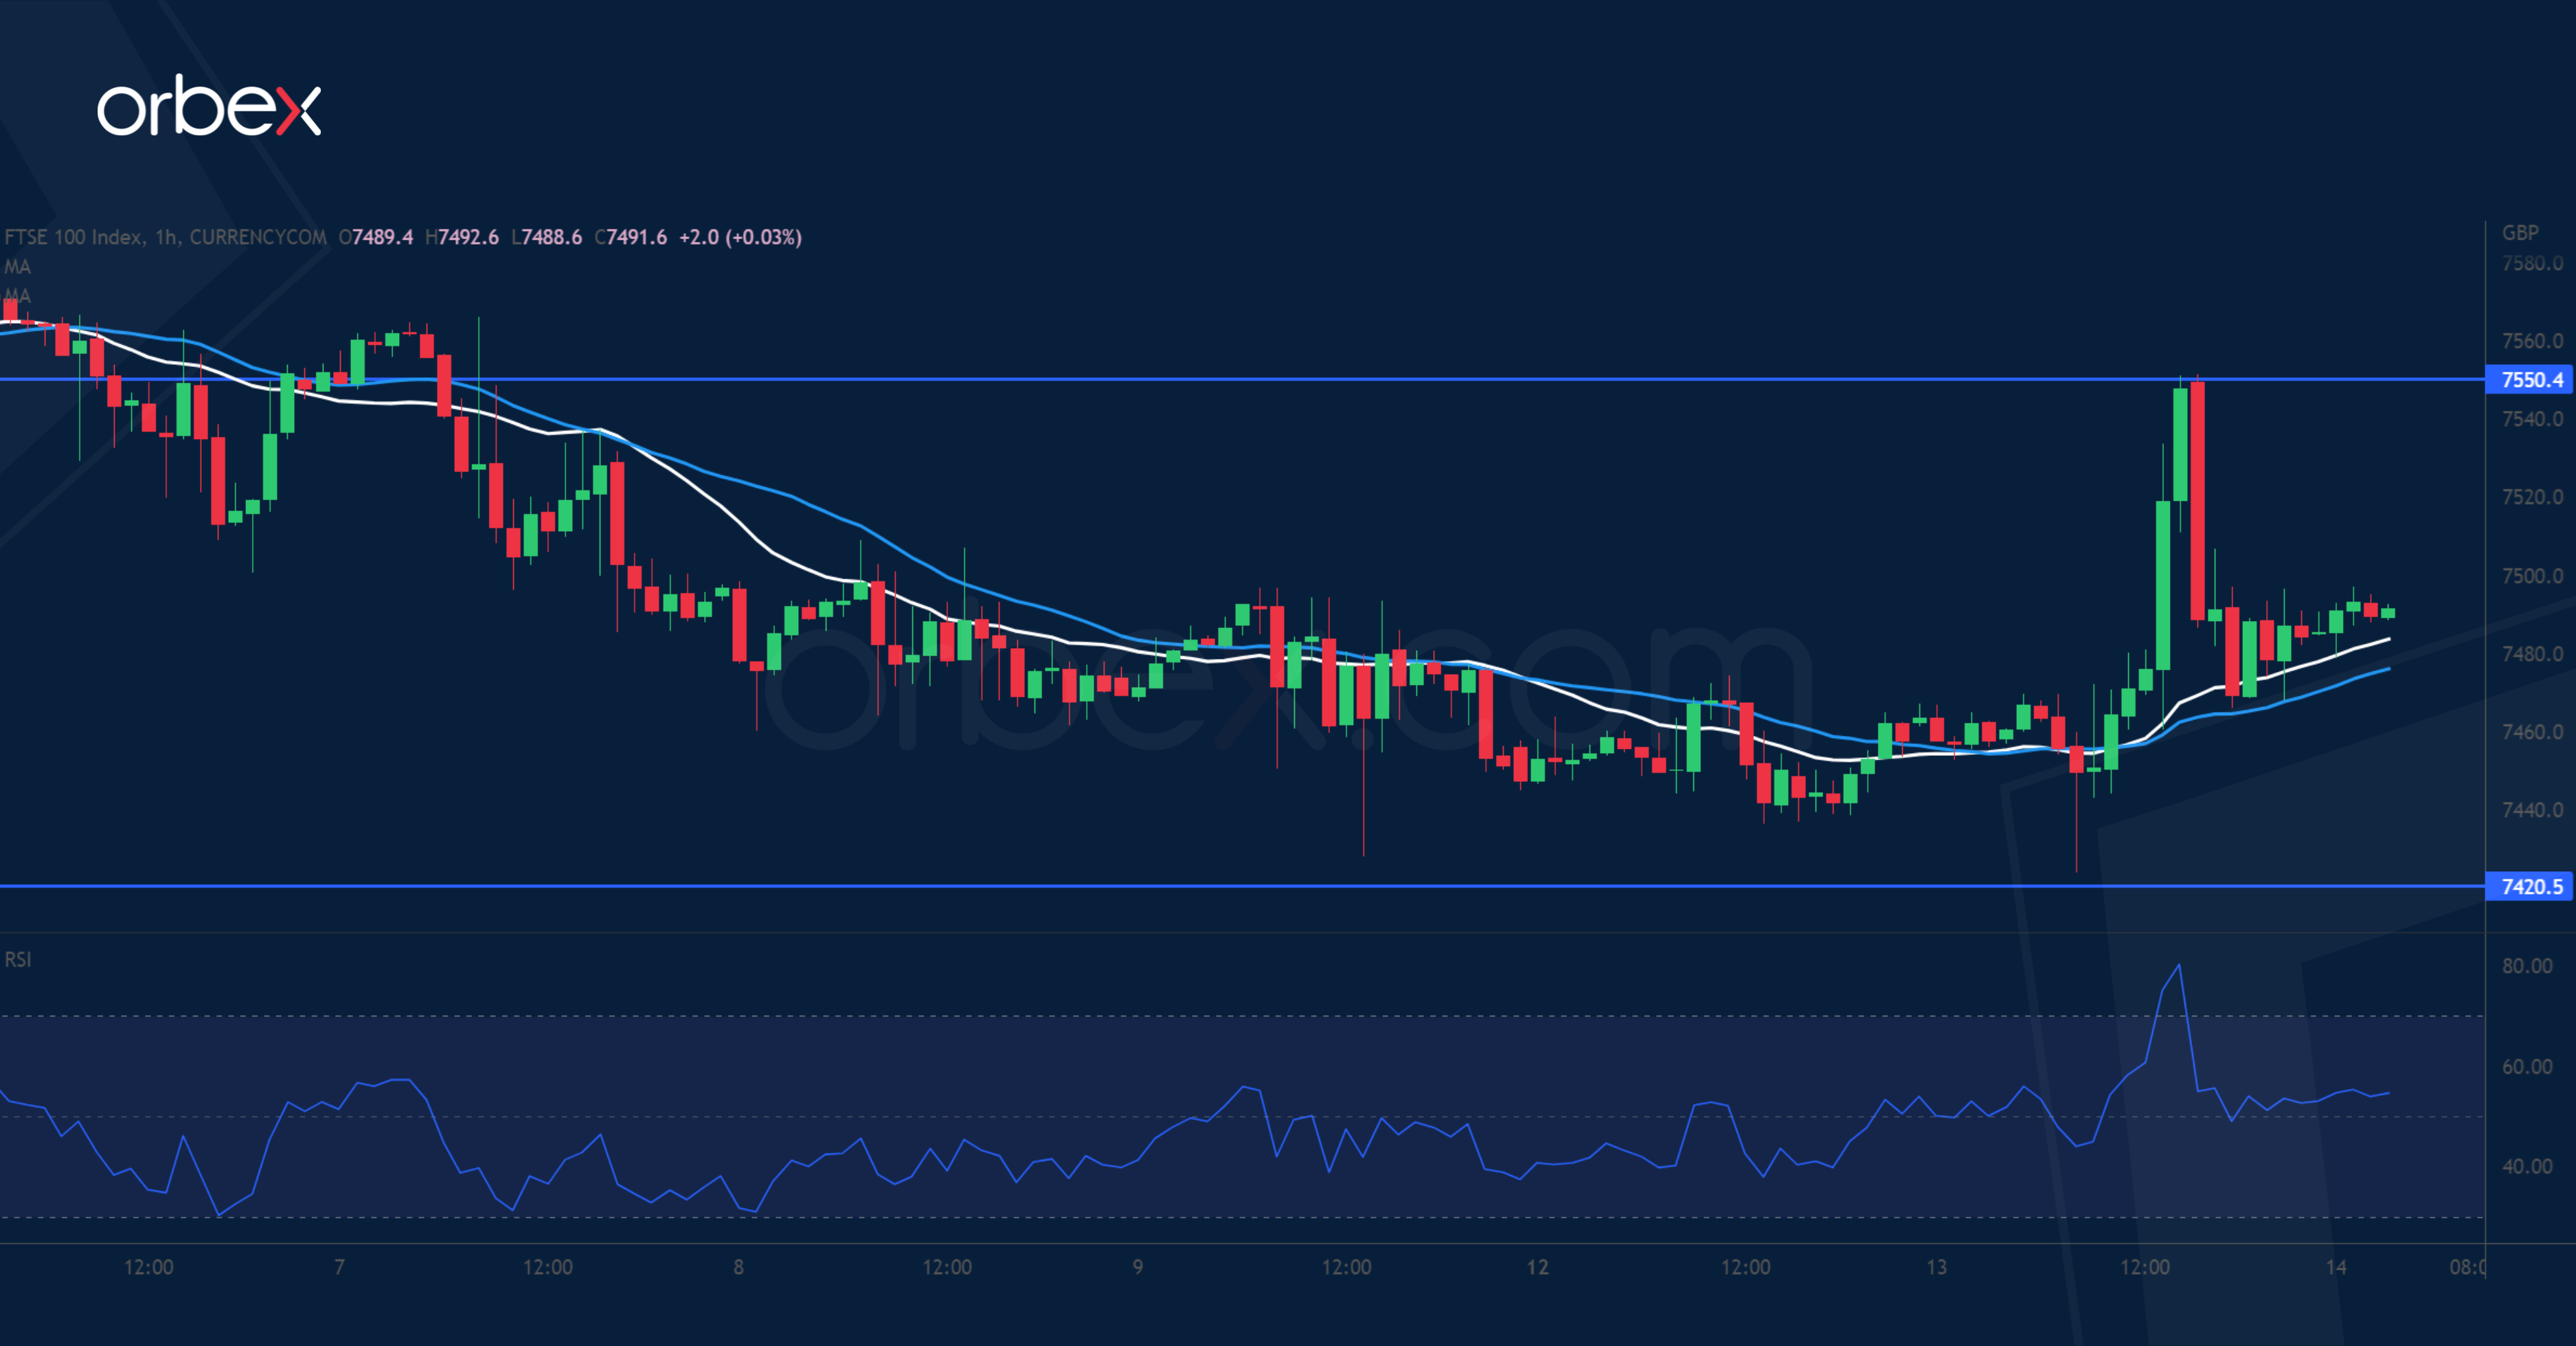
Equities soared as cooling US inflation spurred hopes of a dovish Fed stance. On the daily chart, the FTSE 100 is holding onto its gains after a break above August’s high of 7560, while still remaining under pressure from this year’s highs around 7640. Support has been found at 7420, the junction between the base of a previous bullish breakout and the 30-day moving average. 7550 is the first resistance and a close above 7615 would resume the uptrend. A bearish breakout, however, would cause a correction to 7290.
US Oil Sees Timid Rebound
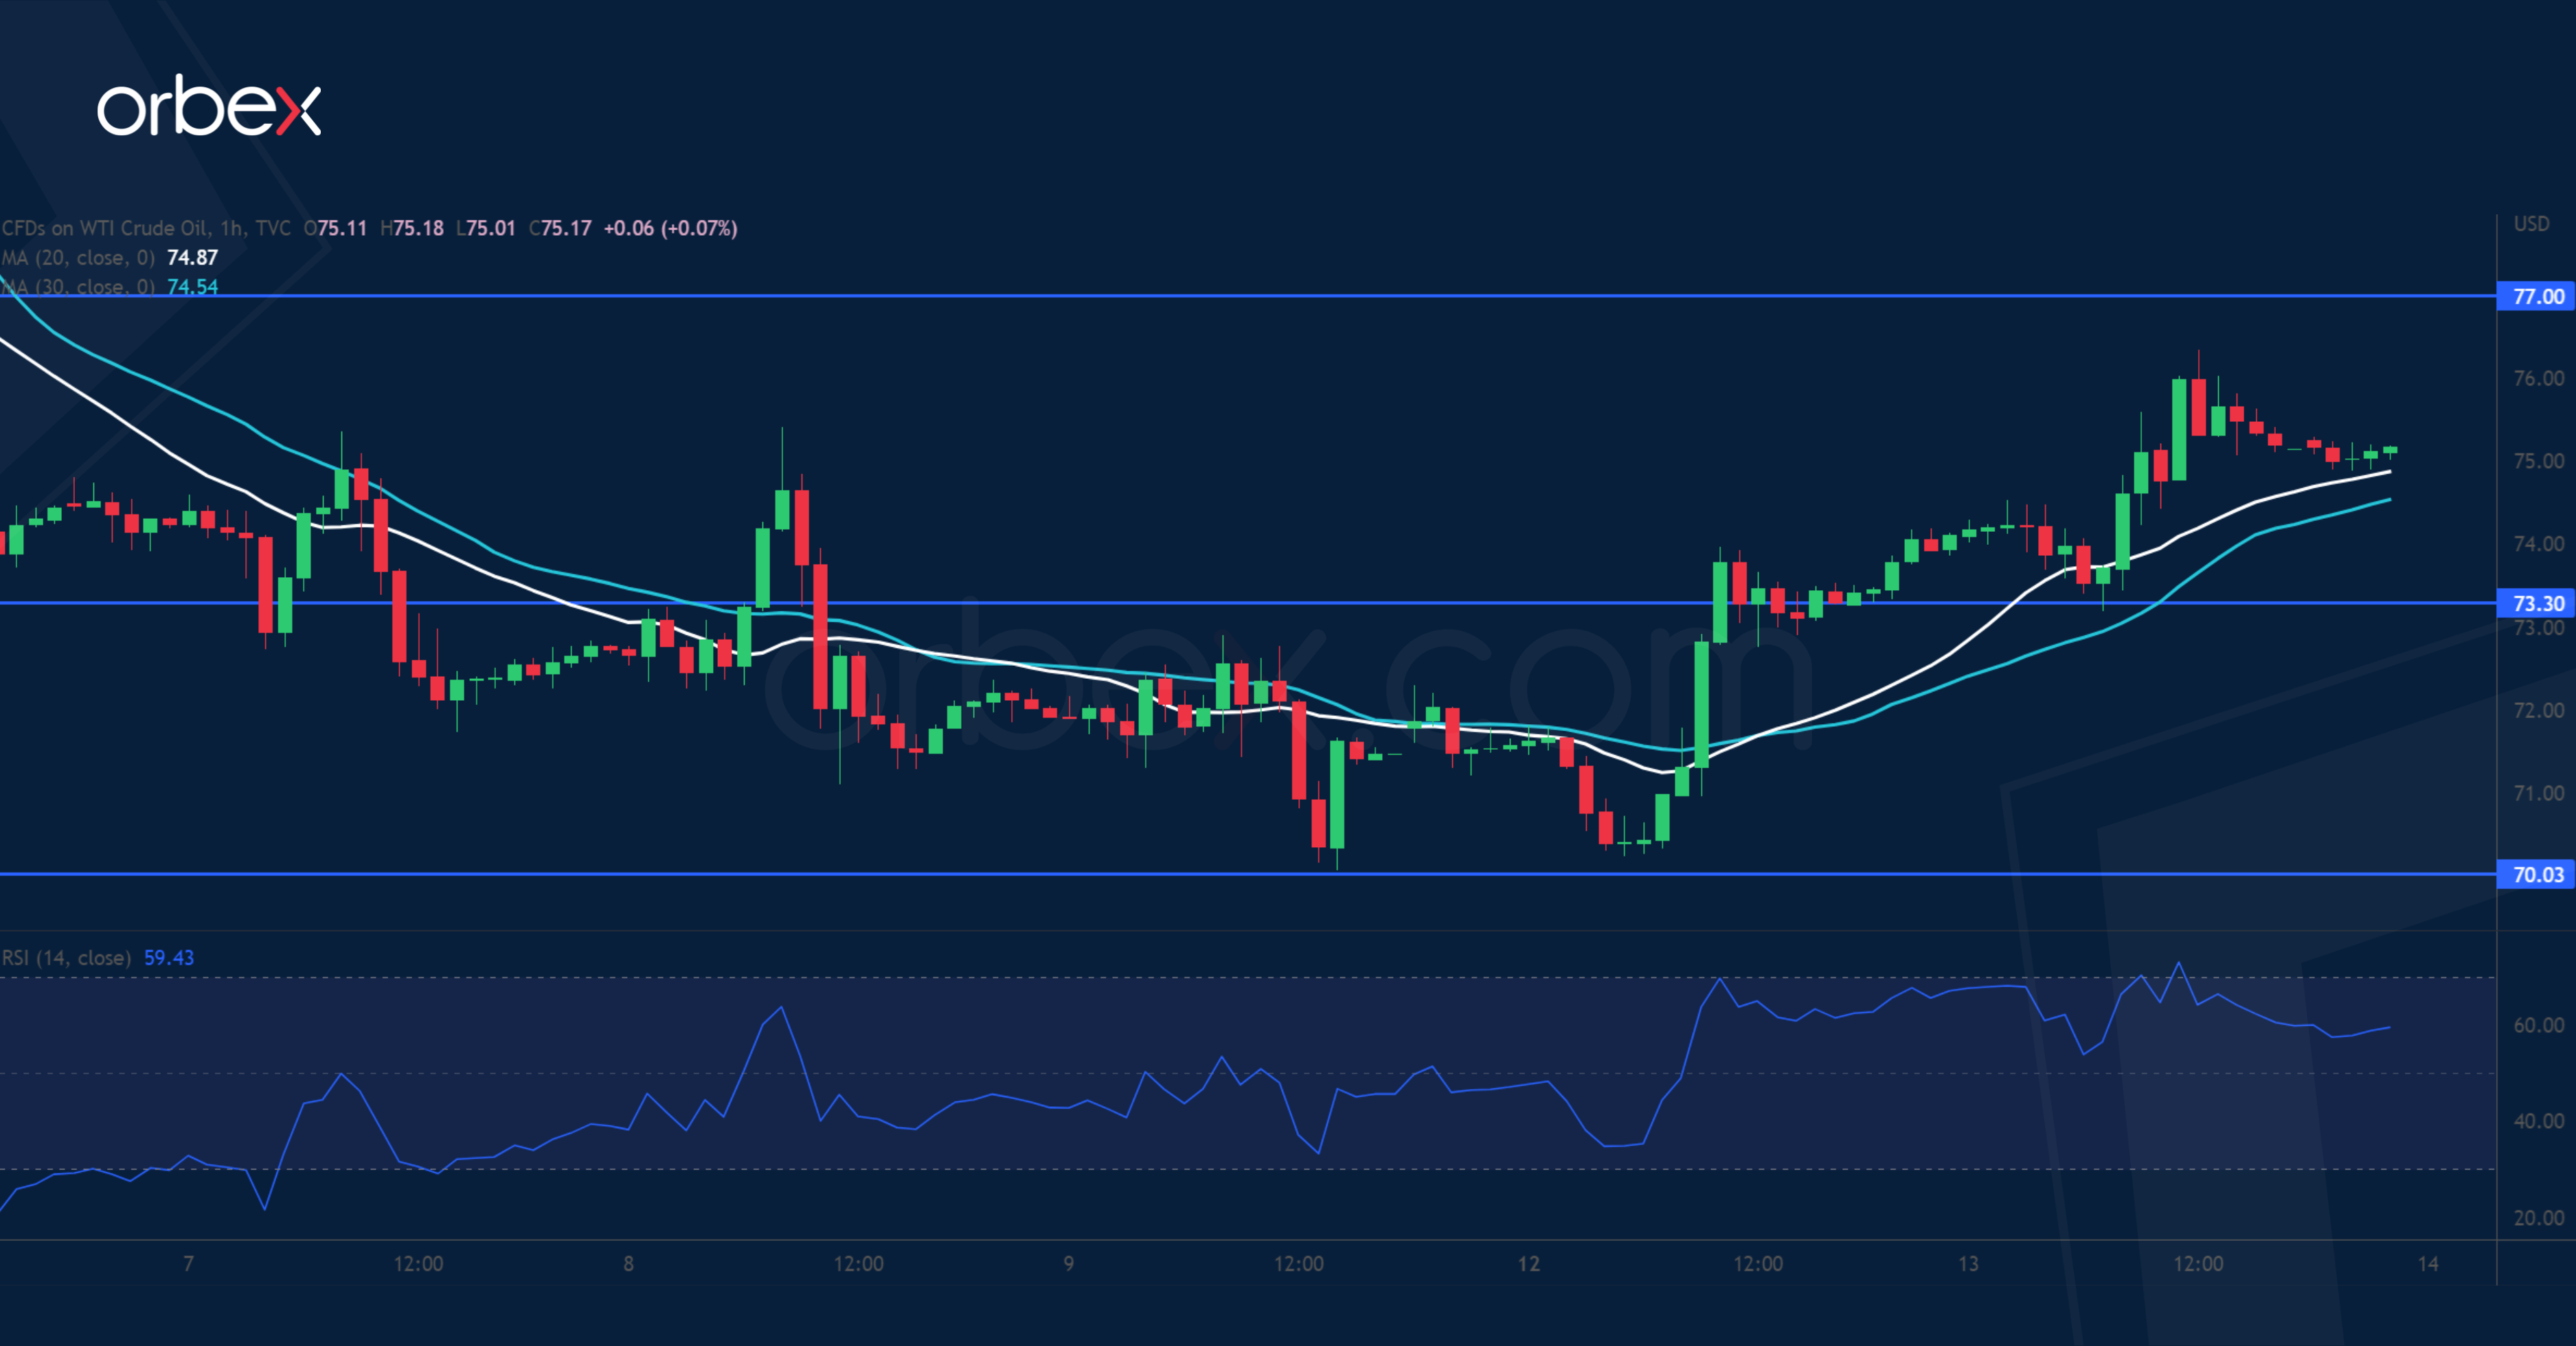
WTI crude bounced after OPEC said it expected demand growth from relaxed COVID policies in China. The price took off at its 12-month low and the psychological level of 70.00. But the bulls will need strong and convincing momentum above this month’s high at 82.00 before they could turn the pessimistic mood around. Before that, the support-turned-resistance at 77.00 is the first hurdle where renewed selling could be expected while the RSI shows an overbought situation. 73.30 is a fresh support and 70.00 a critical floor.
XAU/USD Breaks to Higher Range
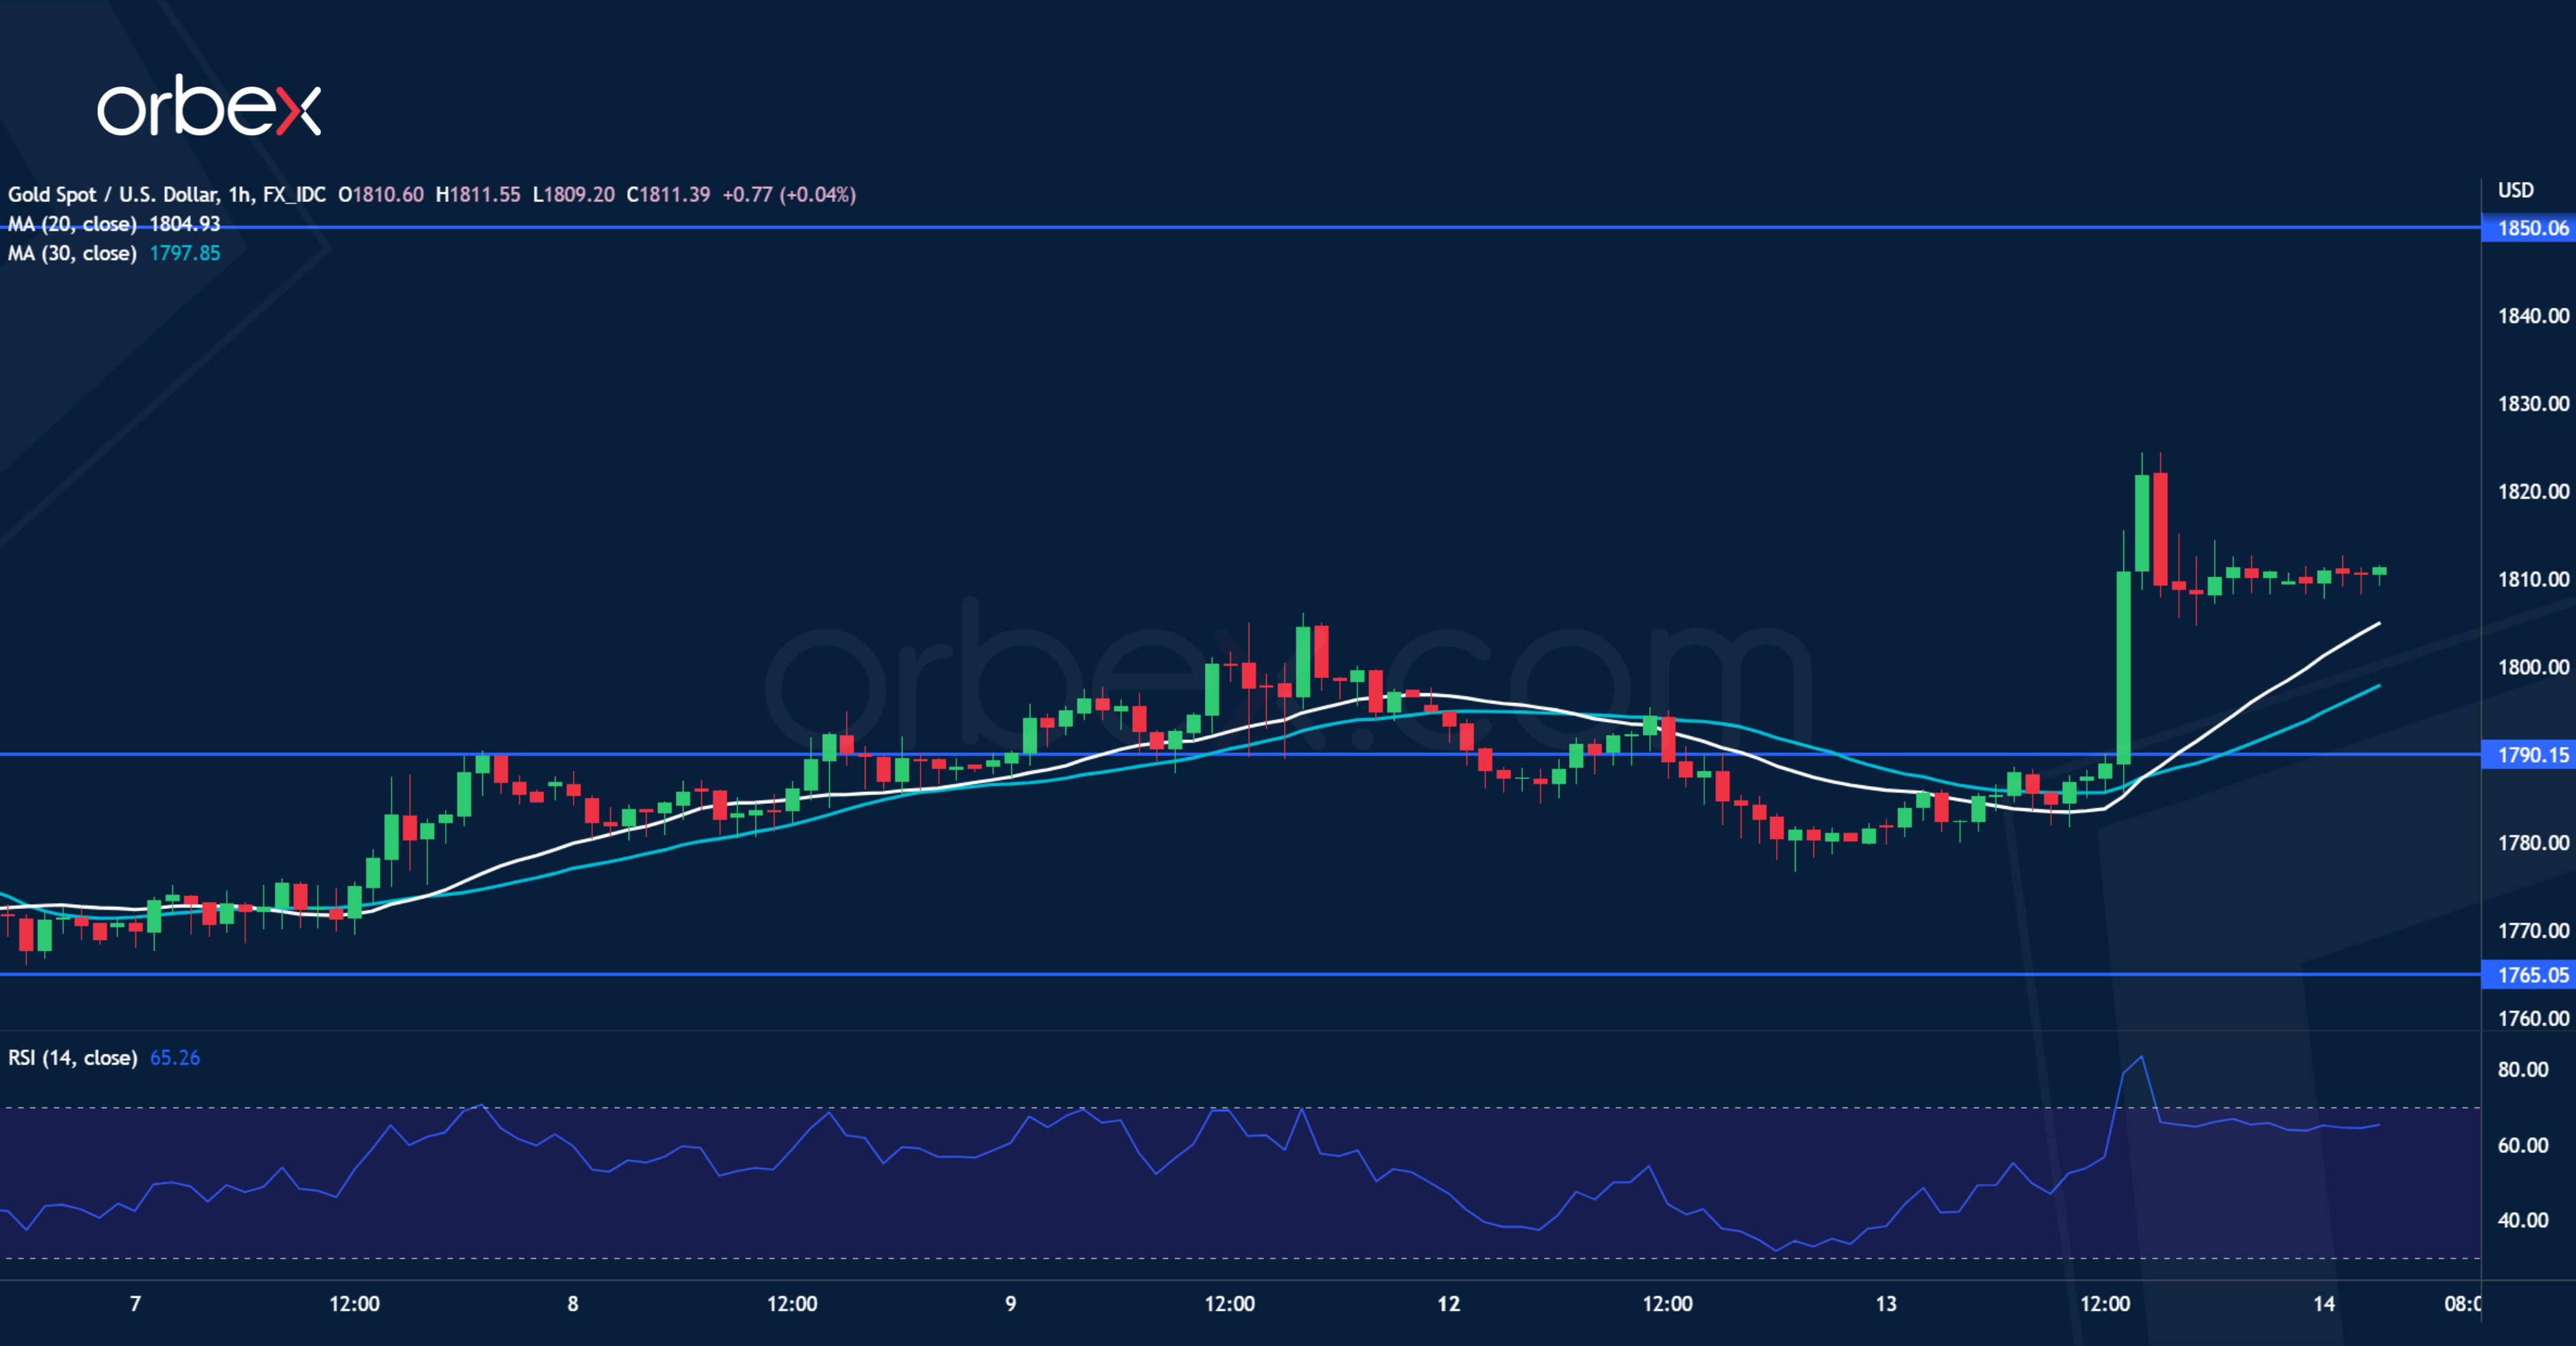
Gold popped higher following a deceleration in US CPI last month. After a rally above the August high of 1805, a brief consolidation saw support at 1765 right over the 20-day moving average. As the trading range compressed, the pressure was building up ahead of a breakout. This came in the shape of a strong impetus above 1810 which could lead to a runaway rally above 1850. As the RSI shot into the overbought area a pullback could ensue and the base of the breakout at 1790 is a key level to maintain the upward bias.
Elliott Wave View: Silver (XAGUSD) Wave 5 Ending Soon
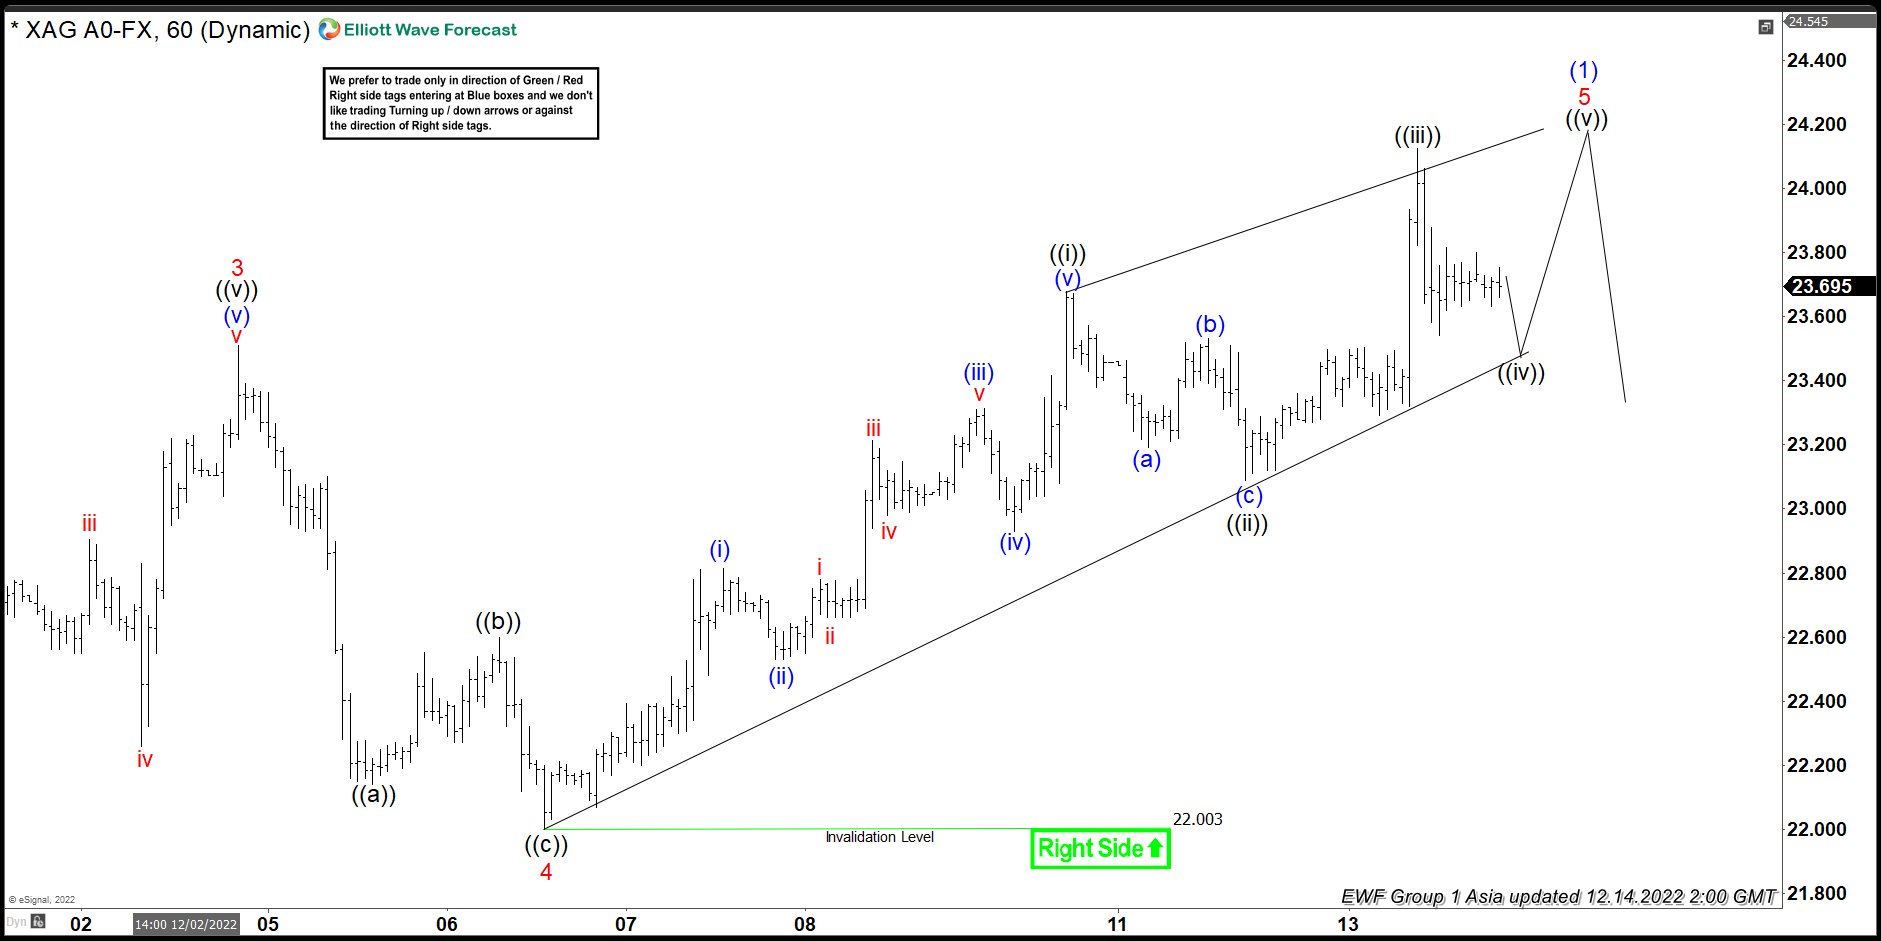
Short term Elliott Wave View in Silver (XAGUSD) suggests the rally from 9.28.2022 low is unfolding as a 5 waves impulse Elliott Wave structure. Up from 9.28.2022 low, wave 1 ended at 21.24 and pullback in wave 2 ended at 18.05. The metal then resumed higher in wave 3. Up from wave 2, wave ((i)) ended at 18.94 and dips in wave ((ii)) ended at 18.26. The metal resumes higher in wave ((iii)) towards 22.25 and pullback in wave ((iv)) ended at 20.56. Final leg higher wave ((v)) ended at 23.51 which completed wave 3. From there, the metal pullback in wave 4 which ended at 22.00.
Wave 5 higher is in progress with internal subdivision as an impulse in lesser degree. Up from wave 4 low, wave ((i)) ended at 23.68 and pullback in wave ((ii)) ended at 23.09. Bounce in wave ((iii)) ended at 24.13 and pullback as wave ((iv)) has dropped inside of wave 1’s area forming and ending diagonal structure. Near term. we expect to complete wave ((iv)) before see one more high above 24.13 and completed an impulse from 9.28.2022 low. After this, expect pullback in wave (2) to find support in 3, 7, 11 swing for more upside.
XAGUSD 60 Minutes Elliott Wave Chart
https://www.youtube.com/watch?v=hZ6ijQfVCpY
Expect Fed to Raise Terminal Policy Rate to 5% and Perhaps Even More
Markets
US CPI eased more than expected in November to 7.1% headline and 6% core inflation. The downside surprise was no more than 2 and 1 hundreds of a percent respectively but it mattered for markets. US short term yields dropped almost 25 bps intraday (2y), outperforming the long end (<20 bps in the 10y). Part of those losses were recouped later in the session. Yields eventually closed 15.8 bps lower at the short end with the 2y yield losing the 4.25% neckline support. The back of the curve shed 3.9 bps. The 30y underperformed after a 3 bps tailed $18bn auction. US Treasury action pulled German Bunds in its slipstream. But the damage in terms of yields was limited to a max of 5.1 bps at the front. Gilt yields parted ways by searing more than 10 bps (10y, 30y) in the wake of a strong labour market report. The dollar got dumped yesterday. The trade-weighted index fell to the lowest level since June (103.98). USD/JPY retreated from 137.67 to 134.66 with further losses prevented by the 200dMA. EUR/USD snapped higher, beyond the 38.2% recovery of the ‘21/’22 decline (1.0611). Sterling traded somewhat disappointing given the deviating Gilt performance. GBP/USD eked out a big figure to 1.2366 but EUR/GBP finished the day slightly higher just south of 0.86. Technical factors could have been at play. Another failed test of the 0.8567 support area triggered reverse action higher. Interesting moves on equity markets yesterday as well. The likes of the Nasdaq only retained about a percent of its almost 4% surge at the open.
There’s some news flow in Asian dealings in the form of new economic forecasts in New Zealand (see below) and Japan’s Q4 Tankan survey. UK CPI came in at 10.7% headline and 6.3% core early in the European morning. Both are a little less than expected but for the moment fail to trigger a reaction in sterling. If there even was one, it eases the case for another 75 bps rate hike by the BoE tomorrow. All eyes are now turned to the US for today’s main event, the Fed policy decision. The US central bank is poised to slow the tightening pace from (4x) 75 bps to 50 bps. That will bring the policy rate to 4.25/4.50%. The real market information lies in the new economic projections. These will probably entail another upward revision to the inflation forecasts. PCE inflation was seen in September at 5.4% this year, 2.8% next year and 2.3% in 2024 before returning the 2% target in 2025. Although economic indicators in most cases held up relatively well lately, we wouldn’t be surprised to see some downward adjustments to the growth forecasts. This is because we expect the Fed to have raised the terminal policy rate to 5% and perhaps even more, in line with recent guidance from chair Powell and others. Critically, both the median rate projections (dot plot) and Powell will emphasize that this higher policy rate is here to stay for longer. In a sense, markets have brought this upon themselves. Because of the recent sharp repositioning financial conditions have eased materially, undoing part of the Fed’s efforts. We anticipate a strong pushback against the 50 bps rate cuts being priced in for the second half of next year – which in our view is unjustified and have never been consistent with Fed talk.
News Headlines
The New Zealand government presented its Half-Year Economic and Fiscal update this morning. FM Robertson warns for a rough year ahead with the economy forecasted to shrink by 0.8% in the 2023 calendar year. Household incomes will feel the pain from rising mortgage interest rates, higher unemployment and falling house prices. Mortgages are linked to the RBNZ’s aggressive anti-inflation campaign with the policy rate currently at 4.25% and expected to peak at 5.5%. The unemployment rate is set to rise from 3.3% to 3.8% by mid-2023 and to 5.5% by mid-2024. The focus in the government’s 2023 budget will be to contain spending and achieve a contractionary fiscal policy. The 2022-23 budget deficit is forecast at NZD 3.6bn (vs NZD 6.6bn in May) and projected to return into surplus in 2024-25. Net debt is set to rise from 17.2% of GDP mid-2022 to 21.4% by mid-2024.
OPEC yesterday published its monthly oil market report. The cartel warns that the recent global economic growth slowdown will have far-reaching implications for next year which it labels as surrounded by many uncertainties mandating vigilance and caution. More specifically, OPEC sees a finely-balanced market in Q1 2023 instead of a deficit in the November Monitor. The cartel for now decided to keep its global oil demand and supply forecasts for next year broadly unchanged though. Oil prices dropped almost 20% over the past month with Brent crude setting a cycle low at $75/b, before rebounding to the $80/b area where it is trading now.
GBP/JPY Daily Outlook
Daily Pivots: (S1) 166.76; (P) 168.02; (R1) 168.94; More...
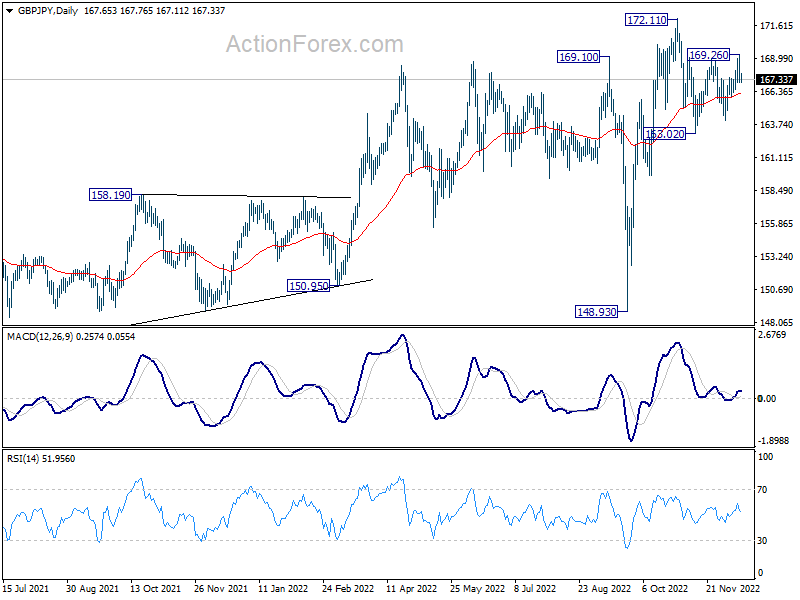
Intraday bias in GBP/JPY is turned neutral again with current retreat. On the upside, above 169.26 will bring retest of 172.11 high. However, break of 167.09 will suggest that the corrective pattern from 172.11 is extending. Bias will be back on the downside for 164.02 support and possibly below.
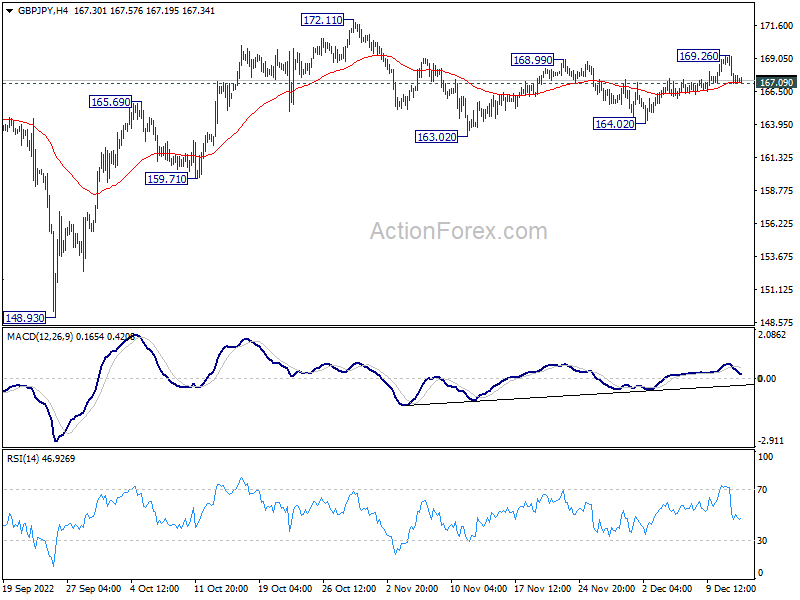
In the bigger picture, medium term upside momentum has been diminishing as seen in bearish divergence condition in weekly MACD. Sustained break of 55 week EMA (now at 160.90) will argue that it's already correcting whole up trend from 123.94 (2020 low). Nevertheless, before that, such up trend could still extend through 172.11 high.
EUR/JPY Daily Outlook
Daily Pivots: (S1) 143.34; (P) 144.34; (R1) 145.17; More....
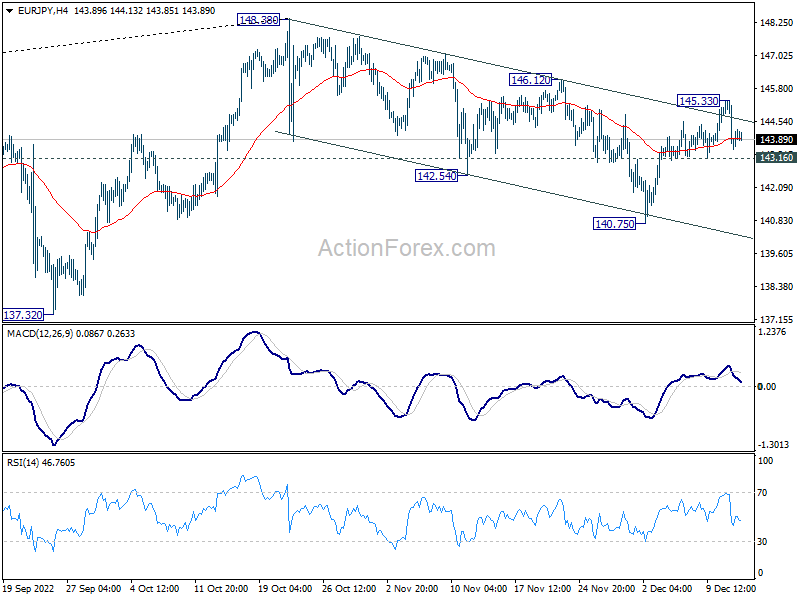
Intraday bias in EUR/JPY is turned neutral again with current retreat. Outlook is unchanged that correction from 148.38 could have completed at 140.75. Above 145.33 will target 146.12 resistance first. Firm break there will bring retest of 148.38 high. On the downside, however, break of 143.16 minor resistance will dampen this bullish case and turn intraday bias back to the downside for 140.75.
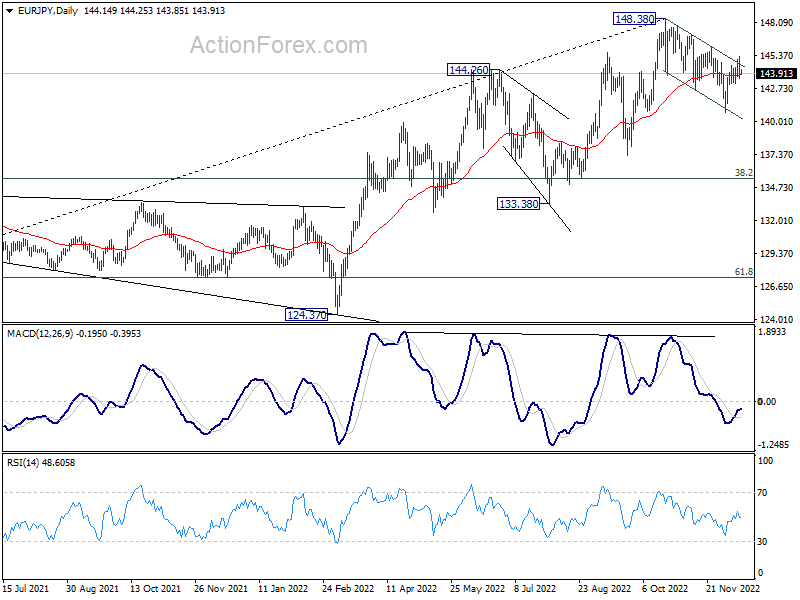
In the bigger picture, considering bearish divergence condition in weekly MACD, 148.38 could be a medium term top already. Fall from there is probably correcting whole up trend from 114.42 (2020 low). Deeper decline would be seen to 55 week EMA (now at 138.08), or further to 38.2% retracement of 114.42 to 148.38 at 135.40 before completion.
EUR/GBP Daily Outlook
Daily Pivots: (S1) 0.8571; (P) 0.8588; (R1) 0.8614; More...
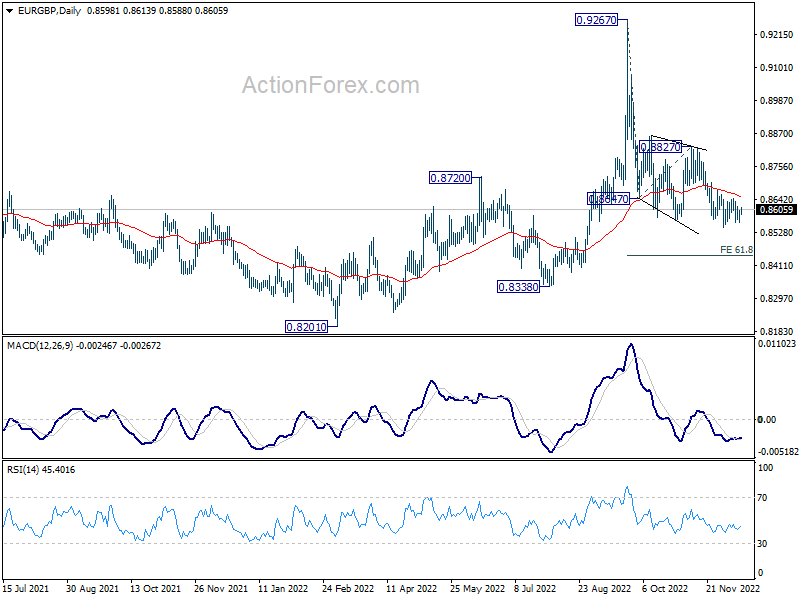
EUR/GBP is staying in consolidation from 0.8545 and intraday bias remains neutral. Further decline is expected with 0.8674 resistance intact. Break of 0.8545 will resume the fall from 0.9267, and target 61.8% projection of 0.9267 to 0.8647 from 0.8827 at 0.8444 next. On the upside, above 0.8674 minor resistance will indicate short term bottoming, and bring stronger rebound back to 0.8827 instead.
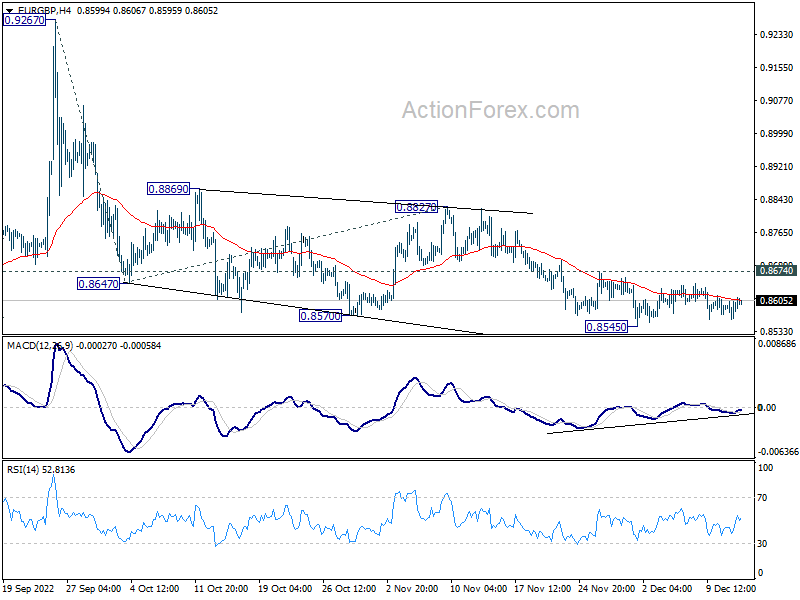
In the bigger picture, current development suggests that fall from 0.9267 is a down leg inside long term range pattern. Deeper fall could be seen towards 0.8201/8338 support zone. But strong support should be seen there to bring reversal. Nevertheless, firm break of 0.8827 resistance will turn favor to the case that such decline is merely a correction in the up trend from 0.8201. That is, further rally would be seen at a later stage through 0.9267.
EUR/AUD Daily Outlook
Daily Pivots: (S1) 1.5426; (P) 1.5530; (R1) 1.5616; More...
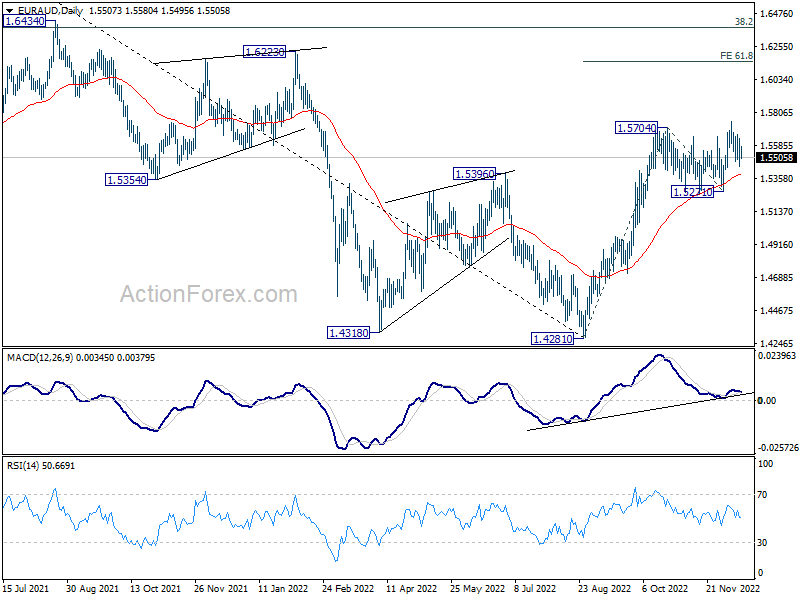
Intraday bias in EUR/AUD remains neutral as corrective pattern from 1.5747 is extending. As long as 1.5271 support holds, further rally is expected. On the upside, firm break of 1.5747 will resume larger rally from 1.4281. Next target is 61.8% projection of 1.4281 to 1.5704 from 1.5271 at 1.6150.
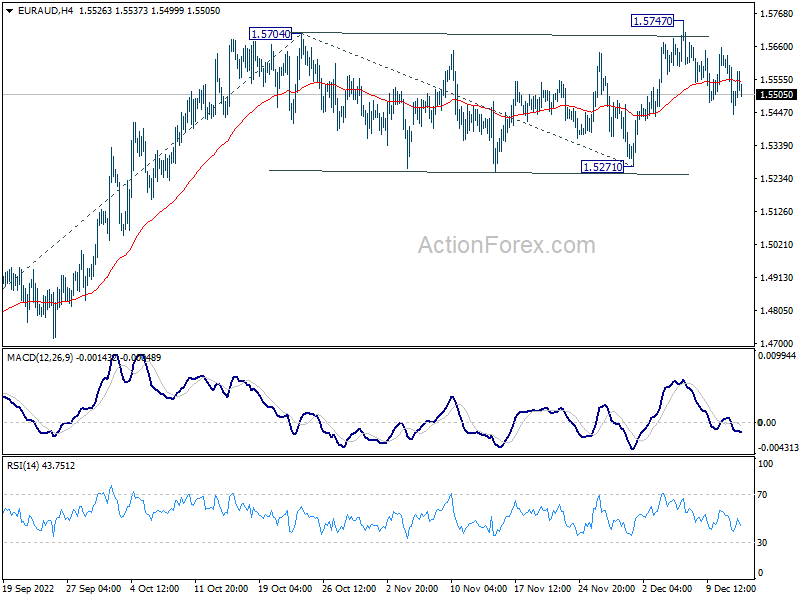
In the bigger picture, as long as 1.5271 support holds, rise from 1.4281 medium term bottom is expected to continue to 1.6434 key resistance next. However, firm break of 1.5271 will argue that such rebound has completed, and keep medium term outlook neutral at best. But in this case, more range trading should be seen above 1.4281 low first.