

Sample Category Title
AUD/USD Daily Report
Daily Pivots: (S1) 0.6766; (P) 0.6830; (R1) 0.6919; More...
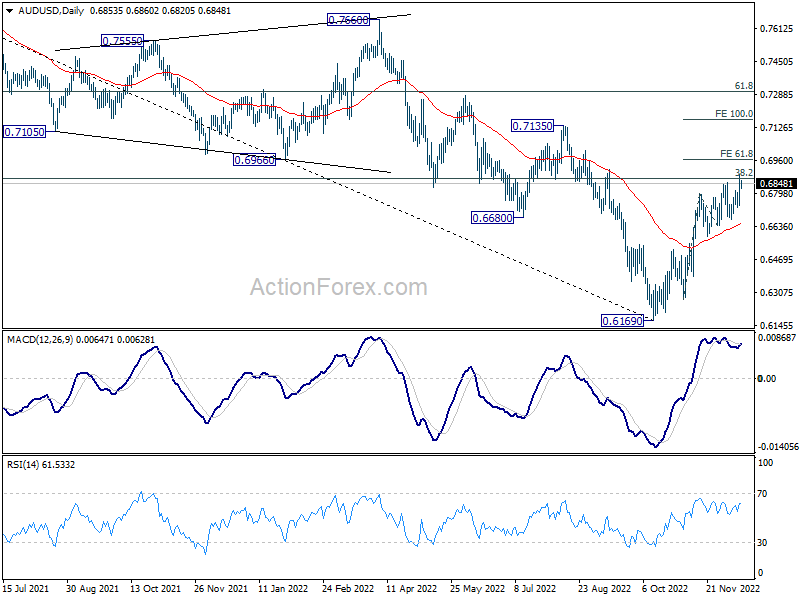
Intraday bias in AUD/USD stays on the upside at this point. Current rally should target 61.8% projection of 0.6271 to 0.6796 from 0.6641 at 0.6965. Firm break there will target 100% projection at 0.7166 next. For now, outlook will stay bullish as long as 0.6728 support holds, in case of retreat.
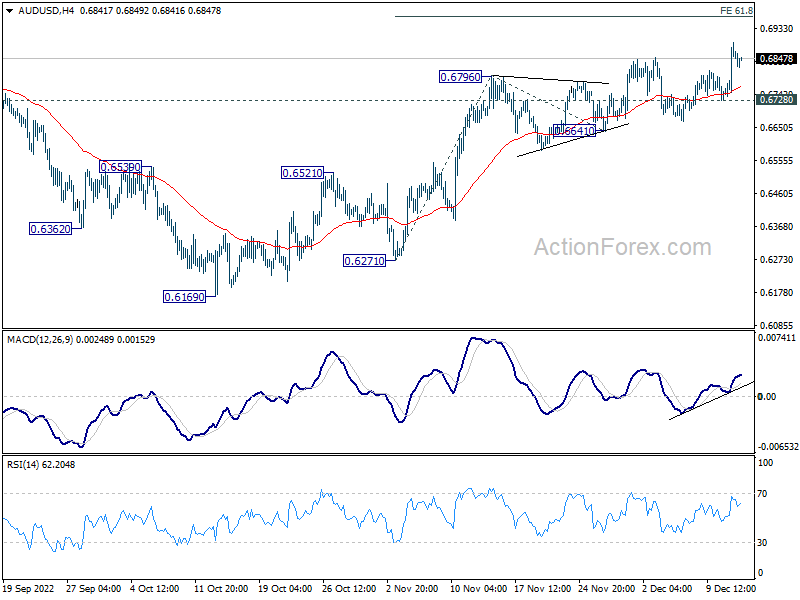
In the bigger picture, it's still unsure if price actions from 0.6169 medium term bottom are developing into a corrective pattern or trend rejection. Rejection by 38.2% retracement of 0.8006 to 0.6169 at 0.6871 will maintain medium term bearishness for another fall through 0.6169 at a later stage. However, firm break of 0.6871, and sustained trading above 55 week EMA (now at 0.6912) will raise the chance of the start of a bullish up trend.
Dollar Stabilizing after Selloff, FOMC Awaited
Dollar is recovering slightly today as focus turns to FOMC rate decision and, more importantly, new economic projections. While the greenback was sold off overnight following consumer inflation data, traders are still holding the larger bets for now. As for the week, Euro and Sterling are the strongest ones so far, followed by Yen. Commodity currencies are actually lagging behind even though though they're up against the greenback too.
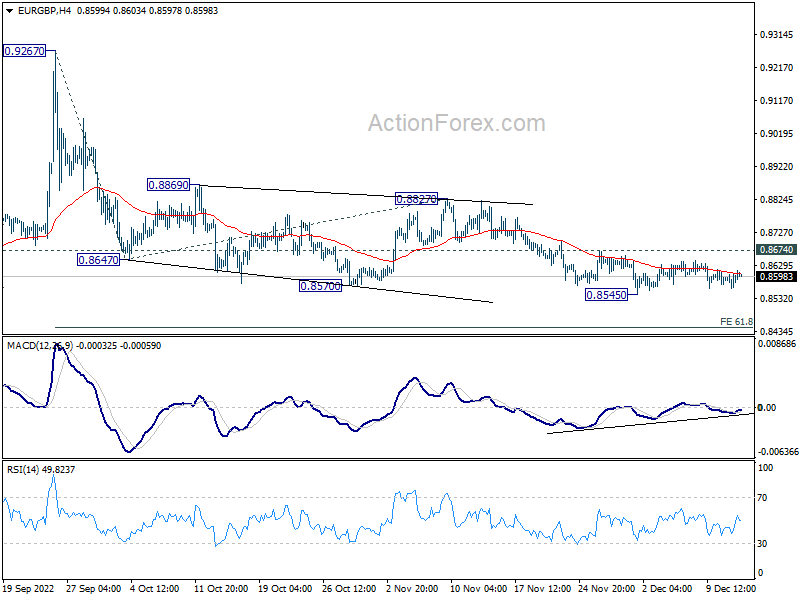
Technically, EUR/GBP could be a focus in European session. So far it's still bounded in range above 0.8545 support. Further decline is in favor with 0.8674 resistance intact. Break of 0.8545 will resume the decline from 0.9267 to 61.8% projection of 0.9267 to 0.8647 from 0.8827 at 0.8444. Yet, the bigger move might only come after BoE and ECB on Thursday.
In Asia, Nikkei rose 0.72%. Hong Kong HSI is up 0.68%. China Shanghai SSE is down -0.14%. Singapore Strait Times is up 0.45%. Japan 10-year JGB yield is up 0.0007 at 0.256. Overnight, DOW rose 0.30%. S&P 500 rose 0.73%. NASDAQ rose 1.01%.
Japan Tankan manufacturing mood deteriorated, but non-manufacturing upbeat
Japan Tankan Large Manufacturing Index dropped from 8 to 7 in Q4, above expectation of 6. Sentiment has been deteriorating for the fourth straight quarter, and hit the lowest level since Q1 2021. Large Manufacturing Outlook dropped from 9 to 6, matched expectations.
On the other hand, Large Non-Manufacturing Index rose from 14 to 19, above expectation of 17. That's the highest level since Q4 2019. Large Non-Manufacturing Outlook was unchanged at 11, below expectation of 16.
Large all industry capex dropped from 21.5% to 19.2%, above expectation of 18.4%.
Regarding inflation, 1-year ahead general prices expectations for all industries rose from 2.6% to 2.7%. 3-year ahead expectations rose from 2.1% to 2.2%. 5-year ahead expectations was unchanged at 2.0%.
RBNZ Hawkesby: We've seen very little impact of higher interest rates so far
RBNZ Deputy Governor Christian Hawkesby said in a speech that "we still think we have more work to do" to bring down inflation.
"We've seen very little impact of higher interest rates so far, outside of falling house prices and a cooling of the construction pipeline," he added.
"As inflation expectations have been rising, we also think that neutral interest rates have drifted higher, meaning that the OCR needs to be higher than otherwise before monetary policy is really restricting the demand side of the economy," he said.
Hawkesby pointed to November projections that the OCR would peak around 5.50%. But he noted, "25 years as an economist has taught me that the only certainty is that our forecasts won't be exactly right. There are always shocks and unexpected developments that will evolve the story."
FOMC preview: All about dot plots and 5%
Fed is widely expected to slow down the pace of rate hike today, and raise federal funds rate by 50bps to 4.25-4.50%. The main focus is on the new economic projections in particular the dot plots. Questions are where the terminal rate of the current cycle would be, and how long would rate stay there.
Yesterday's CPI report showed further evidence that inflation is cooling, rather than plateauing, and in a quicker manner than expected. Currently markets are expecting Fed to make two more 25bps rate hikes in Q1. That would eventually bring interest rate to 4.75-5.00% range, keep it below the 5% psychological level.
Here are some previews:
- FOMC Meeting Preview: 50bps Hike Likely, But Will the 2023 Dots Rise above 5%?
- Fed Decision and US Inflation Stats to Decide Dollar's Fate
- Fed Preview – Tightening Pressure Persists into 2023
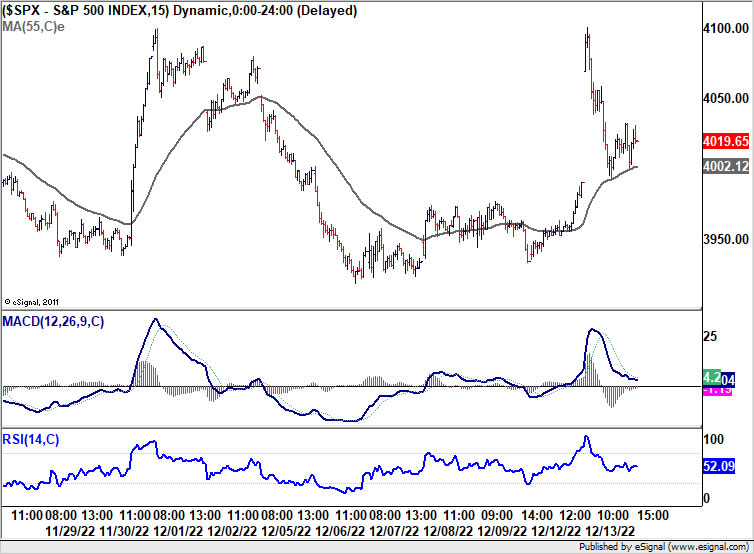
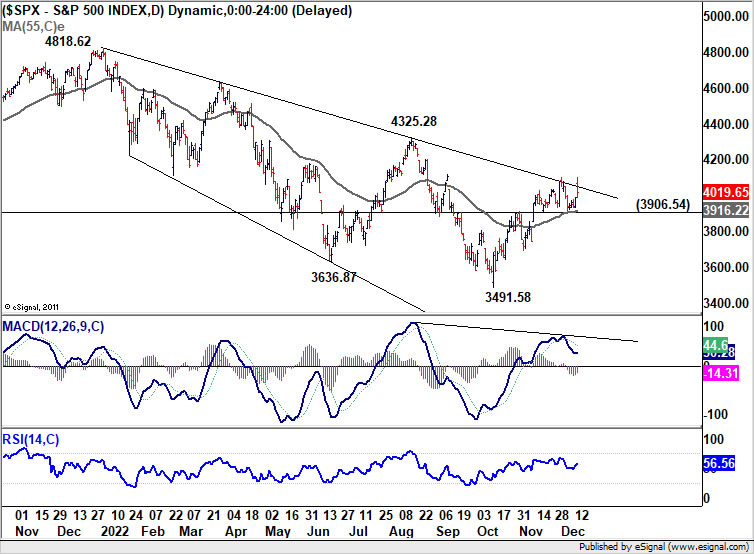
Yesterday's post-CPI reactions in the markets were clearly indecisive. S&P 500 spiked higher to 4100.96 but that pared back much of the gains to close just 0.73% higher at 4019.65. Today's reactions could be bearish if Fed's dot plots indicate that interest way will peak above 5%. Break of 3906.54 support will trigger near term bearish reversal in SPX. Nevertheless, another rally through yesterday's high should push SPX further towards 4325.58 resistance and end the year on a high note.
Elsewhere
UK will release CPI data today while Swiss will release PPI. Eurozone industrial production will also be featured. Later in the day, Canada manufacturing sales and US import prices will also be published.
AUD/USD Daily Report
Daily Pivots: (S1) 0.6766; (P) 0.6830; (R1) 0.6919; More...
Intraday bias in AUD/USD stays on the upside at this point. Current rally should target 61.8% projection of 0.6271 to 0.6796 from 0.6641 at 0.6965. Firm break there will target 100% projection at 0.7166 next. For now, outlook will stay bullish as long as 0.6728 support holds, in case of retreat.
In the bigger picture, it's still unsure if price actions from 0.6169 medium term bottom are developing into a corrective pattern or trend rejection. Rejection by 38.2% retracement of 0.8006 to 0.6169 at 0.6871 will maintain medium term bearishness for another fall through 0.6169 at a later stage. However, firm break of 0.6871, and sustained trading above 55 week EMA (now at 0.6912) will raise the chance of the start of a bullish up trend.
Economic Indicators Update
| GMT | Ccy | Events | Actual | Forecast | Previous | Revised |
|---|---|---|---|---|---|---|
| 21:45 | NZD | Current Account (NZD) Q3 | -10.21B | -10.20B | -5.22B | -5.42B |
| 23:50 | JPY | Tankan Large Manufacturing Index Q4 | 7 | 6 | 8 | |
| 23:50 | JPY | Tankan Large Manufacturing Outlook Q4 | 6 | 6 | 9 | |
| 23:50 | JPY | Tankan Non - Manufacturing Index Q4 | 19 | 17 | 14 | |
| 23:50 | JPY | Tankan Non - Manufacturing Outlook Q4 | 11 | 16 | 11 | |
| 23:50 | JPY | Tankan Large All Industry Capex Q4 | 19.20% | 18.40% | 21.50% | |
| 23:50 | JPY | Machinery Orders M/M Oct | 5.40% | -1.00% | -4.60% | |
| 04:30 | JPY | Industrial Production M/M Oct F | -3.20% | -2.60% | -2.60% | |
| 07:00 | GBP | CPI M/M Nov | 1.20% | 2.00% | ||
| 07:00 | GBP | CPI Y/Y Nov | 11.50% | 11.10% | ||
| 07:00 | GBP | Core CPI Y/Y Nov | 6.60% | 6.50% | ||
| 07:00 | GBP | RPI M/M Nov | 1.50% | 2.50% | ||
| 07:00 | GBP | RPI Y/Y Nov | 14.30% | 14.20% | ||
| 07:30 | CHF | Producer and Import Prices M/M Nov | 0.40% | 0.00% | ||
| 07:30 | CHF | Producer and Import Prices Y/Y Nov | 4.80% | 4.90% | ||
| 10:00 | EUR | Eurozone Industrial Production M/M Oct | 0.00% | 0.90% | ||
| 13:30 | CAD | Manufacturing Sales M/M Oct | -0.20% | 0.00% | ||
| 13:30 | USD | Import Price Index M/M Nov | 0.20% | -0.20% | ||
| 15:30 | USD | Crude Oil Inventories | -3.4M | -5.2M | ||
| 19:00 | USD | Fed Interest Rate Decision | 4.50% | 4.00% | ||
| 19:30 | USD | FOMC Press Conference |
Technical Outlook and Review
USD/JPY:
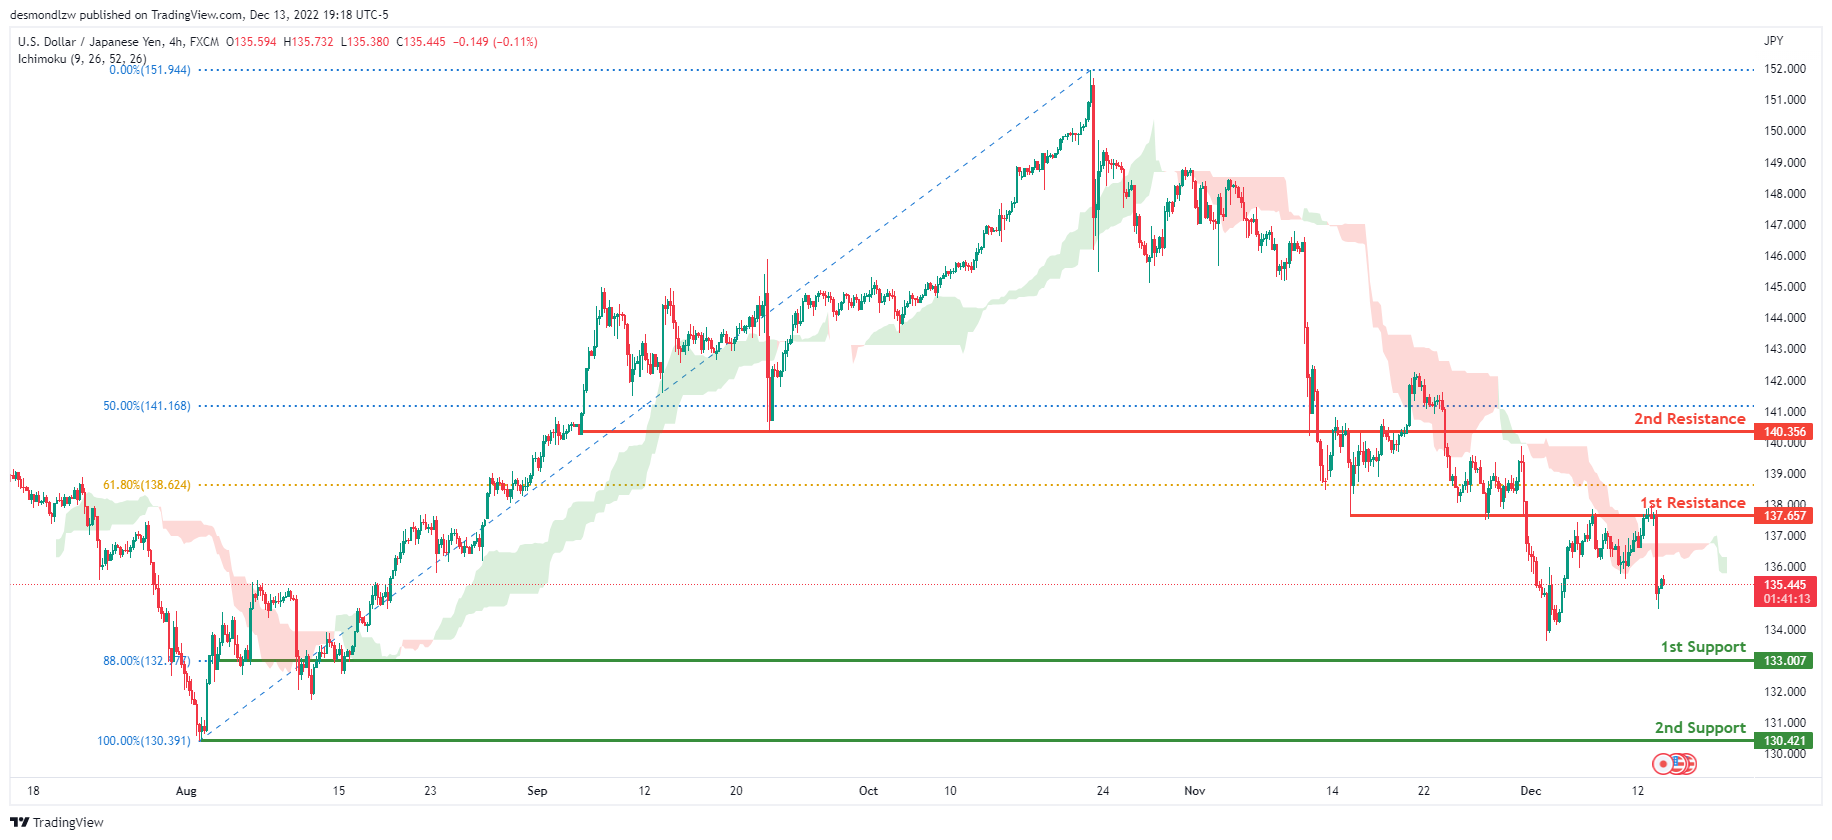
The current general bias for USDJPY on the H4 chart is bearish. To add confluence to this, the price is crossing under the Ichimoku cloud which indicates a bearish market. If the bearish momentum continues, expect USDJPY to continue heading towards the 1st support at 133.007 where the 88% Fibonacci line is. In an alternative scenario, price could head back up to retest the 1st resistance line at 137.657, where the 61.8% Fibonacci line and previous low are located.
Areas of consideration:
- H4 time frame, 1st resistance at 137.657
- H4 time frame, 1st support at 133.007
DXY:
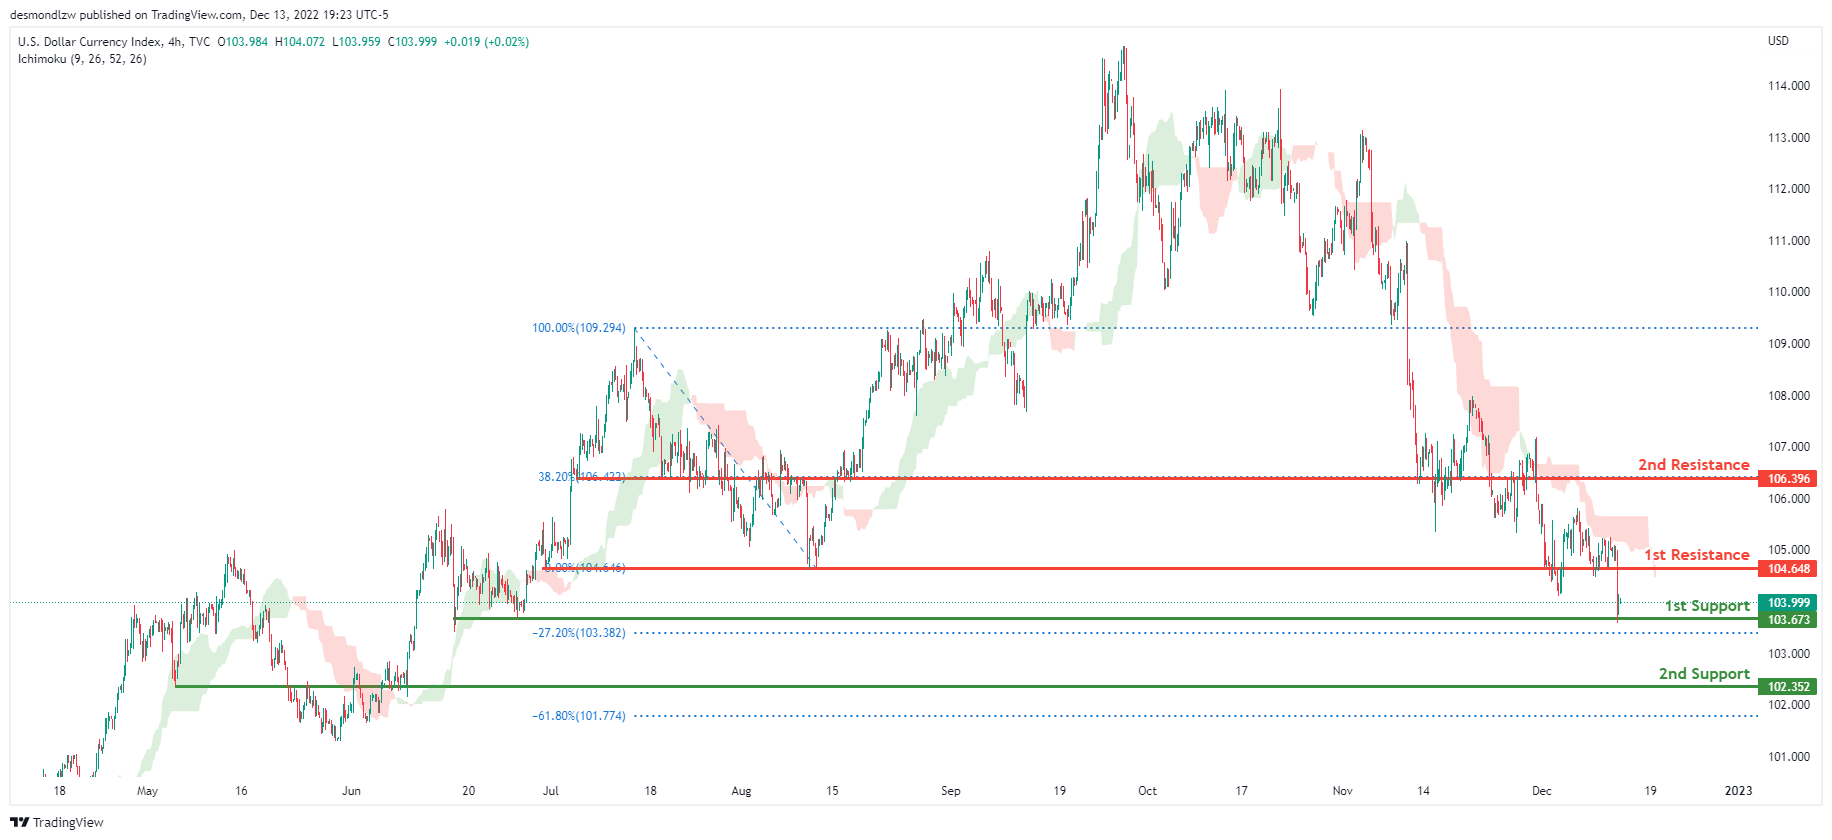
On the H4 chart, the overall bias for DXY is bearish. To add confluence to this, the price is below the Ichimoku cloud which indicates a bearish market. If this bearish momentum continues, expect the price to continue heading towards the 1st support line at 103.673, where the -27.2% Fibonacci expansion line is. In an alternative scenario, price could head back up and retest the 1st resistance line resistance at 104.648, where the previous swing low is.
Areas of consideration:
- H4 time frame, 1st resistance at 104.648
- H4 time frame, 1st support at 103.673
EUR/USD:
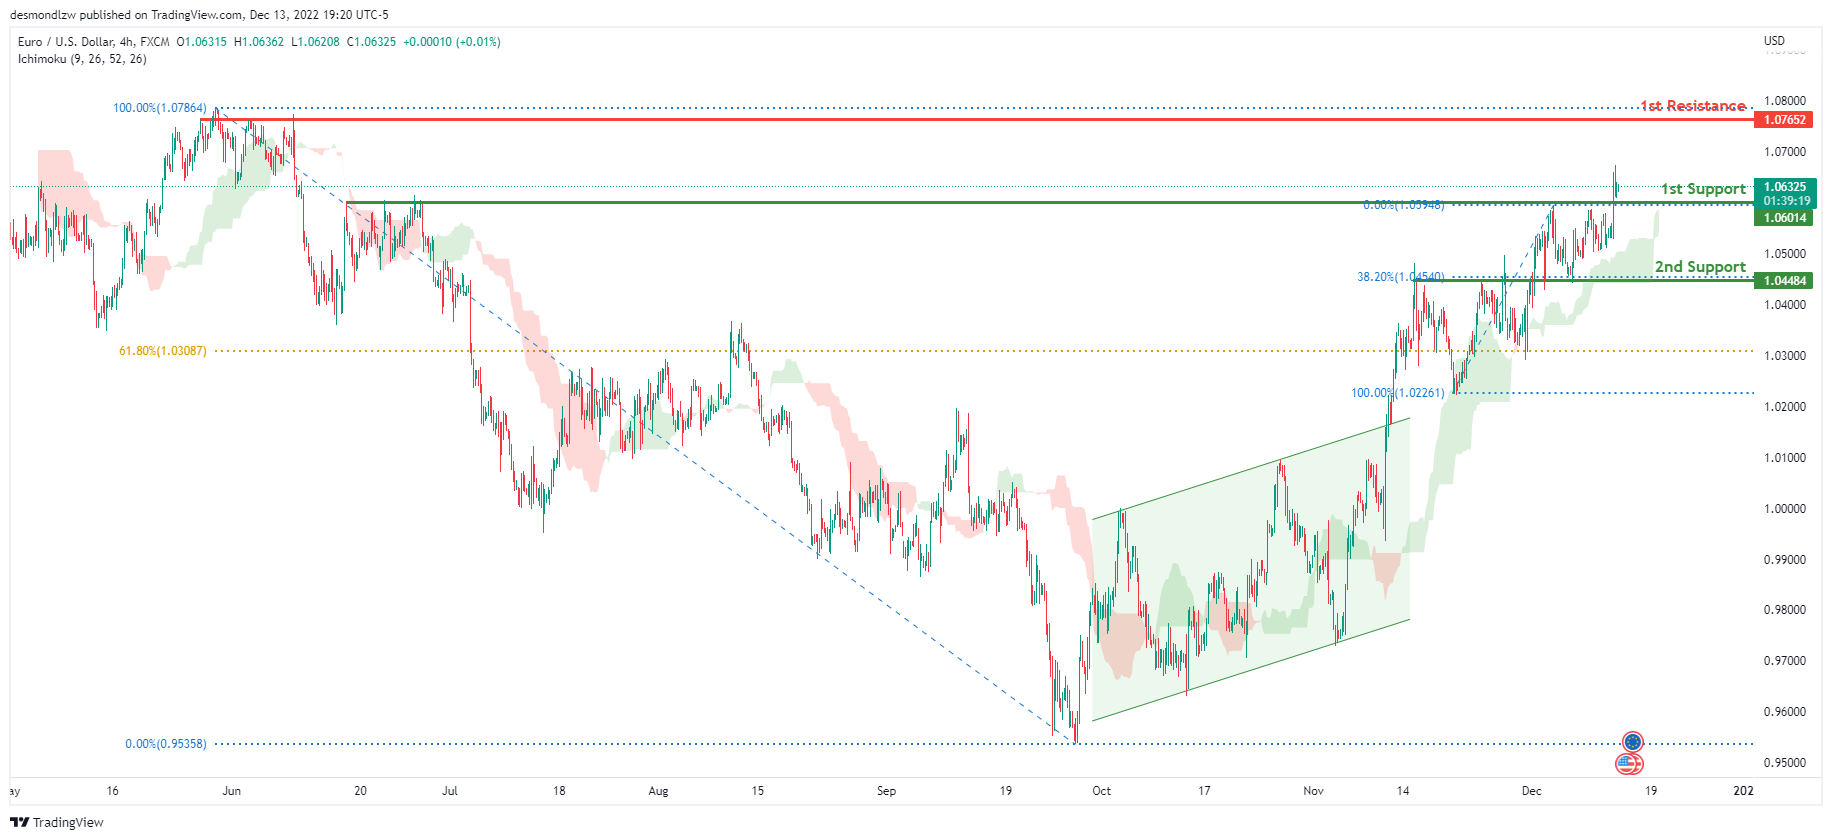
Looking at the H4 chart, my overall bias for EURUSD is bullish due to the current price being above the Ichimoku cloud, indicating a bullish market. To add confluence to this bias, price has also broken above the ascending bullish channel. If this bullish momentum continues, expect the price to possibly head towards the 1st resistance at 1.07652, where the previous swing high is. In an alternate scenario, price could possibly head back down to retest the 1st support level at 1.06014, where the previous swing high and 78.6% Fibonacci line are located.
Areas of consideration :
- H4 1st resistance at 1.07652
- H4 1st support at 1.06014
GBP/USD:
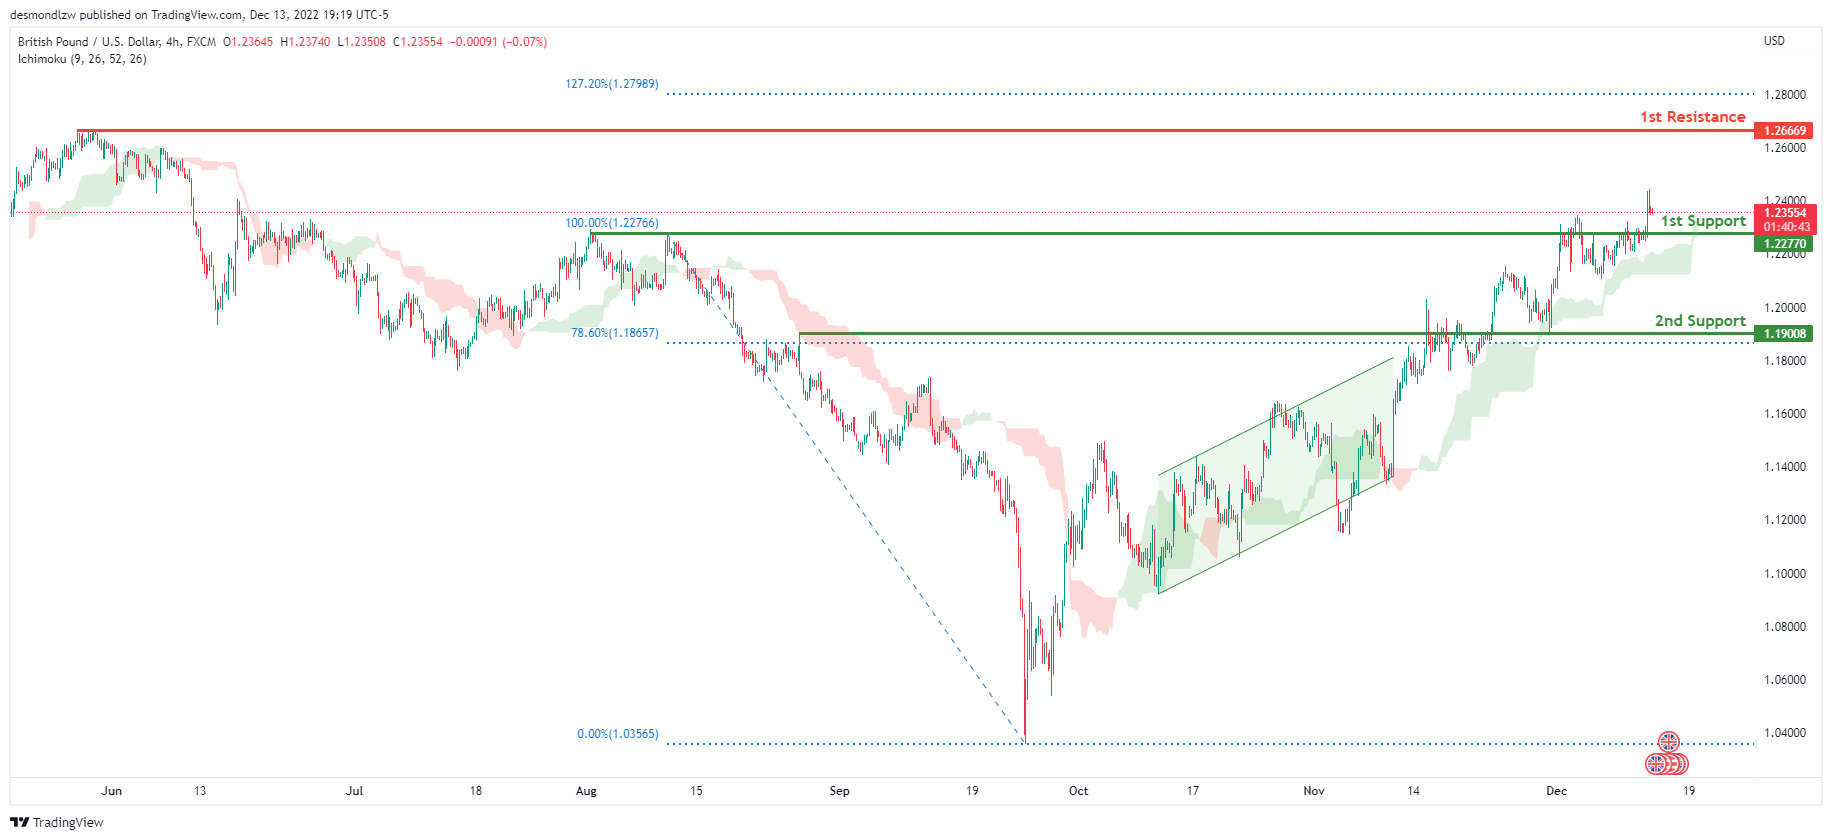
Looking at the H4 chart, my overall bias for GBPUSD is bullish due to the current price being above the Ichimoku cloud, indicating a bullish market. Expecting price to head back up to possibly continue heading towards the 1st resistance at 1.26669, where the previous swing high is. In an alternative scenario, price could possibly head back down to retest the 1st support at 1.22770, where the previous swing high is.
Areas of consideration:
- H4 1st resistance at 1.26669
- H4 1st support at 1.22770
USD/CHF:
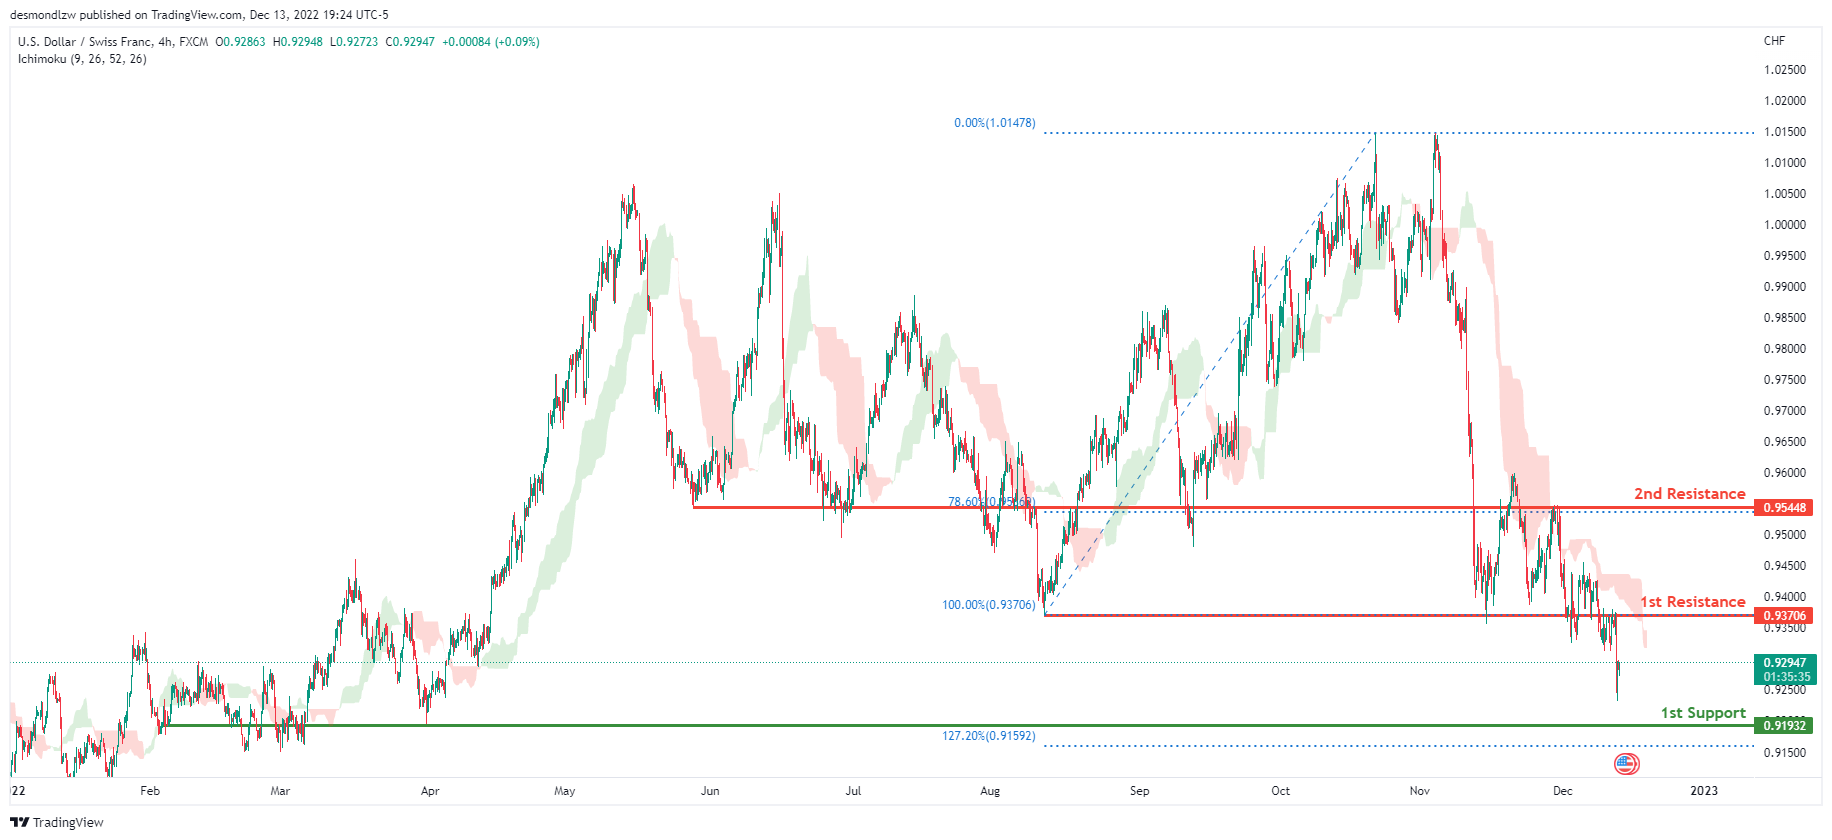
The overall bias for USDCHF on the H4 chart is bearish. In addition, the price is below the Ichimoku cloud, indicating a bearish market. If the current bearish trend continues, expect the price to head back down towards the 1st support line at 0.91932, where the previous swing low and 12.72% Fibonacci extension line is . In an alternative scenario, price could possibly head up towards the 1st resistance at 0.93706, where the previous swing low is .
Areas of consideration
- H4 1st support at 0.91932
- H4 1st resistance at 0.93706
XAU/USD (GOLD):
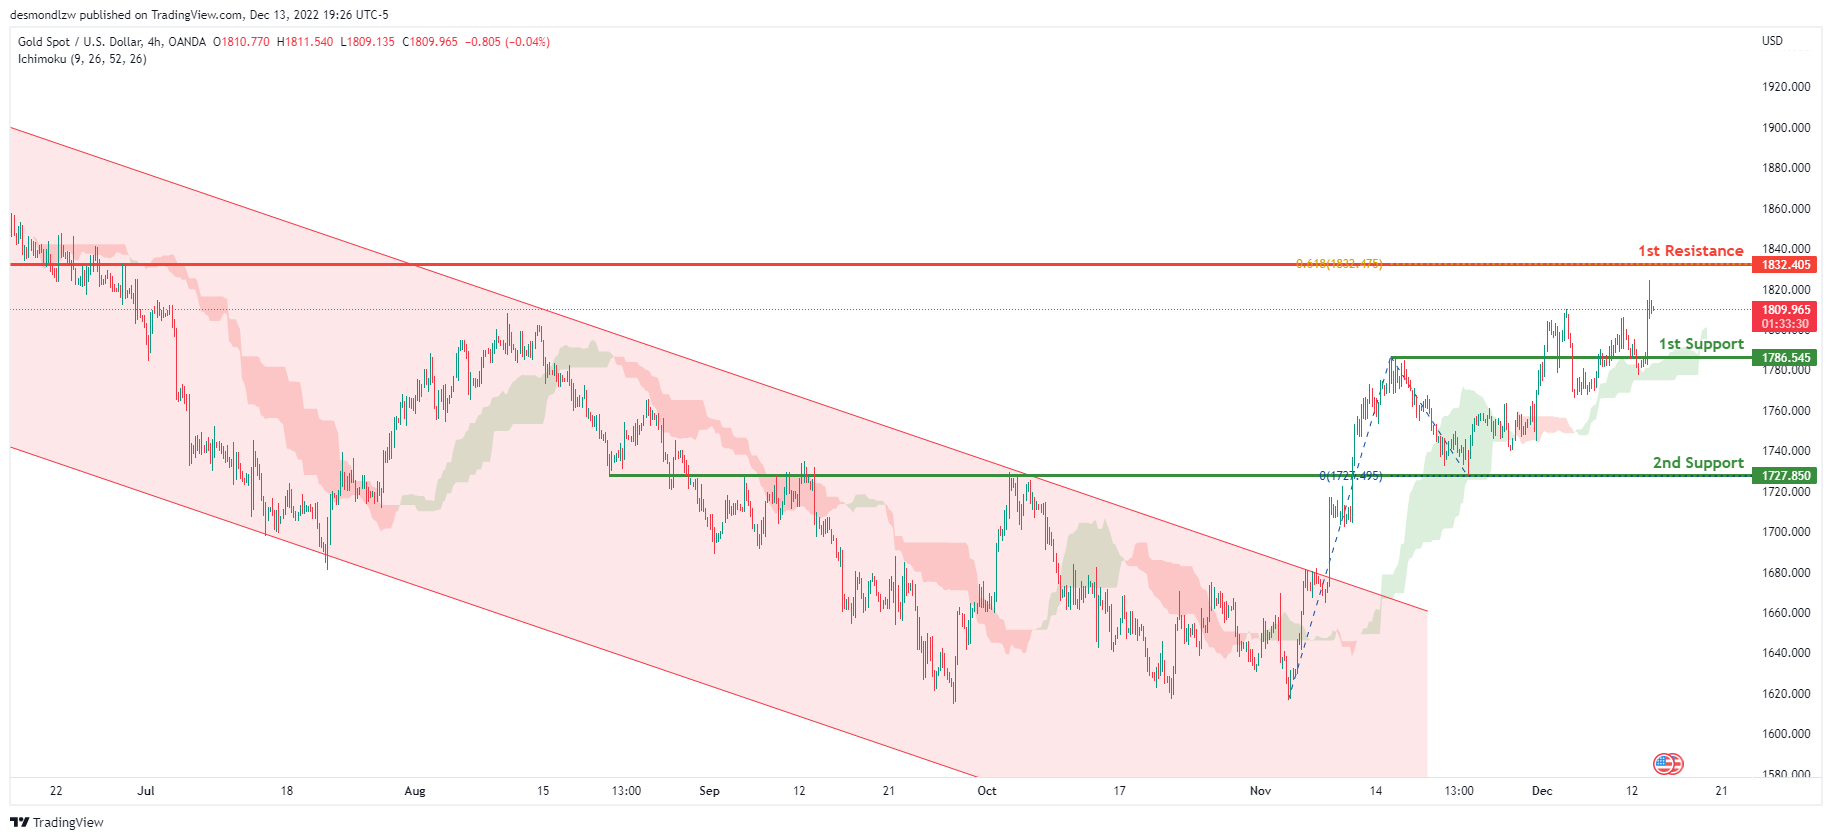
Looking at the H4 chart, my overall bias for XAUUSD is bullish due to the current price crossing above the Ichimoku cloud, indicating a bullish market. If this bullish momentum continues, expect the price to possibly continue heading towards the 1st resistance at 1832.405, where the 61.8% Fibonacci projection line is. In an alternate scenario, price could possibly head back down towards the 1st support level at 1786.545, where the previous swing high is located
Areas of consideration:
- H4 time frame, 1st resistance at 1832.405
- H4 time frame, 1st support at 1786.545
AUD/USD:
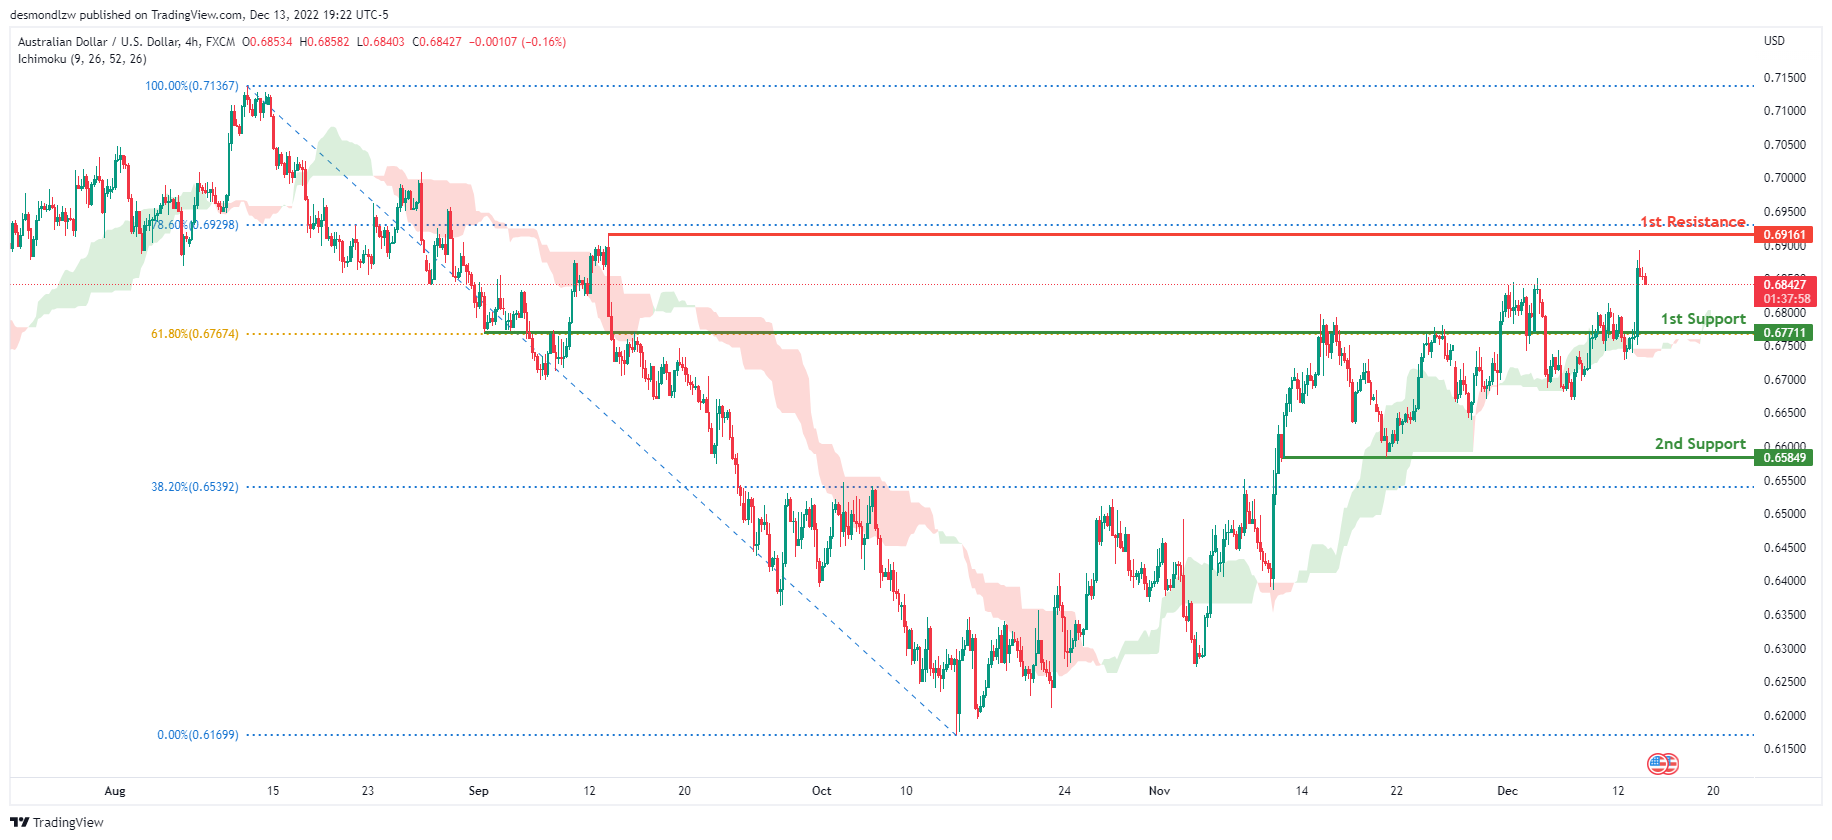
Looking at the H4 chart, my overall bias for AUDUSD is bullish due to the current price being above the Ichimoku cloud, indicating a bullish market. If this bullish momentum continues, expect the price to continue heading towards the 1st resistance at 0.69161, where the 78.6% Fibonacci line is. In an alternative scenario, price could possibly head back down towards the 1st support line at 0.67711, where the 61.8% Fibonacci line is
Areas of consideration
- H4, 1st resistance at 0.69161
- H4, 1st support at 0.67711
NZD/USD:
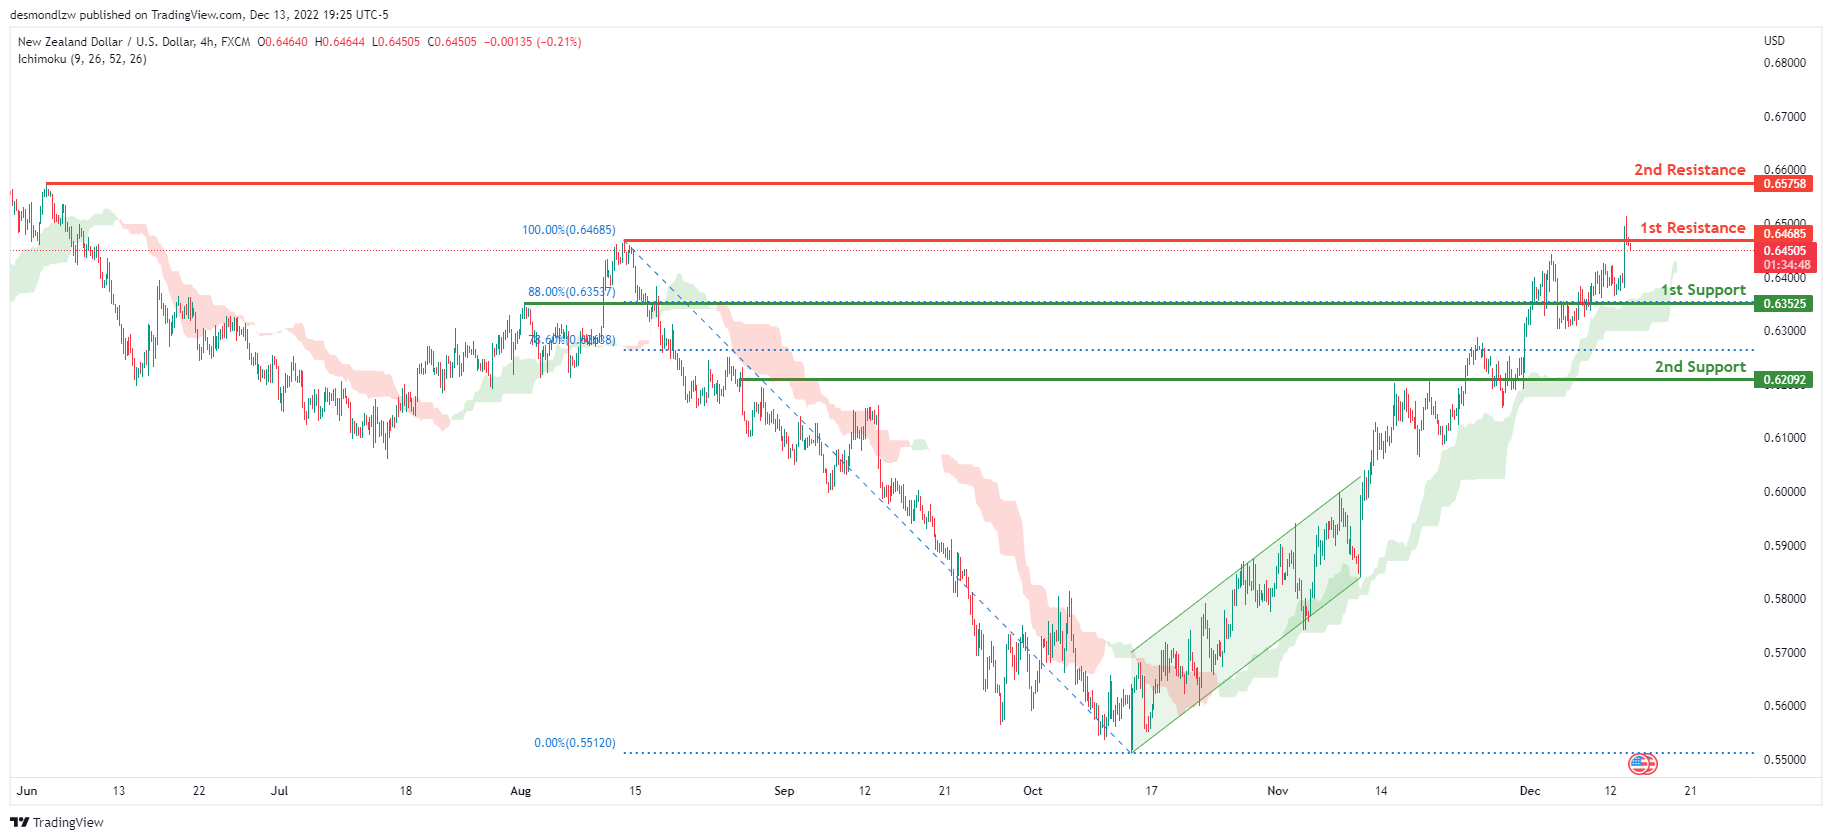
Looking at the H4 chart, my overall bias for NZDUSD is bullish due to the current price being above the Ichimoku cloud, indicating a bullish market.
To add confluence to this bias, price has broken out of the ascending channel. If this bullish momentum continues, expect the price to possibly break the 1st resistance line at 0.64685, where the previous swing high is before heading towards the 2nd resistance at 0.65758, where the previous swing high is. Alternatively, the price may head back down towards the 1st support at 0.63525, where the 88% Fibonacci line is.
Areas of consideration:
- H4 time frame, 1st resistance at 0.64685
- H4 time frame, 2nd resistance at 0.65758
- H4 time frame, 1st support at 0.63525
USD/CAD:
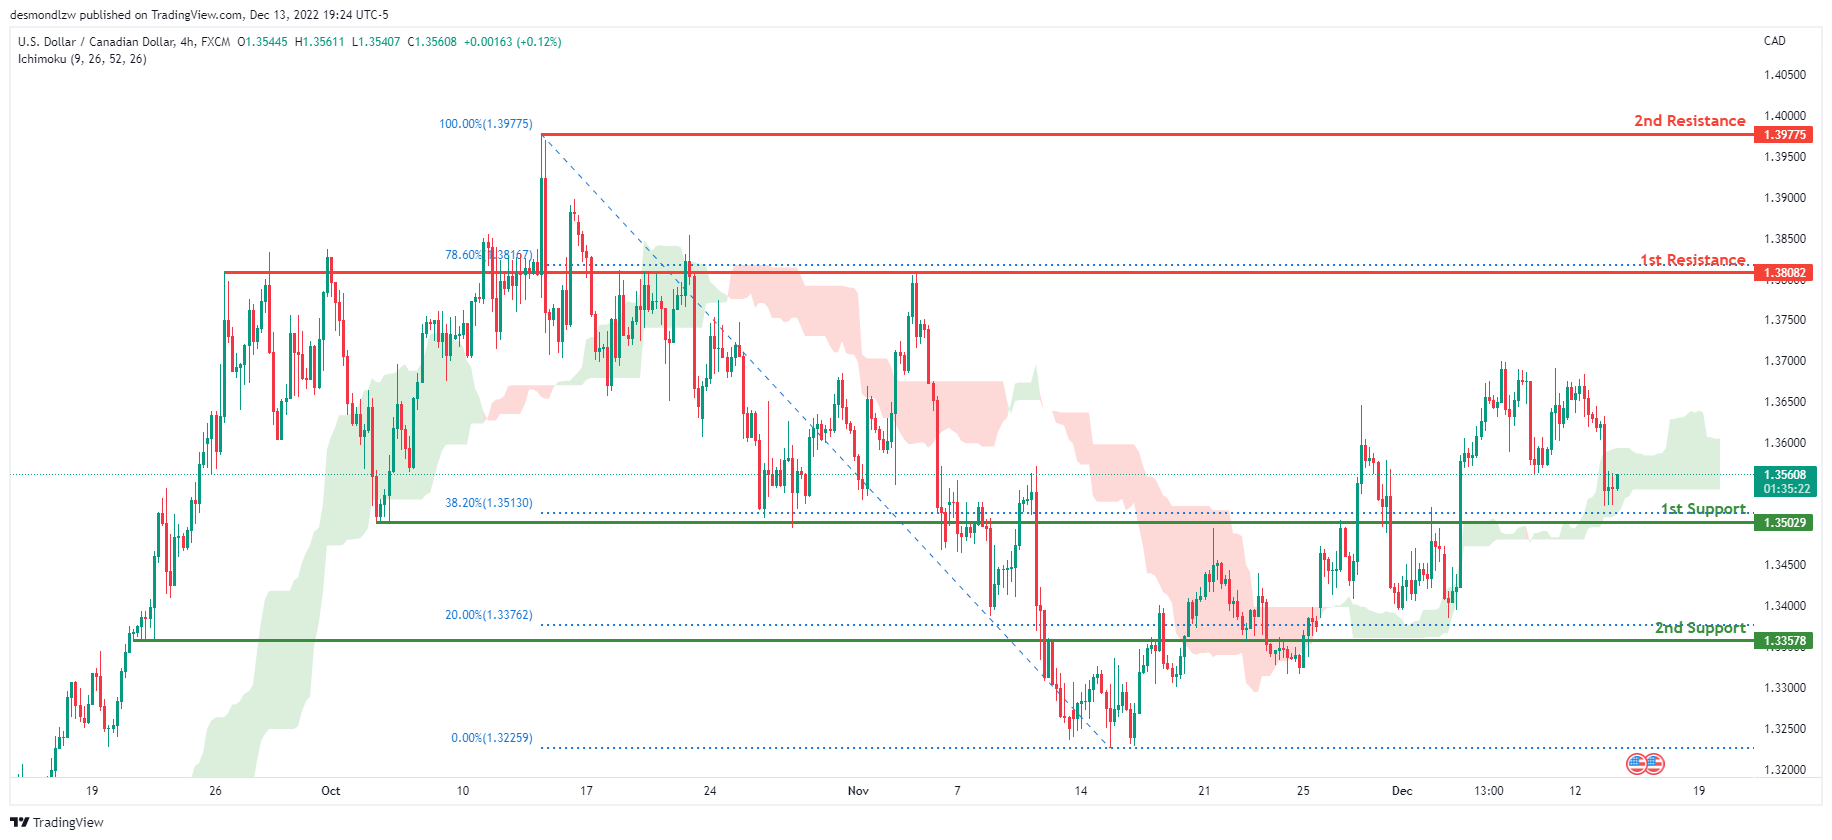
On the H4 chart, the overall bias for USDCAD is bullish. To add confluence to this, the price is crossing above the Ichimoku cloud which indicates a bullish market. If this bullish momentum continues, expect the price to head towards 1st resistance line at 1.38082, where the 78.6% Fibonacci line is. In an alternative scenario, price could head back down to retest the 1st support at 1.35029, where the 38.2% Fibonacci line is.
Areas of consideration:
- H4 time frame, 1st resistance at 1.38082
- H4 time frame, 2nd resistance at 1.39775
- H4 time frame, 1st support at 1.35029
OIL:
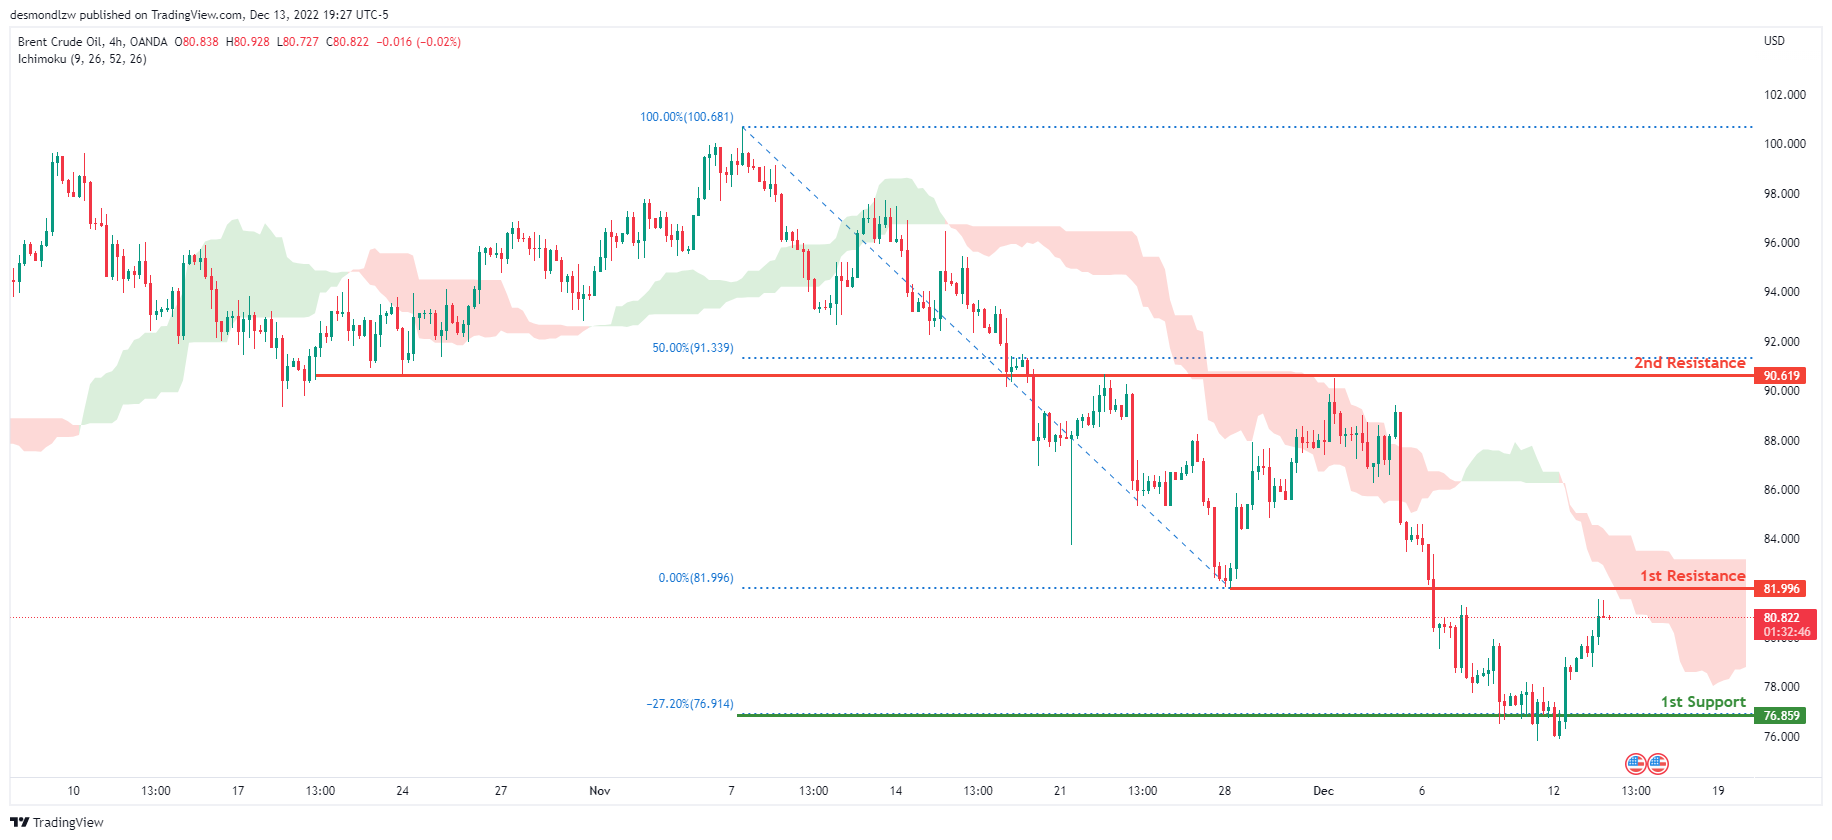
Looking at the H4 chart, my overall bias for BCOUSD is bearish due to the current price being below the Ichimoku cloud, indicating a bearish market. If this bearish momentum continues, expect price to possibly break the 1st support line at 76.859, where the -27.2% Fibonacci expansion line is, before heading towards the 2nd support at 70.430, where the -27.2% Fibonacci expansion line is. In an alternate scenario, price could possibly head back up to retest the 1st resistance line at 81.996, where the previous low is located.
Areas of consideration:
- H4 time frame, 1st resistance at 81.996
- H4 time frame, 1st support at 76.859
- H4 time frame, 2nd support at 70.430
Dow Jones Industrial Average:
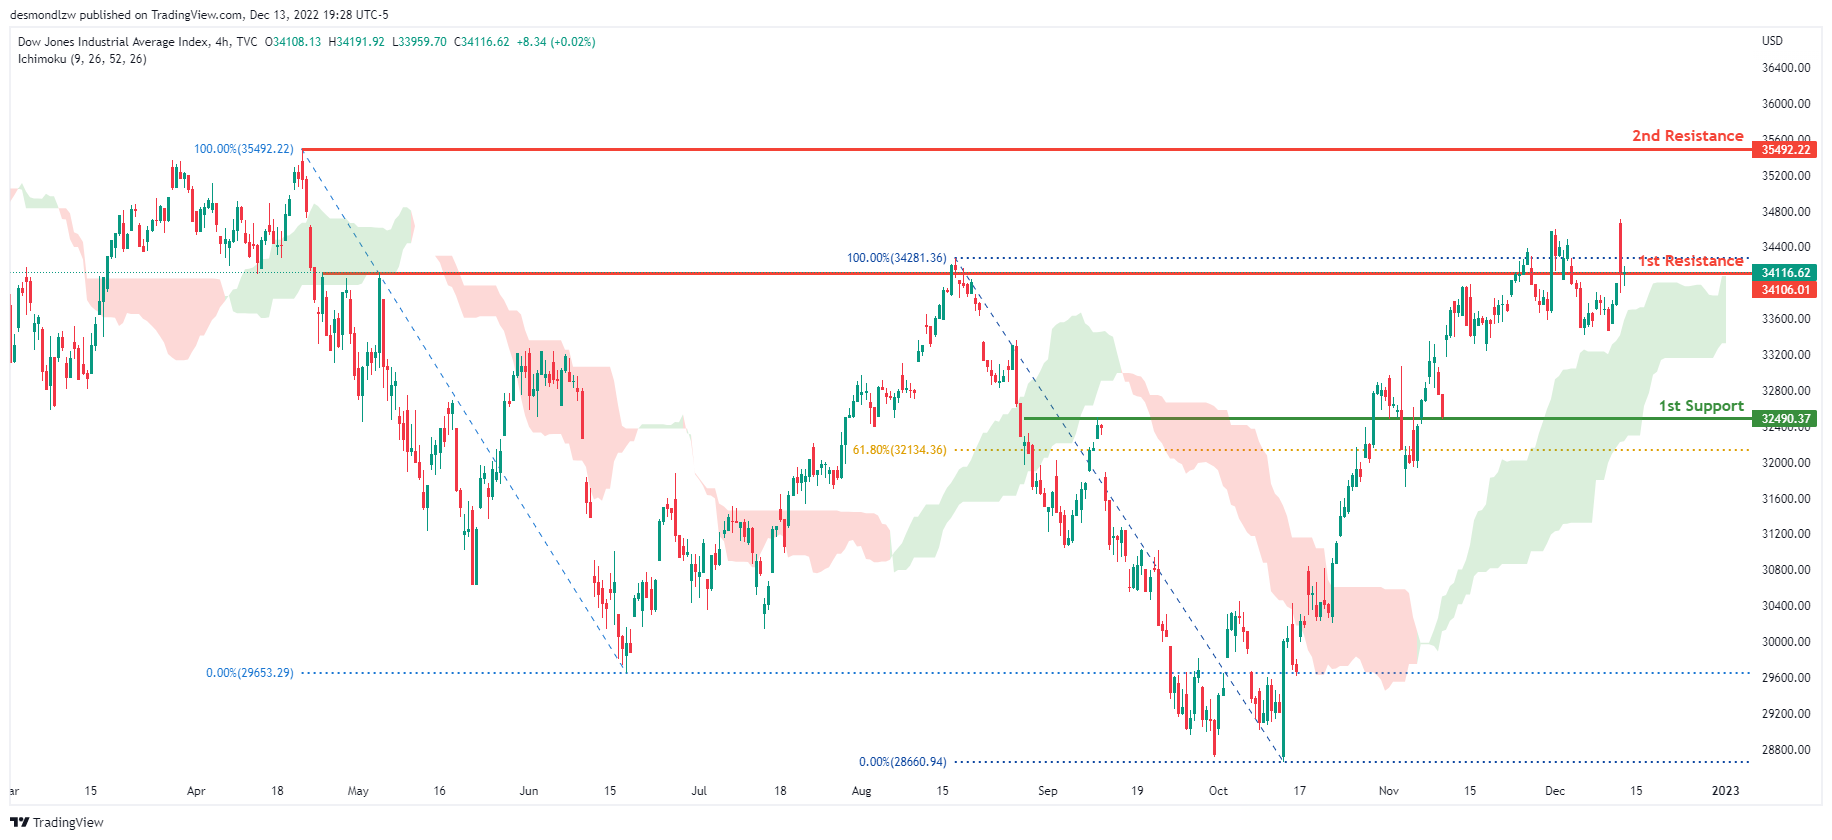
On the H4 chart, the overall bias for DJI is bullish. To add confluence to this, the price is above the Ichimoku cloud which indicates a bullish market. If this bullish momentum continues, expect the price to possibly break the 1st resistance line at 34106.01, where the previous swing high is before heading towards the 2nd resistance line at 35492.22, where the previous swing high is. In an alternative scenario, price could head back down towards the 1st support at 32490.37, where the 61.8% Fibonacci line is.
Areas of consideration:
- H4 time frame, 1st support at 32490.37
- H4 time frame, 1st Resistance at 34106.01
- H4 time frame, 2nd Resistance at 35492.22
DAX:
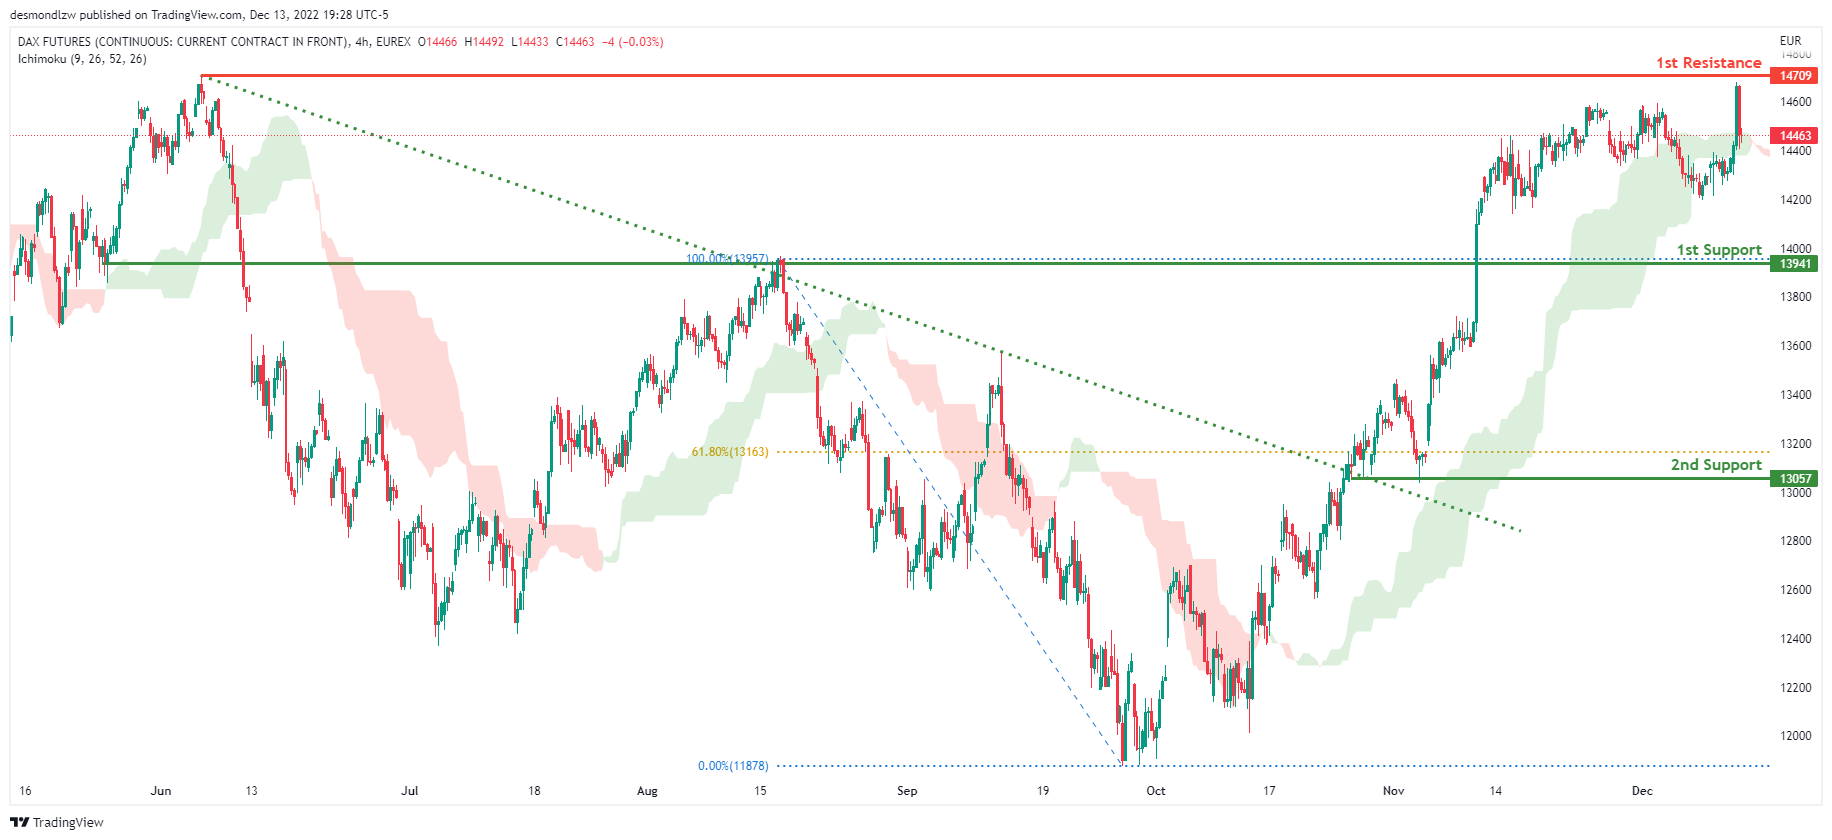
The H4 chart shows a bullish bias, with price breaking through the descending trendline and rising above the Ichimoku cloud. Price is expected to maintain its bullish momentum and rise to the first resistance level at 14709, where the previous swing high is located. Alternatively, the price could fall to the first support level at 13941, where the previous swing high was.
Areas of consideration:
- H4 time frame, 1st resistance is at 14709
- H4 time frame, 1st support is at 13941
ETHUSD:
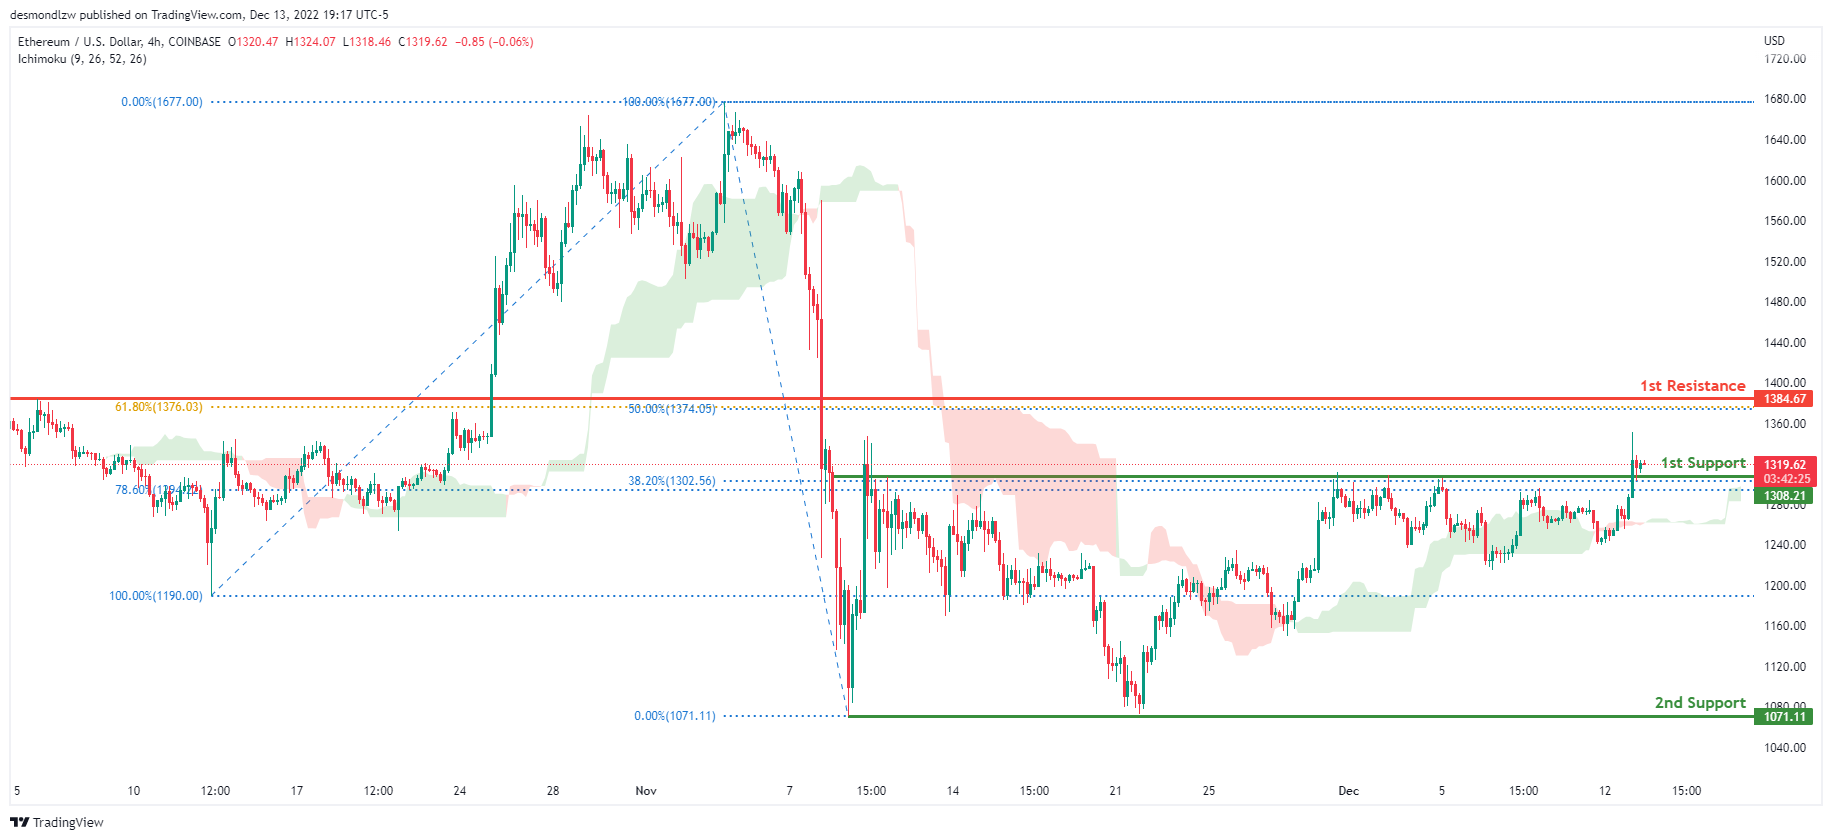
Looking at the H4 chart, my overall bias for ETHUSD is bullish due to the current price being above the Ichimoku cloud, indicating a bullish market. Expecting price to possibly head towards the 1st resistance at 1384.67, where the 50% and 61.8% Fibonacci lines are. In an alternative scenario, price could retest the 1st support at 1308.21, where the 38.2% and 78.6% Fibonacci lines are.
Areas of consideration:
- H4 time frame, 1st resistance of 1384.67
- H4 time frame, 1st support at 1308.21
BTCUSD:
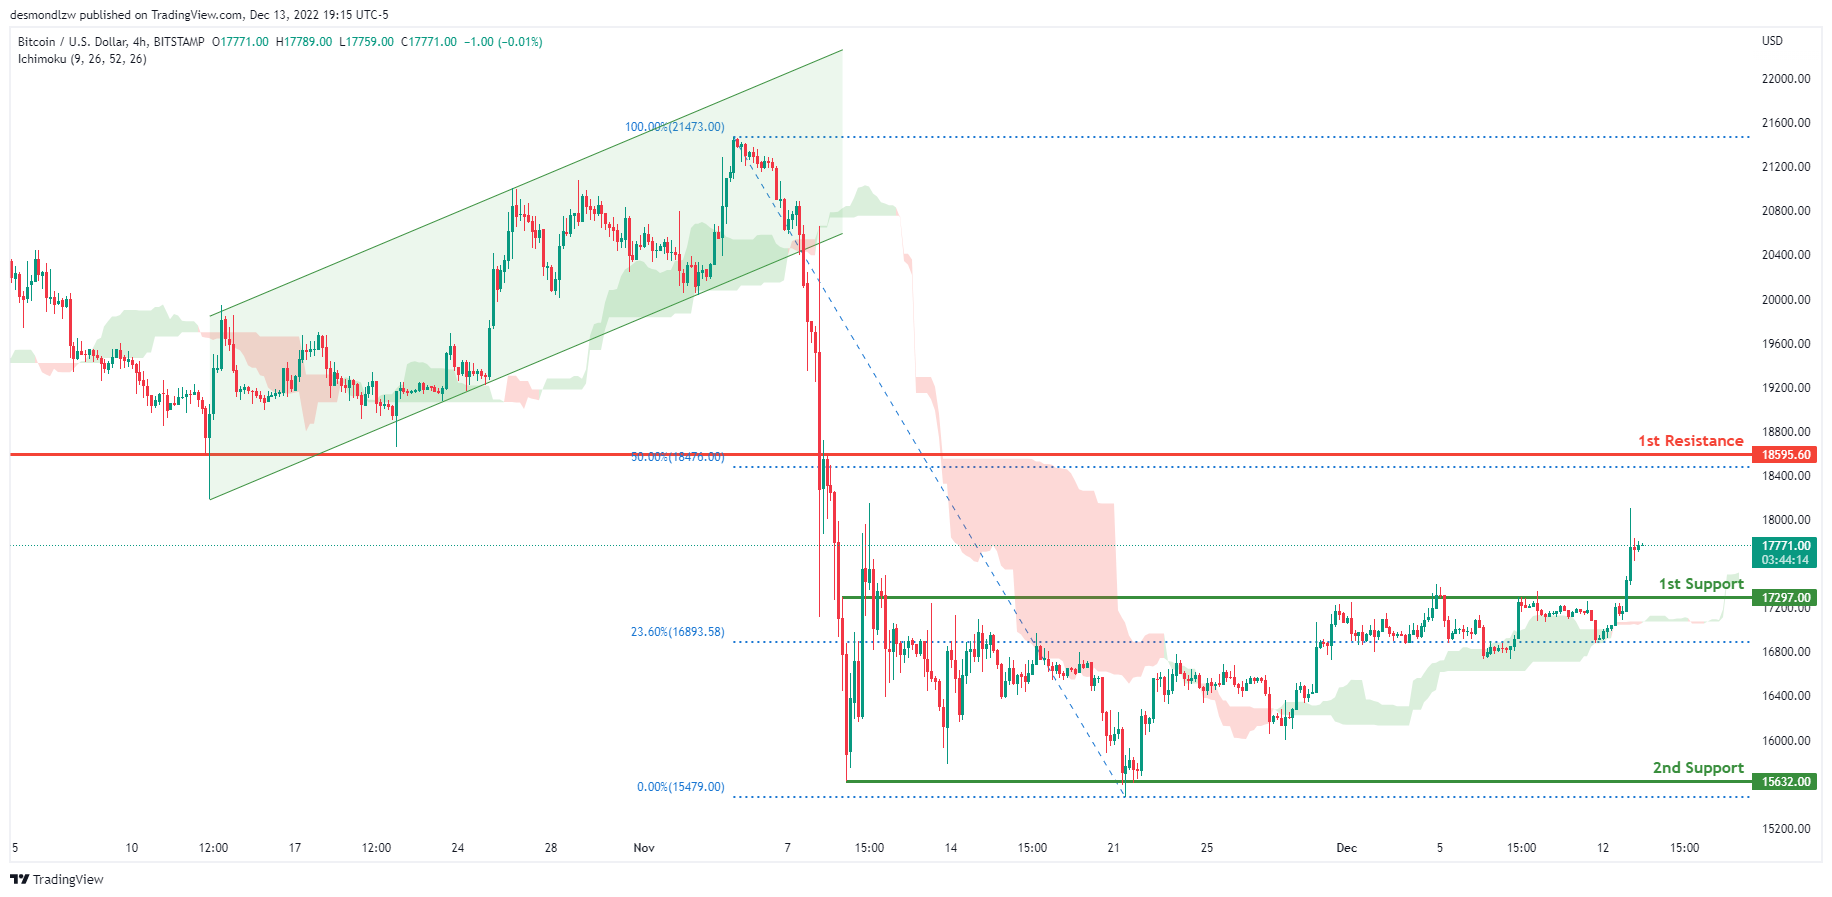
Looking at the H4 chart, my overall bias for BTCUSD is bullish due to the current price being above the Ichimoku cloud, indicating a bullish market. Expecting price to possibly head up towards the 1st resistance at 18173.33, where the previous swing low is and 50% Fibonacci line are. In an alternative scenario, price could possibly head back down towards the 1st support at 17297.00, where the 23.6% Fibonacci line is.
Areas of consideration:
- H4 time frame, 1st resistance 18173.33
- H4 time frame, 1st support at 17297.00
S&P 500:
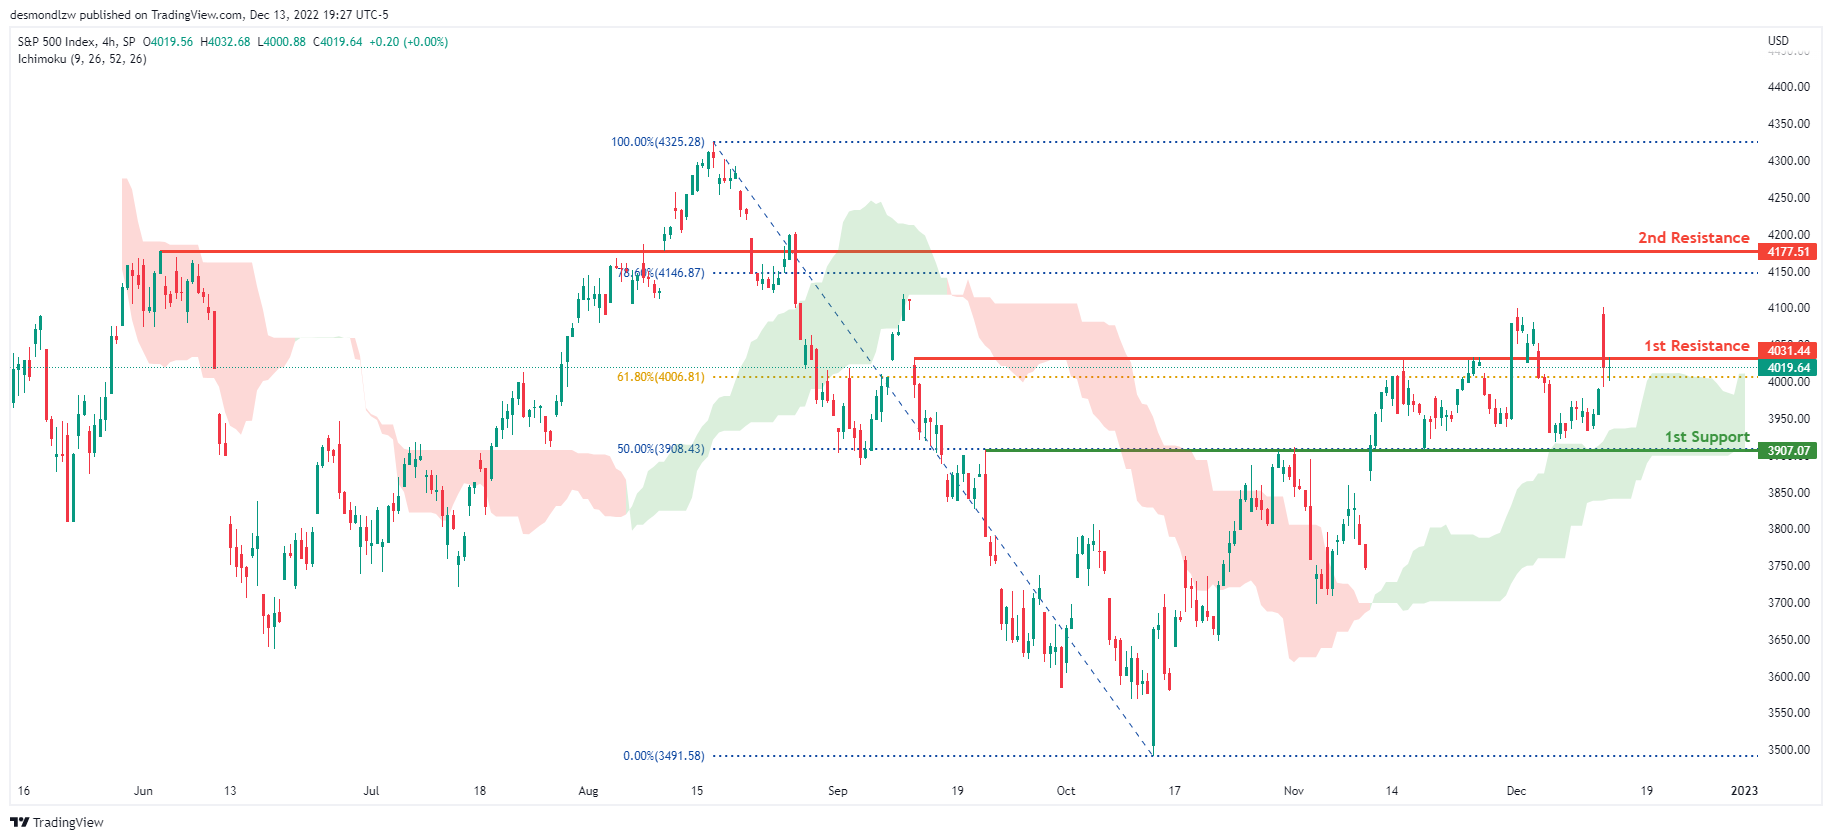
The overall bias for the S&500 on the H4 chart is bullish, with prices above the Ichimoku cloud. If the bullish momentum continues, the expected price to possibly break the 1st resistance line is at 4031.44, where the 61.8% Fibonacci line is located before heading towards the 2nd resistance line at 4177.51, where the 78.6% Fibonacci line is. In an alternate scenario, price could return to the 1st support line at 3907.07, where the 50% Fibonacci line is located.
Areas of consideration:
- H4 time frame, 1st support at 3907.07
- H4 time frame, 1st resistance at 4031.44
- H4 time frame, 2nd resistance at 4177.51
FOMC preview: All about dot plots and 5%
Fed is widely expected to slow down the pace of rate hike today, and raise federal funds rate by 50bps to 4.25-4.50%. The main focus is on the new economic projections in particular the dot plots. Questions are where the terminal rate of the current cycle would be, and how long would rate stay there.
Yesterday's CPI report showed further evidence that inflation is cooling, rather than plateauing, and in a quicker manner than expected. Currently markets are expecting Fed to make two more 25bps rate hikes in Q1. That would eventually bring interest rate to 4.75-5.00% range, keep it below the 5% psychological level.
Here are some previews:
- FOMC Meeting Preview: 50bps Hike Likely, But Will the 2023 Dots Rise above 5%?
- Fed Decision and US Inflation Stats to Decide Dollar's Fate
- Fed Preview – Tightening Pressure Persists into 2023
Yesterday's post-CPI reactions in the markets were clearly indecisive. S&P 500 spiked higher to 4100.96 but that pared back much of the gains to close just 0.73% higher at 4019.65. Today's reactions could be bearish if Fed's dot plots indicate that interest way will peak above 5%. Break of 3906.54 support will trigger near term bearish reversal in SPX. Nevertheless, another rally through yesterday's high should push SPX further towards 4325.58 resistance and end the year on a high note.
Japan Tankan manufacturing mood deteriorated, but non-manufacturing upbeat
Japan Tankan Large Manufacturing Index dropped from 8 to 7 in Q4, above expectation of 6. Sentiment has been deteriorating for the fourth straight quarter, and hit the lowest level since Q1 2021. Large Manufacturing Outlook dropped from 9 to 6, matched expectations.
On the other hand, Large Non-Manufacturing Index rose from 14 to 19, above expectation of 17. That's the highest level since Q4 2019. Large Non-Manufacturing Outlook was unchanged at 11, below expectation of 16.
Large all industry capex dropped from 21.5% to 19.2%, above expectation of 18.4%.
Regarding inflation, 1-year ahead general prices expectations for all industries rose from 2.6% to 2.7%. 3-year ahead expectations rose from 2.1% to 2.2%. 5-year ahead expectations was unchanged at 2.0%.
RBNZ Hawkesby: We’ve seen very little impact of higher interest rates so far
RBNZ Deputy Governor Christian Hawkesby said in a speech that "we still think we have more work to do" to bring down inflation.
"We've seen very little impact of higher interest rates so far, outside of falling house prices and a cooling of the construction pipeline," he added.
"As inflation expectations have been rising, we also think that neutral interest rates have drifted higher, meaning that the OCR needs to be higher than otherwise before monetary policy is really restricting the demand side of the economy," he said.
Hawkesby pointed to November projections that the OCR would peak around 5.50%. But he noted, "25 years as an economist has taught me that the only certainty is that our forecasts won't be exactly right. There are always shocks and unexpected developments that will evolve the story."
Crude Oil Price Clears Hurdle Ahead of Fed Rate Decision
Key Highlights
- Crude oil price started a fresh increase above the $73 resistance.
- It broke a key bearish trend line with resistance near $73.20 on the 4-hours chart.
- Gold price gained pace and cleared the $1,800 resistance zone.
- The Fed interest rate decision is scheduled today (forecast 4.5%, versus 4% previous).
Crude Oil Price Technical Analysis
Crude oil price started a fresh increase from the $70.20 support zone against the US Dollar. The price gained pace and traded above the $73.00 resistance zone.
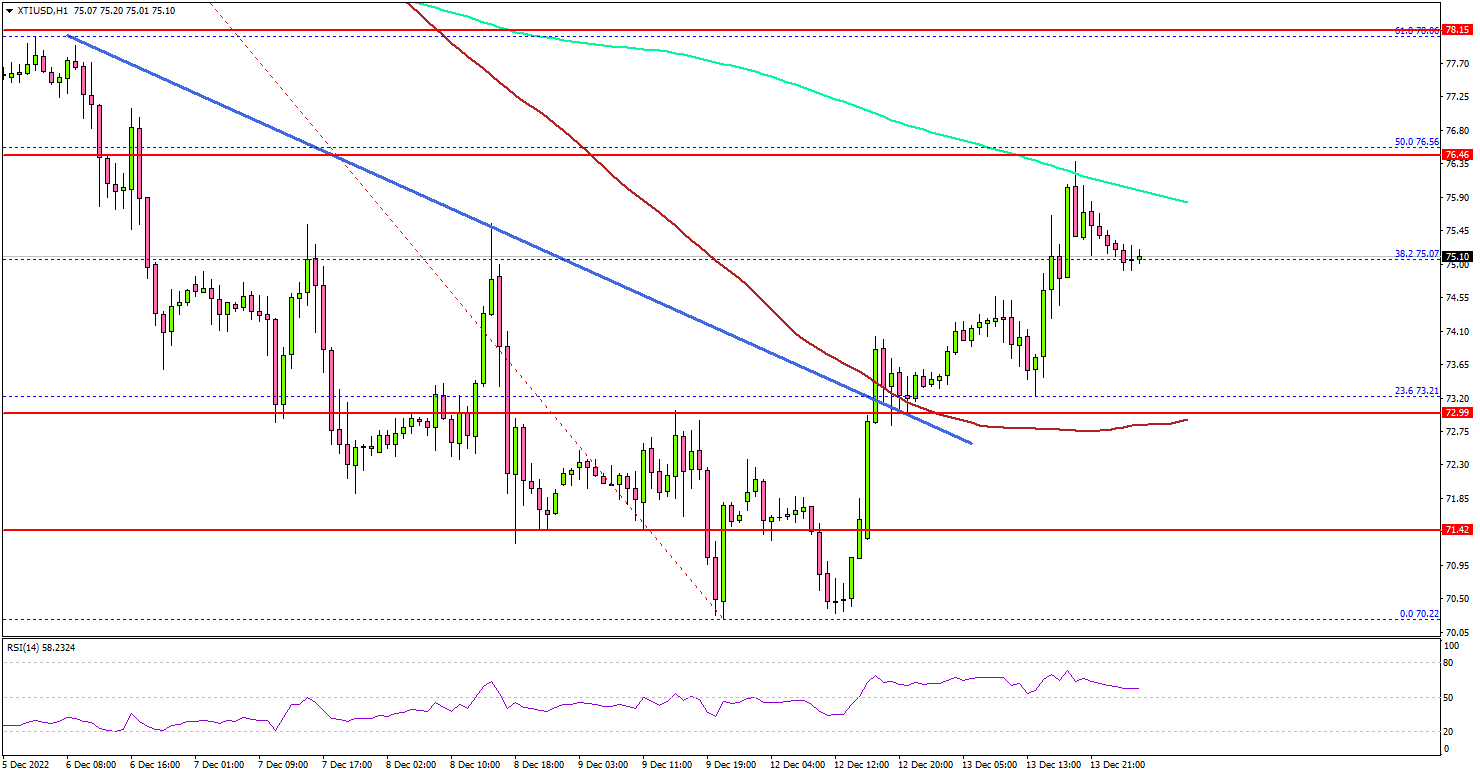
Looking at the 4-hours chart of XTI/USD, there was a break above a major bearish trend line with resistance near $73.20. There was a clear move above the 23.6% Fib retracement level of the main decline from the $82.91 swing high to $70.22 low.
It opened the doors for a move above the $74.50 resistance and the 100 simple moving average (red, 4-hours). On the upside, the price might face sellers near the $76.50 zone and the 200 simple moving average (green, 4-hours).
The next major resistance is near $78, above which the price could test $80 resistance. A clear move above the $80 resistance could open the doors for another steady increase in the coming days.
An immediate support is now forming near the $73.20 zone and the 100 simple moving average (red, 4-hours). The next major support is near $72.10 zone. Any more losses might call for a test of the $70.20 support zone.
Looking at gold price, there was a steady increase above the $1,800 resistance and there could be more upsides in the near term.
Economic Releases to Watch Today
- UK Consumer Price Index for Nov 2022 (YoY) – Forecast +10.9%, versus +11.1% previous.
- UK Core Consumer Price Index for Nov 2022 (YoY) – Forecast +6.5%, versus +6.5% previous.
- Fed Interest Rate Decision – Forecast 4.5%, versus 4% previous.
Another Inflation Release Below Expectations – Another Rally
US consumer prices added 0.1% for November, significantly weaker than the expected 0.3%. The annual price growth rate slowed to 7.1% YoY against expectations of 7.3%, 7.7% a month earlier and two percentage points below the June peak.
An important factor was the release of a lower-than-expected Core-CPI, which decreased to 6.0% YoY. This strongly indicates that the fall in commodity prices is also spreading rapidly across the basket.
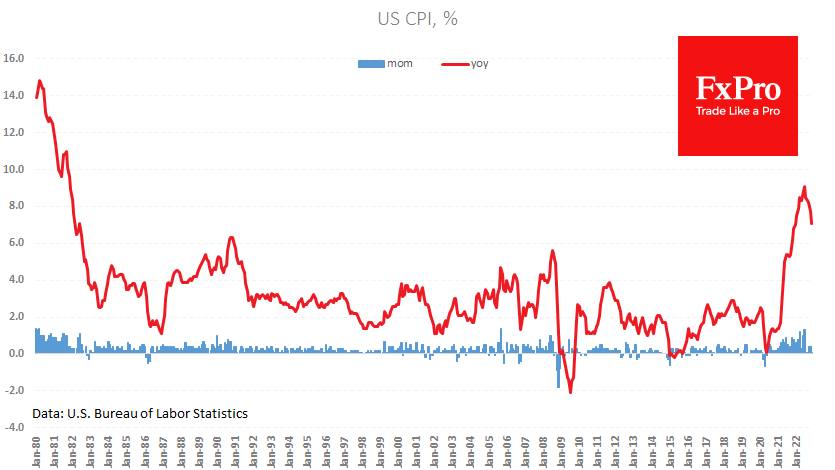
For market players, such data reinforces expectations that inflation has proved more responsive to rate hikes and less sticky than warned at the Fed and feared by markets in previous months. The weak inflation strengthens hopes that Powell’s tone tomorrow will be more amicable than in the last few months.
In terms of interest rates, this means that after three 75-point hikes, the main scenario is another 50-point increase, followed by two 25-point hikes.
If the inflation rate continues to react “favourably” to high-interest rates, the central bank’s QE policy could already end at the end of 2023.
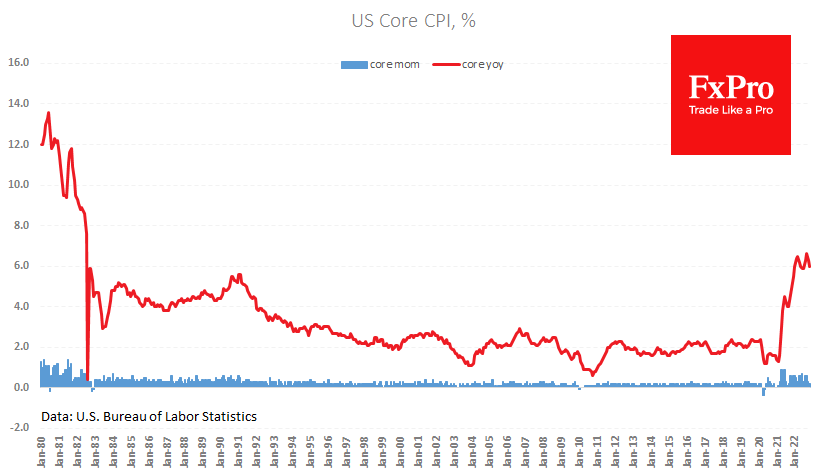
However, such expectations are very fragile constructions. Producer prices rise did not slow in November, adding 0.3% m/m for the 3rd month in a row. The annual growth rate is falling due to a high base effect but not due to a fall in prices. At the same time, the labour market remains “tight”, suggesting further pressure on prices due to wages. Thus, it may be too premature to celebrate victory over inflation and bet on an end to policy tightening by the Fed or other central banks.
Sunset Market Commentary
Markets
UK labour market data kicked off today’s trading day. Employment, based on the labor force survey, rose by 27k in the three months to October, beating the consensus estimate of a 17k decline. The unemployment rate rose during the same period to 3.7% with participation outpacing employment. Wage growth accelerated from 5.8% Y/Y to 6.1%. November data suggested that the labour market remains strong with payrolls rising by 107k (vs 42k expected). A decline in vacancies (from very high levels) indicates that demand for labour nevertheless seems to be slowing down. The strong labour data triggered an early underperformance of UK Gilts going into Thursday’s BoE meeting. The UK 2-yr yield touched 3.55% for the first time since the end of October. Sterling holds the slightest of advantages against the euro, holding below the 0.86 big figure, but without really testing the strong support zone around 0.8560. We have the impression it won’t take much from the BoE to force a technical break. That is in case tomorrow’s UK CPI numbers fail to do the trick.
US November CPI was the main dish. Headline inflation slowed to 0.1% M/M with the core rising by 0.2% M/M. Both were below consensus (0.3%) with the latter being the slowest pace since August 2021. Headline inflation growth decelerated more than forecast: from 7.7% Y/Y to 7.1% Y/Y (vs 7.3% expected) with the core down at 6% Y/Y (from 6.3% vs 6.1% expected). Details showed that shelter (0.6%) was by far the largest contributor to the overall CPI gain with food prices also up 0.5%. Core goods prices fell for a second month in a row (-0.5%) and also energy prices declined (-1.6%). The market reaction was huge. Corrections since mid-October resumed with markets anticipating the Fed won’t be able walk its own hawkish talk. US Treasuries outperform German Bunds. US yields lose 7.7 bps (30-yr) to 20 bps (3-yr). The US 2-yr yield is at risk of permanently losing the neckline of a multiple top formation at 4.25%. The US 10-yr yield tests 50% retracement on the Aug/Oct leap higher at 3.42%. Changes on the German curve range between -2.2 bps (30-yr) and -8.2 bps (2-yr). The dollar pays the price. EUR/USD sets a new recovery high above 1.0650 (from 1.0550). Key resistance kicks in at 1.0747/1.0806 (62% retracement on this year’s decline & March low). The trade-weighted dollar fell below this month’s low (104.11) to trade below 104 for the first time since end June. Even USD/JPY loses almost 3 big figures, changing hands at 135. US stock markets opened 1.5% to 3% higher with European gains ranging between 1% for the FTSE 100 and almost +2.5% for the EuroStoxx50.
News Headlines
The Bank of England in its half-yearly Financial Stability Report warned that higher inflation and borrowing costs will put significant pressure on households and businesses while the UK is entering a lengthy recession. Around 4 million households were likely to face higher mortgage payments in 2023. But just 2.4% of the families are expected to find it hard to afford, keeping the risk of widespread defaults contained. It’s a smaller proportion than in the 1990 or 2008 recession, in part because of more fixed-rate mortgages and stricter lending regulations. This makes them more resilient than before. Businesses and banks, too, are described as well positioned to withstand the worsening economic outlook. The BoE added that it will carry out a first of its kind stress test of vulnerabilities in non-bank financial markets next year. This follows the turmoil in September, when pension funds were on the brink of collapsing after the Truss administration’s fiscal agenda triggered a major cross-asset sell-off that exposed gaps in policymakers systemic risk analysis.
The State Secretariat for Economic Affairs, Switzerland’s agency in charge of producing forecasts for the government, lowered expected GDP growth for 2023 from 1.1% to 1%. That’s half the growth this year. In 2024, the economy should expand by 1.6%. Inflation in 2023 may ease to 2.2% vs 3% on average this year before dropping below the Swiss National Bank’s 2% target in 2024 (1.5%). The central bank holds its final policy meeting for the year on Thursday during which it’ll present its own forecasts. The jury is still out whether the SNB will lift rates by 75 bps or pare the pace to 50 bps, with the balance currently tilted towards the latter.