Sample Category Title
Dollar Holding On in Subdued Trading
Dollar is trying to recover in early US session, with help from 10-year yield which reclaims 3.5% handle. Yet again there is now clear follow through buying. News flow is slow today, without much surprise from US PPI data. As Fed is already in a blackout period, there is no comment from US monetary policy makers. Trading would likely remain subdued, until FOMC rate decision and economic projections next week.
In Europe, at the time of writing, FTSE is down -0.10%. DAX is up 0.31%. CAC is up 0.01%. Germany 10-year yield is up 0.0683 at 1.886. Earlier in Asia, Nikkei rose 1.18%. Hong Kong HSI rose 2.32%. China Shanghai SSE rose 0.30%. Singapore Strait Times rose 0.31%. Japan 10-year JGB yield dropped -0.0006 to 0.256.
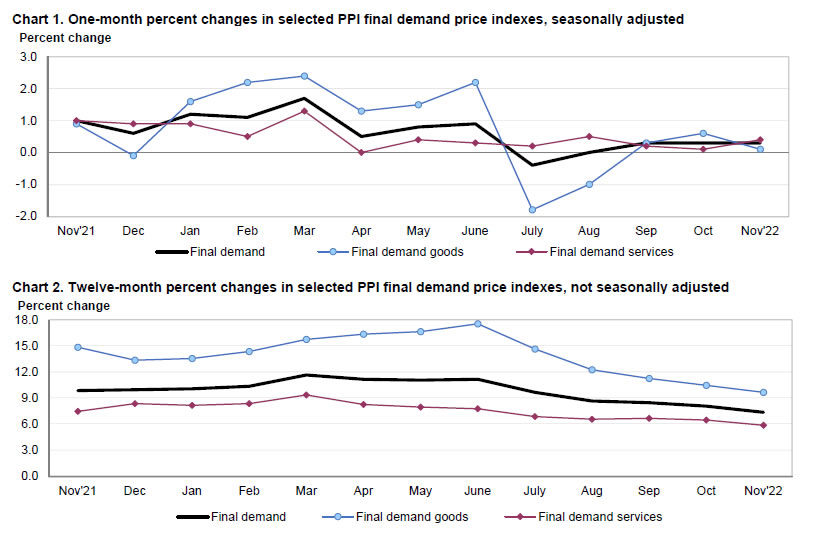
US PPI up 0.3% mom, 7.4% yoy in Nov
US PPI for final demand rose 0.3% mom in November, above expectation of 0.1% mom. PPI services rose 0.4% mom while PPI goods rose 0.1% mom. PPI less foods, energy, and trade services rose 0.3% mom.
For the 12 months ended in November, PPI rose 7.4% yoy, down from October's 8.1% yoy, matched expectations. PPI less foods, energy, and trade services rose 4.9% yoy,
China CPI slowed to 1.6% yoy in Nov, core CPI down -0.6% yoy
China CPI slowed from 2.1% yoy to 1.6% yoy in November, below expectation of 1.7% yoy. Core CPI, excluding food and energy, was down -0.6% yoy, unchanged from October. Food prices slowed from 7.0% yoy to 3.7% yoy. Non-food prices were unchanged at 1.1% yoy.
"In November, due to the domestic epidemic, seasonal factors, and a higher base of comparison in the same period last year, CPI turned from rising to falling month on month and fell back year on year," said chief NBS statistician Dong Lijuan.
PPI was unchanged at -1.3% yoy, above expectation of -1.5% yoy. "In November, PPI rose slightly month on month as a result of price increases in coal, oil and non-ferrous metals, and continued to fall year on year due to a high base of comparison from the same period last year," added Dong.
GBP/USD Mid-Day Outlook
Daily Pivots: (S1) 1.2178; (P) 1.2213; (R1) 1.2271; More...
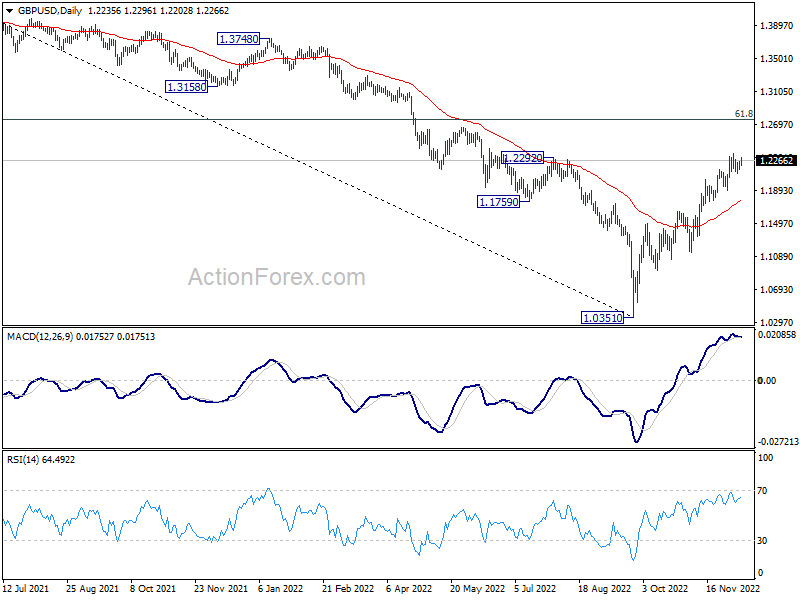
Intraday bias in GBP/USD remains neutral. Consolidation from 1.2343 could extend. But further rise remains mildly in favor as long as 1.1898 support holds. On the upside, break of 1.2343 will resume the rally from 1.0351 and target 1.2759 medium term fibonacci level next. However, firm break of 1.1898 support will confirm short term topping and turn bias back to the downside.
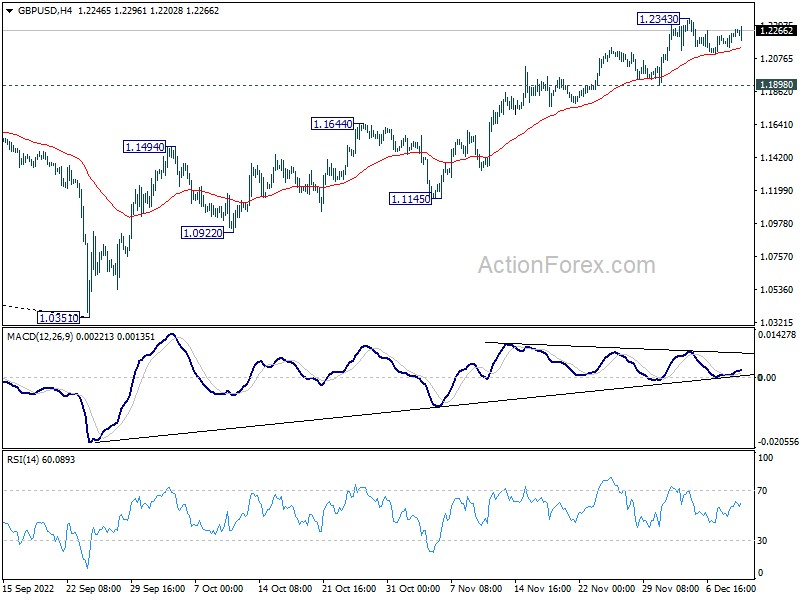
In the bigger picture, rise from 1.0351 medium term bottom is at least correcting whole down trend from 1.4248 (2021 high). Further rise is expected as long as 1.1644 resistance turned support holds. Next target is 61.8% retracement of 1.4248 to 1.0351 at 1.2759. Sustained break there will pave the way back to 1.4248.
Economic Indicators Update
| GMT | Ccy | Events | Actual | Forecast | Previous | Revised |
|---|---|---|---|---|---|---|
| 23:50 | JPY | Money Supply M2+CD Y/Y Nov | 3.10% | 3.00% | 3.10% | |
| 01:30 | CNY | CPI Y/Y Nov | 1.60% | 1.70% | 2.10% | |
| 01:30 | CNY | PPI Y/Y Nov | -1.30% | -1.50% | -1.30% | |
| 13:30 | CAD | Capacity Utilization Q3 | 82.60% | 83.00% | 83.80% | 82.80% |
| 13:30 | USD | PPI M/M Nov | 0.30% | 0.10% | 0.20% | 0.30% |
| 13:30 | USD | PPI Y/Y Nov | 7.40% | 7.40% | 8.00% | 8.10% |
| 13:30 | USD | PPI Core M/M Nov | 0.40% | 0.30% | 0.00% | 0.10% |
| 13:30 | USD | PPI Core Y/Y Nov | 6.20% | 6.00% | 6.70% | |
| 15:00 | USD | Michigan Consumer Sentiment Index Dec P | 53.3 | 56.8 | ||
| 15:00 | USD | Wholesale Inventories Oct F | 0.80% | 0.80% |
US PPI up 0.3% mom, 7.4% yoy in Nov
US PPI for final demand rose 0.3% mom in November, above expectation of 0.1% mom. PPI services rose 0.4% mom while PPI goods rose 0.1% mom. PPI less foods, energy, and trade services rose 0.3% mom.
For the 12 months ended in November, PPI rose 7.4% yoy, down from October's 8.1% yoy, matched expectations. PPI less foods, energy, and trade services rose 4.9% yoy,
USD/JPY: Pullback Acceleration Adds to Signals of Reversal
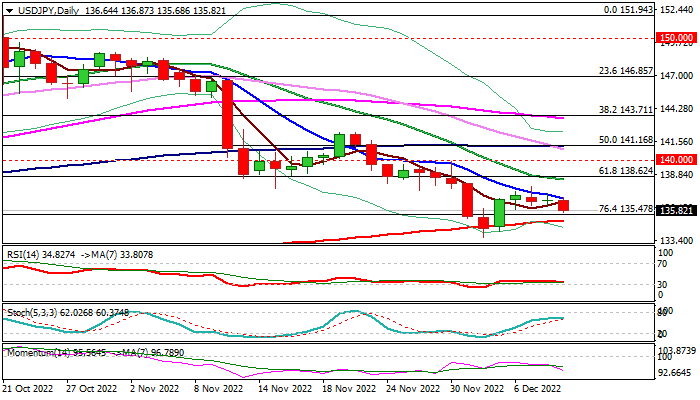
The USDJPY accelerated lower on Friday after a triple daily Doji, adding to signals that short recovery from 133.62 (Dec 2 low, the lowest since Aug 16) might be over.
Fresh bears hit 50% retracement of 133.62/137.85 upleg and eyeing key 200DMA (135.03) for retest, after attacks on Dec 2/5 failed to register a clear break lower.
Rising negative momentum and most of moving averages being in bearish setup on daily chart, add to negative signals.
Weekly close below 200DMA would be a minimum requirement to keep renewed bears in play and neutralize signals from formation of inverted hammer, reversal signal, on weekly chart.
Res: 136.81; 137.85; 138.40; 140.00.
Sup: 135.47; 135.03; 134.41; 133.62.
GBP/USD: High Probability of Price Collapse to a Minimum of 1.0925
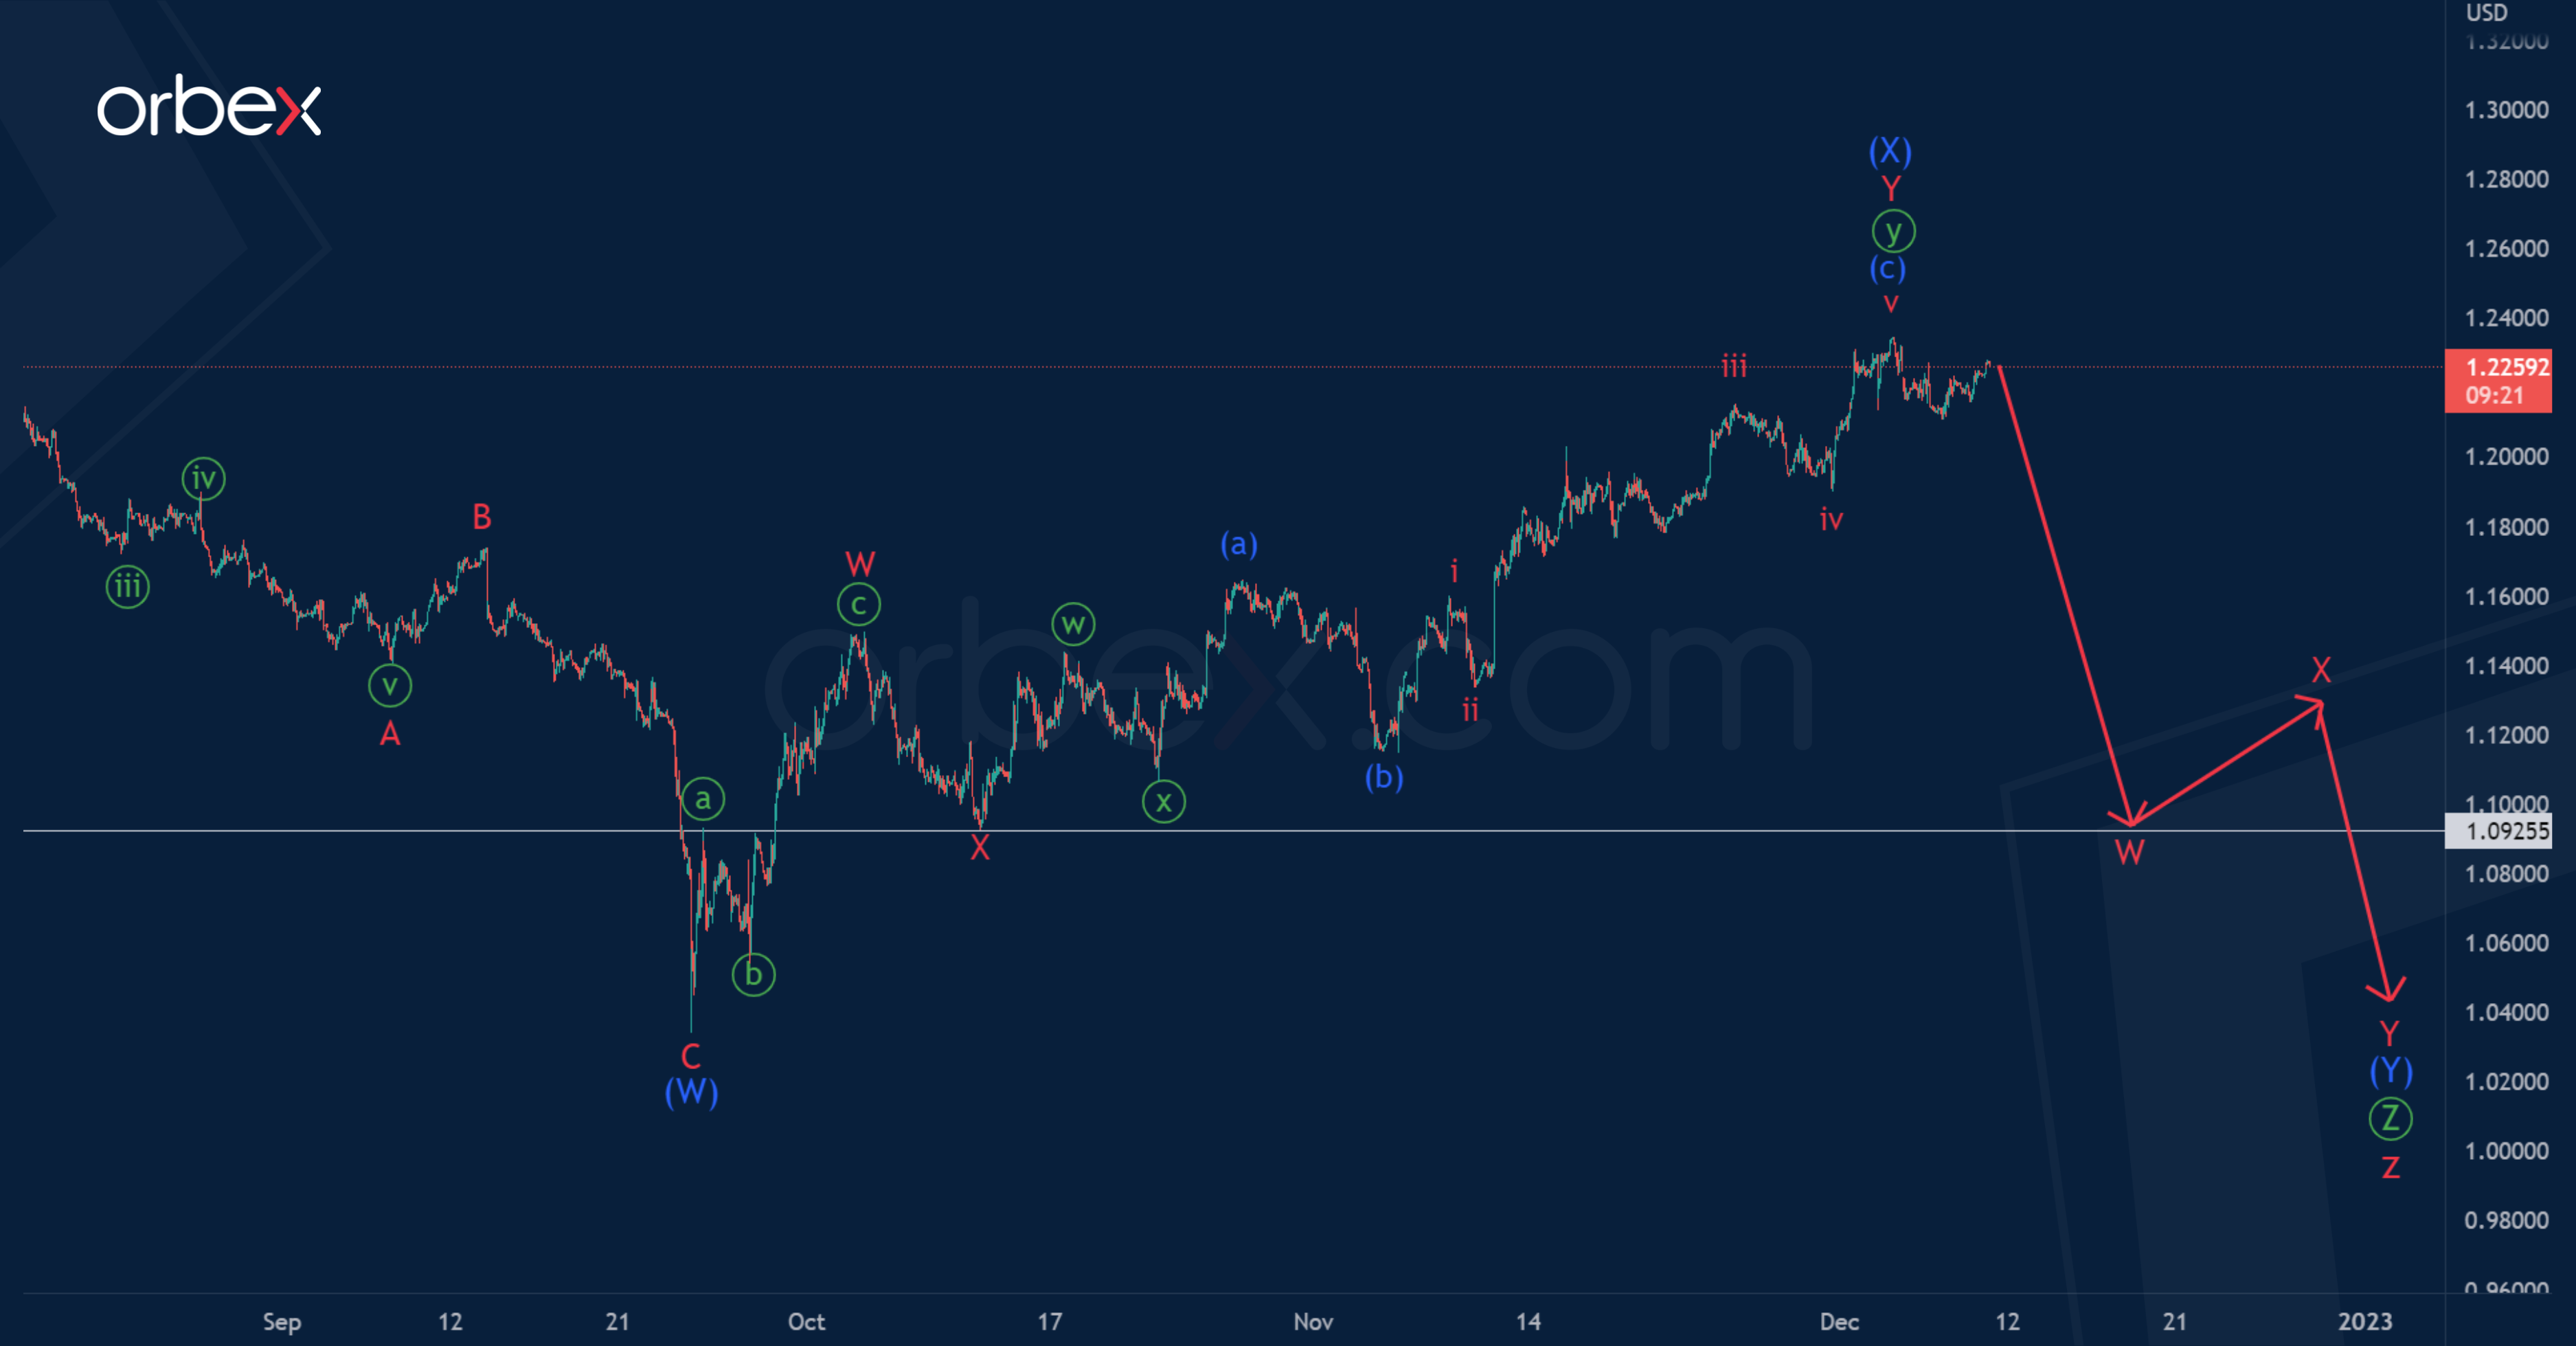
GBPUSD formation suggests the formation of a global corrective trend – a triple zigzag w-x-y-x-z, in which the market builds the final actionary wave z of the cycle degree.
The wave z most likely takes the form of a primary triple zigzag Ⓦ-Ⓧ-Ⓨ-Ⓧ-Ⓩ. It is possible that a bearish trend is currently developing in the primary wave Ⓩ, which may take the form of an intermediate double zigzag (W)-(X)-(Y). The formation of the intervening wave (X) has recently ended. The last sub-wave (Y) is likely to take the form of a double zigzag W-X-Y.
The end of the first actionary wave W is expected at a minimum of 1.095.
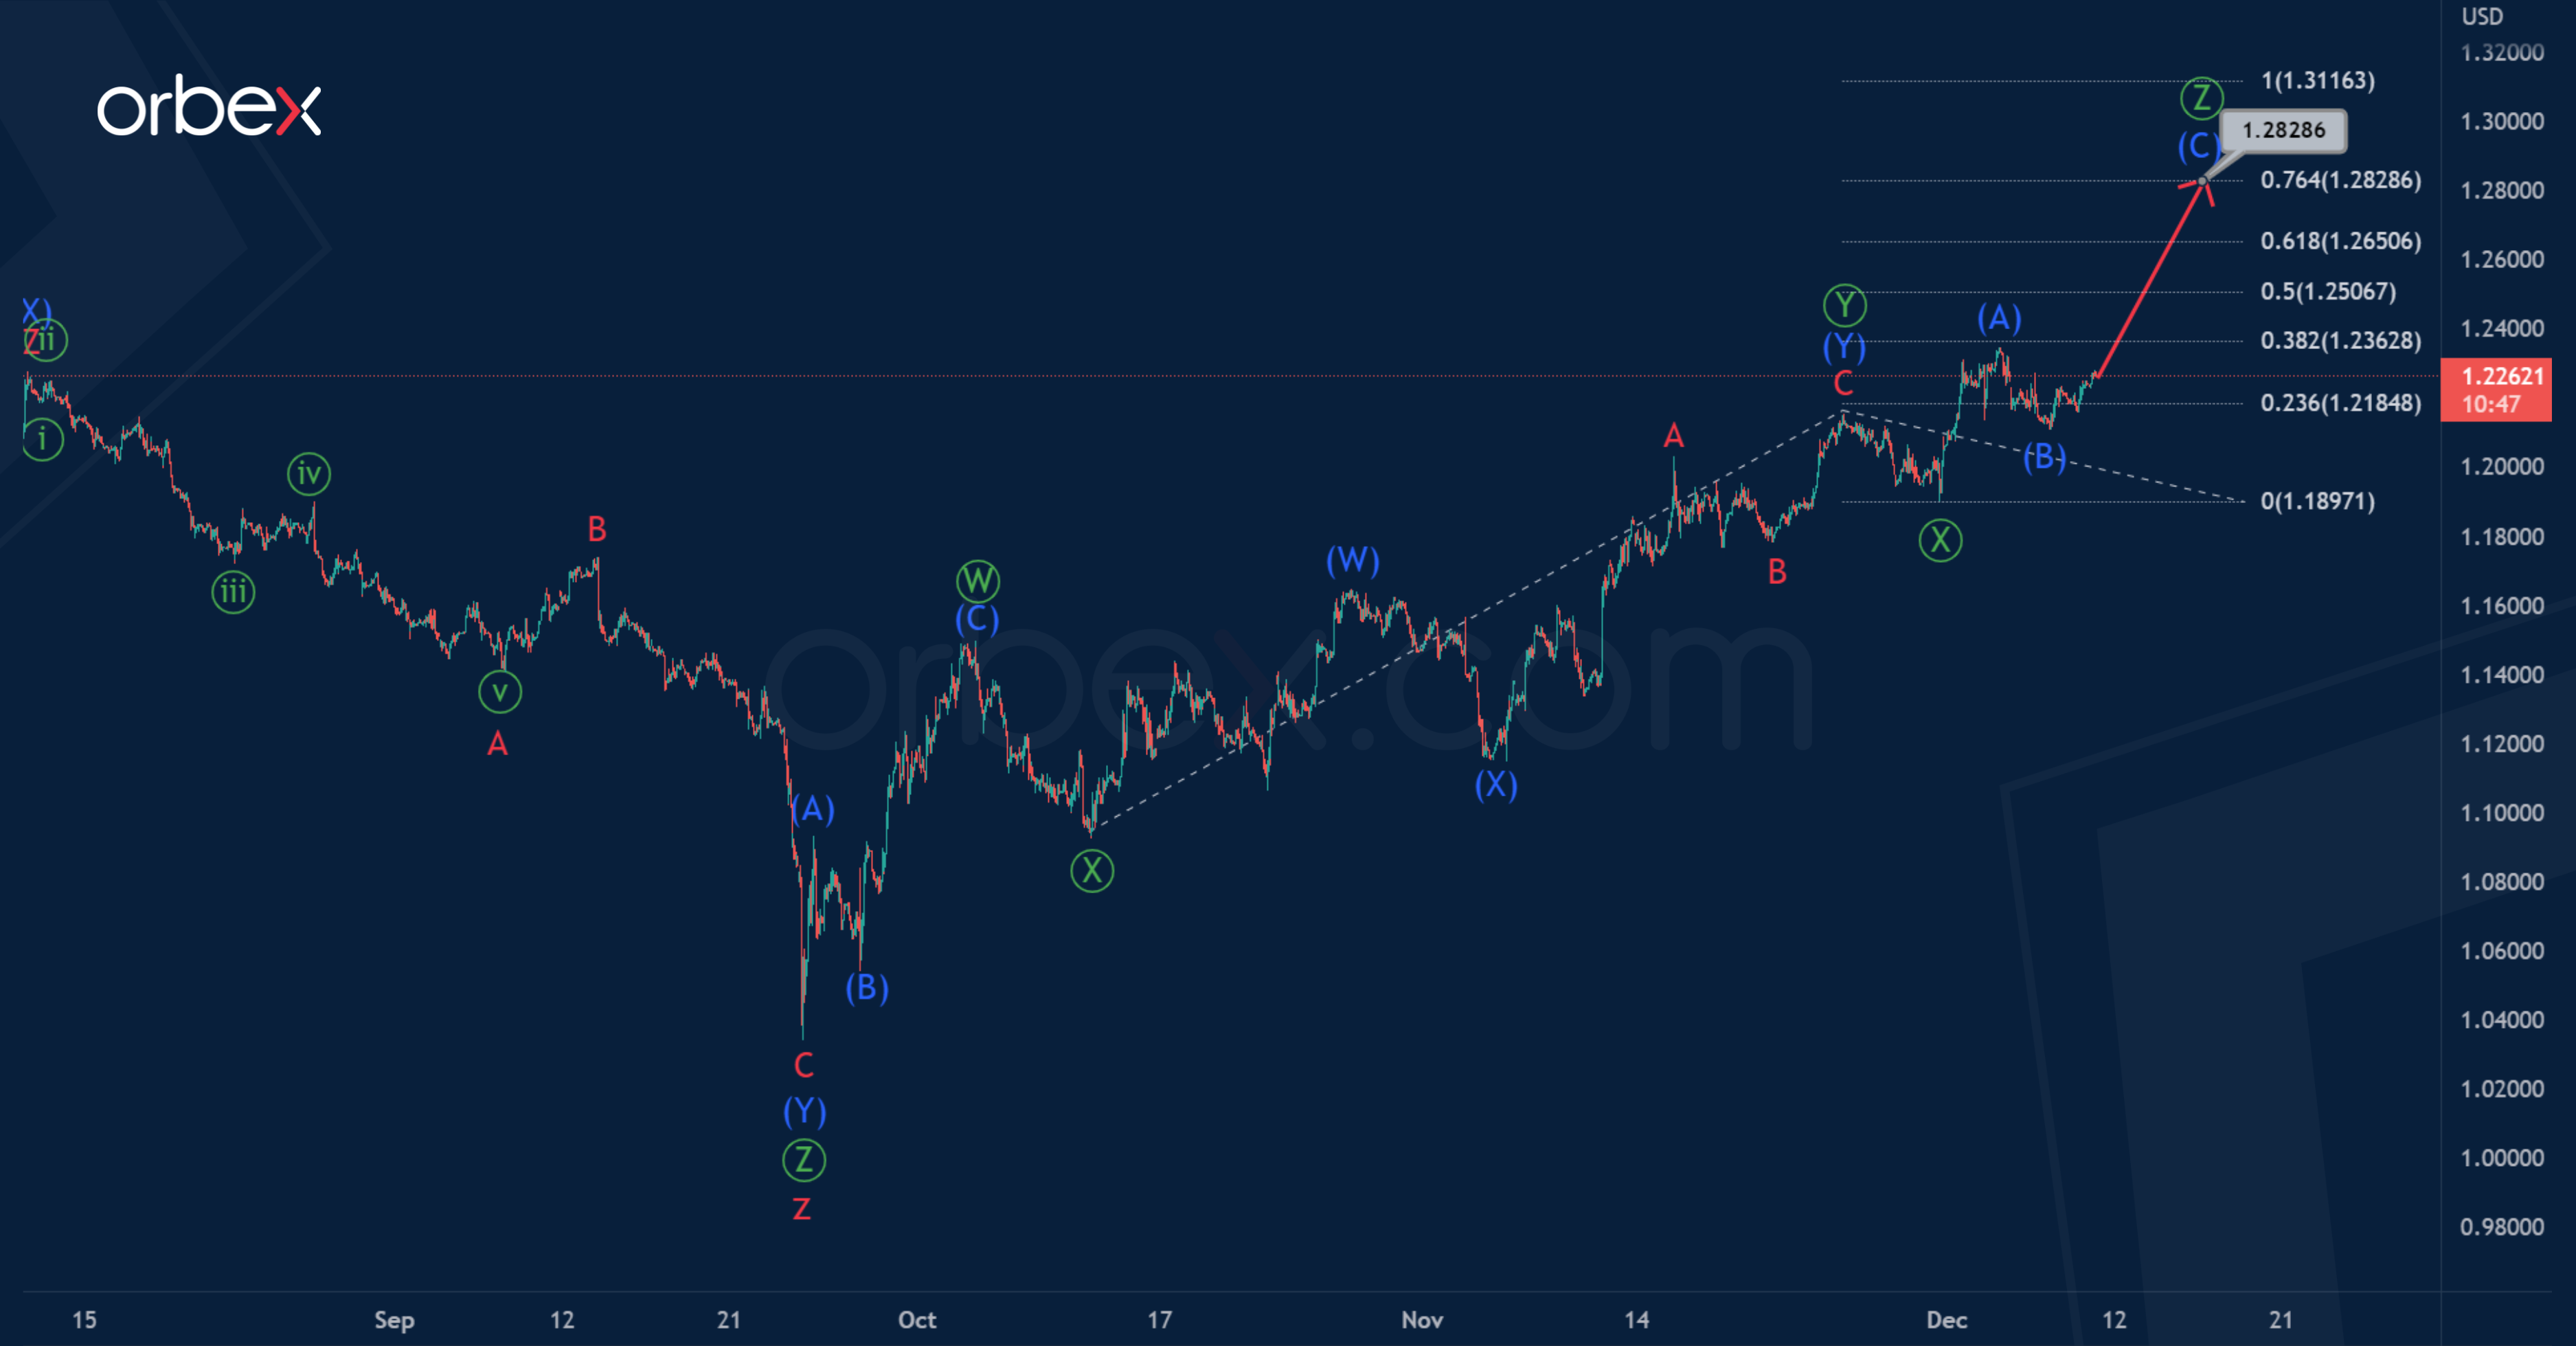
Alternatively, it is assumed that the cycle wave z could be fully completed in the form of a primary triple zigzag.
Thus, we see that since the end of September, bulls have started to move the price into a new trend.
Perhaps we are seeing the formation of a primary triple zigzag Ⓦ-Ⓧ-Ⓨ-Ⓧ-Ⓩ, where the first four parts are already formed.
In the last section of the chart, the final actionary wave Ⓩ is formed. Most likely, it will be at 76.4% of wave Ⓨ, and will end near the level of 1.282.
GBP/USD: Cable Keeps Positive Tone Above 200DMA But Weekly Doji Warns
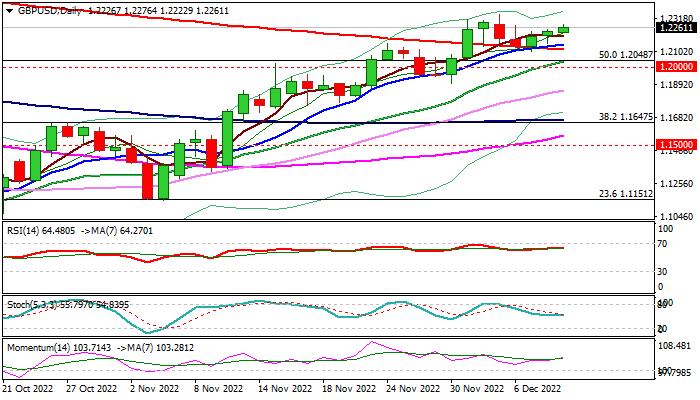
Cable remains constructive and extends bounce from 200DMA on Friday, retracing over 61.8% of a shallow pullback from 1.2344 to 1.2106 so far.
Bulls are underpinned by 10/200DMA golden-cross and strong positive momentum on daily chart, eyeing a multi-month high at 1.2344 (Dec 5), break of which would signal continuation larger uptrend from 1.0348 (2022 low, posted on Sep 26).
However, traders remain cautious as initial warning signals come from weekly chart, where Doji candle is signaling indecision, after four straight weeks of rally.
Strongly overbought stochastic on weekly chart, stretched 14-period momentum and RSI turning south, add to signals that bulls might be running out of steam.
Broken 200DMA (1.2119) reverted to solid support and keep bulls intact while the price action holds above, while firm break here would signal that near-term structure is weakening, though stronger negative signals could be expected on drop below 20 DMA (1.2036) and psychological 1.20 support.
The near-term action may stay in a quiet mode until next week’s key events (UK Nov inflation on Wednesday and BoE rate decision on Thursday) which are expected to give clearer signals of pound’s near-term direction.
Inflation in UK is expected to slightly ease in November after hitting a multi-decade high last month, though economists expect inflation to remain elevated for some time and likely to become entrenched that would make BoE’s attempts to put inflation under control, much more difficult.
The Bank of England is expected to raise interest rates by 50 basis points to 3.5% on Thursday.
Res: 1.2293; 1.2344; 1.2406; 1.2450.
Sup: 1.2200; 1.2151; 1.2119; 1.2036.
NZD/USD Yawns as Manufacturing Sales Shines
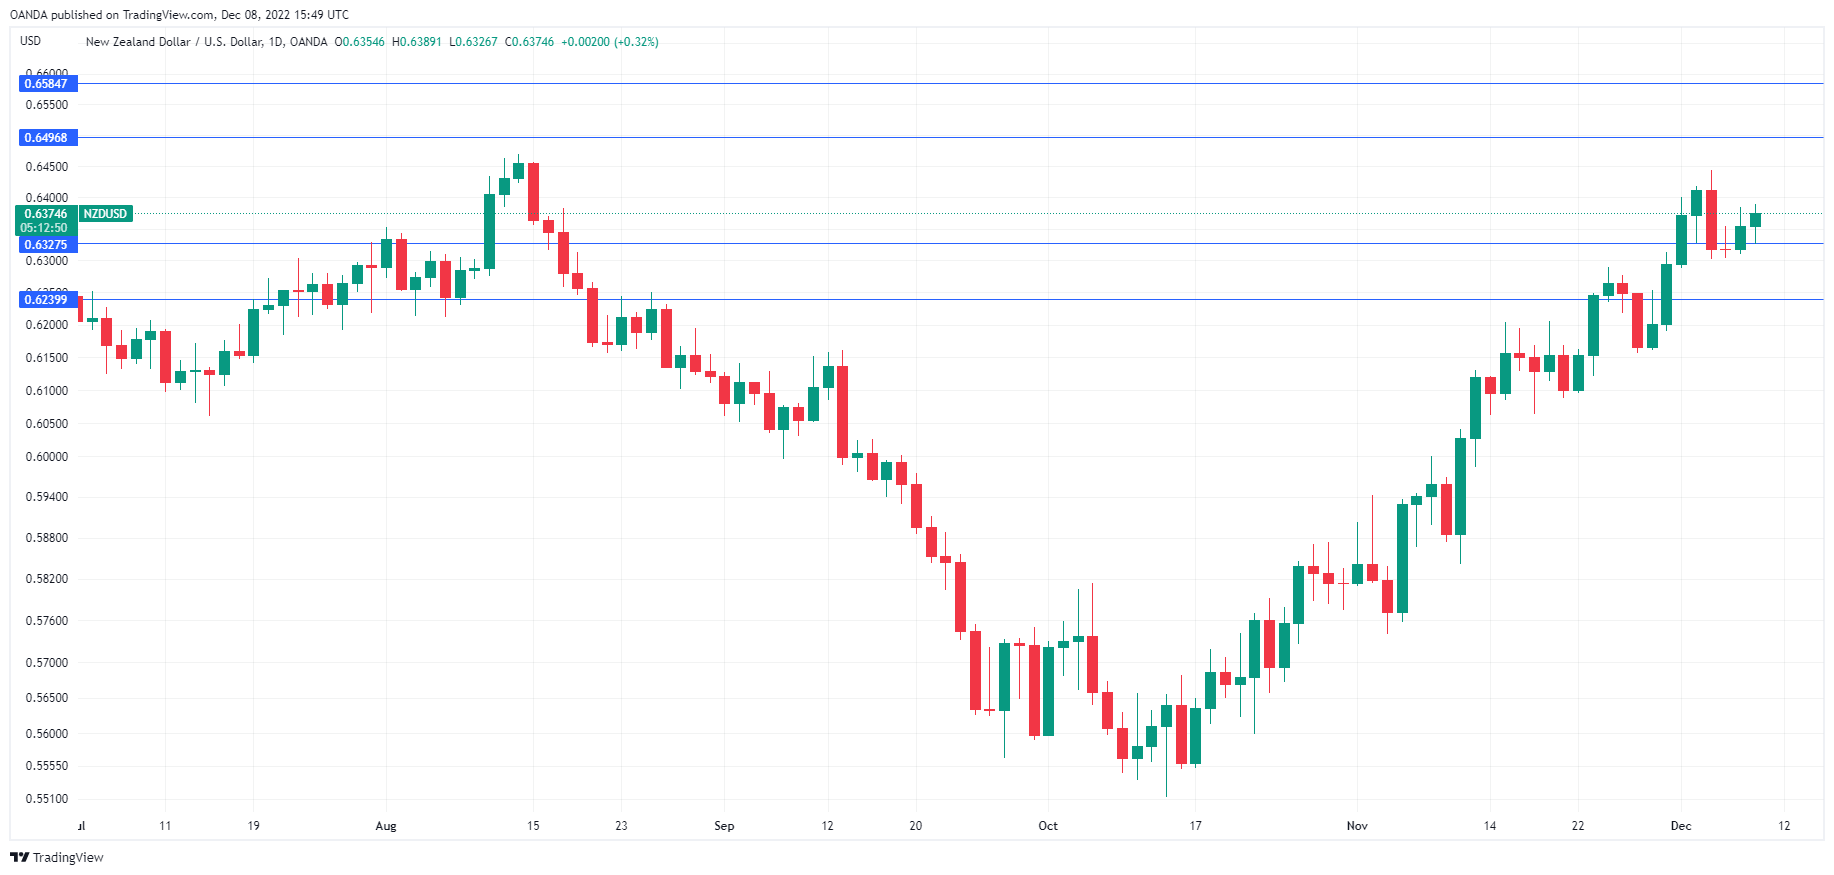
It has been a generally muted week for the New Zealand dollar, save for Monday, when it fell by 1.3% in the aftermath of the strong US employment report. With a light economic calendar this week in both the US and New Zealand, the markets are casting an eye to next week, which is loaded with key events. The US releases CPI and retail sales reports, as well as the Fed policy meeting on Wednesday. On the same day, New Zealand releases third-quarter GDP.
New Zealand wrapped up the week on a high note, as Manufacturing Sales sparkled in Q3 with a gain of 3.2%. This was a strong rebound from the -4.9% release in Q2 and ahead of the -2.4% consensus. The manufacturing sector is showing signs of weakness, as Manufacturing PMI declined in October for the for time since August 2021.
Inflation remains the number one focus for the major central banks, and next Tuesday’s US inflation report should be considered a market-mover. Inflation has eased over the past several months, but the Fed has been very cautious and is still reluctant to declare that inflation has peaked. The Fed has not looked kindly on market exuberance triggered by soft inflation reports, and paraded a stream of Fed members to remind investors that inflation remains unacceptably high and the fight to curb inflation remains far from over.
The markets will get a look at US inflation data later today, with the release of the Producer Price Index (PPI). The index is expected to drop to 7.4%, down from 8.0%. I don’t expect a drop in PPI to send the markets into a frenzy the way that CPI can, but a lower PPI would reinforce expectations that we’ll see a decline in CPI as well next week.
NZD/USD Technical
- NZD/USD faces resistance at 0.6497 and 0.6585
- There is support at 0.6327 and 0.6239
Dollar Index: Dollar Remains at the Back Foot on Renewed Recession Fears, Fed in Focus
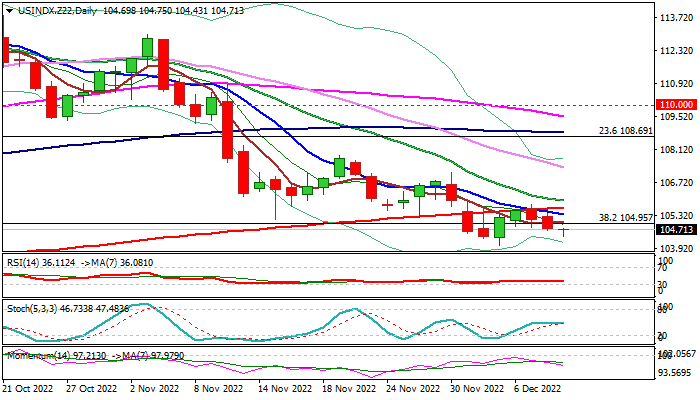
The dollar index holds in red for the third day and threatening to fully retrace recovery leg from 104.05 (Dec 5 low, the lowest in 3 –1/2 months) after bulls were trapped above 200DMA.
The dollar came under pressure on renewed concerns about slowdown of US economy, after jobless claims rose, adding to worries that the economy may slide into recession in 2023.
Traders also focus on next week’s Fed policy meetings, which is expected to provide more clues about the central bank’s next steps, after signals of slowing the pace of tightening, with wide expectations of 50 basis points hike next Wednesday, following four consecutive 75 basis points hikes.
Technical structure remains bearish on daily chart, as negative momentum is accelerating and moving averages are in full bearish setup, with bull-trap and 10/200 death-cross, additionally pressuring near-term action.
Fresh bears found temporary footstep at 104.45 Fibo support (76.4% of 104.05/105.78) on Friday, with signs of extended consolidation while the price holds above this level.
This could be an initial positive signal, as inverted hammer, reversal pattern is forming on weekly chart, however, this scenario needs stronger signals to be validated and looks quite unlikely for now, though it should be considered.
Upticks should stay capped by falling 10DMA (105.36) to keep bears intact for final push towards key support at 104.05, loss of which would signal bearish continuation. Only firm break above pivotal 200DMA barrier would sideline bears.
Res: 104.95; 105.36; 105.64; 105.94.
Sup: 104.45; 104.05; 103.07; 101.94.
USDCAD Rests Near 50-day SMA Above Downtrend Line
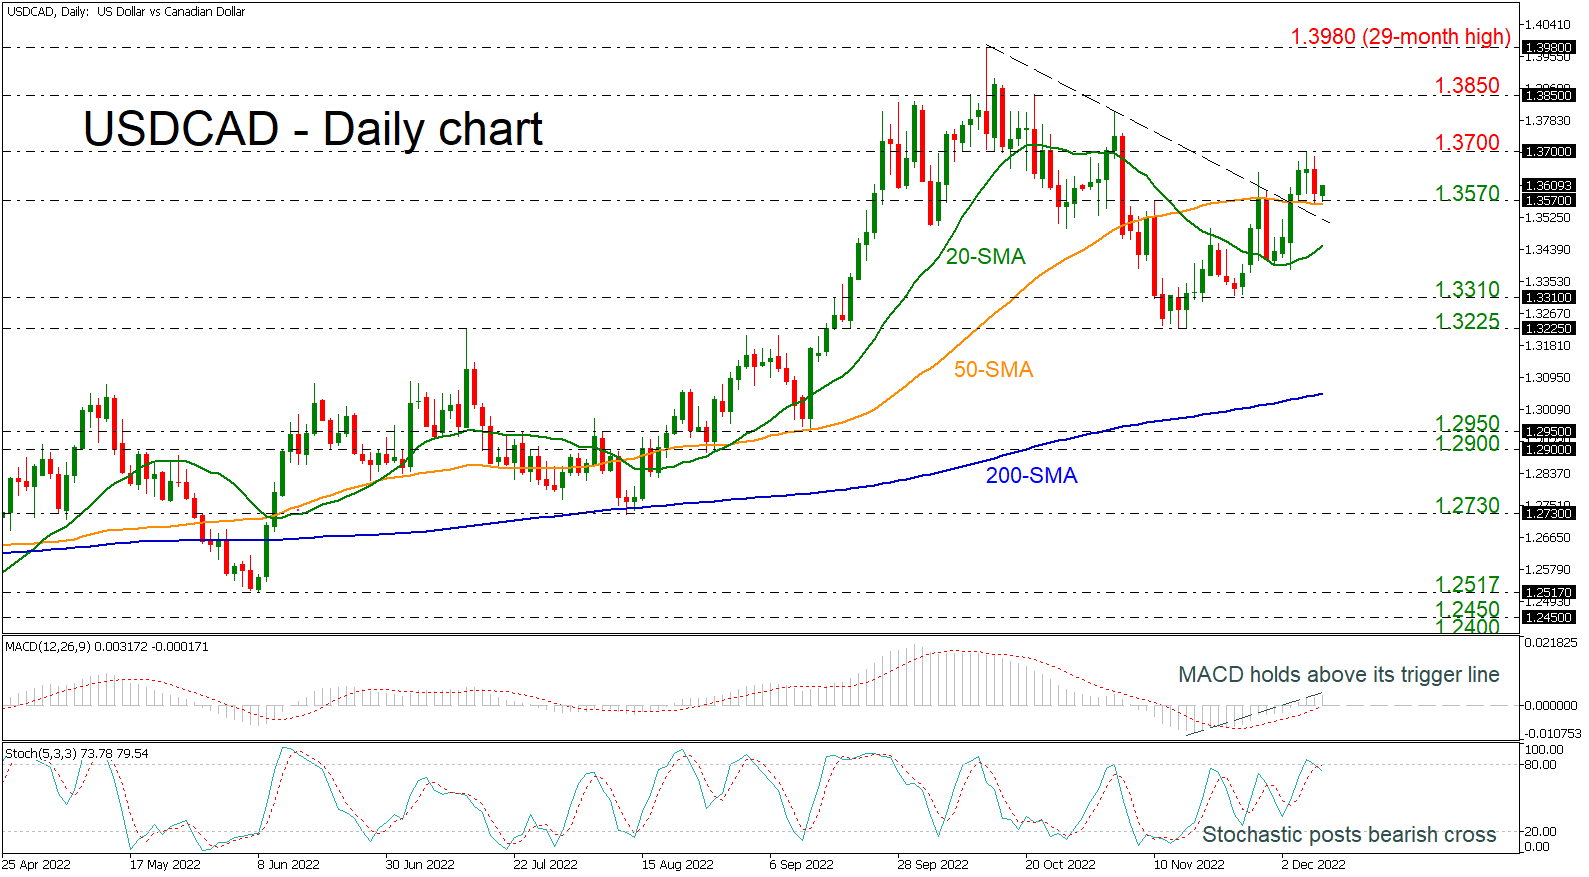
USDCAD is still trading above the short-term descending trend line and the strong 50-day simple moving average (SMA), which lies near the 1.3570 support. The MACD oscillator is holding above its trigger and zero lines; however, the stochastic posted a bearish cross within its %K and %D lines near the overbought territory, indicating that the next move may be to the downside.
Should the price close comfortably above the 1.3700 handle, which has been unbreakable over the past month, traders could add more value to the pair, pushing the market up to 1.3850. More advances could drive the bulls until the 29-month high of 1.3980, registered on October 13.
In the negative scenario where the 50-day SMA fails to halt downside movements at the moment, if the market moves lower, the 20-day SMA at 1.3450 could be the immediate support. If this proves easy to overcome this time, the decline may next pause somewhere between 1.3225-1.3310, investors could shift attention to the 200-day SMA at 1.3050.
In brief, USDCAD is showing some positive signs in the short-term, while in the bigger picture the outlook will brighten if there is a climb above 1.3980.
GBPJPY Poised to Breakout from Triangle
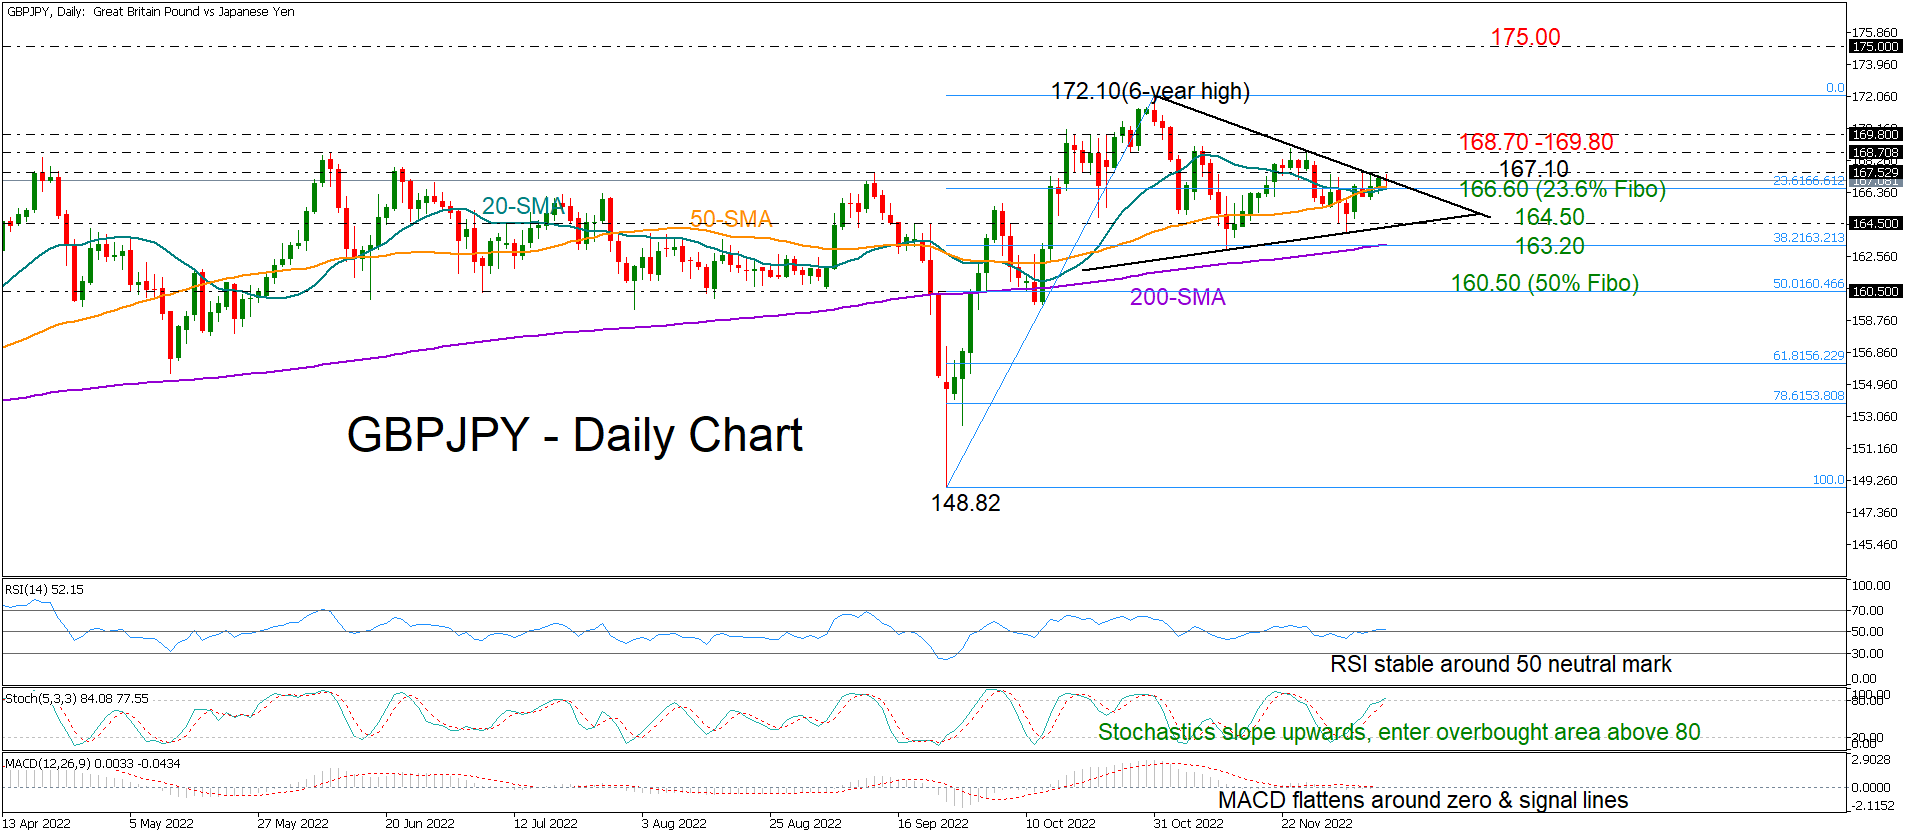
GBPJPY is looking for a breakout from the upper trendline of a symmetrical triangle at 167.10 after a gradual weekly increase from the 164.00 low.
On the downside, the 23.6% Fibonacci retracement of the latest upleg is currently reducing selling incentives, with the RSI and the MACD suggesting that traders are in a wait-and-see mode as the indicators remain trendless around their neutral levels.
On the other hand, the positive slope in the stochastics is feeding optimism for more upside, though the lines are already close to their 80 overbought level, flagging limited room for improvement. The 168.70-169.80 resistance territory could immediately halt a bullish extension above the triangle. If the bulls successfully pierce through this wall, they will next head for the October peak of 172.10. A break higher would clear the way towards the 175.00 key barrier, which had been last active during 2013-2016.
Alternatively, a close below 166.60 could press the price directly to the triangle’s lower trendline at 164.50. Should sellers snap that floor, the 38.2% Fibonacci of 163.20 and the 200-day simple moving average (SMA) may come to the rescue. If not, the decline may aggressively move towards the 50% Fibonacci of 160.50.
All in all, GBPJPY is expected to trade neutral in the coming sessions unless it sustainably stretches above 167.10 or below 164.50.
EUR/USD Pair Tested the 1.0585 Level Before the Bears Appeared
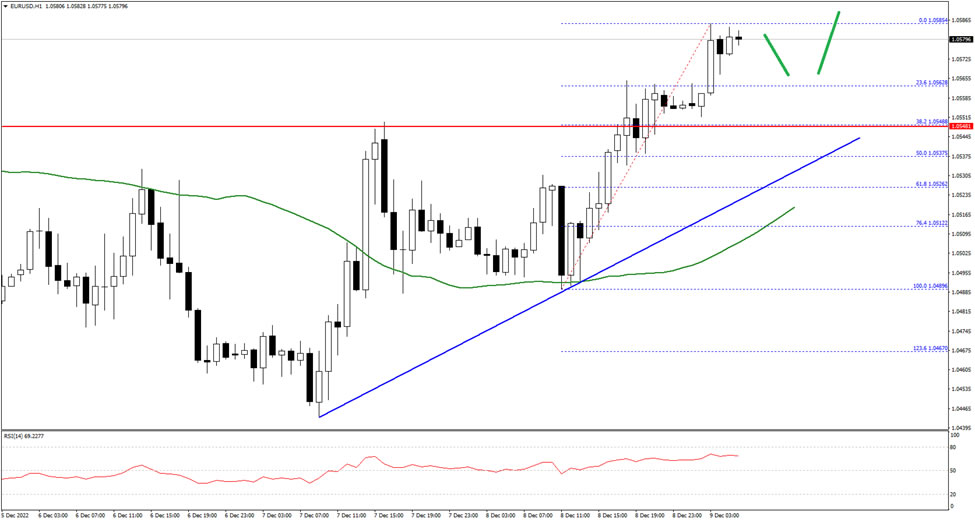
The Euro started a fresh increase above the 1.0500 and 1.0520 resistance levels against the US Dollar. The EUR/USD pair gained pace above the 1.0550 level to move further into a positive zone.
It tested the 1.0585 zone before the bears appeared. The pair is now rising and showing positive signs above the 1.0550 level plus the 50 hourly simple moving average. An immediate resistance is near the 1.0585 level.
The first major resistance is near the 1.0620 level. A break above the 1.0620 resistance level could start another increase. In the stated case, it could rise towards the 1.0680 resistance.
Conversely, the pair might start a downside correction below 1.0565 on FXOpen. The next key support is near 1.0545 and a trend line on the hourly chart, below the pair could drop towards the 1.0520 level. Any more losses might send the pair towards the 1.0485 level.