

Sample Category Title
Markets in Wait-and-See Mode
Market movers today
Today's key data release is the University of Michigan Consumer Survey where the main focus is on inflation expectations. Given the market is dead set on Fed 'only' hiking 50bp next week, a positive surprise today may lead to a change of mind, a rise in short-term US interest rates and another dent in EUR/USD. US PPI is also released today.
In euro area, our focus will be on the TLTRO early repayment option. Given the large uncertainty, we judge that our expectation of EUR300bn is broadly in line with the Bloomberg survey which was released yesterday (at EUR333bn). This will come on top of the EUR52bn as part of the maturity of the TLTRO operation.
The morning kicks off with inflation data out of Norway. Despite early signs of weaker demand having an effect on businesses' pricing power, we expect inflationary pressures to remain considerable with core inflation climbing further to 5.9% y/y in November.
The 60 second overview
ECB preview: At next week's meeting, we expect the ECB to deliver a 50bp rate hike with a hawkish twist. Specifically, we expect the ECB to present key principles of the end to reinvestments under the APP process (in which reinvestments will almost come to a full stop) and an open-ended wording for more rate hikes to come. This will be a compromise, which we believe will be palatable to both hawks and doves. We currently expect ECB rate hikes into Q1 next year, with the deposit rate peaking at 2.75%, but with risks skewed for more hikes. Read more on Research Euro area: ECB preview - A hawkish 50bp, 8 December.
Fed preview: A 50bp hike seems like the clear base case for next week's Fed meeting. That said, we expect Fed to deliver a hawkish message on the 2023 policy stance, as the recent data releases and easing in financial conditions suggest that the pressure to keep tightening will persist into 2023. We adjust our Fed call for the 50bp hike next week, but still expect Fed to reach a terminal rate of 5.00-5.25% by March. Read more on Research US: Fed preview - Tightening pressure to persist into 2023, 8 December.
FI: European rates grinded higher through the day and ended 3bp higher in core jurisdictions. Intra-euro area spreads widened by 2-4b amid parts of European out on holiday (Italy, Spain, Portugal). There was generally little market moving news yesterday.
FX: Another calm day for global FX markets, which seems to be in a wait-and-see mode before a busy week next week. EUR/USD edged higher again and above 1.0550 and USD/JPY held steady around 137. SEK and NOK were largely unchanged vis-à-vis EUR.
Credit: Credit market activity was once again fairly muted on Thursday, although still with a slight bearish tilt on index level. iTraxx main widened 0.5bp to close at 92.2bp, while iTraxx Xover widened 2.9bp to close at 469.9bp. Primary market activity cooled down somewhat compared to earlier in the week.
Nordic macro
In Sweden, Riksbank vice governor Per Jansson gives his annual December speech (08:30 CET). The title is "Monetary policy when inflation is too high - conditions and challenges". Mr Jansson has since he joined the Board started a tradition to end the year with guiding speeches on how to conduct monetary policy in a changing world, addressing issues such as leaning against the wind, negative interest rates and the interaction between fiscal and monetary policy. His speeches have laid the ground for how the Riksbank has implemented monetary policy. Hence, worth a close read.
USD/CAD Daily Outlook
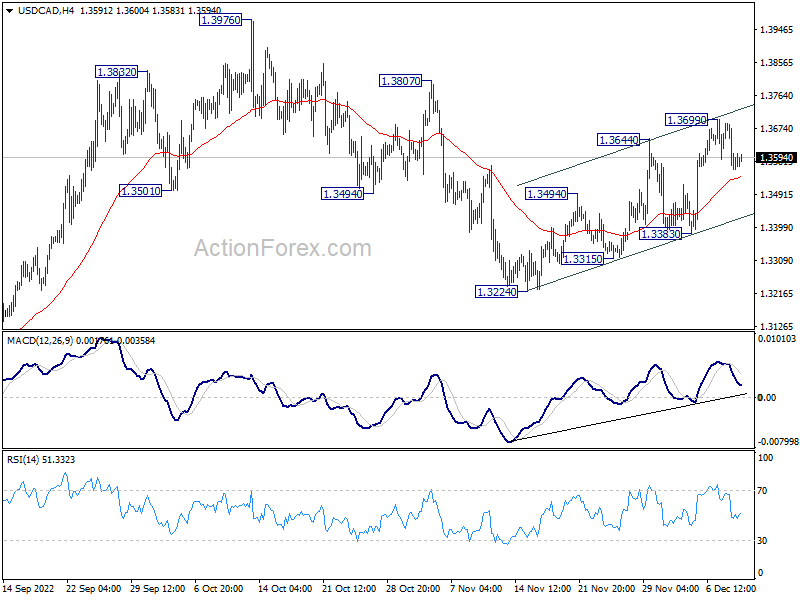
Daily Pivots: (S1) 1.3540; (P) 1.3615; (R1) 1.3668; More....
Intraday bias in USD/CAD is turned neutral but further rally is still in favor. Correction from 1.3976 could have completed with three waves down to 1.3224. Further rise should be seen to 1.3807 resistance first, and then 1.3976. For now, this will remain the favored case as long as 1.3383 support holds, in case of retreat.
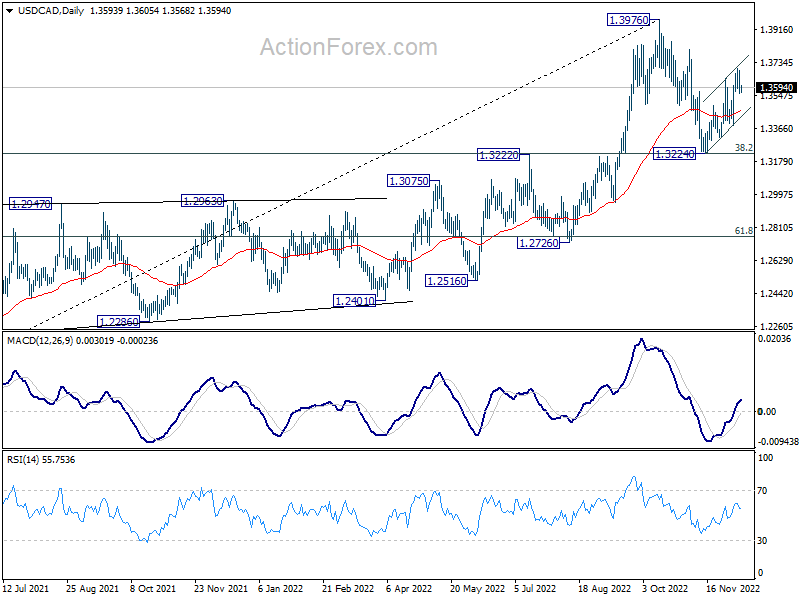
In the bigger picture, as long as 1.3222 cluster support (38.2% retracement of 1.2005 to 1.3976 at 1.3223) holds, larger up trend from 1.2005 (2021 low) is still expected to resume through 1.3976 high at a later stage. However, firm break of 1.3222/3 will indicate that the trend might have reversed. Deeper fall would be seen to next cluster support at 1.2726 (61.8% retracement at 1.2758).
AUD/USD Daily Report
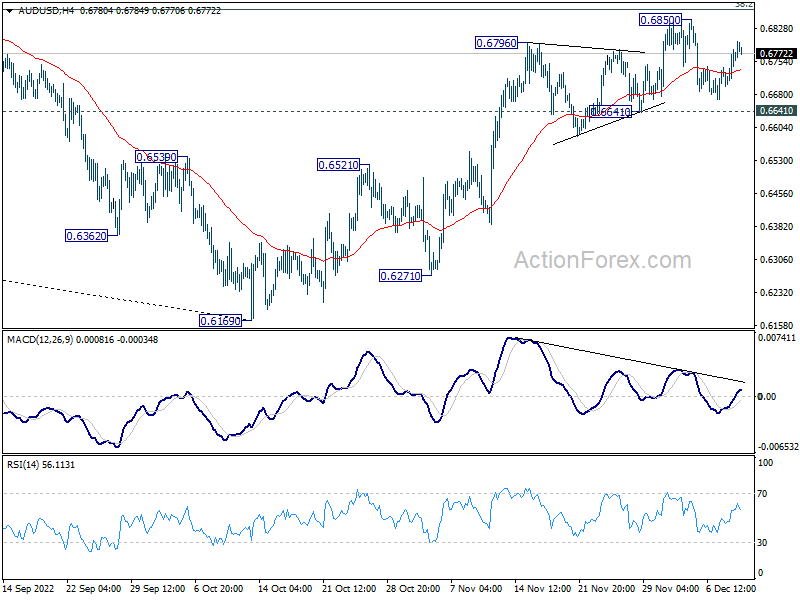
Daily Pivots: (S1) 0.6719; (P) 0.6750; (R1) 0.6801; More...
Intraday bias in AUD/USD stays neutral as range trading continues. On the downside, break of 0.6641 support should indicate short term topping, following rejection by 0.6871 fibonacci level. Intraday bias will be back on the downside for 0.6521 resistance turned support first. However, sustained break of 0.6871 will extend the rise from 0.6169 towards 55 week EMA at 0.6922.
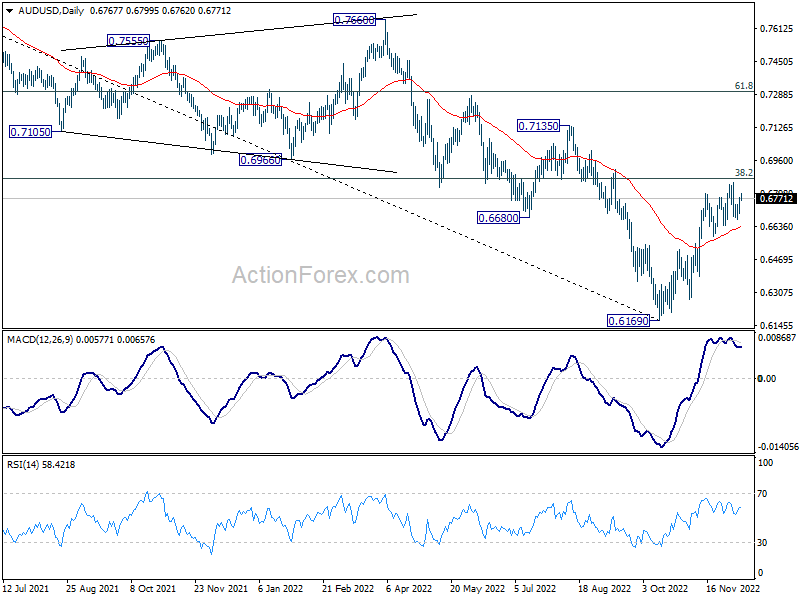
In the bigger picture, a medium term bottom is in place at 0.6160 already. But it's too early to call for trend reversal. Nevertheless, even as a corrective move, rise from 0.6169 should target 38.2% retracement of 0.8006 to 0.6169 at 0.6871. Sustained trading above 55 week EMA (now at 0.6922) will raise the chance of the start of a bullish up trend. However, rejection by 0.6781 or 55 week EMA, followed by 0.6521 resistance turned support and retain medium term bearishness.
USD/JPY Daily Outlook
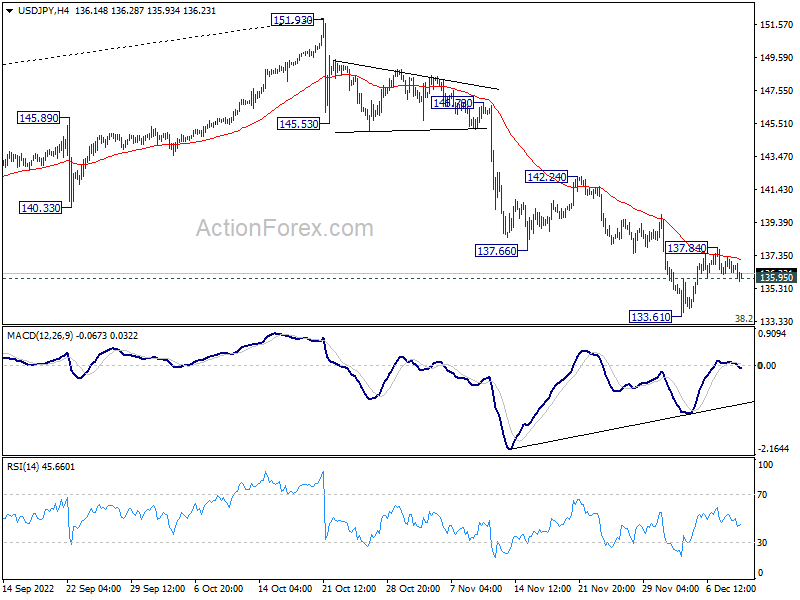
Daily Pivots: (S1) 136.21; (P) 136.72; (R1) 137.20; More...
Breach of 135.95 minor support suggests rejection by 4 hour 55 EMA. Intraday bias in USD/JPY is back on the downside for retesting 133.61 low. Firm break there will resume the decline from 151.93. On the upside, above 137.84 resistance will revive the case of short term bottoming, and turn bias back to the upside for 55 day EMA (now at 141.02).
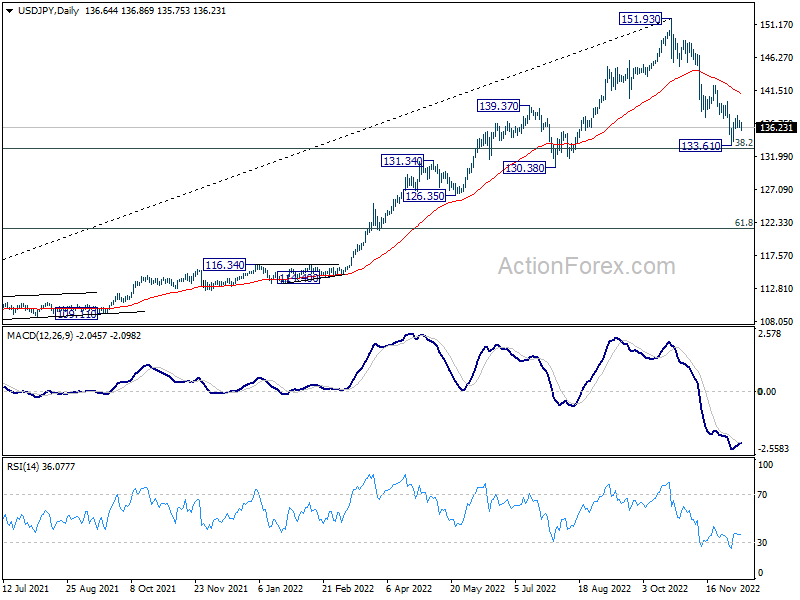
In the bigger picture, a medium term top should be formed at 151.93. Fall from there is correcting larger up trend from 102.58. It's too early to call for bearish trend reversal. But even as a corrective move, such decline should target 38.2% retracement of 102.58 to 151.93 at 133.07, or further to 55 week EMA (now at 131.33). Some support should be seen around this zone to bring rebound. However, sustained break of 55 week EMA will pave the way to 61.8% retracement at 121.43.
USD/CHF Daily Outlook
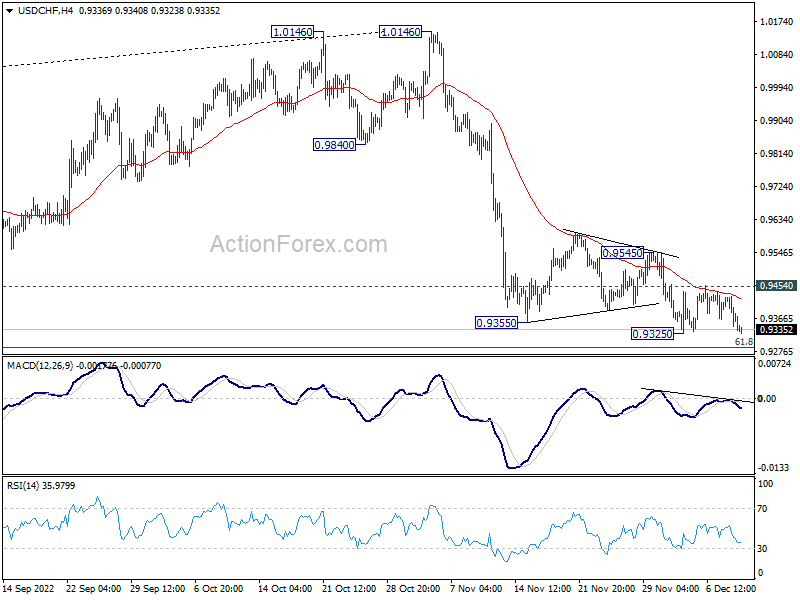
Daily Pivots: (S1) 0.9329; (P) 0.9378; (R1) 0.9412; More...
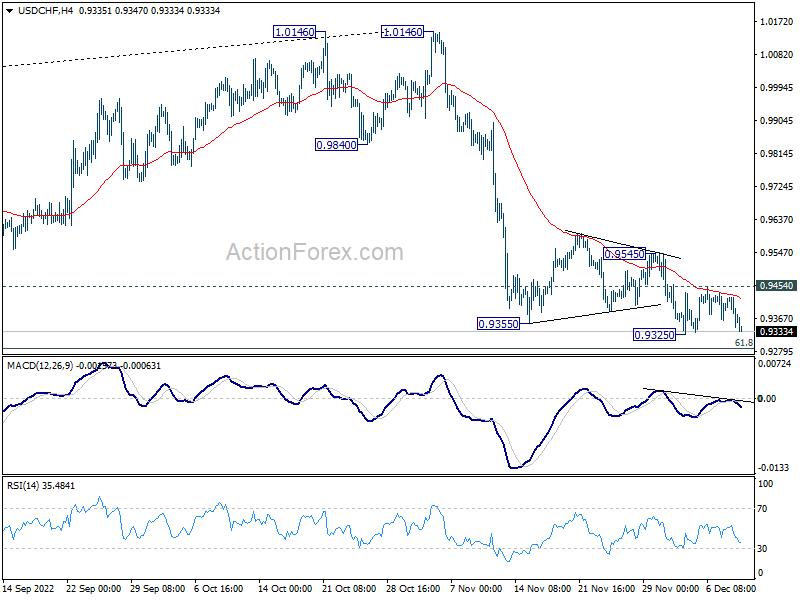
Intraday bias in USD/CHF remains neutral with focus on 0.9325 support. Firm break there will resume larger decline to 0.9287 fibonacci level. On the upside, however, break of 0.9454 resistance will now indicate short term bottoming. Intraday bias will be turned back to the upside for 0.9545 resistance and above.
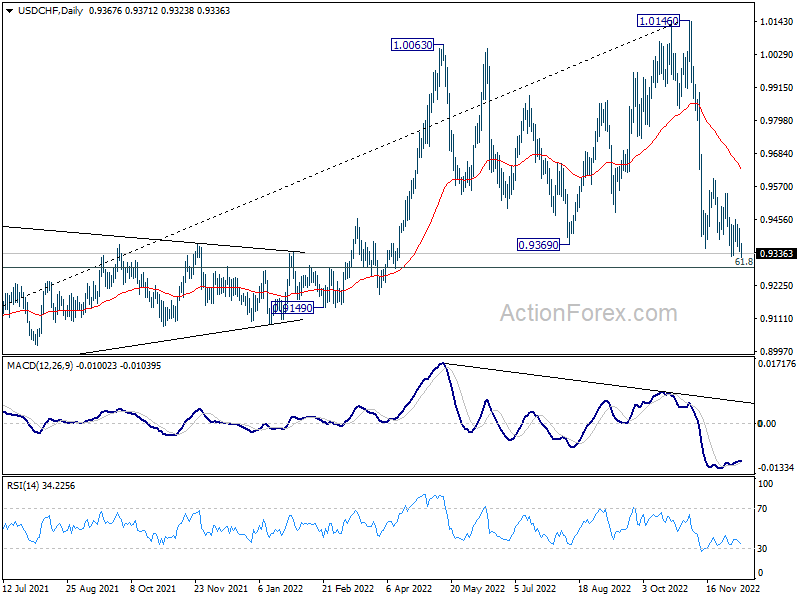
In the bigger picture, rise from 0.8756 (2021 low) has completed at 1.0146, well ahead of 1.0342 long term resistance (2016 high). Based on current downside momentum, fall from 1.0146 might be a medium term down trend itself. Break of 61.8% retracement of 0.8756 to 1.0146 at 0.9287 will pave the way to 0.8756. In any case, risk will stay on the downside as long as 55 day EMA (now at 0.9630) holds.
GBP/USD Daily Outlook
Daily Pivots: (S1) 1.2178; (P) 1.2213; (R1) 1.2271; More...
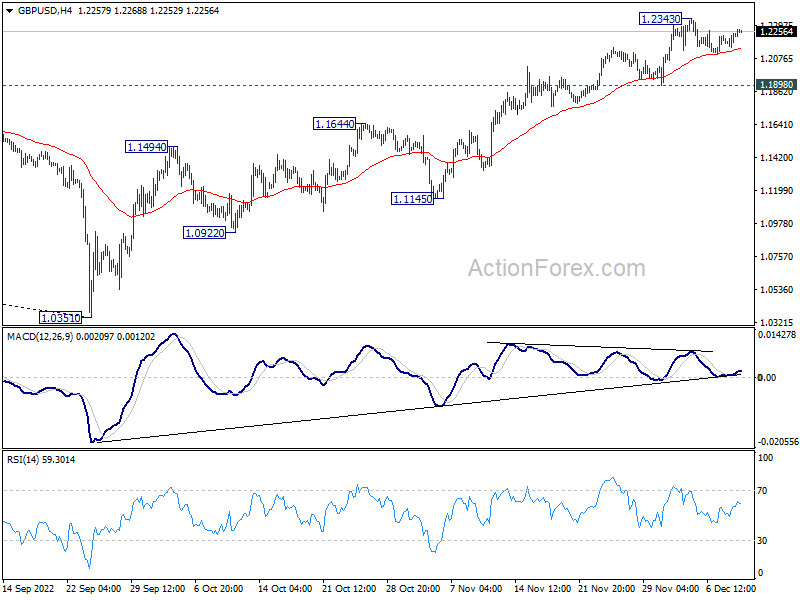
GBP/USD is still bounded in range trading below 1.2343 and intraday bias remains neutral at this point. Further rise remains mildly in favor as long as 1.1898 support holds. On the upside, break of 1.2343 will resume the rally from 1.0351 and target 1.2759 medium term fibonacci level next. However, firm break of 1.1898 support will confirm short term topping and turn bias back to the downside.
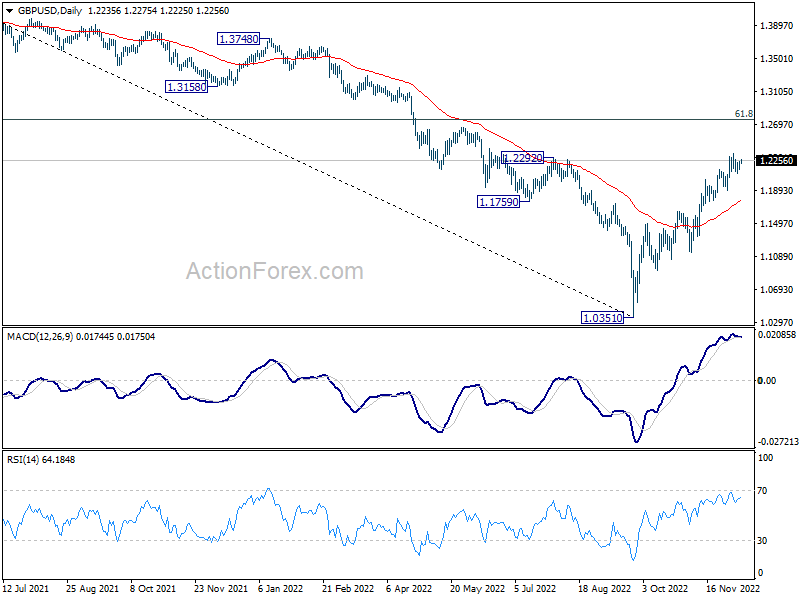
In the bigger picture, rise from 1.0351 medium term bottom is at least correcting whole down trend from 1.4248 (2021 high). Further rise is expected as long as 1.1644 resistance turned support holds. Next target is 61.8% retracement of 1.4248 to 1.0351 at 1.2759. Sustained break there will pave the way back to 1.4248.
EUR/USD Daily Outlook
Daily Pivots: (S1) 1.0508; (P) 1.0537; (R1) 1.0583; More...
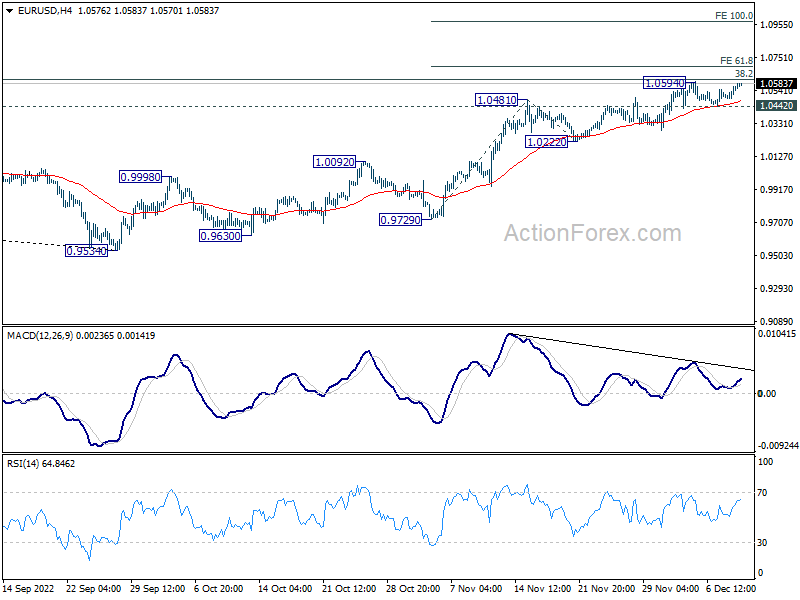
With current rebound, focus is back on 1.0594/0609 resistance zone (1.0609 medium term fibonacci level) in EUR/USD. Firm break there will carry larger bullish implication. Next near term target is 61.8% projection of 0.9729 to 1.0481 from 1.0222 at 1.0687, and then 100% projection at 1.0974. Nevertheless, on the downside, break of 1.0442 support should confirm short term topping and turn bias back to the downside for 1.0222 support.
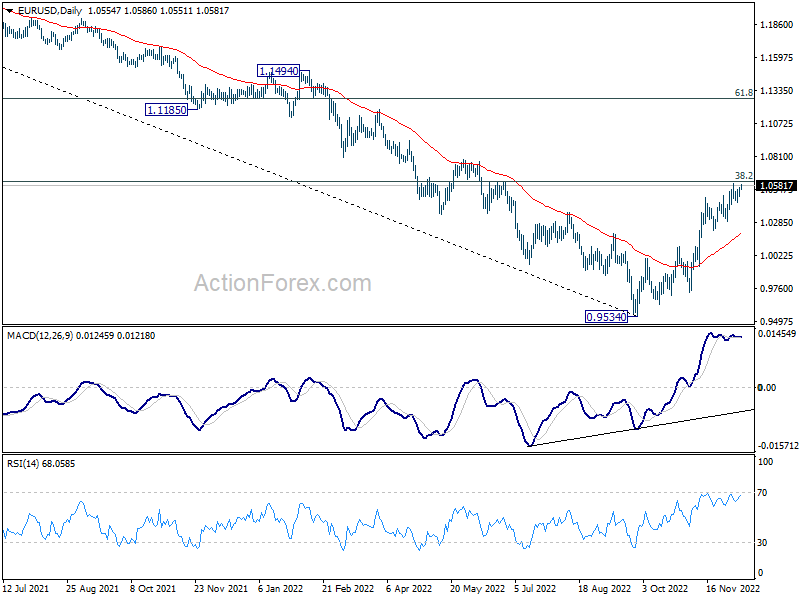
In the bigger picture, a medium term bottom was in place at 0.9534, on bullish convergence condition in daily MACD. Even as a corrective rise, rally from 0.9534 should target 38.2% retracement of 1.2348 (2021 high) to 0.9534 at 1.0609. Sustained trading above 55 week EMA (now at 1.0557) will raise the chance of trend reversal and target 61.8% retracement at 1.1273. However, rejection by 1.0609 will retain medium term bearishness for down trend resumption at a later stage.
Dollar Extending Decline, Ready for Downside Breakout?
Dollar is again under some selling pressure in Asian session and looks set to resume recent decline against European majors. Yet, with trading subdued, it's doubtful whether selloff in the greenback would sustain. Traders would more likely hold off large bets until next week's FOMC rate decision and economic projections. As for the week, Yen is currently the worst performer, followed by Canadian and Sterling. Euro and Swiss Franc are the strongest ones, followed by Dollar. Aussie and Kiwi are mixed.
Technically, USD/CHF is on the verge of breaking 0.9325 temporary low. But the key would lie in 0.9287 medium term fibonacci support (61.8% retracement of 0.8756 to 1.0146). Strong support could be seen there to bring sustainable rebound. And break of 0.9454 resistance should now confirms short term bottoming. EUR/USD's reaction to 38.2% retracement of 1.2348 (2021 high) to 0.9534 at 1.0609 should be watched simultaneously to gauge the Dollar's downside momentum.
In Asia, at the time of writing, Nikkei is up 1.26%. Hong Kong HSI is up 1.64%. China Shanghai SSE is up 0.08%. Singapore Strait Times is up 0.19%. Japan 10-year JGB yield is down -0.0018 at 0.255. Overnight, DOW rose 0.55%. S&P 500 rose 0.75%. NASDAQ rose 1.13%. 10-year yield rose 0.083 to 3.491, after falling to 3.448.
BoC Kozicki: We will be considering whether to increase rates further
BoC Governor Deputy Governor Sharon Kozicki said in speech yesterday, "going forward, we will be considering whether to increase rates further".
"By that, we mean that we expect our decisions will be more data-dependent," she said. "If we are surprised on the upside, we are still prepared to be forceful. But we recognize that we have raised interest rates rapidly and that their effects are working their way through the economy."
"In other words, we are moving from how much to raise interest rates to whether to raise interest rates," she added.
China CPI slowed to 1.6% yoy in Nov, core CPI down -0.6% yoy
China CPI slowed from 2.1% yoy to 1.6% yoy in November, below expectation of 1.7% yoy. Core CPI, excluding food and energy, was down -0.6% yoy, unchanged from October. Food prices slowed from 7.0% yoy to 3.7% yoy. Non-food prices were unchanged at 1.1% yoy.
"In November, due to the domestic epidemic, seasonal factors, and a higher base of comparison in the same period last year, CPI turned from rising to falling month on month and fell back year on year," said chief NBS statistician Dong Lijuan.
PPI was unchanged at -1.3% yoy, above expectation of -1.5% yoy. "In November, PPI rose slightly month on month as a result of price increases in coal, oil and non-ferrous metals, and continued to fall year on year due to a high base of comparison from the same period last year," added Dong.
Looking ahead
Canada will release capacity utilization. US will release PPI but a bigger focus would be on U of Michigan consumer sentiment.
EUR/USD Daily Outlook
Daily Pivots: (S1) 1.0508; (P) 1.0537; (R1) 1.0583; More...
With current rebound, focus is back on 1.0594/0609 resistance zone (1.0609 medium term fibonacci level) in EUR/USD. Firm break there will carry larger bullish implication. Next near term target is 61.8% projection of 0.9729 to 1.0481 from 1.0222 at 1.0687, and then 100% projection at 1.0974. Nevertheless, on the downside, break of 1.0442 support should confirm short term topping and turn bias back to the downside for 1.0222 support.
In the bigger picture, a medium term bottom was in place at 0.9534, on bullish convergence condition in daily MACD. Even as a corrective rise, rally from 0.9534 should target 38.2% retracement of 1.2348 (2021 high) to 0.9534 at 1.0609. Sustained trading above 55 week EMA (now at 1.0557) will raise the chance of trend reversal and target 61.8% retracement at 1.1273. However, rejection by 1.0609 will retain medium term bearishness for down trend resumption at a later stage.
Economic Indicators Update
| GMT | Ccy | Events | Actual | Forecast | Previous | Revised |
|---|---|---|---|---|---|---|
| 23:50 | JPY | Money Supply M2+CD Y/Y Nov | 3.10% | 3.00% | 3.10% | |
| 01:30 | CNY | CPI Y/Y Nov | 1.60% | 1.70% | 2.10% | |
| 01:30 | CNY | PPI Y/Y Nov | -1.30% | -1.50% | -1.30% | |
| 13:30 | CAD | Capacity Utilization Q3 | 83.00% | 83.80% | ||
| 13:30 | USD | PPI M/M Nov | 0.10% | 0.20% | ||
| 13:30 | USD | PPI Y/Y Nov | 7.40% | 8.00% | ||
| 13:30 | USD | PPI Core M/M Nov | 0.30% | 0.00% | ||
| 13:30 | USD | PPI Core Y/Y Nov | 6.00% | 6.70% | ||
| 15:00 | USD | Michigan Consumer Sentiment Index Dec P | 53.3 | 56.8 | ||
| 15:00 | USD | Wholesale Inventories Oct F | 0.80% | 0.80% |
Technical Outlook and Review
USD/JPY:
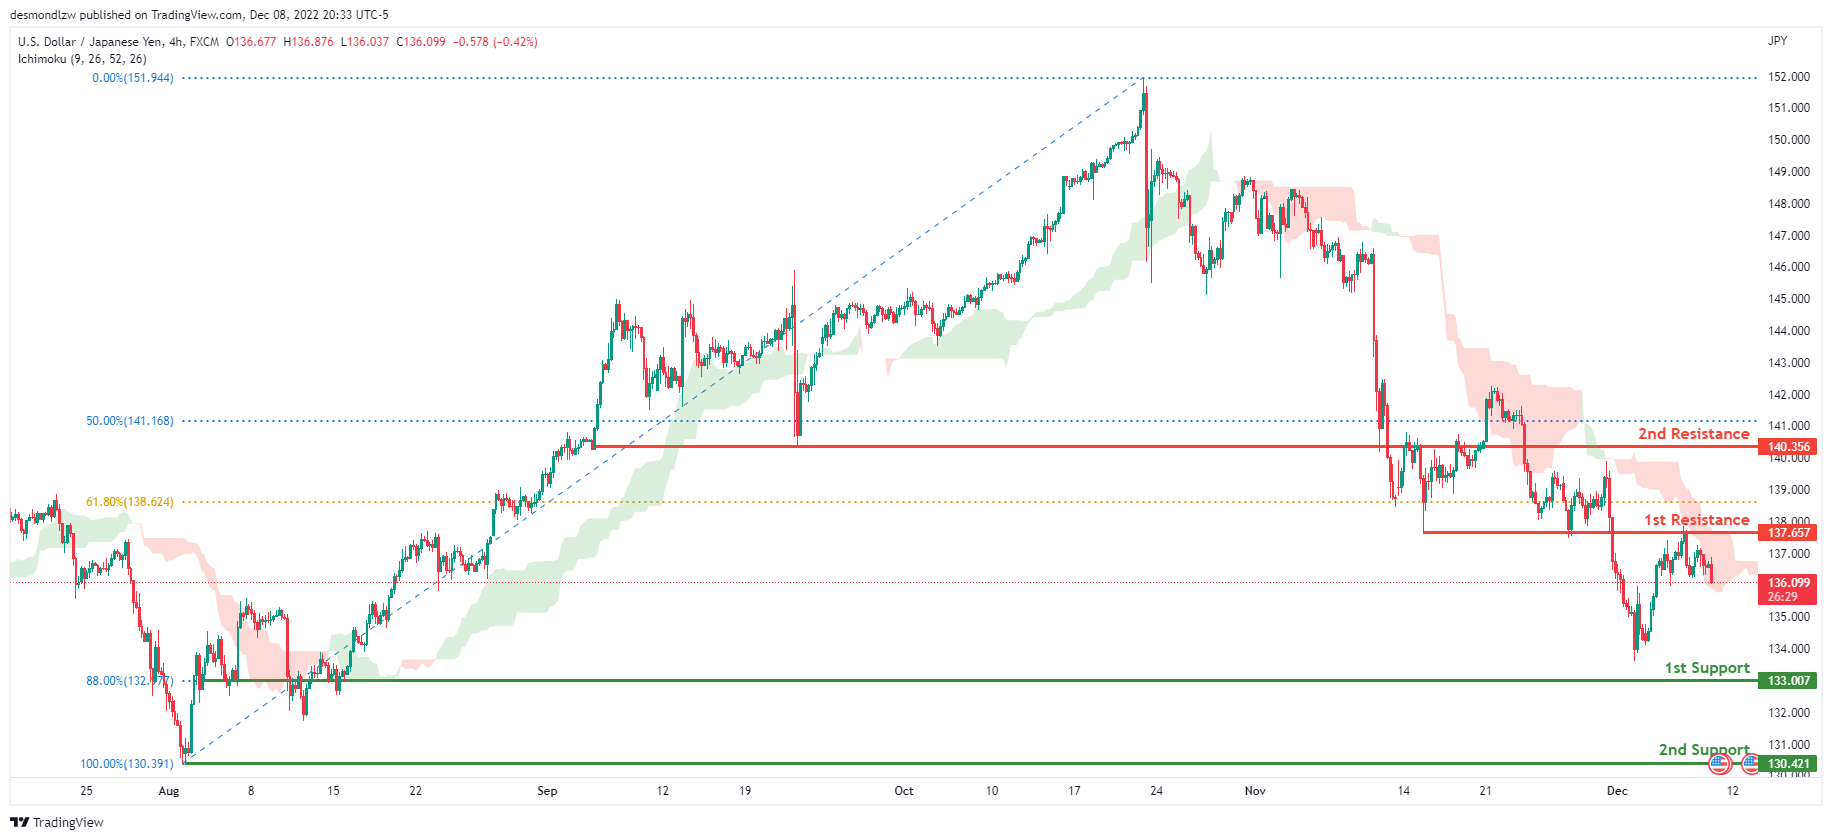
The current general bias for USDJPY on the H4 chart is bearish. To add confluence to this, the price is under the Ichimoku cloud which indicates a bearish market. If the bearish momentum continues, expect USDJPY to continue heading towards the 1st support at 133.007 where the 88% Fibonacci line is. In an alternative scenario, price could head back up to retest the 1st resistance line at 137.657, where the 61.8% Fibonacci line and previous low are located.
Areas of consideration:
- H4 time frame, 1st resistance at 137.657
- H4 time frame, 1st support at 133.007
DXY:
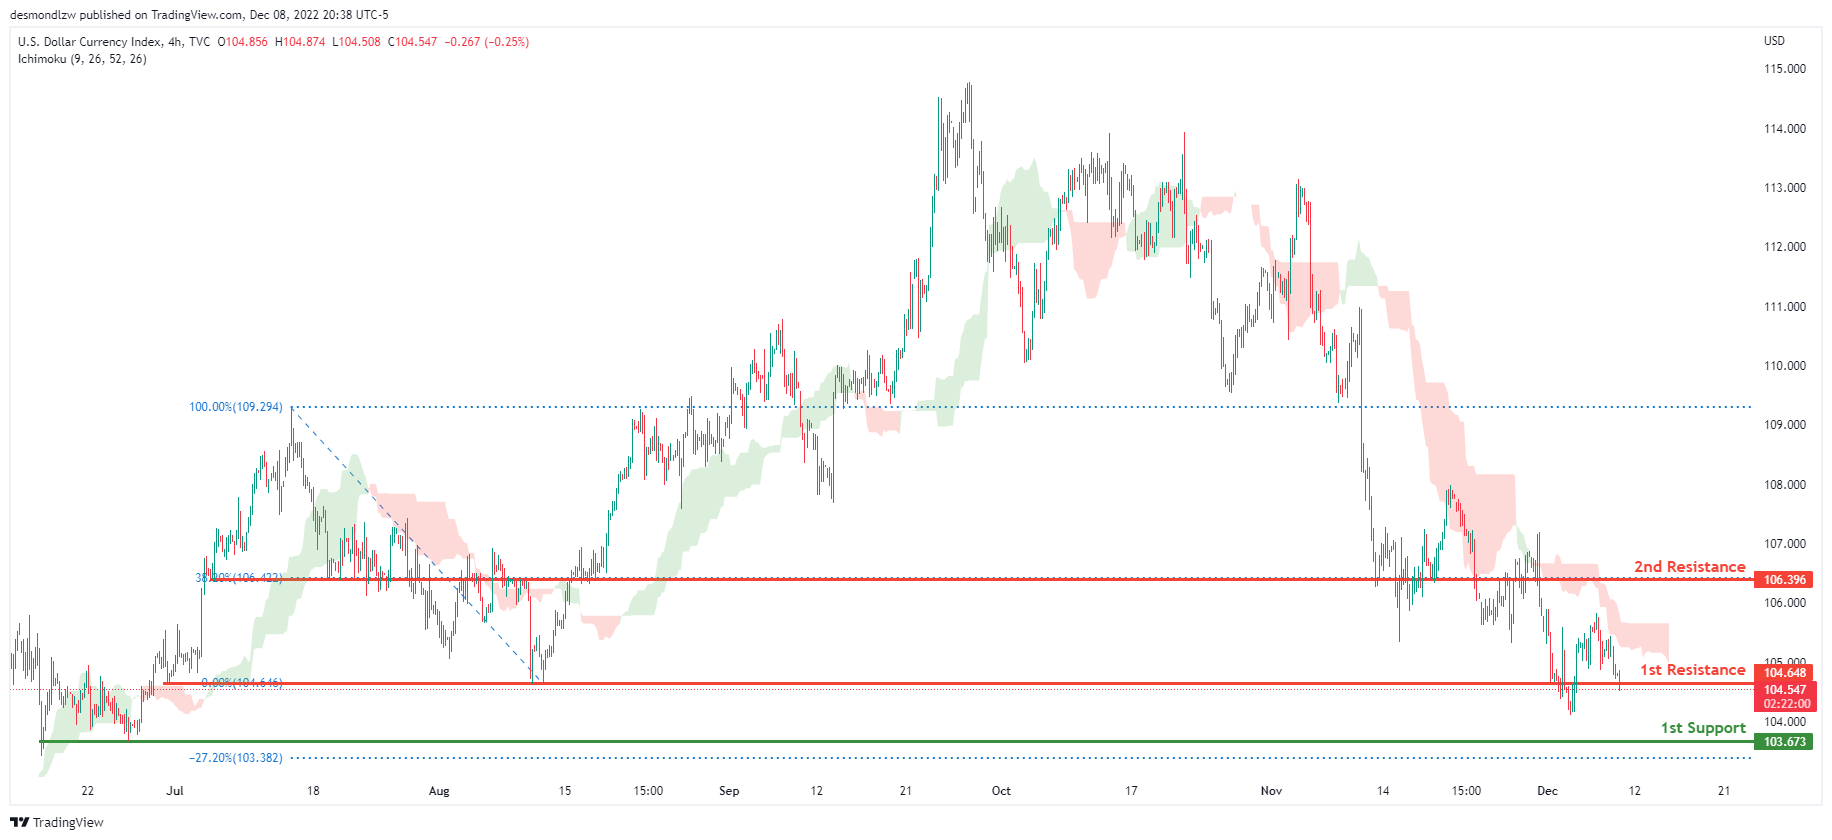
On the H4 chart, the overall bias for DXY is bearish. To add confluence to this, the price is below the Ichimoku cloud which indicates a bearish market. If this bearish momentum continues, expect the price to continue heading towards the 1st support line at 103.673, where the -27.2% Fibonacci expansion line and previous swing low is. In an alternative scenario, price could head back up and retest the 1st resistance line resistance at 104.648, where the previous swing low is.
Areas of consideration:
- H4 time frame, 1st resistance at 104.648
- H4 time frame, 1st support at 103.673
EUR/USD:
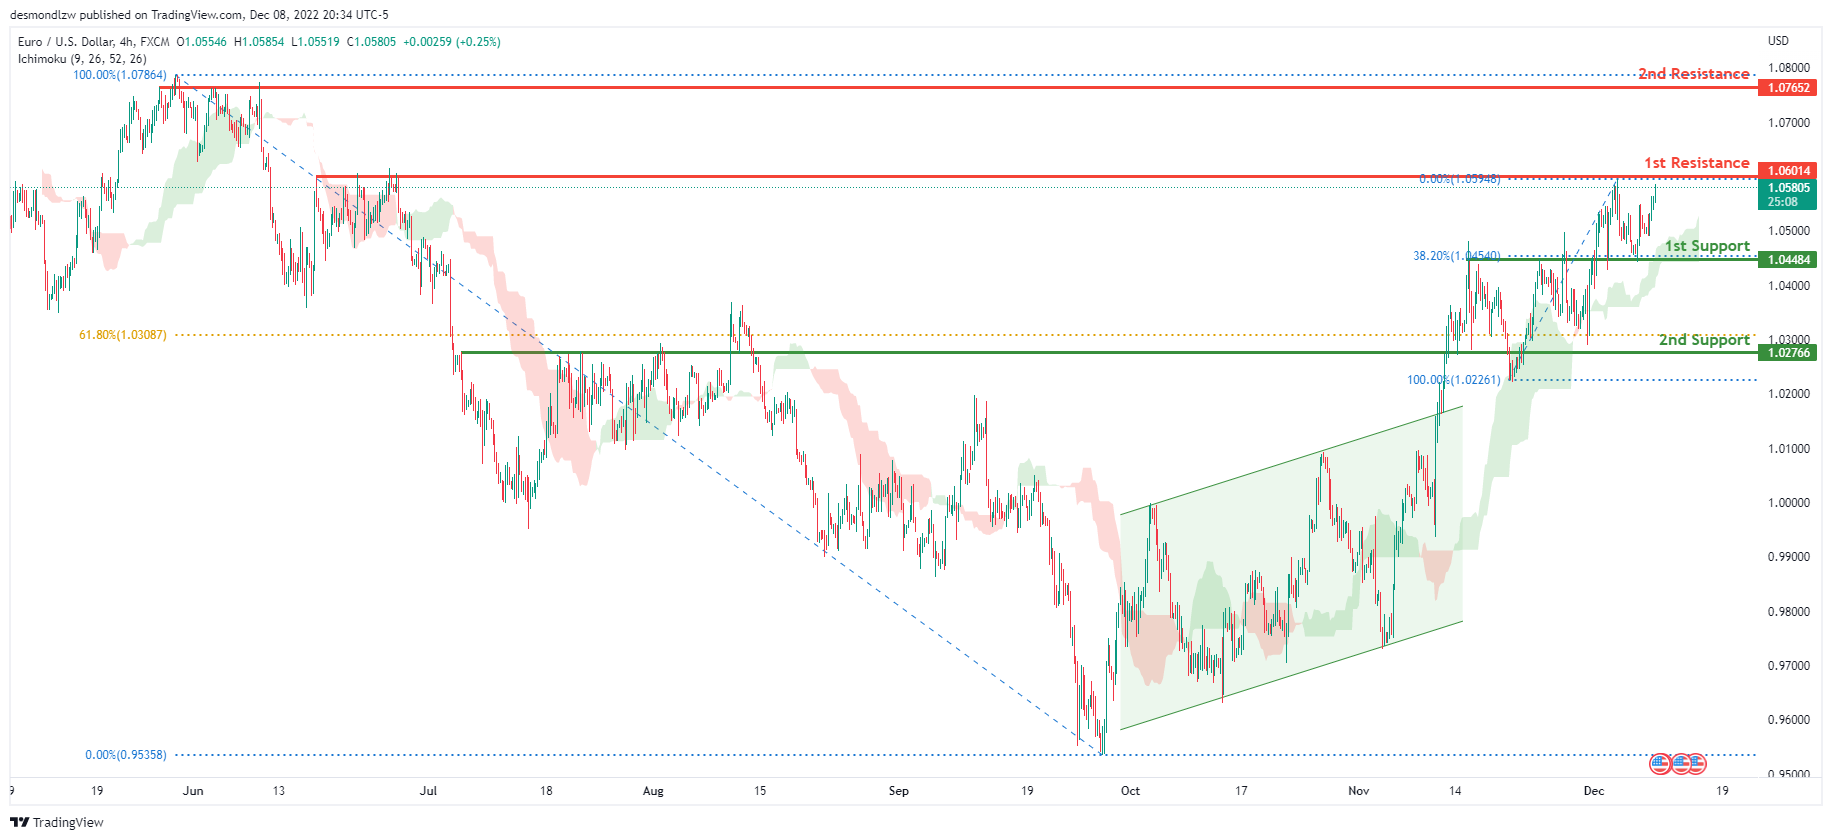
Looking at the H4 chart, my overall bias for EURUSD is bullish due to the current price being above the Ichimoku cloud, indicating a bullish market. To add confluence to this bias, price has also broken above the ascending bullish channel. If this bullish momentum continues, expect the price to possibly head towards the 1st resistance at 1.06014, where the previous swing high and 78.6% Fibonacci line are located., before heading towards the 2nd resistance at 1.07652, where the previous swing high is. In an alternate scenario, price could possibly head back down to break the 1st support level at 1.04484, where the previous high and 38.2% Fibonacci line are located before heading towards the 2nd support at 1.02766 where the 61.8% Fibonacci line is.
Areas of consideration :
- H4 1st resistance at 1.06014
- H4 1st support at 1.04484
- H4 2nd support at 1.02766
GBP/USD:
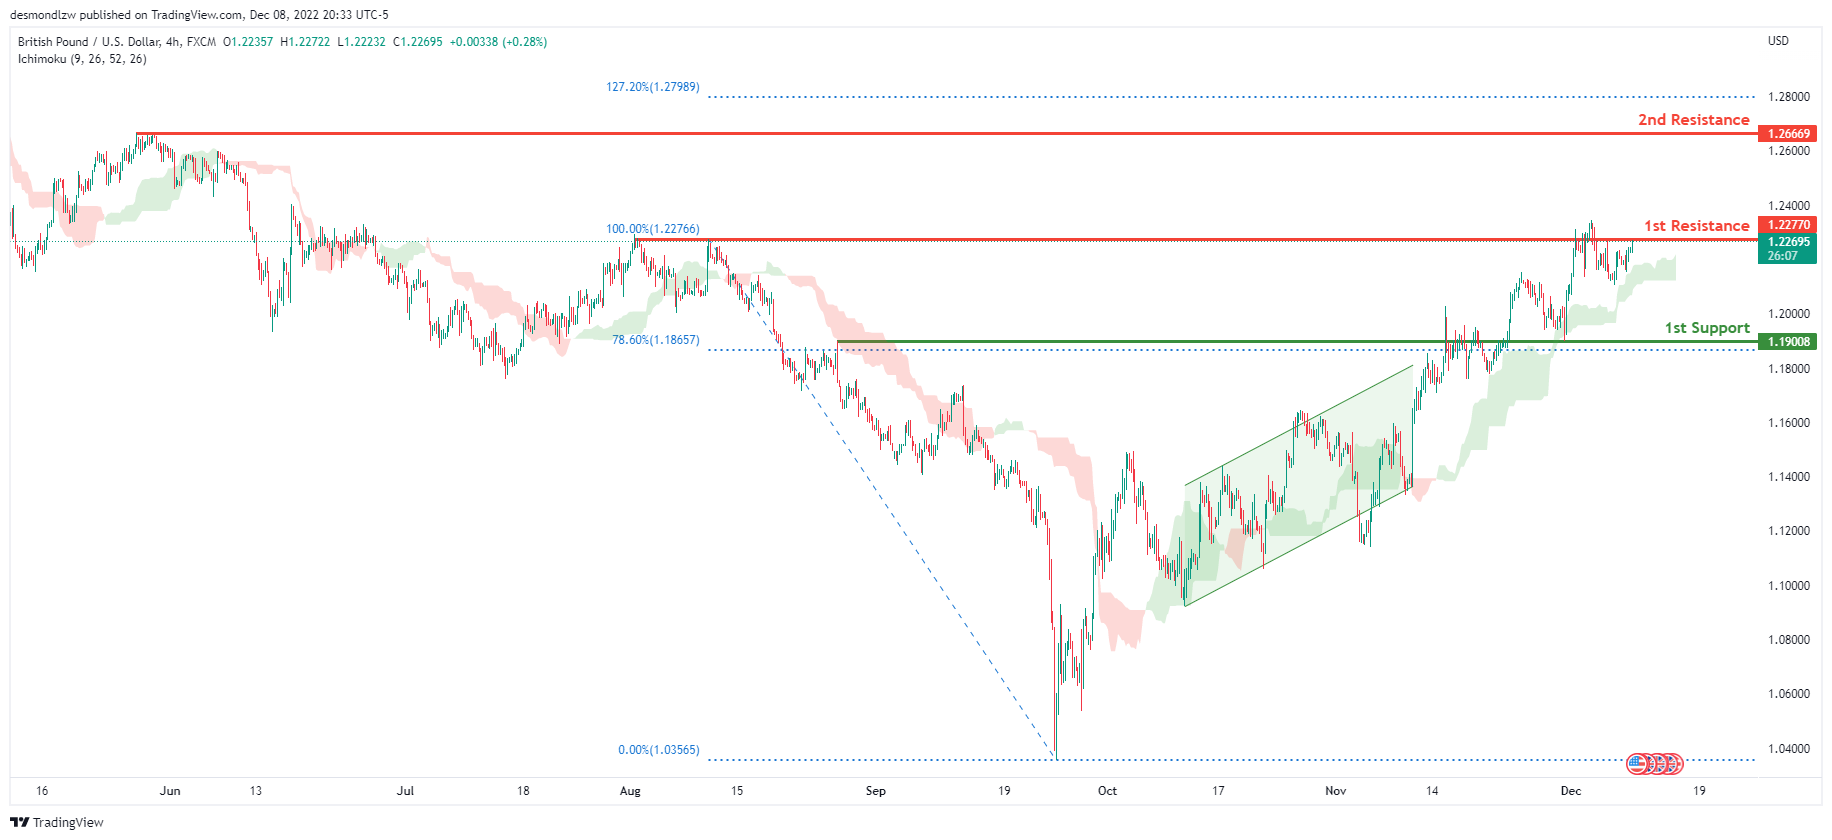
Looking at the H4 chart, my overall bias for GBPUSD is bullish due to the current price being above the Ichimoku cloud, indicating a bullish market. Expecting price to head back up to possibly break the 1st resistance line at 1.22770, where the previous high is, before heading towards the 2nd resistance at 1.26669, where the previous swing high is. In an alternative scenario, price could possibly head back down towards the 1st support at 1.19008, where the 78.6% Fibonacci line is.
Areas of consideration:
- H4 1st resistance at 1.22770
- H4 2nd resistance at 1.26669
- H4 1st support at 1.19008
USD/CHF:
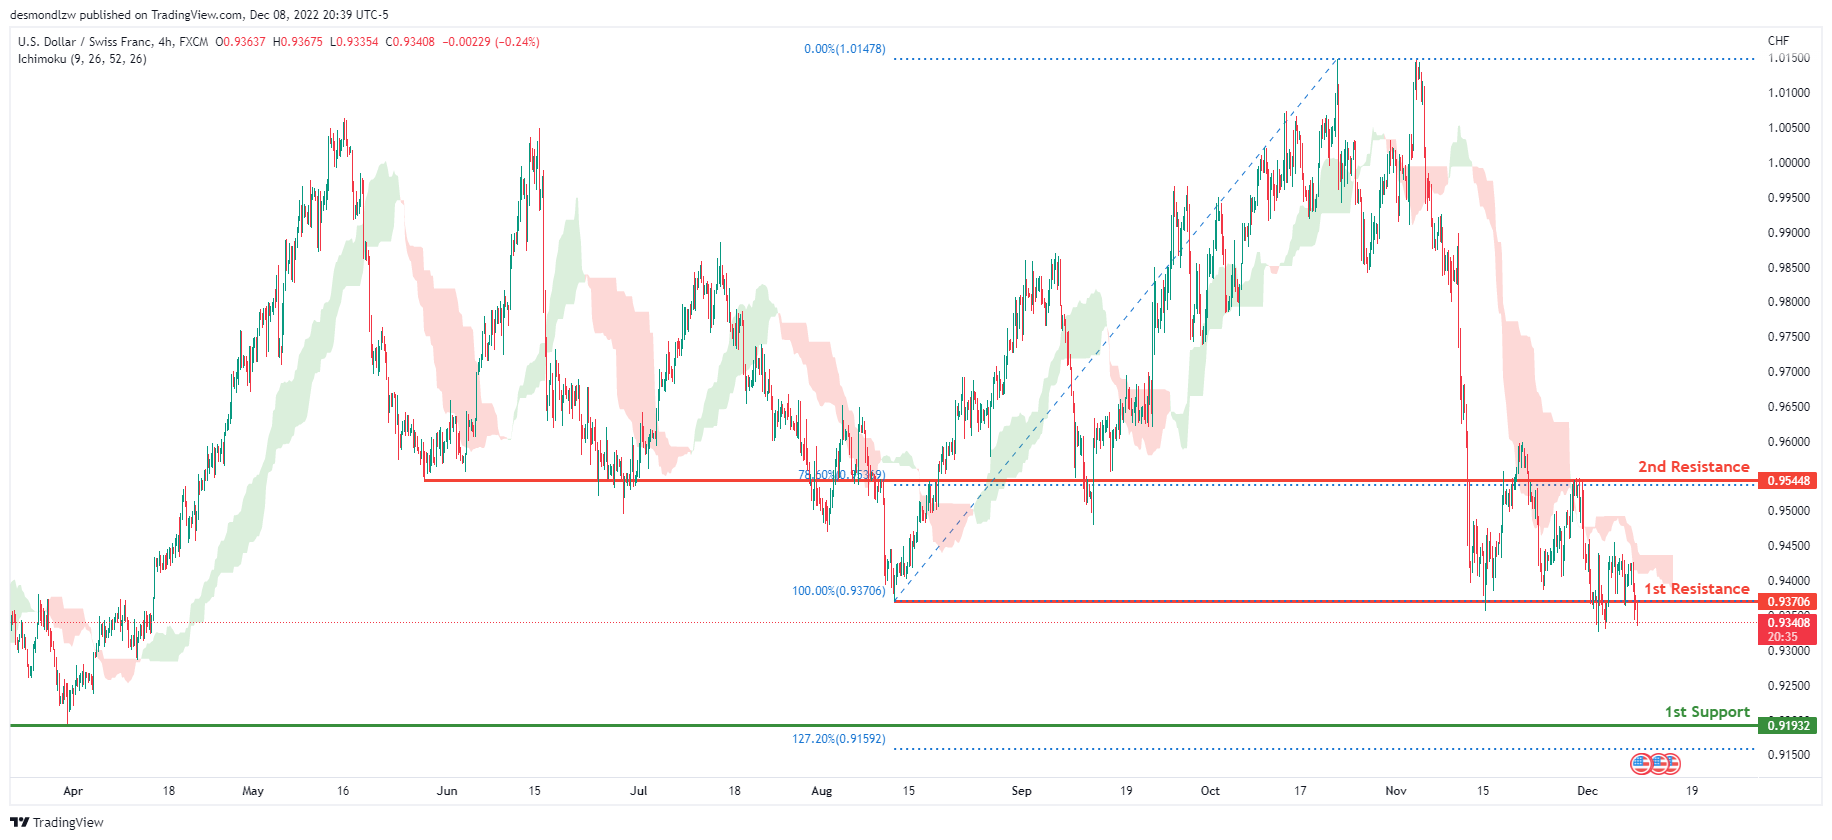
The overall bias for USDCHF on the H4 chart is bearish. In addition, the price is below the Ichimoku cloud, indicating a bearish market. If the current bearish trend continues, expect the price to head back down towards the 1st support line at 0.91932, where the previous swing low and 12.72% Fibonacci extension line is . In an alternative scenario, price could possibly head up towards the 1st resistance at 0.93706, where the previous swing low is .
Areas of consideration
- H4 1st support at 0.91932
- H4 1st resistance at 0.93706
XAU/USD (GOLD):
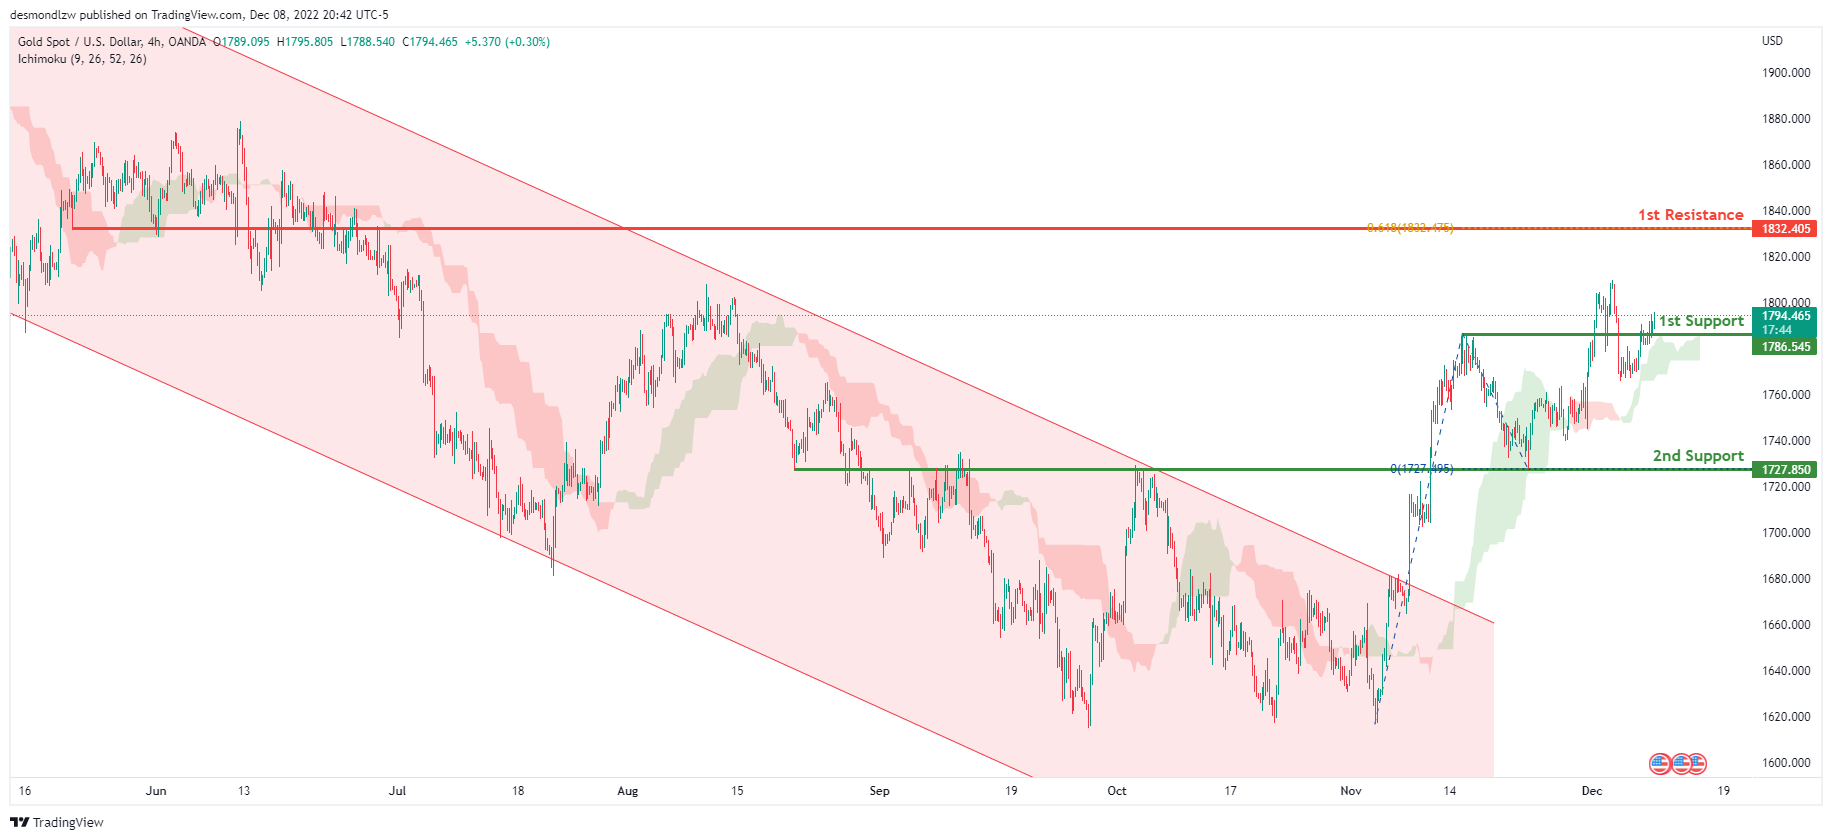
Looking at the H4 chart, my overall bias for XAUUSD is bullish due to the current price crossing above the Ichimoku cloud, indicating a bullish market. If this bullish momentum continues, expect the price to possibly head towards the 1st resistance at 1832.405, where the 61.8% Fibonacci projection line is. In an alternate scenario, price could possibly head back down towards the 1st support level at 1786.545, where the previous swing high is located
Areas of consideration:
- H4 time frame, 1st resistance at 1832.405
- H4 time frame, 1st support at 1786.545
AUD/USD:
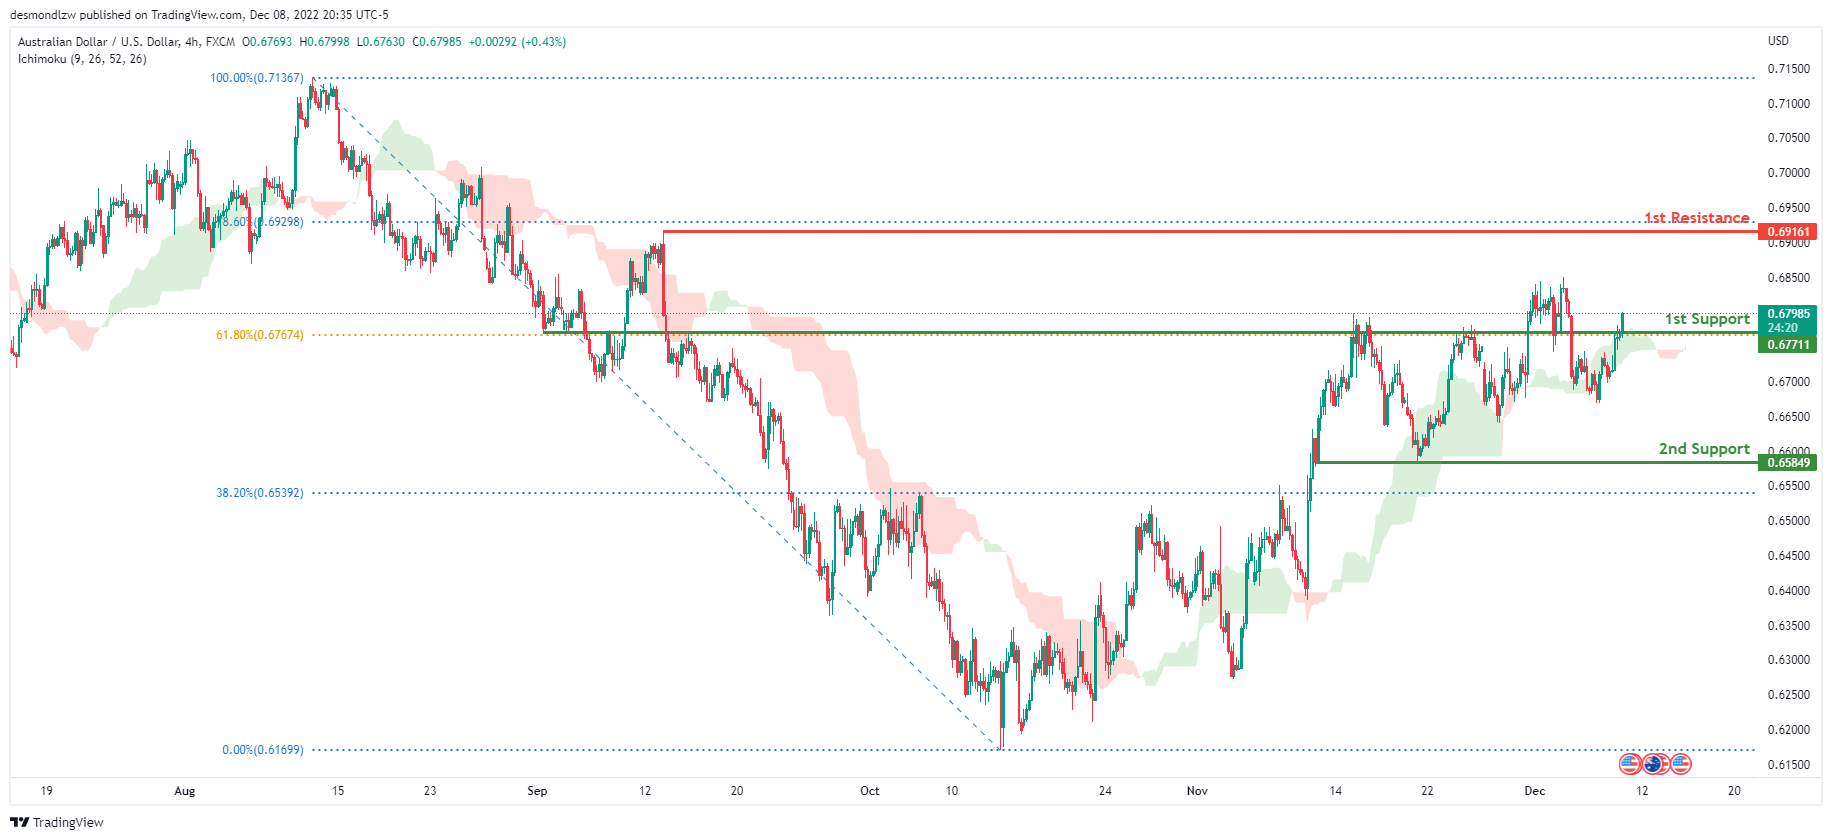
Looking at the H4 chart, my overall bias for AUDUSD is bullish due to the current price being above the Ichimoku cloud, indicating a bullish market.
If this bullish momentum continues, expect the price to head towards the 1st resistance at 0.69161, where the 78.6% Fibonacci line and previous swing high is. In an alternative scenario, price could possibly head back down to retest the 1st support line at 0.67711, where the 61.8% Fibonacci line is.
Areas of consideration
- H4, 1st resistance at 0.69161
- H4, 1st support at 0.67711
NZD/USD:
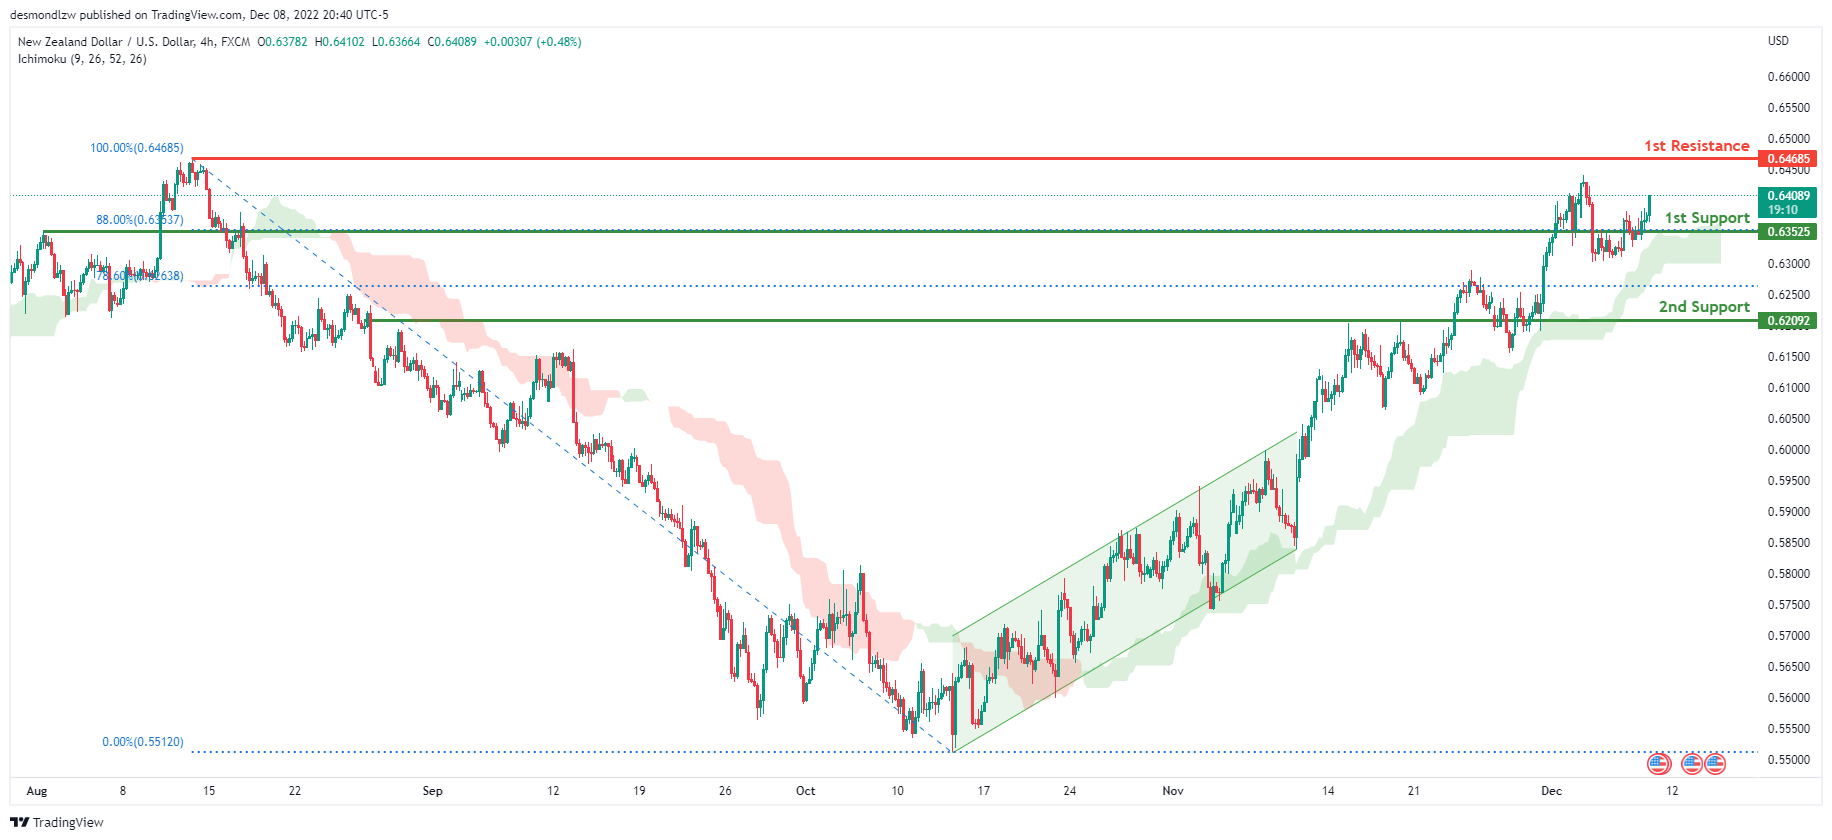
Looking at the H4 chart, my overall bias for NZDUSD is bullish due to the current price being above the Ichimoku cloud, indicating a bullish market.
To add confluence to this bias, price has broken out of the ascending channel. If this bullish momentum continues, expect the price to head up to the 1st resistance line at 0.64685, where the previous swing high is. Alternatively, the price may head back down towards the 1st support aat 0.63525, where the 88% Fibonacci line is.
Areas of consideration:
- H4 time frame, 1st resistance at 0.64685
- H4 time frame, 1st support at 0.63525
USD/CAD:
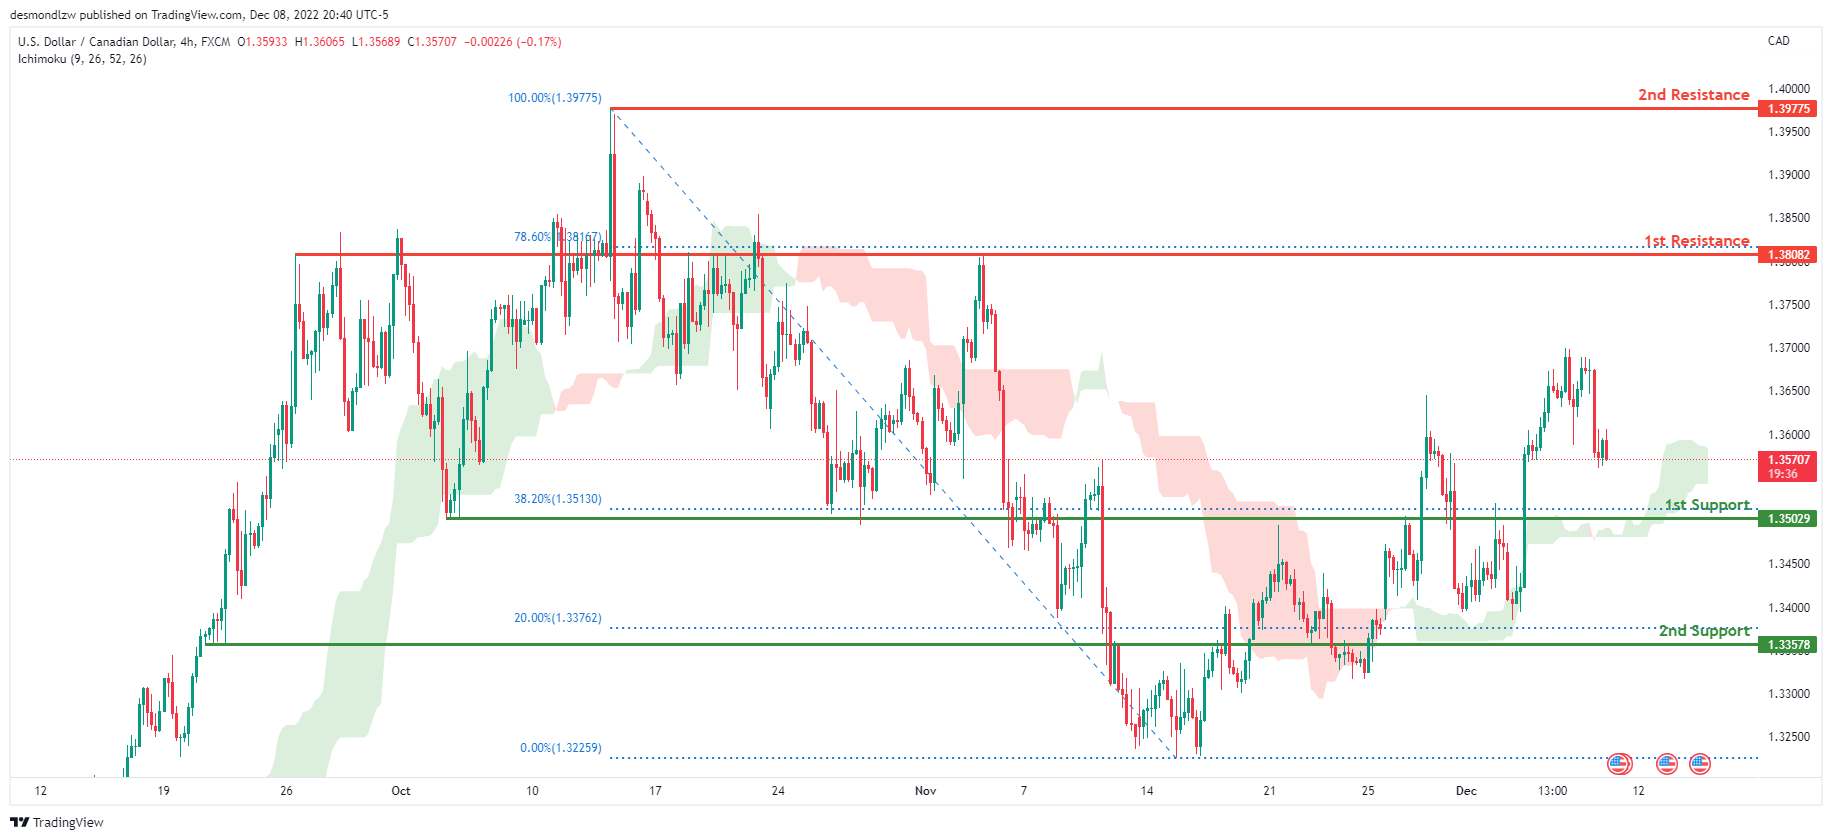
On the H4 chart, the overall bias for USDCAD is bullish. To add confluence to this, the price is above the Ichimoku cloud which indicates a bullish market. If this bullish momentum continues, expect the price to head towards 1st resistance line at 1.38082, where the 78.6% Fibonacci line is. In an alternative scenario, price could head back down to retest the 1st support at 1.35029, where the 38.2% Fibonacci line is.
Areas of consideration:
- H4 time frame, 1st resistance at 1.38082
- H4 time frame, 2nd resistance at 1.39775
- H4 time frame, 1st support at 1.35029
OIL:
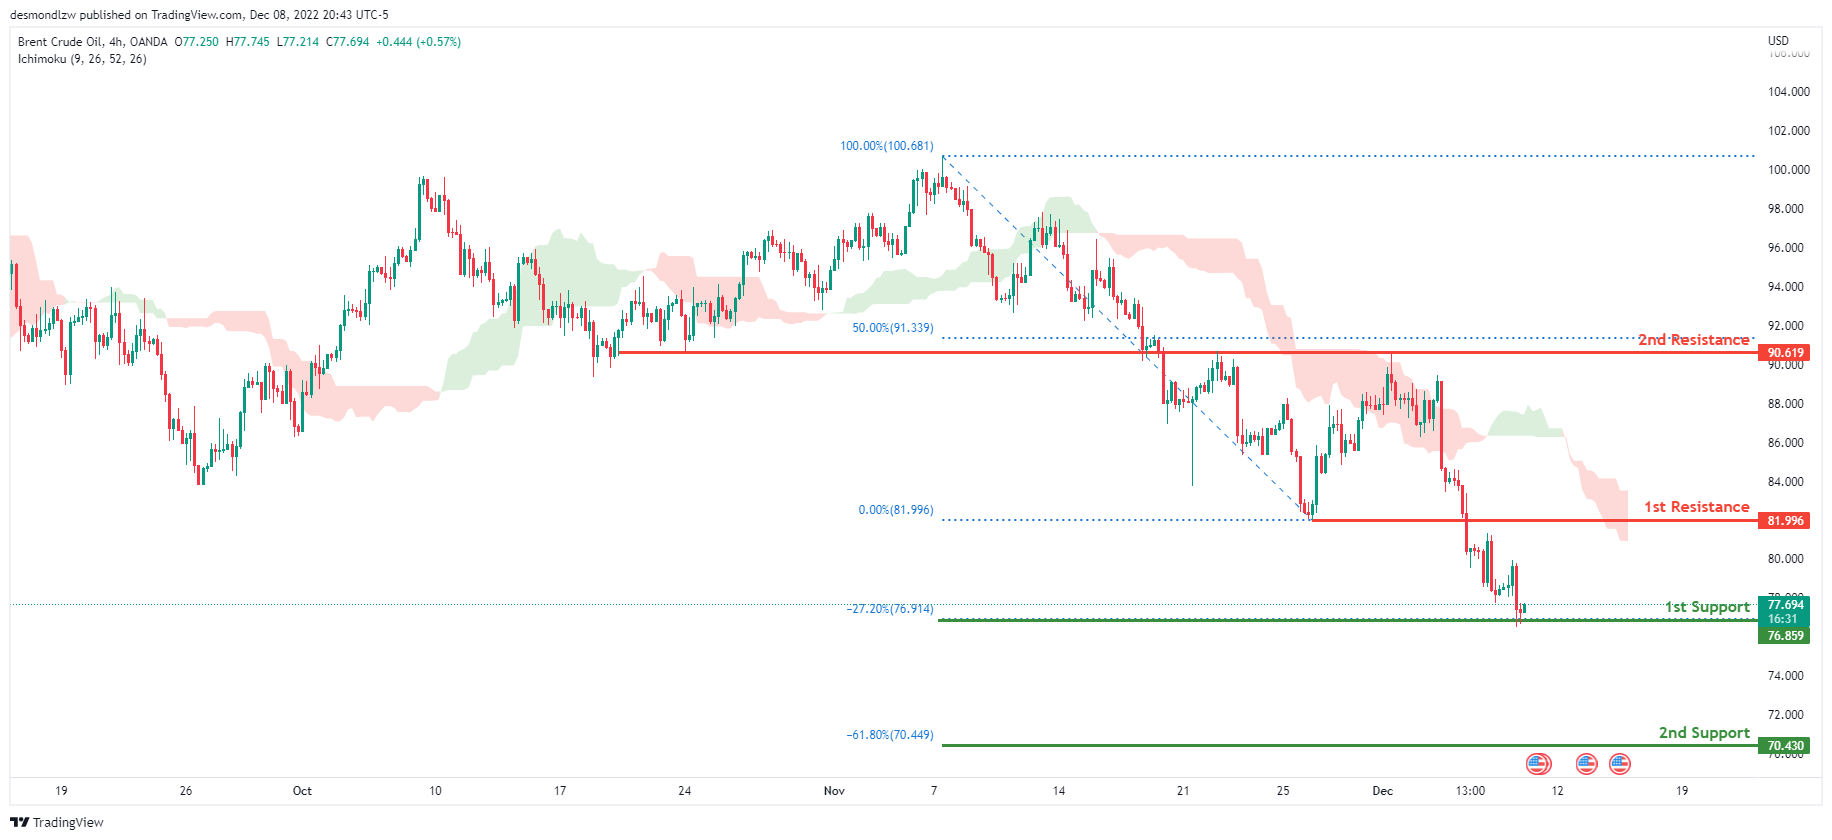
Looking at the H4 chart, my overall bias for BCOUSD is bearish due to the current price being below the Ichimoku cloud, indicating a bearish market. If this bearish momentum continues, expect price to possibly break the 1st support line at 76.859, where the -27.2% Fibonacci expansion line is, before heading towards the 2nd support at 70.430, where the -27.2% Fibonacci expansion line is. In an alternate scenario, price could possibly head back up to retest the 1st resistance line at 81.996, where the previous low is located.
Areas of consideration:
- H4 time frame, 1st resistance at 81.996
- H4 time frame, 1st support at 76.859
- H4 time frame, 2nd support at 70.430
Dow Jones Industrial Average:
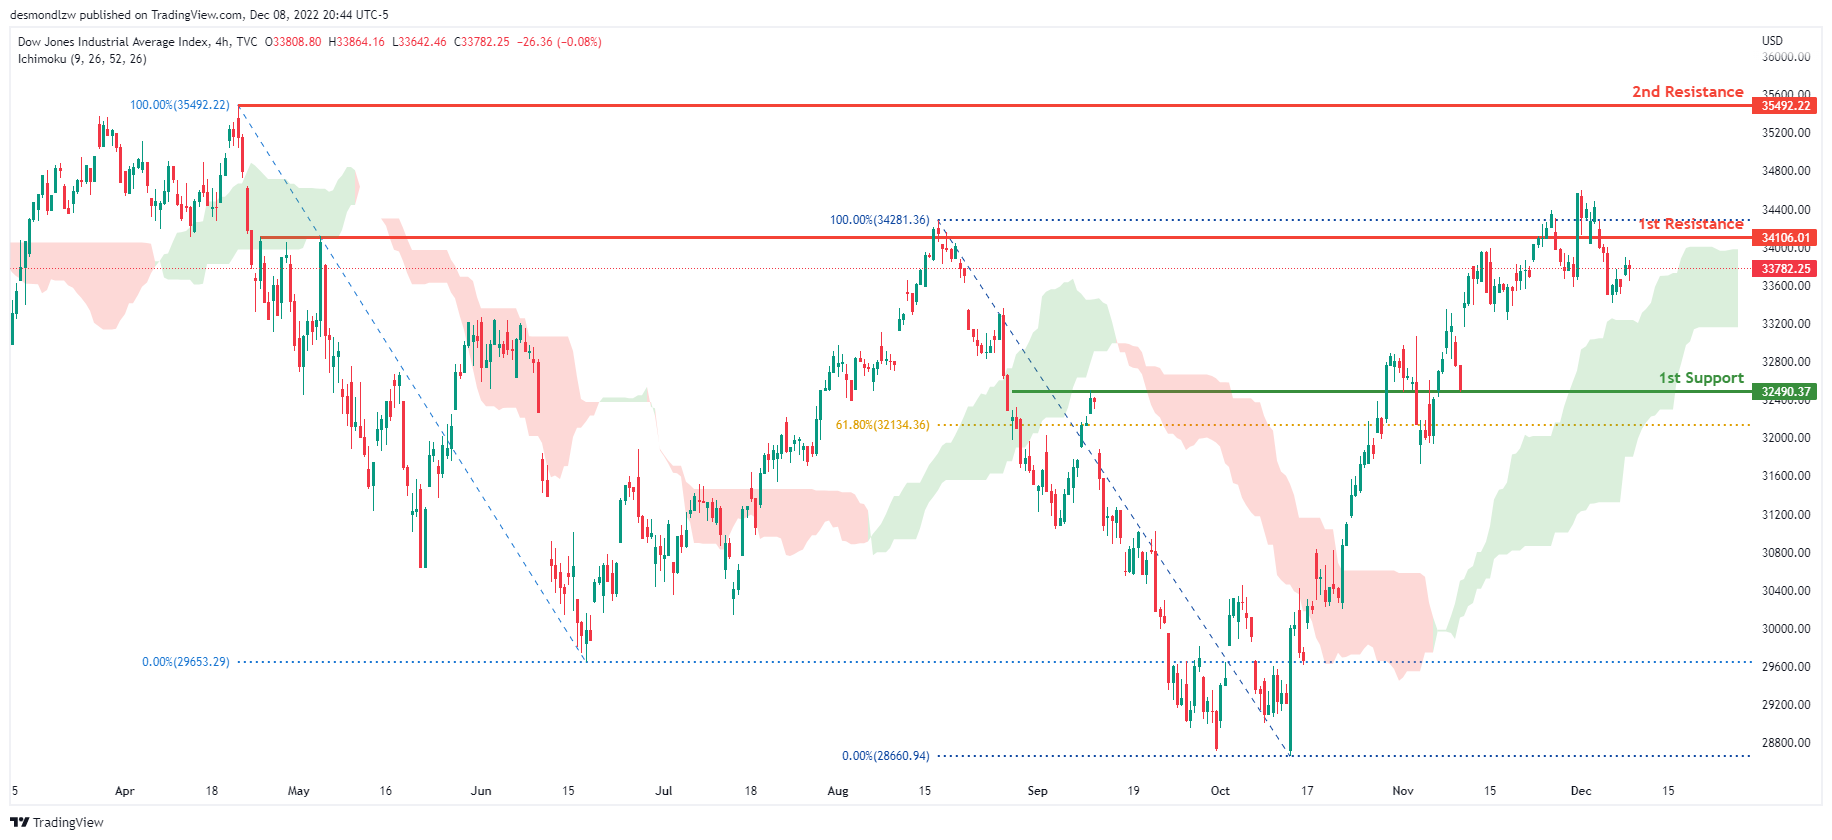
On the H4 chart, the overall bias for DJI is bullish. To add confluence to this, the price is above the Ichimoku cloud which indicates a bullish market. If this bullish momentum continues, expect the price to continue heading towards the 1st resistance line at 34106.01, where the previous swing high is. In an alternative scenario, price could head back down towards the 1st support at 32490.37, where the 61.8% Fibonacci line is.
Areas of consideration:
- H4 time frame, 1st support at 32490.37
- H4 time frame, 1st Resistance at 34106.01
DAX:
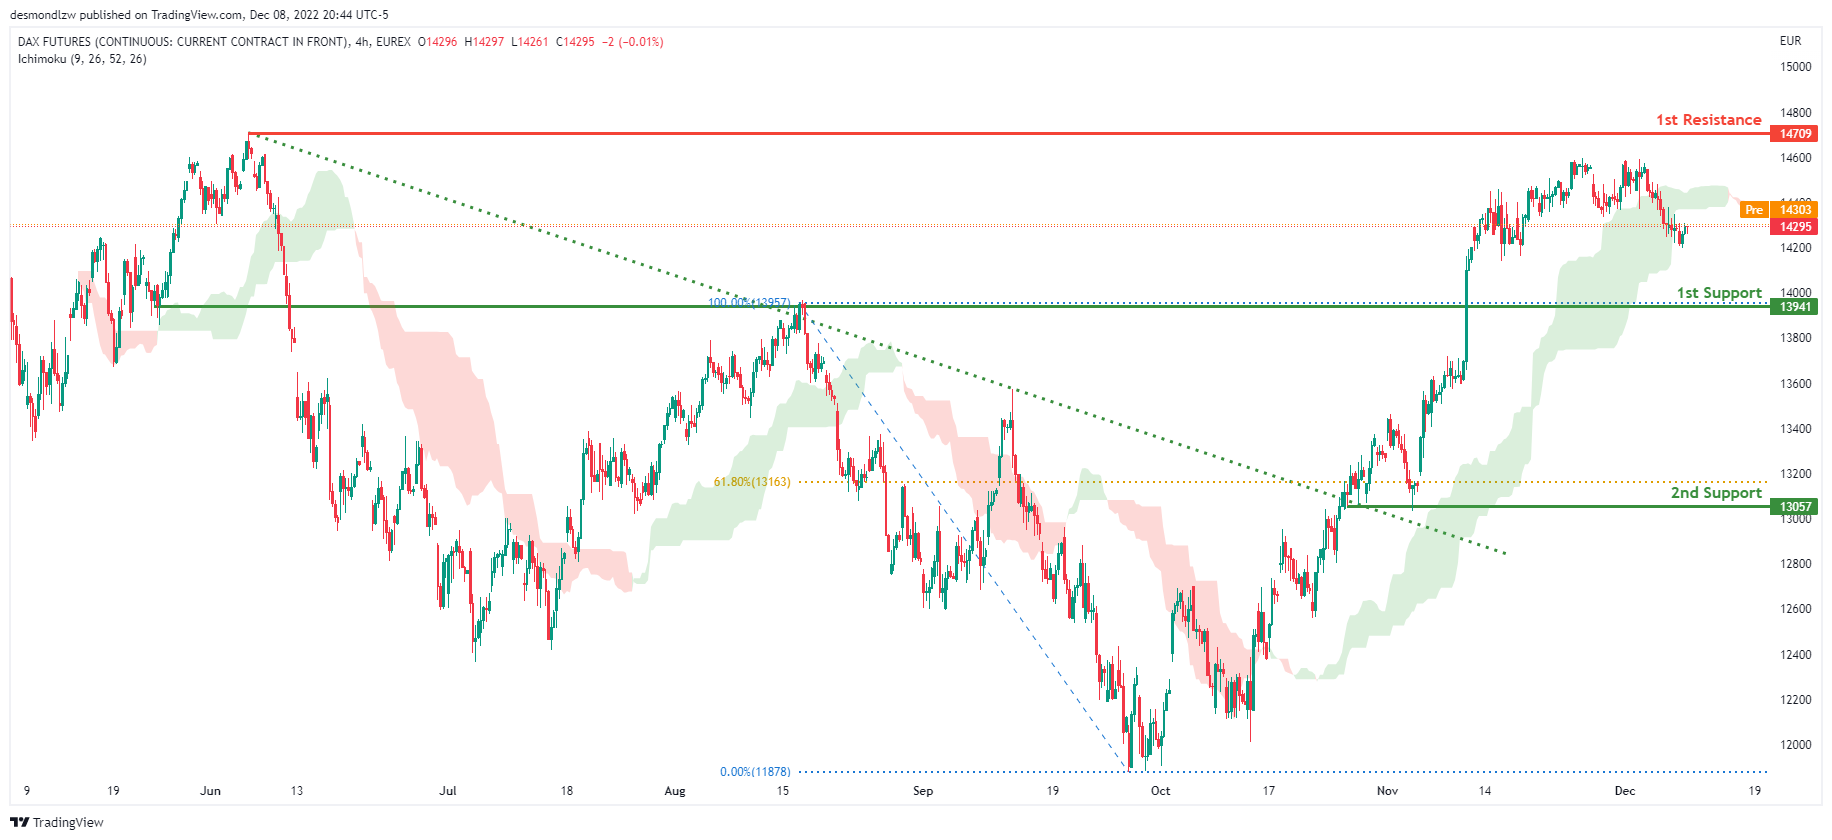
The H4 chart shows a bullish bias, with price breaking through the descending trendline and rising above the Ichimoku cloud. Price is expected to maintain its bullish momentum and rise to the first resistance level at 14709, where the previous swing high is located. Alternatively, the price could fall to the first support level at 13941, where the previous swing high was.
Areas of consideration:
- H4 time frame, 1st resistance is at 14709
- H4 time frame, 1st support is at 13941
ETHUSD:
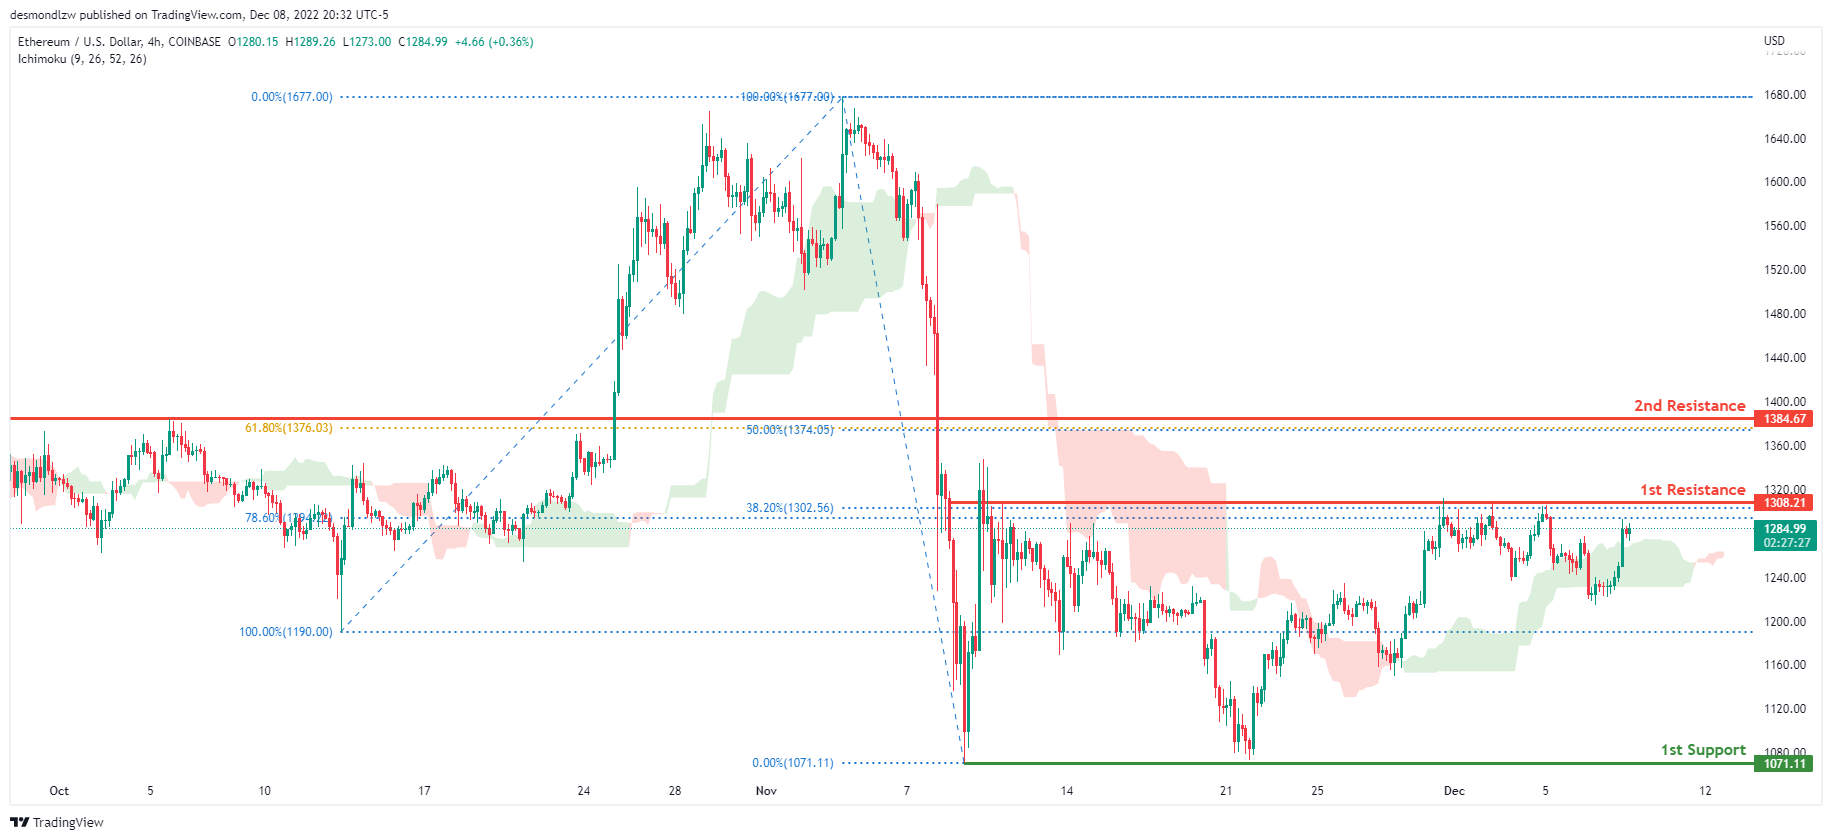
Looking at the H4 chart, my overall bias for ETHUSD is bullish due to the current price being above the Ichimoku cloud, indicating a bullish market. Expecting price to possibly break the 1st resistance at 1308.21, where the 38.2% and 78.6% Fibonacci lines are before heading towards the 2nd resistance line at 1384.67, where the 50% and 61.8% Fibonacci lines are. In an alternative scenario, price could head back down towards the 1st support at 1071.11, where the previous swing low is.
Areas of consideration:
- H4 time frame, 1st resistance of 1308.21
- H4 time frame, 2nd resistance of 1384.67
- H4 time frame, 1st support at 1071.11
BTCUSD:
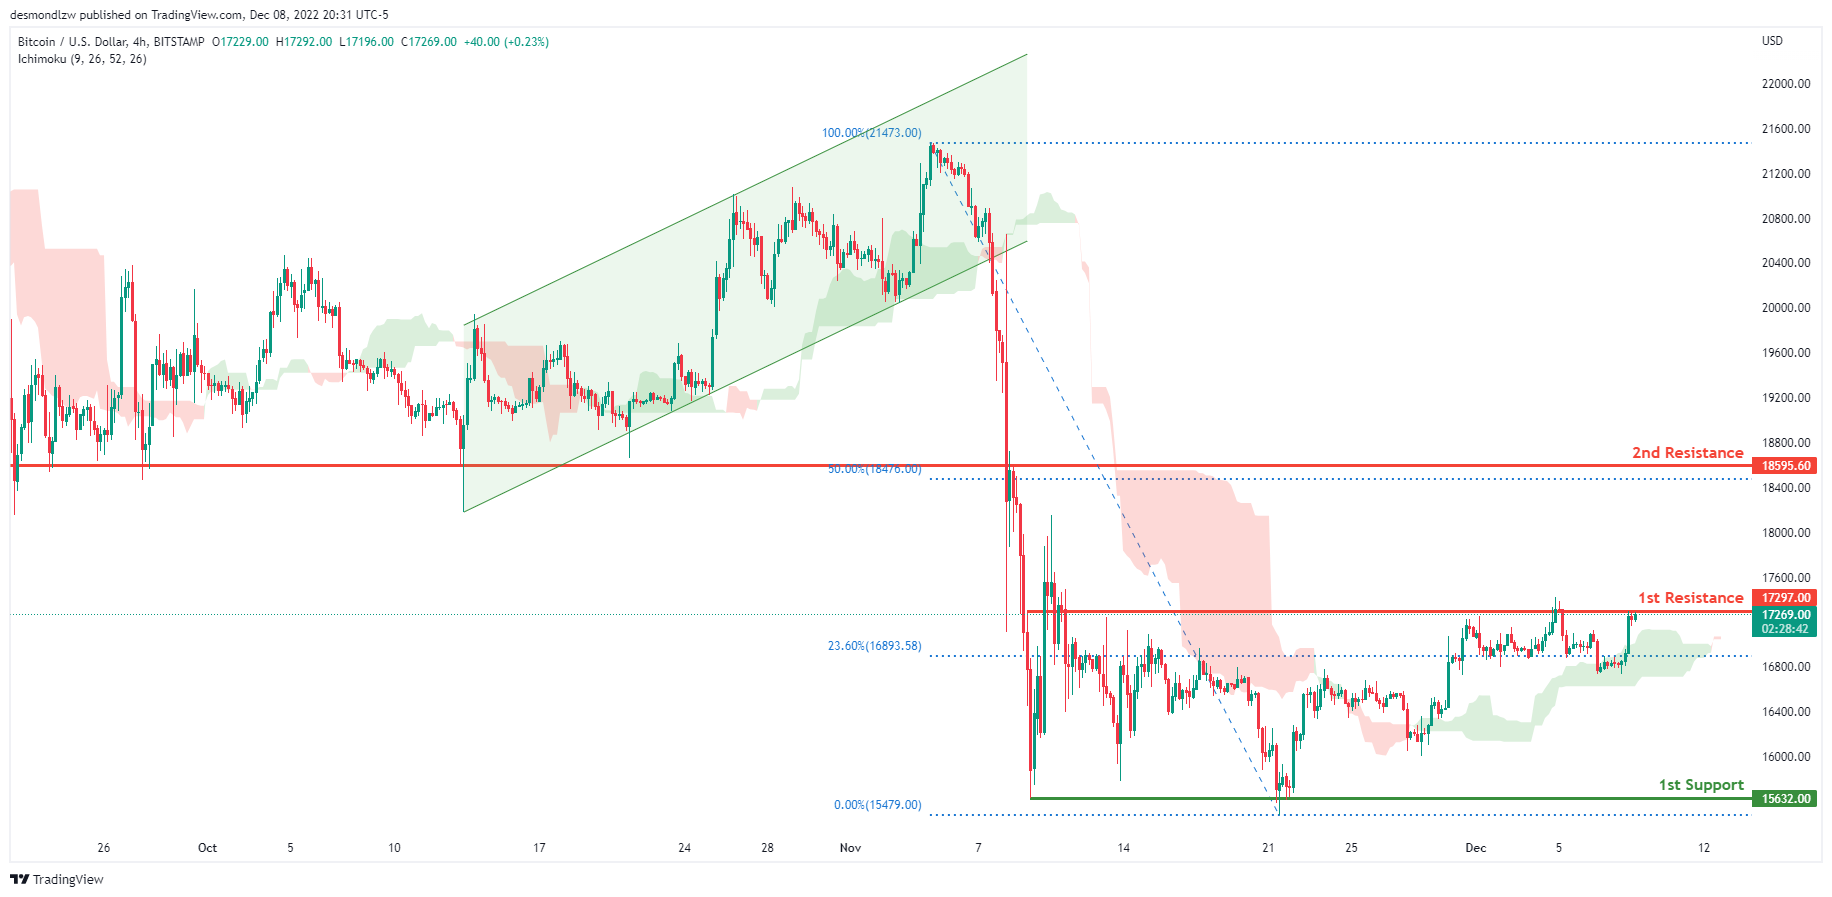
Looking at the H4 chart, my overall bias for BTCUSD is bullish due to the current price crossing above the Ichimoku cloud, indicating a bullish market. Expecting price to possibly break the 1st resistance at 17297.00, where the 23.6% Fibonacci line is before heading towards the 2nd resistance line at 18173.33, where the previous swing low is and 50% Fibonacci line are. In an alternative scenario, price could possibly head back down towards the 1st support at 15632.00, where the previous swing low is.
Areas of consideration:
- H4 time frame, 1st resistance 17297.00
- H4 time frame, 2nd resistance 18173.33
- H4 time frame, 1st support at 15632.00
S&P 500:
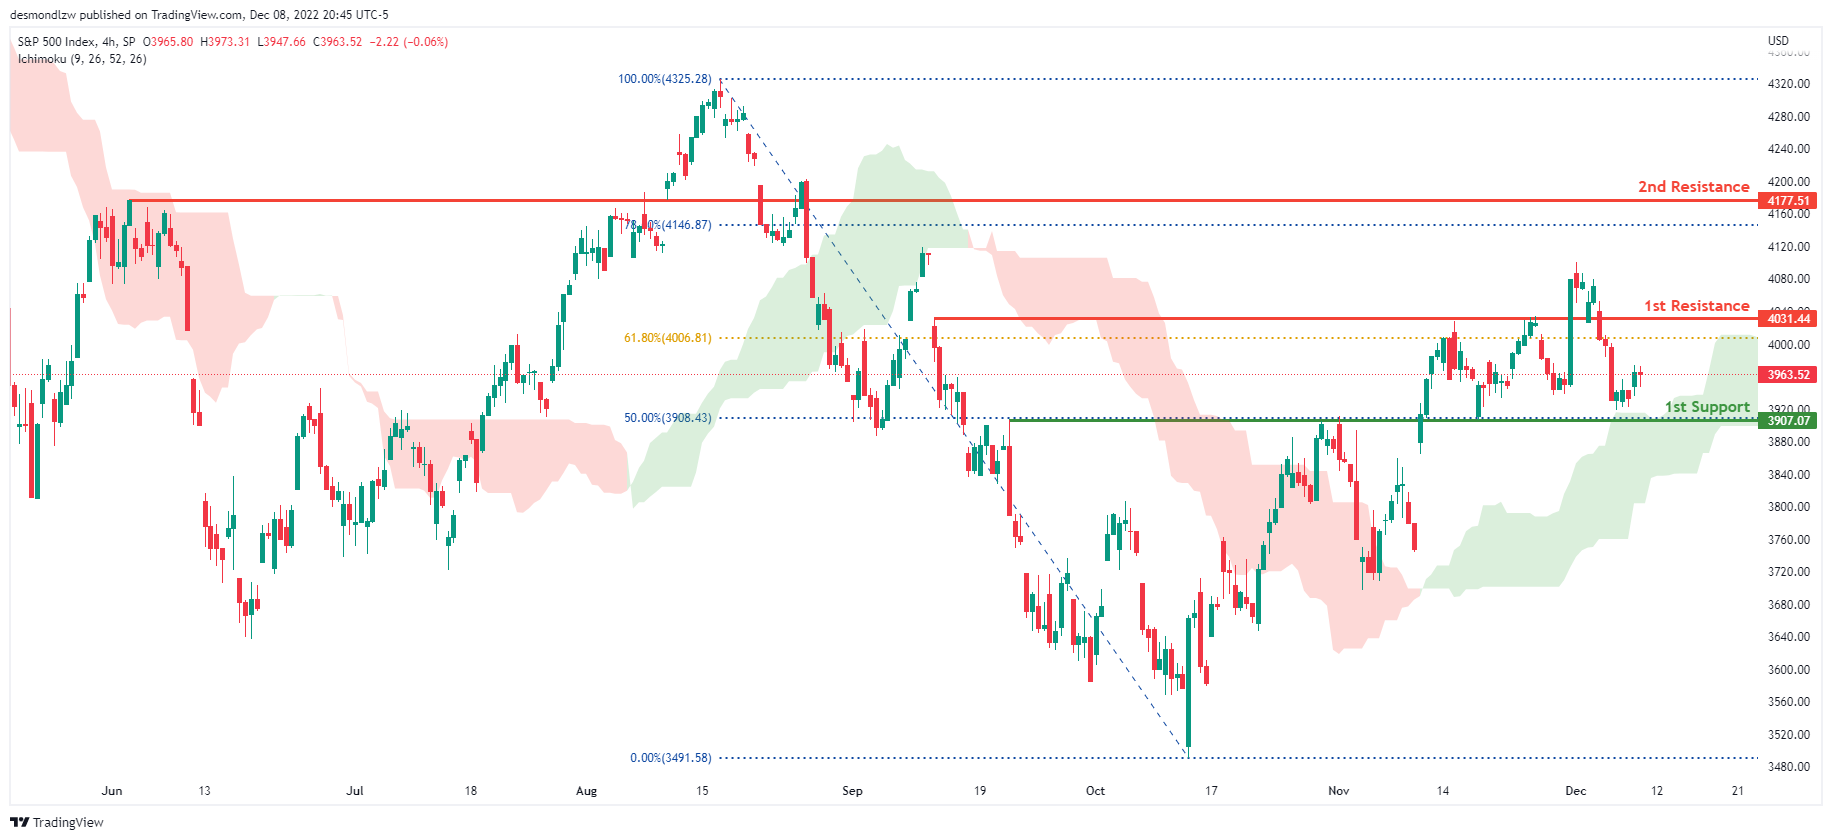
The overall bias for the S&500 on the H4 chart is bullish, with prices above the Ichimoku cloud. If the bullish momentum continues, the expected price to head towards the 1st resistance line is at 4031.44, where the 61.8% Fibonacci line is located. In an alternate scenario, price could return to the 1st support line at 3907.07, where the 50% Fibonacci line is located.
Areas of consideration:
- H4 time frame, 1st support at 3907.07
- H4 time frame, 1st resistance at 4031.44
China CPI slowed to 1.6% yoy in Nov, core CPI down -0.6% yoy
China CPI slowed from 2.1% yoy to 1.6% yoy in November, below expectation of 1.7% yoy. Core CPI, excluding food and energy, was down -0.6% yoy, unchanged from October. Food prices slowed from 7.0% yoy to 3.7% yoy. Non-food prices were unchanged at 1.1% yoy.
"In November, due to the domestic epidemic, seasonal factors, and a higher base of comparison in the same period last year, CPI turned from rising to falling month on month and fell back year on year," said chief NBS statistician Dong Lijuan.
PPI was unchanged at -1.3% yoy, above expectation of -1.5% yoy. "In November, PPI rose slightly month on month as a result of price increases in coal, oil and non-ferrous metals, and continued to fall year on year due to a high base of comparison from the same period last year," added Dong.