Sample Category Title
BoC Kozicki: We will be considering whether to increase rates further
BoC Governor Deputy Governor Sharon Kozicki said in speech yesterday, "going forward, we will be considering whether to increase rates further".
"By that, we mean that we expect our decisions will be more data-dependent," she said. "If we are surprised on the upside, we are still prepared to be forceful. But we recognize that we have raised interest rates rapidly and that their effects are working their way through the economy."
"In other words, we are moving from how much to raise interest rates to whether to raise interest rates," she added.
USD/JPY Faces Uphill Task, This Resistance Is The Key
Key Highlights
- USD/JPY corrected higher from the 133.60 zone.
- A crucial bearish trend line is in place with resistance near 137.50 on the 4-hours chart.
- EUR/USD and GBP/USD are consolidating gains above support zones.
- Gold price might aim a fresh increase towards the $1,825 resistance.
USD/JPY Technical Analysis
The US Dollar started a major decline below the 142.00 support against the Japanese Yen. USD/JPY traded as low as 133.61 before it started an upside correction.
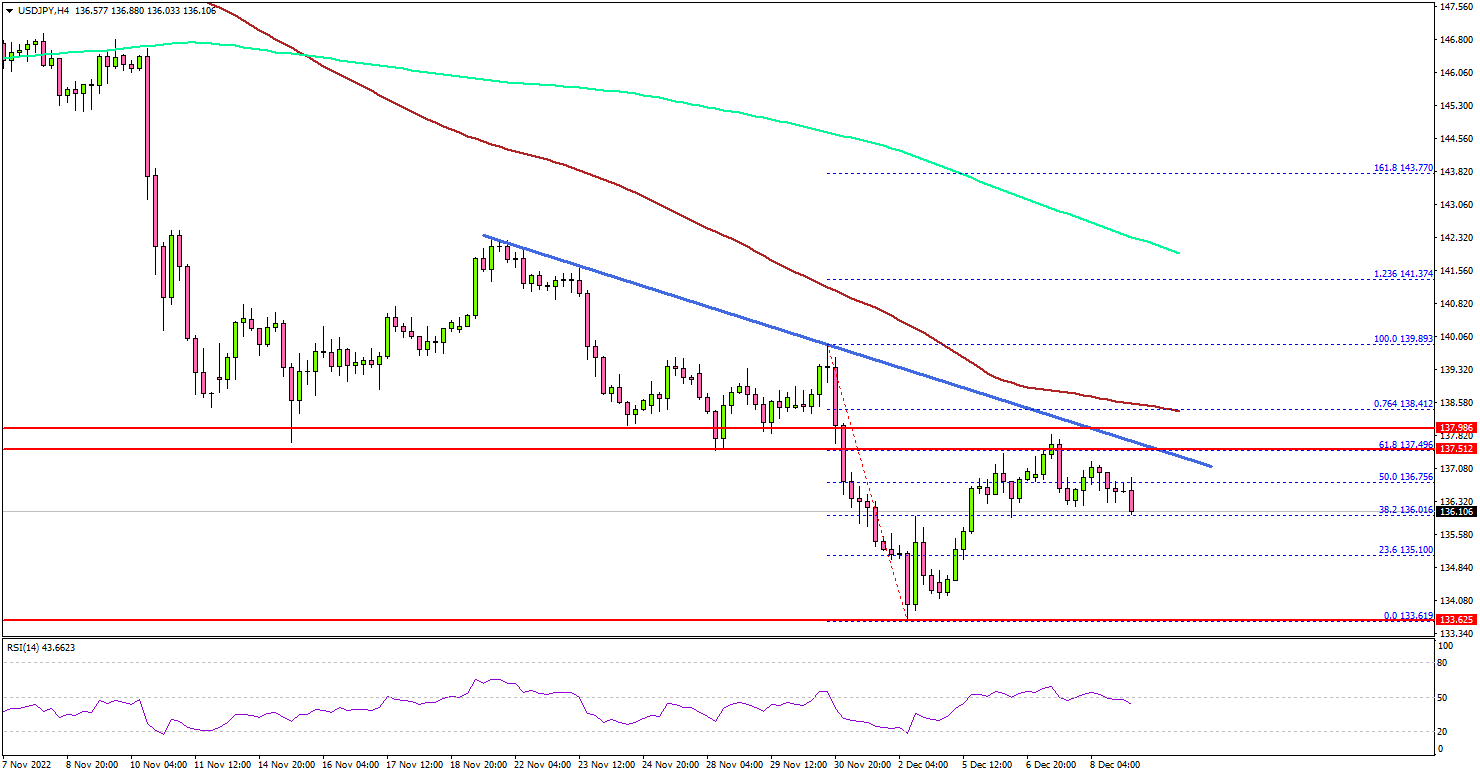
Looking at the 4-hours chart, the pair corrected above the 135.00 resistance zone. There was a move above the 50% Fib retracement level of the downward move from the 139.89 swing high to 133.61 low.
However, the pair faced a strong resistance near the 137.50 zone and it stayed below the 100 simple moving average (red, 4-hours), and the 200 simple moving average (green, 4-hours). There is also a crucial bearish trend line in place with resistance near 137.50 on the same chart.
On the upside, the pair is facing resistance near the 137.50. The next major resistance may perhaps be near 138.50 and the 100 simple moving average (red, 4-hours). A clear move above the 138.50 resistance might start another decent increase.
In the stated case, USD/JPY may perhaps test 140.00. Any more gains could set the pace for a move towards the 142.50 resistance zone.
If there is no upside break, the pair might start a fresh decline. An initial support is near the 136.00 level. The next major support is near the 135.00 zone. Any more losses might send the pair towards the 133.60 support zone.
Looking at gold price, the bulls are seen active and there are chances of a fresh increase towards the $1,825 resistance zone.
Economic Releases
- US Producer Price Index for Nov 2022 (MoM) – Forecast +0.1%, versus +0.2% previous.
- US Producer Price Index for Nov 2022 (YoY) – Forecast +7.4%, versus +8.0% previous.
- Michigan Consumer Sentiment Index for Dec 2022 (Prelim) – Forecast 53.3, versus 56.8 previous.
Cliff Notes: Growth Prospects to Diverge as New Year Begins
Key insights from the week that was.
This week, Australia’s Q3 GDP report and the outcome of the December RBA Board meeting provided a broad update on the health of Australia’s economy and its outlook. Offshore, the growing divergence between developed and developing markets’ growth prospects remained in focus.
Q3 GDP for Australia came in slightly under the market’s expectation at 0.6%, 6.9%yr. Household spending was the key support in the three months to September, with a further reduction in the savings rate and robust nominal income gains facilitating a 1.1% lift in consumption. This does however represent a clear slowdown in the pace of consumption growth from the first half of the year, indicating that the reopening effect is fading.
As spending patterns continue to normalise and the full effect of rapidly rising interest rates and inflation’s hit to real incomes is felt, consumption growth will slow further. Some components of household spending are already beginning to wilt under these headwinds, as evinced by the 11.2% decline in real estate turnover which subtracted 0.2ppts from GDP growth in Q3. Conditions for business investment meanwhile remain mixed. In short, supply issues, and on occasion the weather, are limiting the pace at which the sector’s pipeline of work can progress. Though, with capacity tight and tax incentives continuing to support, business remains constructive on the outlook for investment over the coming year.
After 13 consecutive quarters of surplus, Australia’s current account meanwhile slipped into deficit in Q3, ending the longest run of surpluses in the history of the series which dates back to 1959. This was predominately driven by the trade surplus narrowing from $42bn at June to $31bn in September – still an elevated level versus history. As was subsequently highlighted by the October trade balance, in part due to global conflict and uncertainty, fuel and food exports are at record highs and are likely to show continued strength. Note though, the flip-side of record resource sector profitability is an outsized flow of dividends to foreign shareholders. In Q3, Australia’s net income deficit rose to 4.4% of GDP, roughly in line with the peak during the 2007 commodity price boom.
Commodity markets were a broader point of discussion for the Westpac Economics team this week, both with respect to the diverging growth prospects of developed and developing nations heading into 2023 and amid the global green transition. Our newest video series ‘Commodities in Transition’ seeks to delve deeply into both with a view to assessing the implications for Australia’s exports and national income.
On Australia’s outlook, the December RBA Board meeting was also informative. As discussed by Chief Economist Bill Evans, having delivered another 25bp hike, the RBA retained its tightening bias heading into the new year, noting the “Board expects to increase interest rates further over the period ahead, but it is not on a pre-set course”. Further, concern continued to be shown over the potential threat to the economy of high inflation becoming entrenched. Westpac continues to expect additional 25bp increases at the February, March and May meetings, taking the cash rate to a peak of 3.85% which is then expected to be retained until 2024, when we see a series of interest rate cuts beginning.
Moving offshore, the market this week showed increasing confidence in China’s outlook and, by association, that of developing Asia. The two have a strong connection, with China receiving a large and growing dividend from Asia’s economic development and, ahead, their shift to renewable power generation and society’s electrification – structural changes which China has a leading role in globally.
However, the focus of most market participants currently is China’s path out of COVID-zero. On this front, news remains positive, with a further easing of testing and isolation rules seen over the week as well as the relaxation of the requirement to show a negative test to enter public transport, retail and offices in major tier 1 cities. Authorities are also working hard to improve confidence amongst consumers, the intent being to increase households willingness to spend in line with their capacity. A progressive end to COVID-zero restrictions at the same time as residential construction begins to rebound and investment in heavy and technological infrastructure continues to show strength is a heady mix for China GDP growth, which we see rebounding from 3.5% in 2022 to 6.0% in 2023.
Finally to the US and Europe. Ahead of their final central bank meetings for 2022 next week, comments by policy makers and the data flow was very light. For the US, a strong nonfarm payrolls print last Friday and ISM services report this week has done little to assuage the market of growing fears of recession in 2023, with the S&P Global services PMI in contrast signalling a weak state of affairs for small and medium-sized firms in the sector.
As we have long argued, albeit for different reasons, the risks of recession in the US are similar to those for Europe heading into the new year. It is therefore unsurprising that both the US dollar and US term interest rates are near their recent lows as we go to print. With European risks to crystalise earlier in 2023 than the US, we forecast a trend decline in the US dollar over the coming year, continuing into 2024 as rate cuts commence in both jurisdictions.
Australian Economy Likely to Stall in the Second half of 2023
The messages from the recent national accounts support our pessimistic growth outlook.
The recent national accounts for the September quarter were largely in line with our expectations and they further emphasised some of the key developments we see in the Australian economy that will lay the foundations for a modest growth outlook in 2023 and 2024.
We continue to forecast a slowdown in the growth profile for the Australian economy from 2.6% in 2022 to 1.0% in 2023 and 2.0% in 2024.
The key to this profile is the consumer.
Household consumption is forecast to slow from around 2% (6 month annualised) in the first half of 2023 to near zero in the second half. That would see growth through the year of 1.0%.
The first half will benefit from the spill over of the momentum in the second half of 2022 which is expected at around a 4% pace (six month annualised) while the building negative forces of a rising interest rate burden; the fading reopening of the economy; a much more modest fall in the savings rate than we saw in 2021 and 2022; a damaging negative wealth effect from falling house prices and negative real wages growth will weigh heavily on the household sector.
Consistent with a depressing outlook for domestic sales and the expiry of the tax allowances in June, business equipment investment is forecast to contract by around 7% in the second half of 2023. This hit to activity will be compounded by a contraction in new residential investment and in home renovation activity.
A six month period of a stagnant economy and no growth in household spending will alert the RBA to the need to ease policy settings in 2024. Overall output growth in 2024 is forecast to improve to 2%, with the bulk of that expansion (1.5%) coming in the second half of the year.
Inflation will be lower in 2024 (at 3%) than the RBA’s current forecast of 3.25%, allowing the RBA to cut rates by around 100 basis points through that year.
The sharp economic slowdown in 2023 will be partly engineered by the need for the RBA to continue lifting the cash rate in the first half of 2023 as wages growth and inflation remain uncomfortably high and growth holds in at a “respectable pace” – particularly in the opening quarter.
The themes which are discussed below from the September quarter national accounts are expected to extend through 2023.
Risks to the profile are evenly balanced.
Inflation and wages may fall much more quickly than we envisage allowing the RBA to bring forward the rate cuts and avoid the last hike (to 3.85%) we are anticipating for May.
On the other hand, inflation throughout 2023 may be stickier than we expect. The RBA would be unable to cut rates in 2024, as anticipated, condemning the Australian economy to another very difficult year with weak growth and no prospect of any interest rate relief.
While there is mounting evidence that relief from supply side inflation is in prospect demand factors remain uncertain.
Through 2023 businesses need to embrace that difficult growth outlook and desist from excessive price increases or out bidding competitors for scarce labour. In general, the prospect of flat growth should convince businesses that large wage increases and rising prices will be unsustainable by the second half of 2023.
The observations below on the recent evidence on the evolution of the economy are supportive of our assessment.
The Australian economy expanded by 0.6% in the September quarter for annual growth of 5.9%
Household spending growth slowed in the quarter from 2.1% in the June quarter, to 1.1%, although it did contribute all the 0.6ppts of overall growth. Motor vehicles sales and operations (0.4ppts); hotels, cafes and restaurants (0.4ppts); and transport services (0.3 ppt’s) contributed most of the 1.1ppt growth in household consumption. While not as strong as in the June quarter, the opening up effect was once again apparent as a key driver of consumer spending, although there were some examples (recreation and leisure) where the opening up effect has already faded (that the ABS advise that this surprise slowing in recreation was more apparent in the goods component than services, as well as gambling).
Part of this lift in spending was funded by a further fall in the household savings rate from 8.3%, in June, to 6.9%, although the major fall from a peak of 19.4% in September 2021 (associated with the delta lockdowns) has largely worked its way through.
In reviewing the household cash flow for the September quarter, we estimate that household incomes lifted by $8.2bn; were boosted by interest and dividend payments of $4.5bn but were reduced by a substantial leakage of $5.1bn in higher interest payments as rising interest rates bite. That fall in the savings rate released $4.2bn in free funds supporting a nominal increase in spending of around $10bn.
As a point of comparison with the June quarter we note that interest payments only increased by $1.4bn while the boost from the fall in the savings rate was $9.5bn for an overall boost in nominal spending of $11.4bn.
That comparison with the June and September quarters highlights the rebalancing of the falling savings rate and rising interest cost that will weigh even more heavily on spending as we go forward.
Prospects for growth in consumer spending are easing as the reopening effect fades and the savings rate settles back at a more normal level. However, given the accumulated $260bn in excess household savings it is likely that the savings rate will fall below equilibrium (judged to around 6%) as households draw on these excess balances. We expect that through 2023 that savings rate can drift down to around 3% but our forecasts anticipate that the boost to available spending power will be more than offset by the rising interest cost.
Consumer spending was also boosted by household incomes in the September quarter.
Compensation of employees rose 3.2% (including 2.7% in wages and salaries) in the quarter up from growth in the June quarter of 2.5% (2.2% in wages and salaries).
However, households were challenged by a sharp increase (2.0%) in the household consumption deflator up from 1.5% in the June quarter and the fastest quarterly gain since March 1988.
The weakness in housing activity was not only apparent in property turnover (subtracted 0.2ppts from growth) but a 2.2% decline in renovation work.
Business investment was generally lack lustre (up 0.7%) with a 3.0% fall in machinery and equipment being offset by a 4.3% increase in non-residential construction.
There are some clear themes in the latest set of national accounts.
Household spending, boosted by a falling savings rate, continues to be the driver of growth largely through the reopening lift from travel; accommodation and hospitality; and motor vehicle purchases.
Some specific drag is apparent in the weak real estate market.
As we move forward, the reopening effect will fade; property weakness will linger; the savings rate will find a floor; and consumer spending growth will continue to slow.
In addition, the drag on incomes from rising interest rates will intensify through 2023 just as we saw the drag lift from $1.4bn in the June quarter to $4.5bn in the September quarter.
But price and wage pressures are building, and it is these contrasting forces that will challenge policy. Our forecasts continue to embed a lift to a peak of 3.85% in the RBA cash rate by May next year.
Gold Wave Analysis
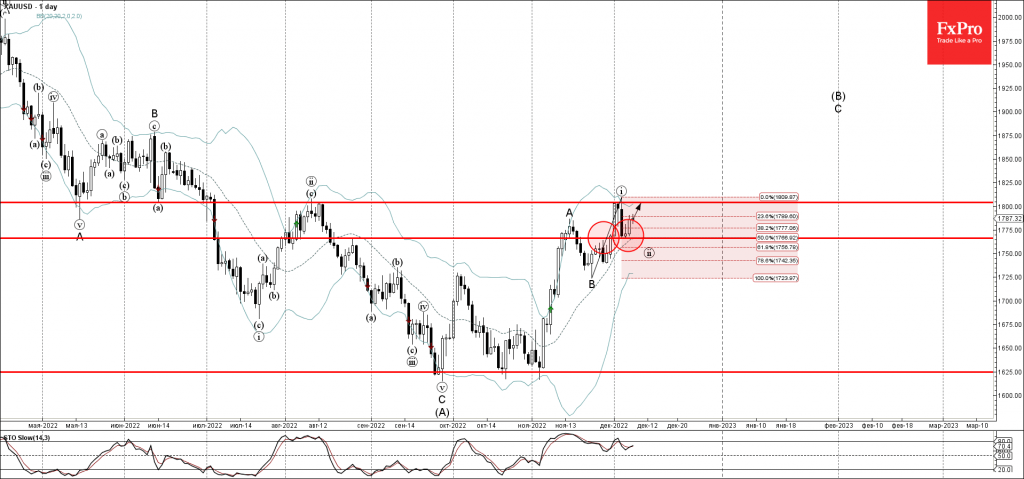
- Gold reversed from support level 1765.00
- Likely to rise to resistance level 1805.00
Gold earlier reversed up from the support level 1765.00 (former minor resistance from the end of November).
The support level 1765.00 was further strengthened by the nearby 50% Fibonacci correction of the upward impulse wave (i) from the end of last month.
Given the improving sentiment across the precious metal markets, Gold can be expected to rise further toward the next resistance level 1805.00 (former top of waves (ii) and (i)).
EURAUD Wave Analysis
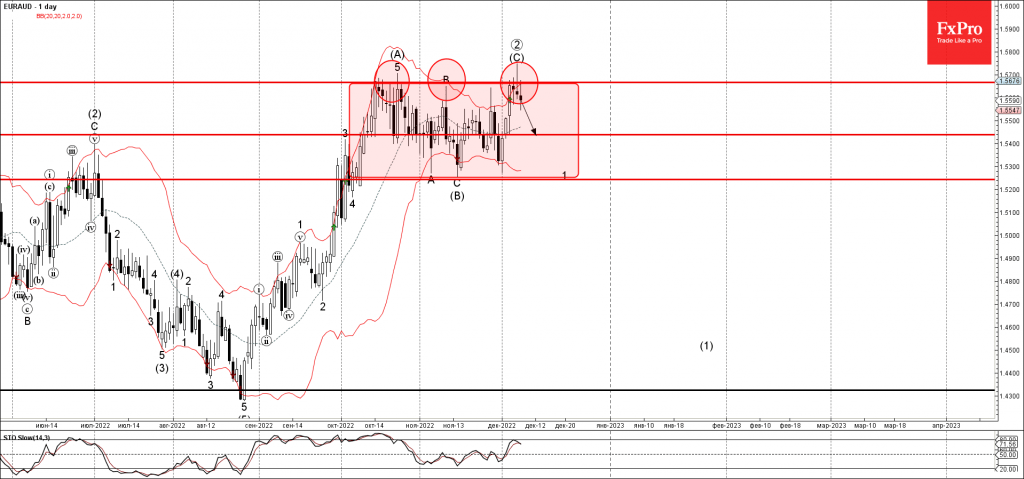
- EURAUD reversed from resistance level 1.5665
- Likely to fall to support level 1.5440
EURAUD recently reversed down from the key resistance level 1.5665 (which is the top border of the sideways price range inside which the pair has been moving from October), standing near the upper daily Bollinger Band.
The downward reversal from the resistance level 1.5665 created the daily candlesticks reversal pattern Shooting Star – which stopped the earlier impulse wave (C).
EURAUD can be expected to fall further toward the next support level 1.5440 (cater of this sideways price range).
Fed Preview – Tightening Pressure Persists into 2023
- Despite the strong November Jobs Report and ISM Services, market seems convinced that Fed will deliver a 50bp hike in its meeting next week.
- While we acknowledge our earlier call for a larger hike seems unlikely, we continue to expect a hawkish message regarding the policy stance in 2023.
- We think the recent easing in financial conditions is premature, and further hikes will be needed. We expect Fed to reach a terminal rate of 5.00-5.25% in March.
Last week, we argued that markets could be underestimating the strength in the US economy and that a 75bp hike in December is a non-zero probability event (see Research US - 50 or 75bp? Fed's December Checklist, 30 November). While we still think the former might be true, and both the November Jobs Report and ISM Services caused sharp reactions in the broader markets, pricing for next week's meeting remained stable near 50bp.
While we see upside risks to the consensus forecast of November CPI, which combined with higher Univ. of Michigan inflation expectations could still spark some near-term volatility, the focus has already shifted towards the monetary policy stance in 2023.
Since early November, the positive sentiment in bond markets, the inversion on the US yield curve and weakening broad USD have reflected easing financial conditions. We think the move is premature, as private consumption and especially the services sector are still holding up well. Fed needs to close the positive output gap to bring inflation down, but with ISM business activity at the highest level since December 2021 and labour supply stagnating since last March, further tightening will still be needed.
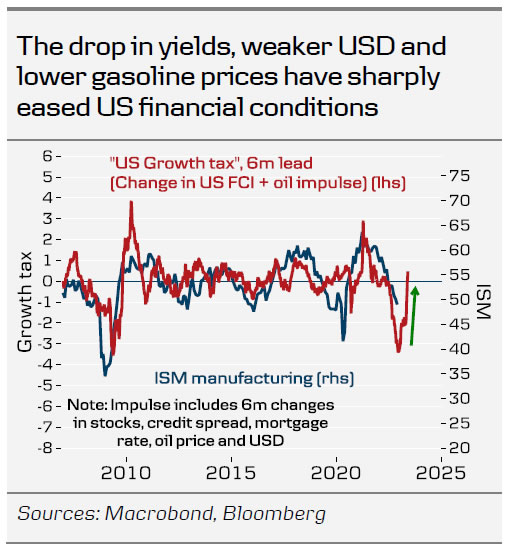
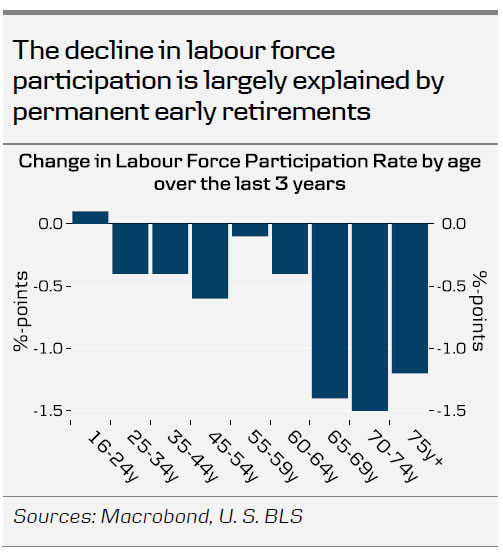
While the weak household survey suggests that the nonfarm payrolls could overstate the strength of US employment growth, even modest job gains are enough to tighten the labour market if supply does not grow at all. Alternative indicators, such as JOLTs job openings, or conference board's Jobs Plentiful index confirm, that labour demand remains elevated. FOMC members have noted several times that the current wage inflation is far from levels consistent with the 2% inflation target, and the latest data suggests that Fed is hardly making progress towards bringing the market back into balance.
In his final speech ahead of the blackout, Powell noted that risk management does not only refer to calming inflation anymore, but also avoiding a recession. Markets have responded by pricing in the first cuts as early as November next year, which we consider too early.
US economy remains on a path of modest growth in Q4, and Fed needs to force a moderate recession next year to avoid prolonging inflation from here. Getting demand lower requires broad financial conditions to retighten again, which likely includes a combination of more rate hikes in Q1, still elevated longer real yields and stronger USD.
We acknowledge that our earlier call of a 75bp hike next week appears unlikely, but do not think the need to tighten monetary policy further has disappeared. We adjust our Fed call, and now expect 50bp hike next week, followed by 50bp in February and 25bp in March. Thus, we maintain our call for a terminal rate of 5.00-5.25% unchanged.
Sunset Market Commentary
Markets
No surprises today. The near-empty eco calendar and (near) blackout periods for central banks delivered the feared-for dull trading day. Not the slightest diversion to trigger some directional action. The only release worth mentioning were US weekly jobless claims. The traditionally volatile number printed… bang in line with forecasts at 230k with last week’s number upwardly revised from 225k to… 226k. German and US yields (10y tenors) arrived at next support levels in yesterday’s low volume rally and remain above them. Technical action sent them somewhat higher again. US yields add 3.2 bps to 6.9 bps in a daily perspective with the belly of the curve underperforming the wings. The US 10-yr yield holds above 3.42% which is 50% retracement on the August to October yield move higher. German yields rise by up to 4 bps with the 10-yr yield holding north of the October low at 1.77%. European stock markets are mixed with EUR/USD steady near 1.05.
Tomorrow doesn’t look that better. Chinese CPI inflation numbers will show that the country bucks the major global trend with analysts expecting a slowdown from 2.1% Y/Y to 1.6% Y/Y. They finally seemed to gently turn the corner to their very string zero-Covid policies, but this extreme stance since the start of the outbreak came at an economic cost. Absence of price pressure leaves scope for more fiscal and monetary stimulus even as growth could finally start picking up. European attention turns to the second early TLTRO redemption figure. Banks repaid €296bn on the first occasion (Nov 23) with over €1.8tn still outstanding. Recent changes to TLTRO modalities make them less attractive to hold to maturity. A faster wind down of TLTRO’s, together with the end to APP reinvestments from early next year onwards, will help shrink the central bank’s balance sheet and reduce excess liquidity in the system. From a policy normalization point of view, this is the elephant in the room next year rather than the pace of ECB rate hike and their peak levels. During US dealings, December University of Michigan consumer confidence is an harbinger for data points ahead. Especially consumer inflation expectations caught attention this year. They are expected unchanged at 4.9% and 3% for 1y and 5-10y respectively.
News Headlines
Hungarian inflation accelerated from 21.1% y/y to 22.5%, surpassing the 22% consensus estimate. Monthly dynamics remain very strong at 1.8% m/m. Core inflation rose from 22.3% to 23.9%. Price increases are bound to accelerate even further, if only because the government was forced to ditch a costly fuel price cap this week following nationwide gasoline shortages. Economic Development Minister Nagy said it may add 2-2.3 ppts to inflation. The room for Hungary’s central bank to lower the de facto policy rate, currently at 18%, anytime soon is non-existent. This is even more true with the government’s ongoing fiscal support. Apart from keeping the price caps on a range of other goods (staples, mortgages and student loans), it announced late yesterday a new 1.5tn HUF subsidized corporate loan programme offering loans at 5% max in order to avert a recession. Hungarian swap yields shot up between 48 and 84 bps with the front end underperforming after the CPI release. The forint gets a beating. EUR/HUF opened at 410.92, surged beyond resistance around 415.6 and is currently changing hands at 418.68.
Dutch officials are planning new export controls of chipmaking equipment to China, Bloomberg reported citing people familiar with the matter. An agreement could come next month already and would align Dutch trade rules more with the US with both sharing similar national-security concerns, they said. The latter has unveiled new efforts a few months ago to restrict Chinese access to its high-end technology. Next to the US, the Netherlands and Japan are world’s top suppliers of machinery and know-how needed to make advanced semiconductors. Dutch PM Rutte said that his country is coordinating the matter between the three as well as South-Korea.
EUR/USD Mid-Day Outlook
Daily Pivots: (S1) 1.0449; (P) 1.0500; (R1) 1.0556; More...
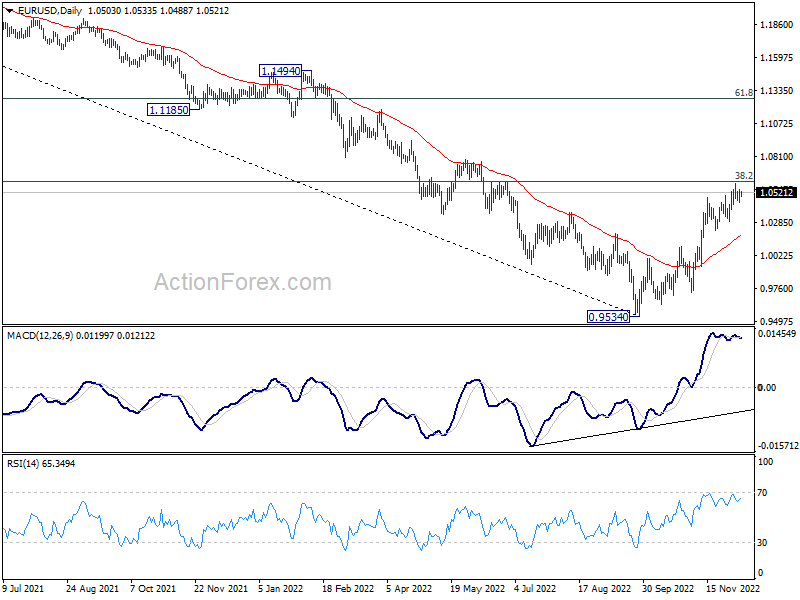
Intraday bias in EUR/USD stays neutral as range trading continues. Considering bearish divergence condition in 4 hour MACD, break of 1.0427 minor support will indicate short term topping at 1.0594, after rejection by 1.0609 fibonacci level. Intraday bias will be turned back to the downside for 1.0222 support and possibly below. Nevertheless, firm break of 1.0594 will resume larger rally from 0.9534.
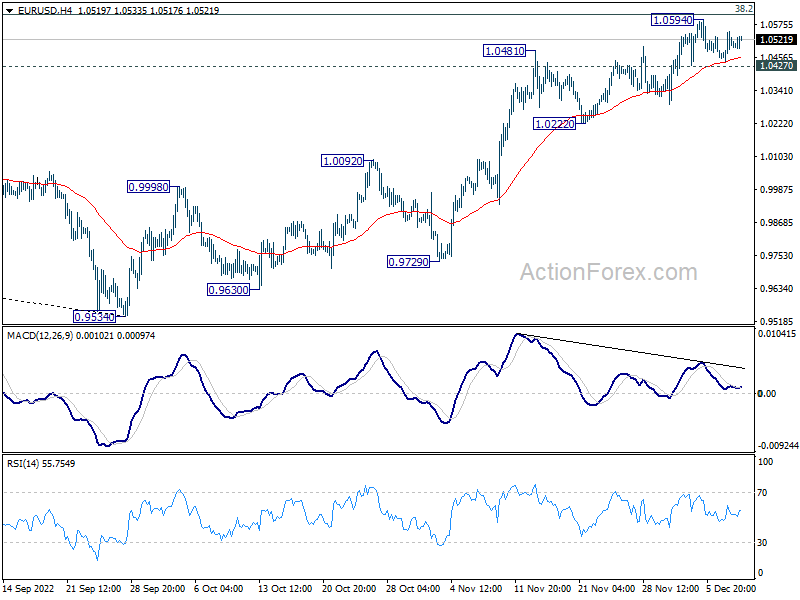
In the bigger picture, a medium term bottom was in place at 0.9534, on bullish convergence condition in daily MACD. Even as a corrective rise, rally from 0.9534 should target 38.2% retracement of 1.2348 (2021 high) to 0.9534 at 1.0609. Sustained trading above 55 week EMA (now at 1.0557) will raise the chance of trend reversal and target 61.8% retracement at 1.1273. However, rejection by 1.0609 will retain medium term bearishness for down trend resumption at a later stage.