

Sample Category Title
USD/CHF Daily Outlook
Daily Pivots: (S1) 0.9489; (P) 0.9541; (R1) 0.9572; More...
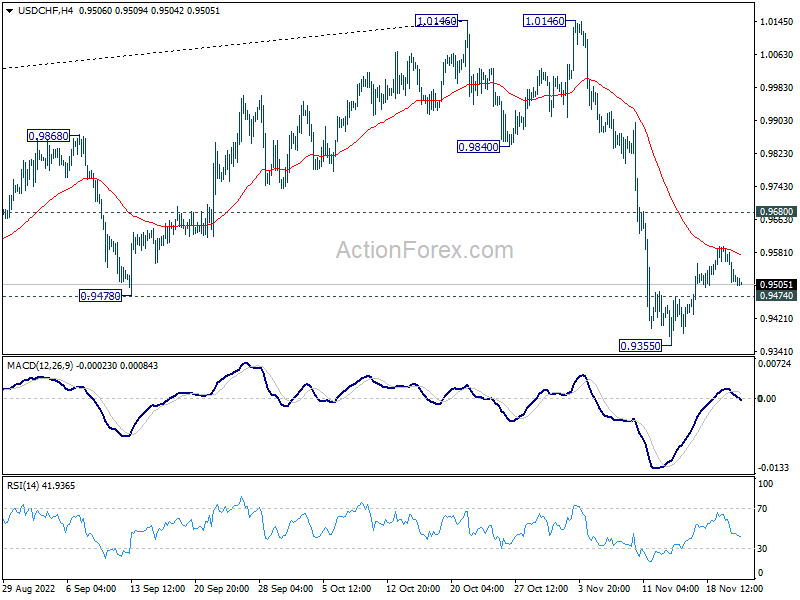
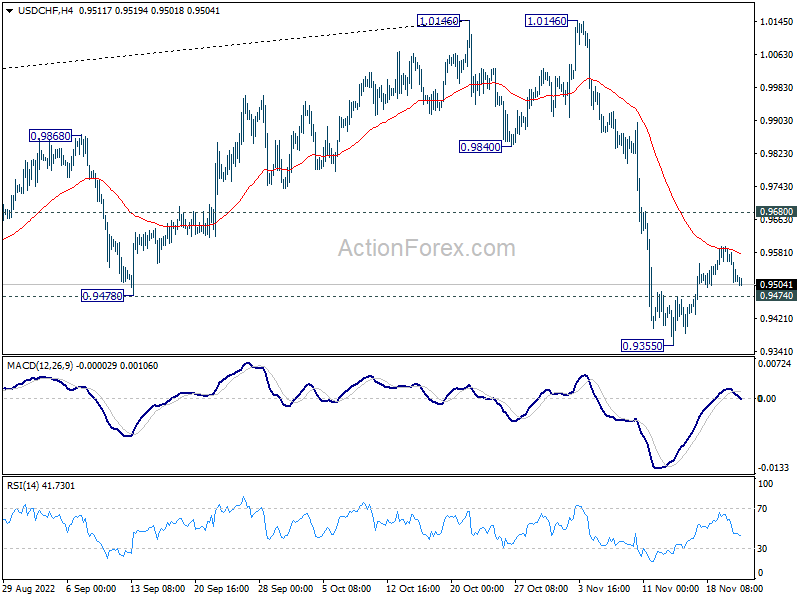
Intraday bias in USD/CHF stays neutral at this point. Near term outlook stays bearish with 0.9680 minor resistance intact. On the downside, break of 0.9474 minor support will bring retest of 0.9355 low first. Break there will resume the fall from 1.0146 to 0.9287 fibonacci level.
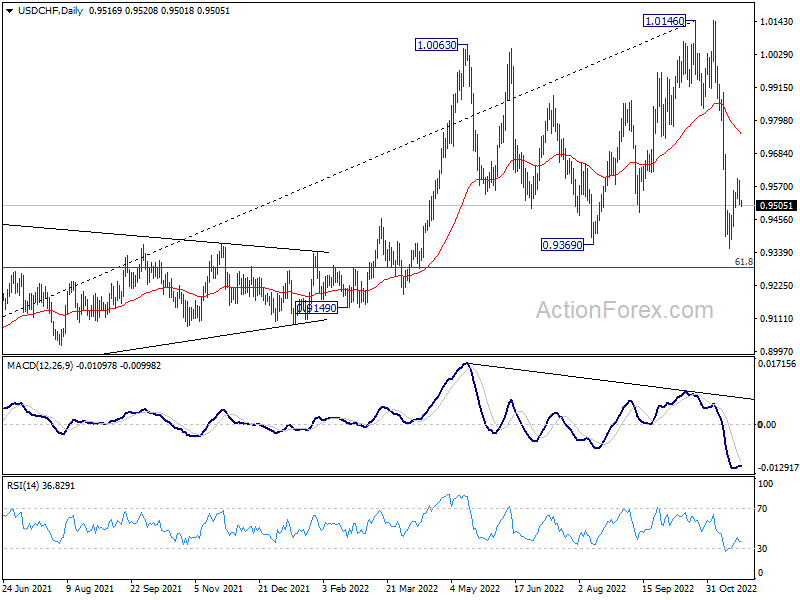
In the bigger picture, rise from 0.8756 (2021 low) has completed at 1.0146, well ahead of 1.0342 long term resistance (2016 high). Based on current downside momentum, fall from 1.0146 might be a medium term down trend itself. Break of 61.8% retracement of 0.8756 to 1.0146 at 0.9287 will pave the way to 0.8756. In any case, risk will stay on the downside as long as 55 day EMA (now at 0.9767) holds.
GBP/USD Daily Outlook
Daily Pivots: (S1) 1.1834; (P) 1.1869; (R1) 1.1919; More...
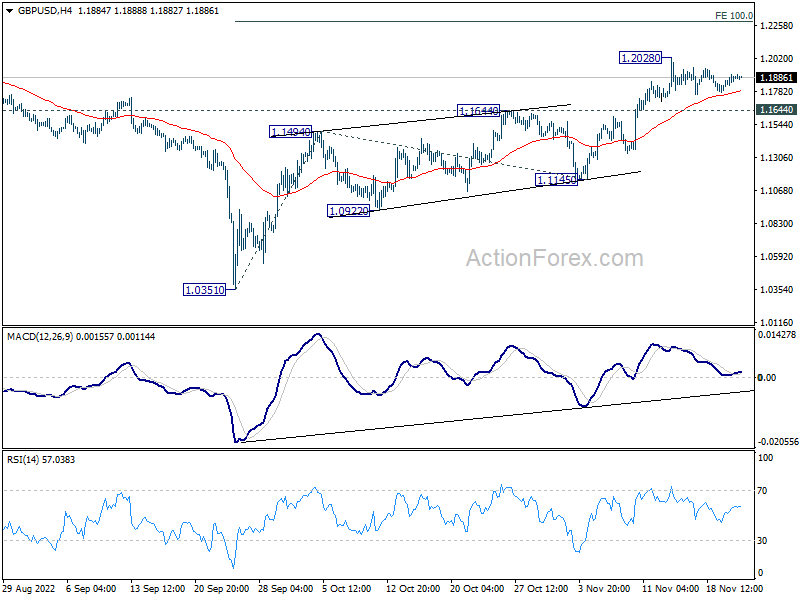
Intraday bias in GBP/USD remains neutral as consolidation from 1.2028 is still extending. Further rally is expected as long as 1.1644 resistance turned support holds. On the upside, break of 1.2028 will resume whole rise from 1.0351 to 100% projection of 1.0351 to 1.1494 from 1.1145 at 1.2288. However, sustained break of 1.1644 will bring deeper fall to 1.1145 support instead.
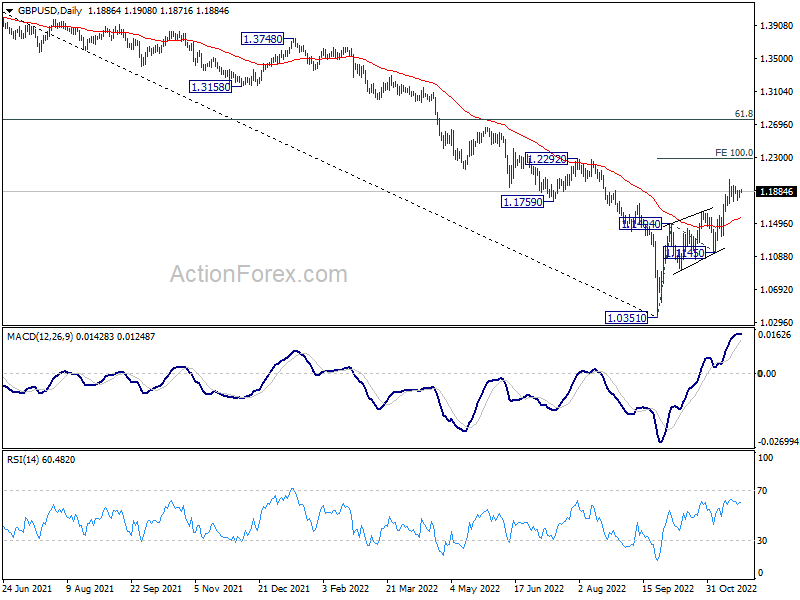
In the bigger picture, rise from 1.0351 medium term bottom is at least correcting whole down trend from 1.4248 (2021 high). Further rise is expected as long as 1.1145 support holds. Next target is 61.8% retracement of 1.4248 to 1.0351 at 1.2759.
EUR/USD Daily Outlook
Daily Pivots: (S1) 1.0259; (P) 1.0283; (R1) 1.0328; More...
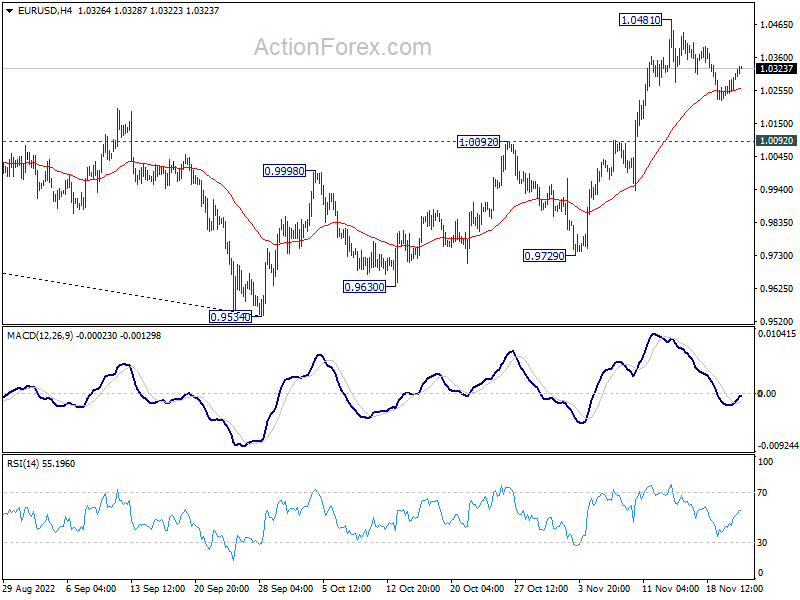
EUR/USD recovered after drawing support from 4 hour 55 EMA, but stays well below 1.0481. Intraday bias remains neutral an more consolidative trading could be seen. But after all, as long as 1.0092 resistance turned support holds, further rally is still expected. On the upside, break of 1.0481 will resume the rise from 0.9534 and target 1.0609 fibonacci level. However, sustained break of 1.0092 will turn bias to the downside for 55 day EMA (now at 1.0052) and below.
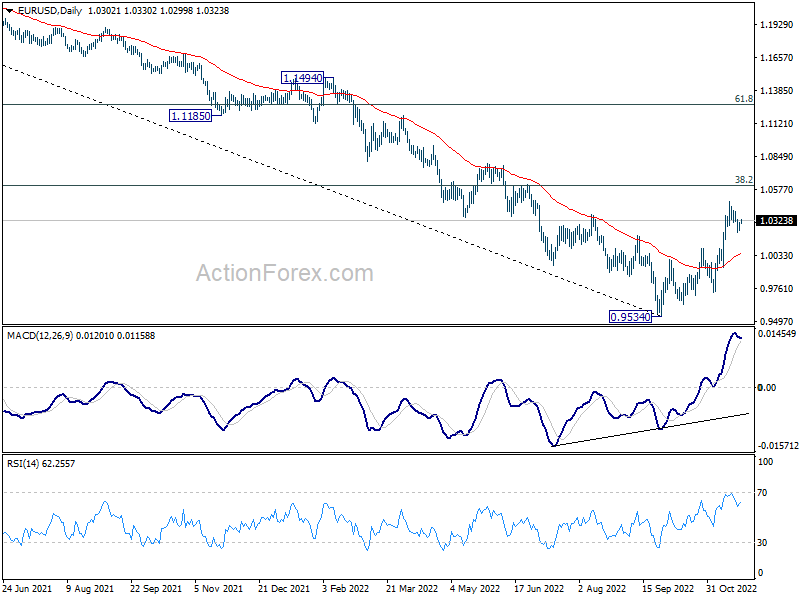
In the bigger picture, a medium term bottom was in place at 0.9534, on bullish convergence condition in daily MACD. Even as a corrective rise, rally from 0.9534 should target 38.2% retracement of 1.2348 (2021 high) to 0.9534 at 1.0609. Sustained trading above 55 week EMA (now at 1.0566) will raise the chance of trend reversal and target 61.8% retracement at 1.1273. This will now remain the favored case as long as 1.0092 resistance turned support holds.
NZD Rises after RBNZ Jumbo Rate Hike, Pressure Back on Dollar
New Zealand Dollar rises broadly after RBNZ delivered the historical 75bps rate hike as widely expected. Yet, it's staying in near term range against the greenback. For now, Euro is following Kiwi as second strongest for the day, then Swiss Fran and Sterling. Canadian Dollar is the weakest, followed by Yen and Aussie. Apparently, Aussie is additionally dragged by selloff against Kiwi. Dollar is mixed and awaits more economic data as well as FOMC minutes, before US holiday tomorrow.
Technically, Dollar is back under some pressure, in particular against Euro and Swiss Franc. 1.0092 support in EUR/USD and 0.9680 minor resistance in USD/CHF stay intact, and keep bearish bias in Dollar. EUR/USD and USD/CHF could revisit recent levels at 1.0481 and 0.9355 respectively during the rest of the week if selloff in Dollar intensifies.
In Asia, Japan was on holiday. Hong Kong HSI is up 1.05%. China Shanghai SSE is up 0.33%. Singapore Strait Times is down -0.06%. Overnight, DOW rose 1.18%. S&P 500 rose 1.36%. NASDAQ rose 1.36%. 10-year yield dropped -0.067 to 3.758.
RBNZ hikes 75bps to 4.25%, tightening not finished
RBNZ raises the Official Cash Rate by a record 75bps to 4.25% as widely expected. The central bank maintained that "monetary conditions needed to continue to tighten further, so as to be confident there is sufficient restraint on spending to bring inflation back within its 1-3 percent per annum target range."
During the meeting, increases of 50, 75 and 100bps were considered. But members agreed that "a larger increase in the OCR was appropriate, given the resilience of domestic spending, and the higher and more persistent actual and expected inflation outcomes."
But on the "balances of risks", a 75bps hike was "appropriate at this meeting". Members highlights that "the cumulative tightening of monetary conditions delivered to date continues to pass through to the economy via the lagged transmission to effective retail interest rates."
In the new forecasts, annual inflation is projected to rise further to 7.5% in Q4 and Q1, then stay above 5% throughout 2023. Inflation would then slowly drop back to 2.9% in Q3, 2024. Quarterly GDP is projected to contract from Q2 2023 to Q1 2024, turn flat in Q2 and Q3 2024, before returning to slight growth. OCR will continue to rise and peak at 5.5% in Q3 2023, before turning down in second half of 2024.
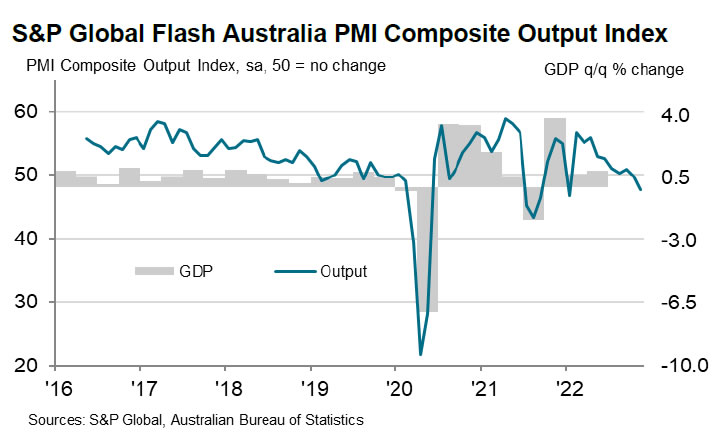
Australia PMI composite dropped to 47.7, deteriorating demand and worsening price pressures
Australia PMI Manufacturing dropped from 52.7 to 51.5 in November, a 29-month low. PMI Services dropped from 49.3 to 47.2, a 10-month low. PMI Composite also dropped from 49.8 to 47.7, a 10-month low.
Jingyi Pan, Economics Associate Director at S&P Global Market Intelligence said:
"The latest S&P Global Flash Australia Composite PMI data revealed that the private sector economy further contracted midway into the fourth quarter, faced with deteriorating demand conditions. In particular, the service sector continued to be affected by higher interest rates and capacity constraints, leading to a sharper fall in business activity.
"That said, with price inflation further climbing in November, the pressure remains on the central bank to keep tightening monetary policy to rein in prices. This is also amid indications of solid employment growth from the PMI data.
"The mix of deteriorating demand and worsening price pressures does not bode well for the near-term outlook, and this has also been reinforced by the decline in private sector confidence in November."
AUD/NZD extending decline after RBNZ
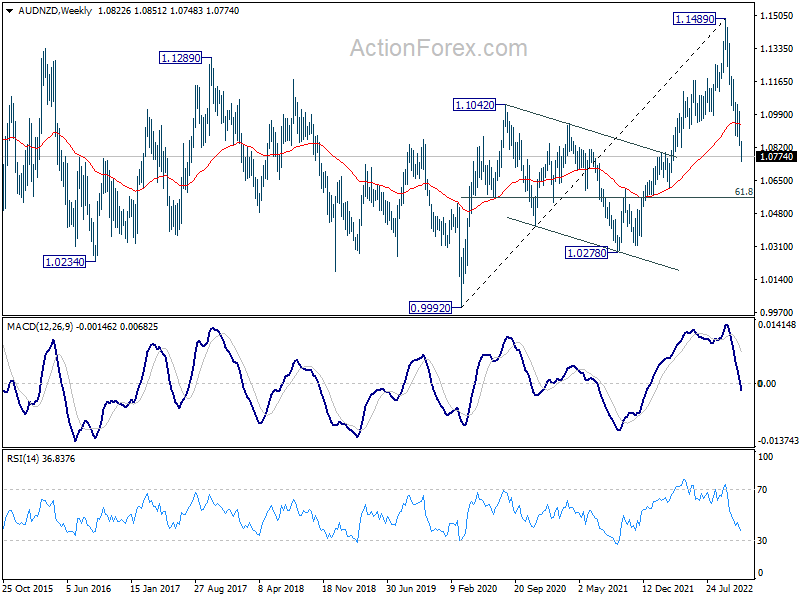
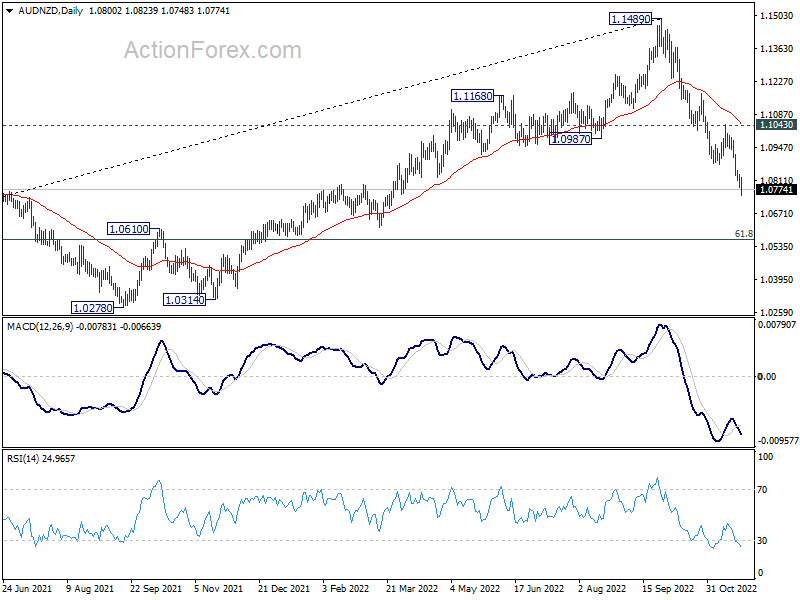
AUD/NZD is extending the decline from 1.1489 after RBNZ's rate hike today. For the near term, outlook will stay bearish as long as 1.1043 resistance holds, even in case of recovery.
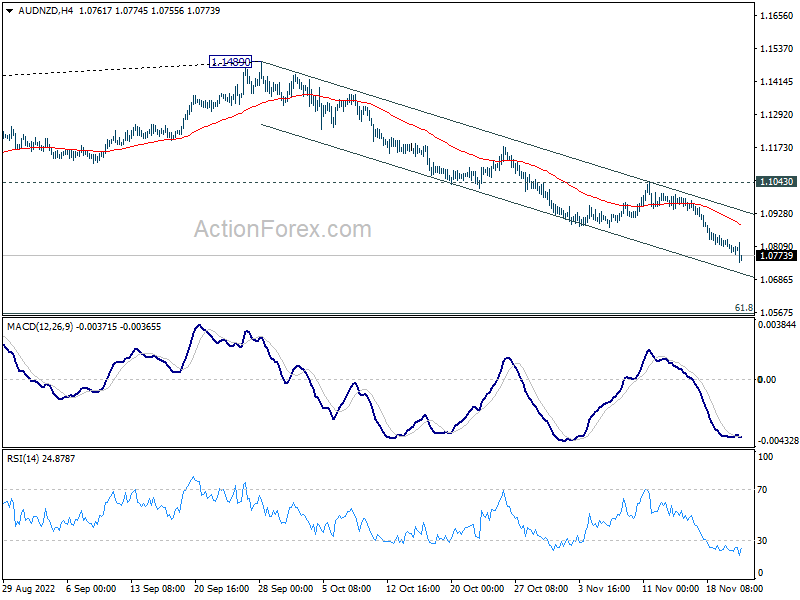
In the bigger picture, whole up trend from 0.9992 (2020 low) should have completed with three waves up to 1.1489. Current down side momentum argues that fall from 1.1489 is an impulsive move. But at this point, it's viewed as a leg inside the long term sideway pattern that started in 2015. Even in such case, AUD/NZD would try to hit 61.8% retracement of 0.9992 to 1.1489 at 1.0560 before forming a bottoming.
Looking ahead
Eurozone and UK PMIs are the main focuses in European session. Later in the day, US will release jobless claims, durable goods orders, PMIs, and new home sales. Fed will also publish FOMC minutes.
EUR/USD Daily Outlook
Daily Pivots: (S1) 1.0259; (P) 1.0283; (R1) 1.0328; More...
EUR/USD recovered after drawing support from 4 hour 55 EMA, but stays well below 1.0481. Intraday bias remains neutral an more consolidative trading could be seen. But after all, as long as 1.0092 resistance turned support holds, further rally is still expected. On the upside, break of 1.0481 will resume the rise from 0.9534 and target 1.0609 fibonacci level. However, sustained break of 1.0092 will turn bias to the downside for 55 day EMA (now at 1.0052) and below.
In the bigger picture, a medium term bottom was in place at 0.9534, on bullish convergence condition in daily MACD. Even as a corrective rise, rally from 0.9534 should target 38.2% retracement of 1.2348 (2021 high) to 0.9534 at 1.0609. Sustained trading above 55 week EMA (now at 1.0566) will raise the chance of trend reversal and target 61.8% retracement at 1.1273. This will now remain the favored case as long as 1.0092 resistance turned support holds.
Economic Indicators Update
| GMT | Ccy | Events | Actual | Forecast | Previous | Revised |
|---|---|---|---|---|---|---|
| 22:00 | AUD | Manufacturing PMI Nov P | 51.5 | 52.7 | ||
| 22:00 | AUD | Services PMI Nov P | 47.2 | 49.3 | ||
| 01:00 | NZD | RBNZ Rate Decision | 4.25% | 4.25% | 3.50% | |
| 08:15 | EUR | France Manufacturing PMI Nov P | 47 | 47.2 | ||
| 08:15 | EUR | France Services PMI Nov P | 50.6 | 51.7 | ||
| 08:30 | EUR | Germany Manufacturing PMI Nov P | 45.2 | 45.1 | ||
| 08:30 | EUR | Germany Services PMI Nov P | 46.4 | 46.5 | ||
| 09:00 | EUR | Eurozone Manufacturing PMI Nov P | 46.5 | 46.4 | ||
| 09:00 | EUR | Eurozone Services PMI Nov P | 48.4 | 48.6 | ||
| 09:30 | GBP | Manufacturing PMI Nov P | 45.6 | 46.2 | ||
| 09:30 | GBP | Services PMI Nov P | 48 | 48.8 | ||
| 13:30 | USD | Initial Jobless Claims (Nov 18) | 224K | 222K | ||
| 13:30 | USD | Durable Goods Orders Oct | 0.40% | 0.40% | ||
| 13:30 | USD | Durable Goods Orders ex Transportation Oct | 0.10% | -0.50% | ||
| 14:45 | USD | Manufacturing PMI Nov P | 49.8 | 50.4 | ||
| 14:45 | USD | Services PMI Nov P | 47.7 | 47.8 | ||
| 15:00 | USD | Michigan Consumer Sentiment Nov F | 54.7 | 54.7 | ||
| 15:00 | USD | New Home Sales Oct | 575K | 603K | ||
| 15:30 | USD | Crude Oil Inventories | -2.6M | -5.4M | ||
| 17:00 | USD | Natural Gas Storage | 86B | 64B | ||
| 19:00 | USD | FOMC Meeting Minutes |
Technical Outlook and Review
USD/JPY:
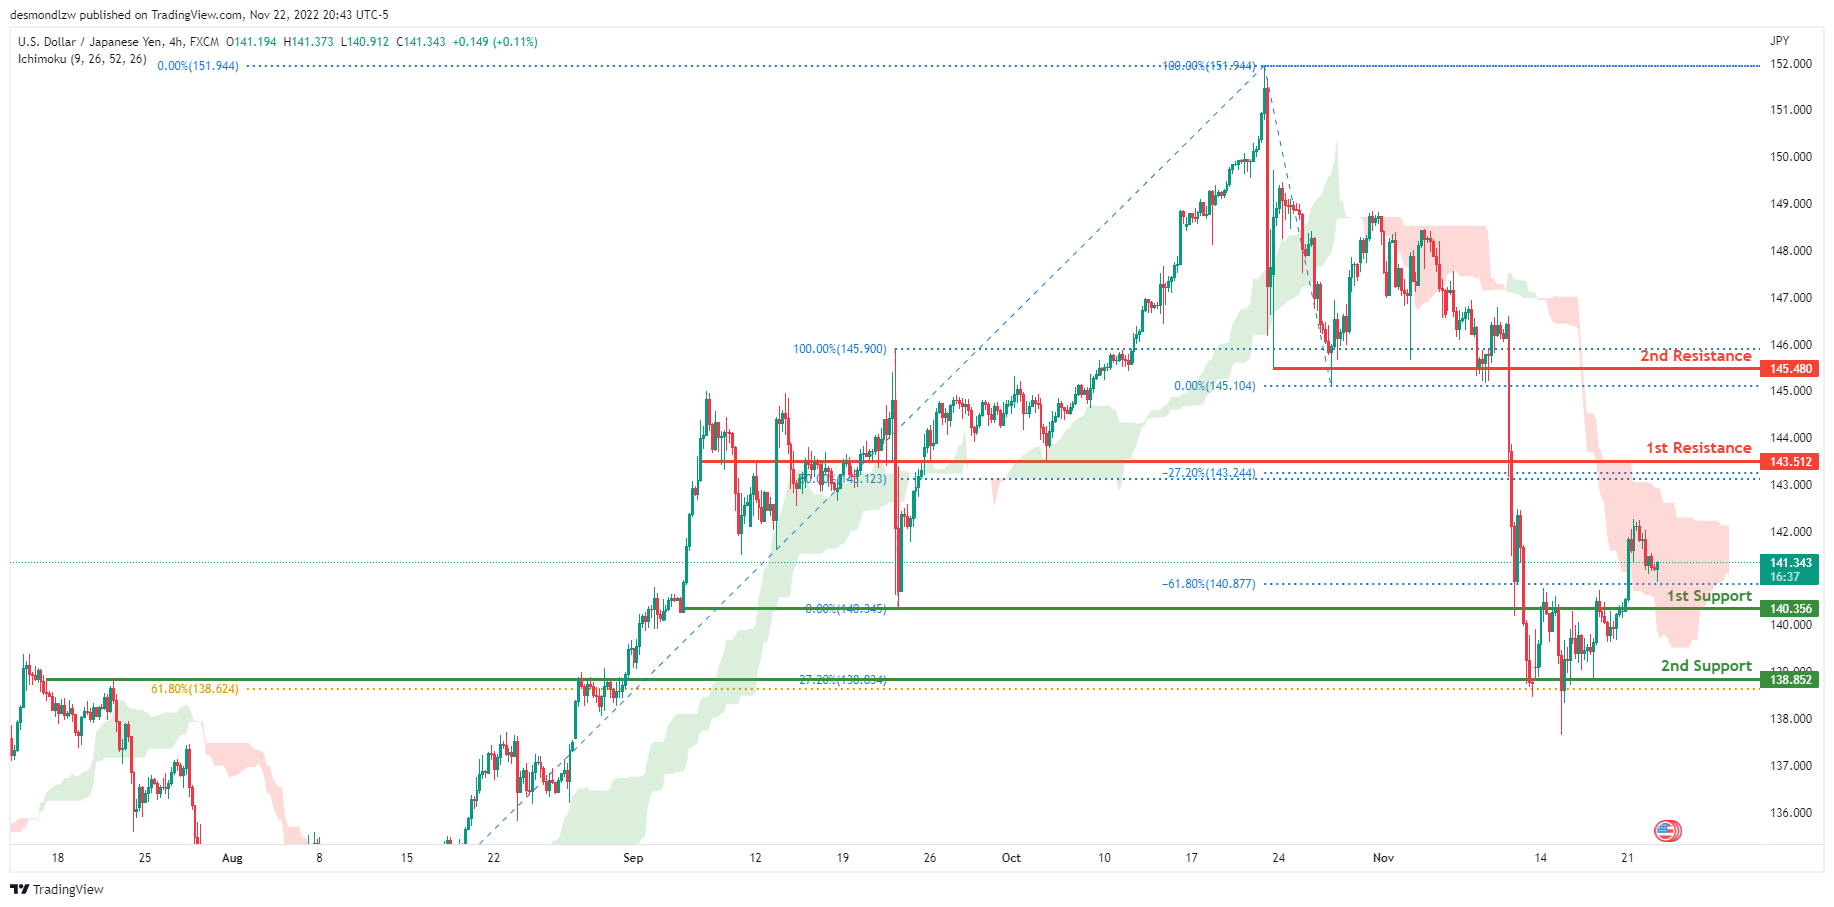
The current general bias for USDJPY on the H4 chart is bullish. To add confluence to this, the price is crossing the Ichimoku cloud which indicates a bullish market. If the bullish momentum continues, expect USDJPY to head towards the 1st resistance line at 143.512 where the -27.2% Fibonacci expansion line and 50% Fibonacci line are located .In an alternative scenario, price could go back down to retest the 1st support at 140.356, where the -61.8% Fibonacci expansion line and previous low are located
Areas of consideration:
- H4 time frame, 1st resistance at 143.512
- H4 time frame, 1st support at 140.356
DXY:
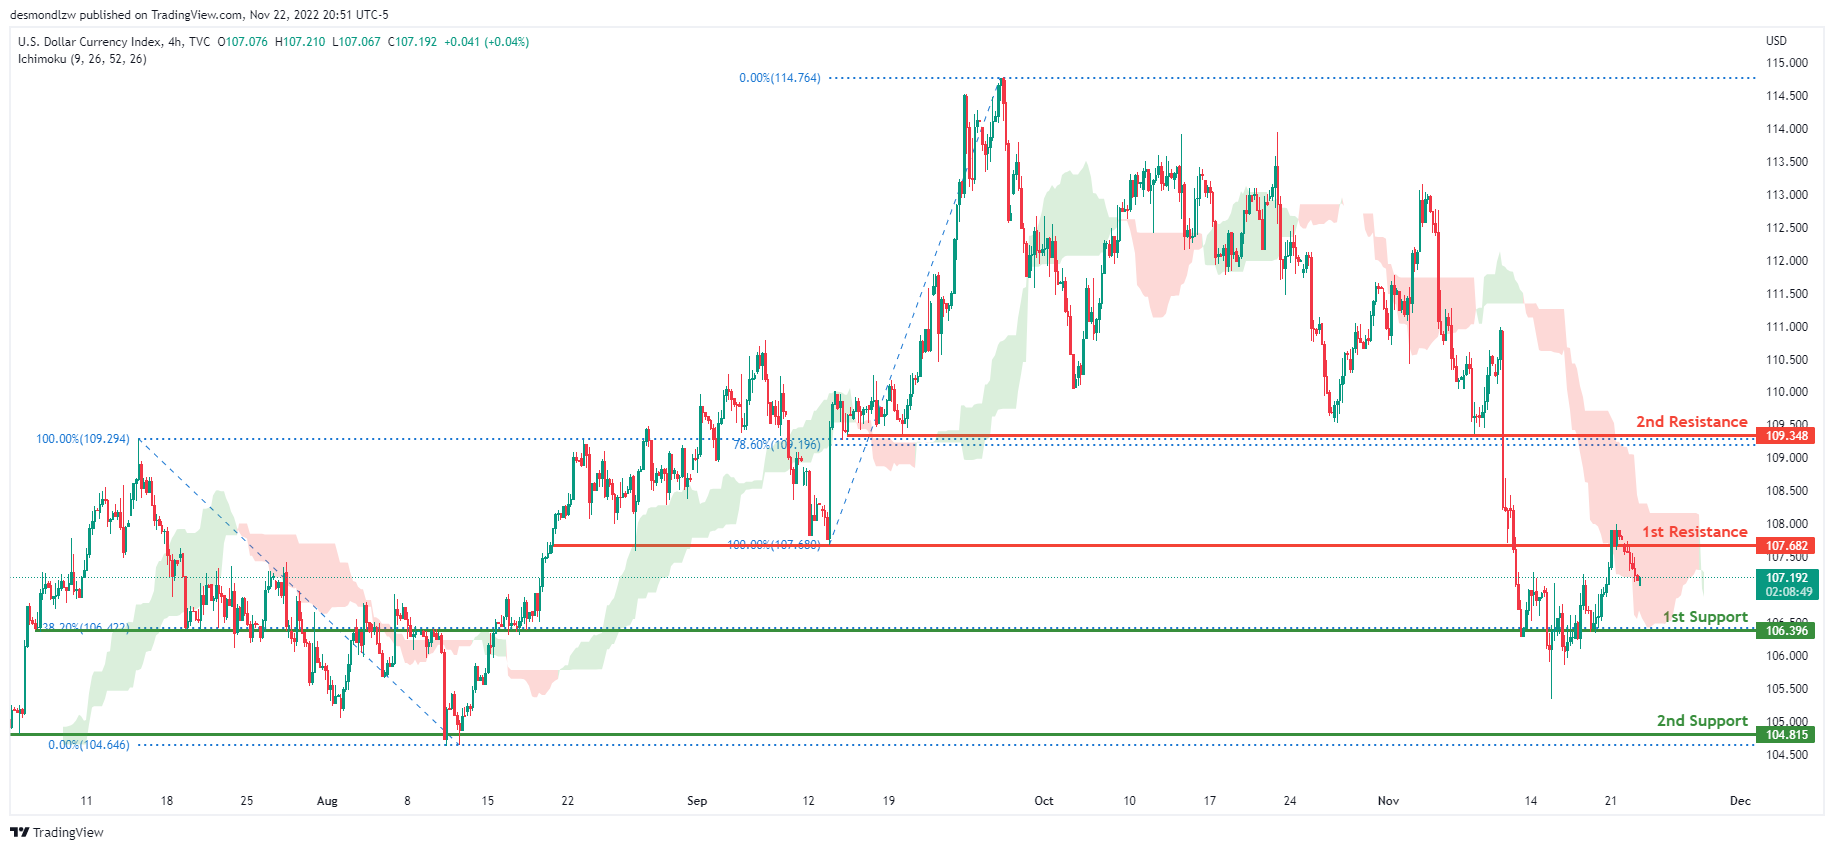
On the H4 chart, the overall bias for DXY is bearish. To add confluence to this, the price is crossing below the Ichimoku cloud which indicates a bearish market. If this bearish momentum continues, price could break the 1st support line at 106.396 where the 38.2% fibonacci line is located, before heading towards the 2nd support at 104.815 where the previous low and the 0% Fibonacci line are located. In an alternative scenario, price could head back up and retest the 1st resistance line at 107.682, where the previous low and 100% Fibonacci line are located. If this 1st resistance line is broken, the 2nd resistance is located at 109.348, where the 78.6% Fibonacci line is located
Areas of consideration:
- H4 time frame, 1st resistance at 107.682
- H4 time frame, 2nd resistance at 109.348
- H4 time frame, 1st support at 106.396
- H4 time frame, 2nd support at 104.815
EUR/USD:
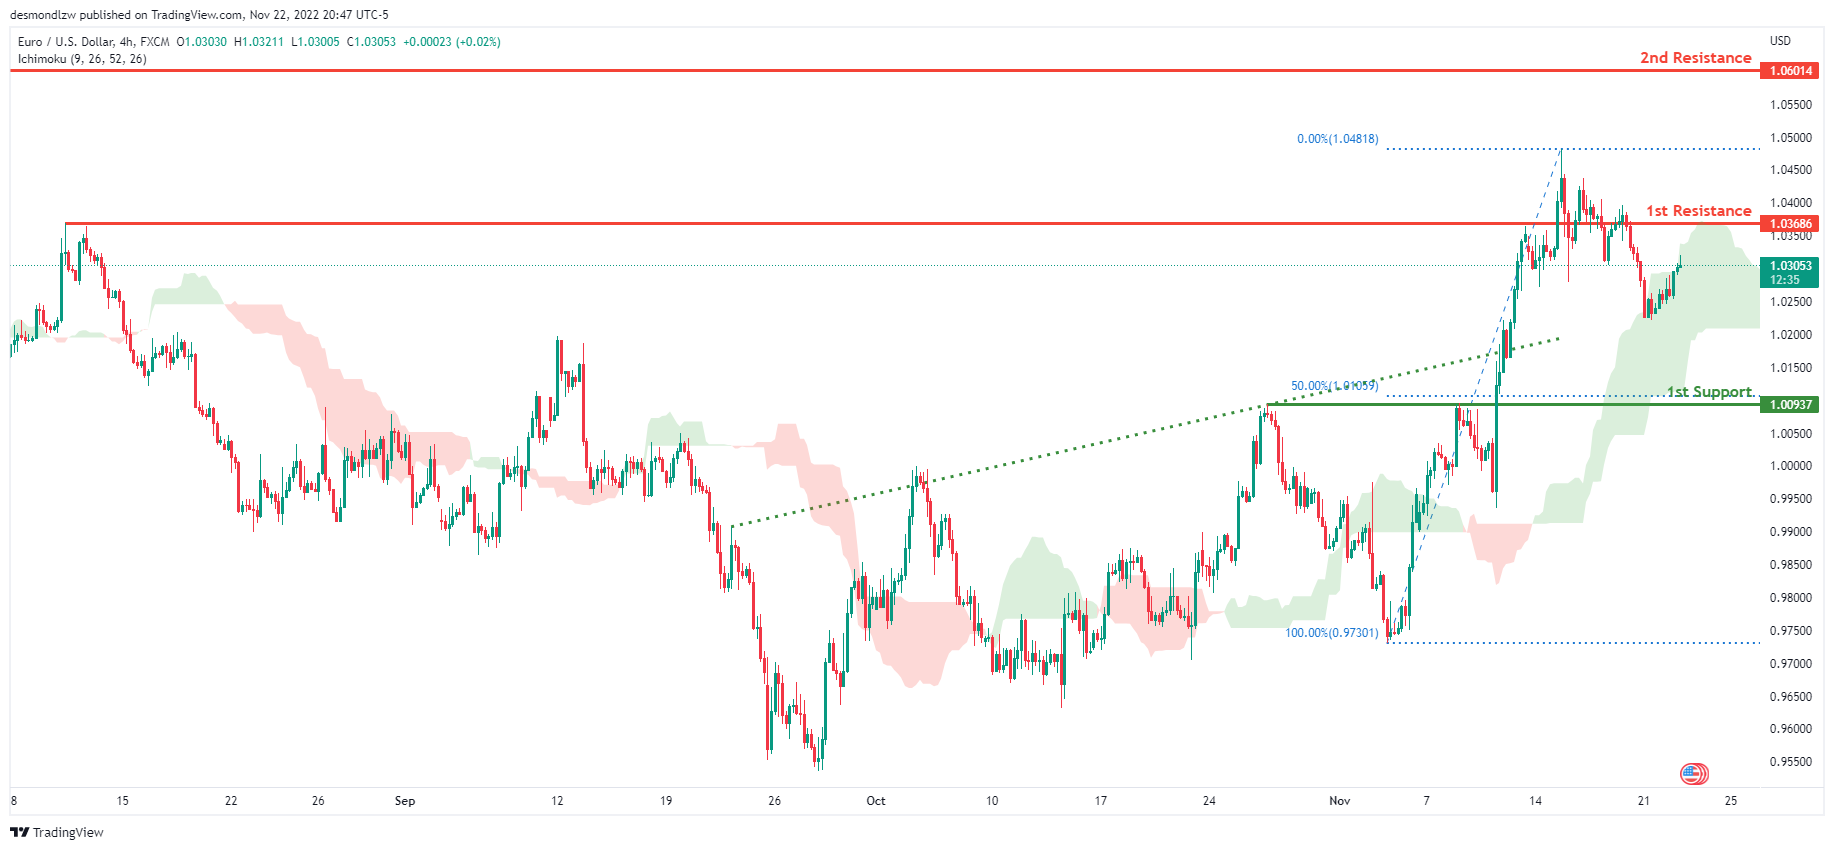
Looking at the H4 chart, my overall bias for EURUSD is bullish due to the current price being above the Ichimoku cloud, indicating a bullish market. To add confluence to this bias, price has also broken above the ascending trend line. If this bullish momentum continues, expect the price to possibly head back up to retest the 1st resistance at 1.03686, where the previous swing high is located. In an alternate scenario, price could possibly head back down towards the 1st support level at 1.00937, where the 50% Fibonacci line is located.
Areas of consideration :
- H4 1st resistance at 1.03686
- H4 1st support at 1.00937
GBP/USD:
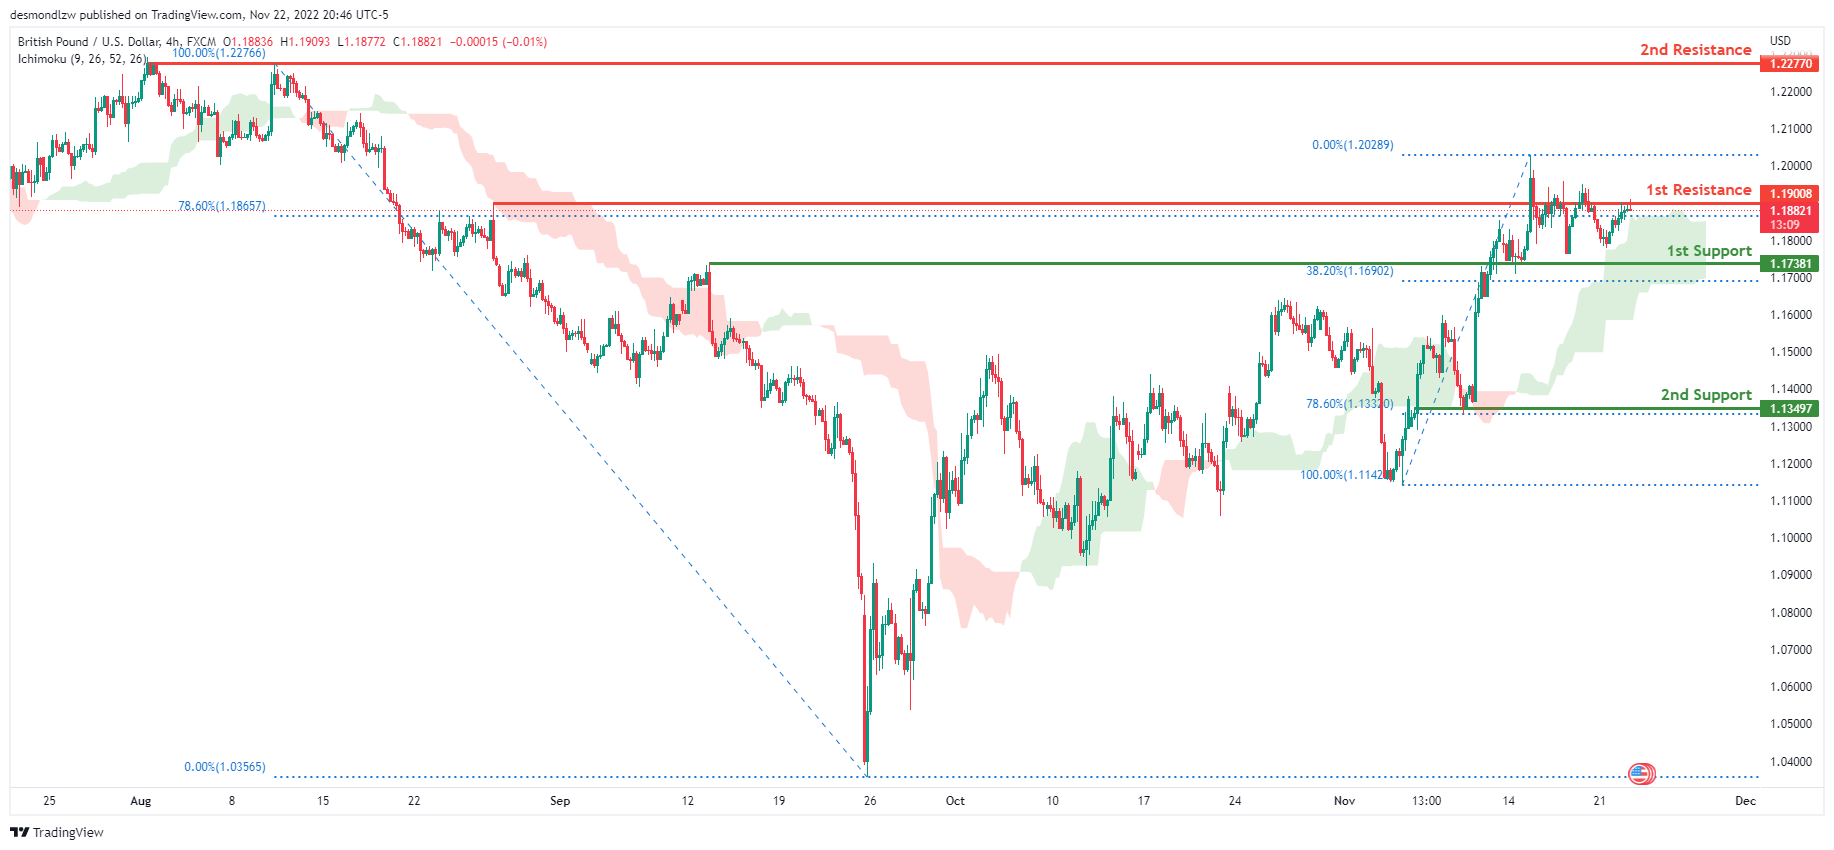
On the H4, the price is moving above the ichimoku cloud, suggesting that the price may break the first resistance level at 1.19008, which corresponds to the 78.6% fibonacci and the previous swing high, before heading to the 2nd resistance line at 1.22770, where the previous swing high is. Alternatively, the price may break the first support level at 1.17381, which is where the previous swing high and 38.2% Fibonacci line are, before moving on to the second support level at 1.13497, which is the 78.6% Fibonacci line.
Areas of consideration:
- H4 1st resistance at 1.19008
- H4 2nd resistance at 1.22770
- H4 1st support at 1.17381
USD/CHF:
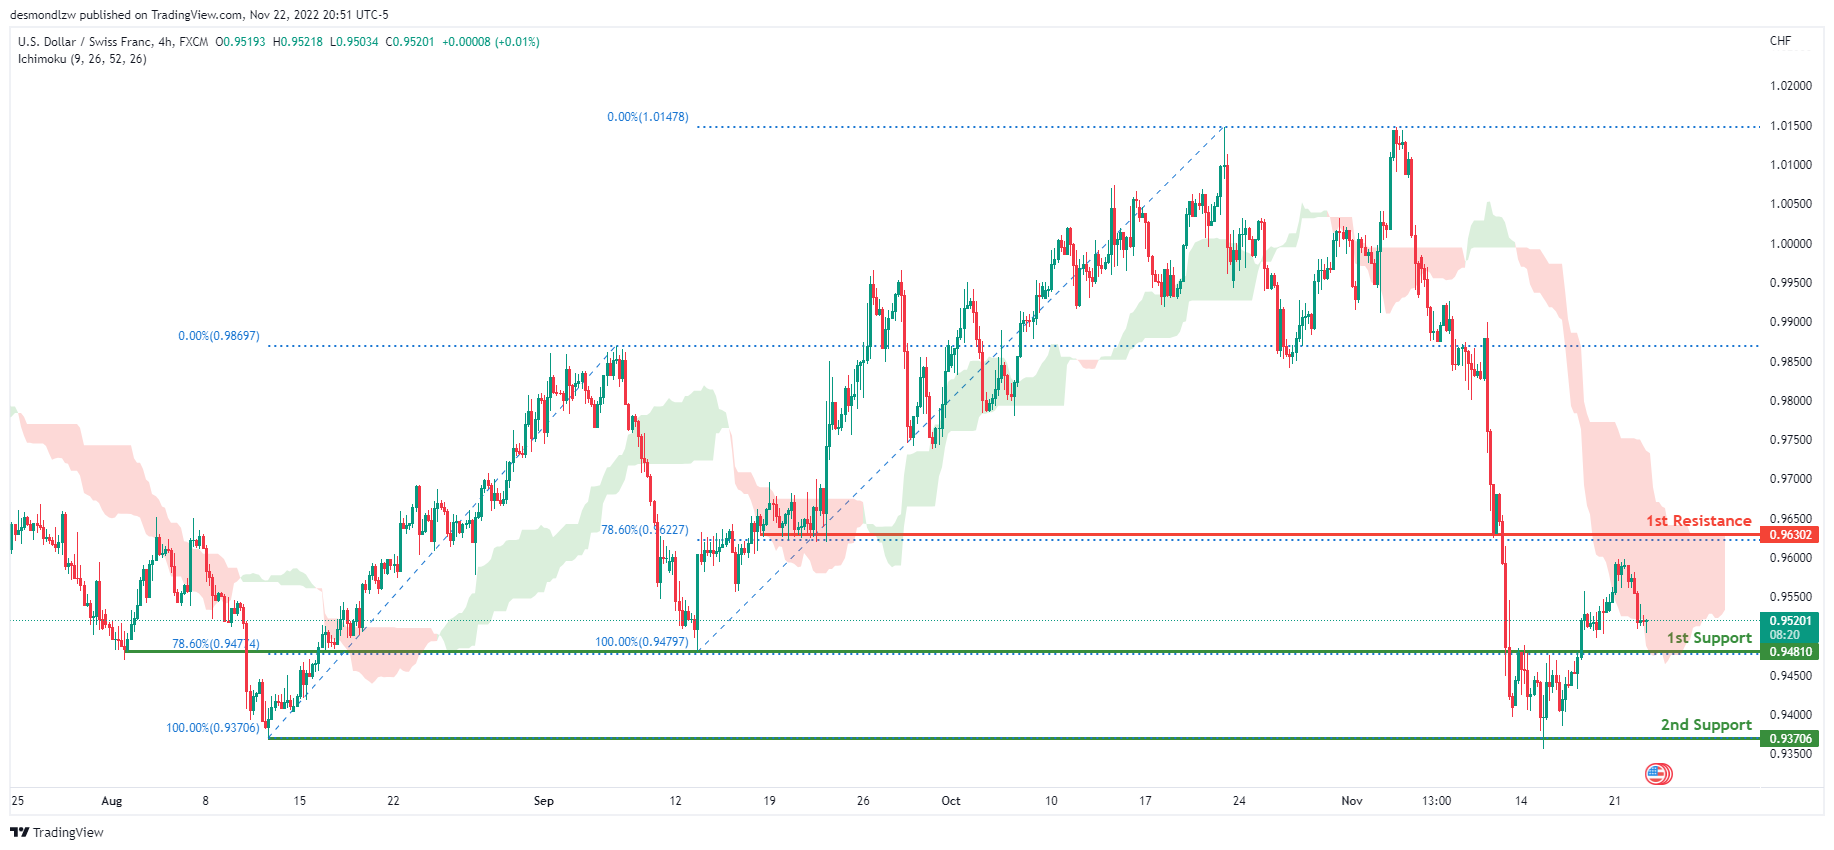
The overall bias for USDCHF on the H4 chart is bearish. In addition, the price is crossing below the Ichimoku cloud, indicating a bearish market. If the current bearish trend continues, the price might move back down to retest the first support line at 0.94810, where the 78.6% Fibonacci line is. In an alternate scenario, price could rise towards the first resistance line at 0.96302, where the 78.6% Fibonacci line is.
Areas of consideration
- H4 1st support at 0.94810
- H4 1st resistance at 0.96302
XAU/USD (GOLD):
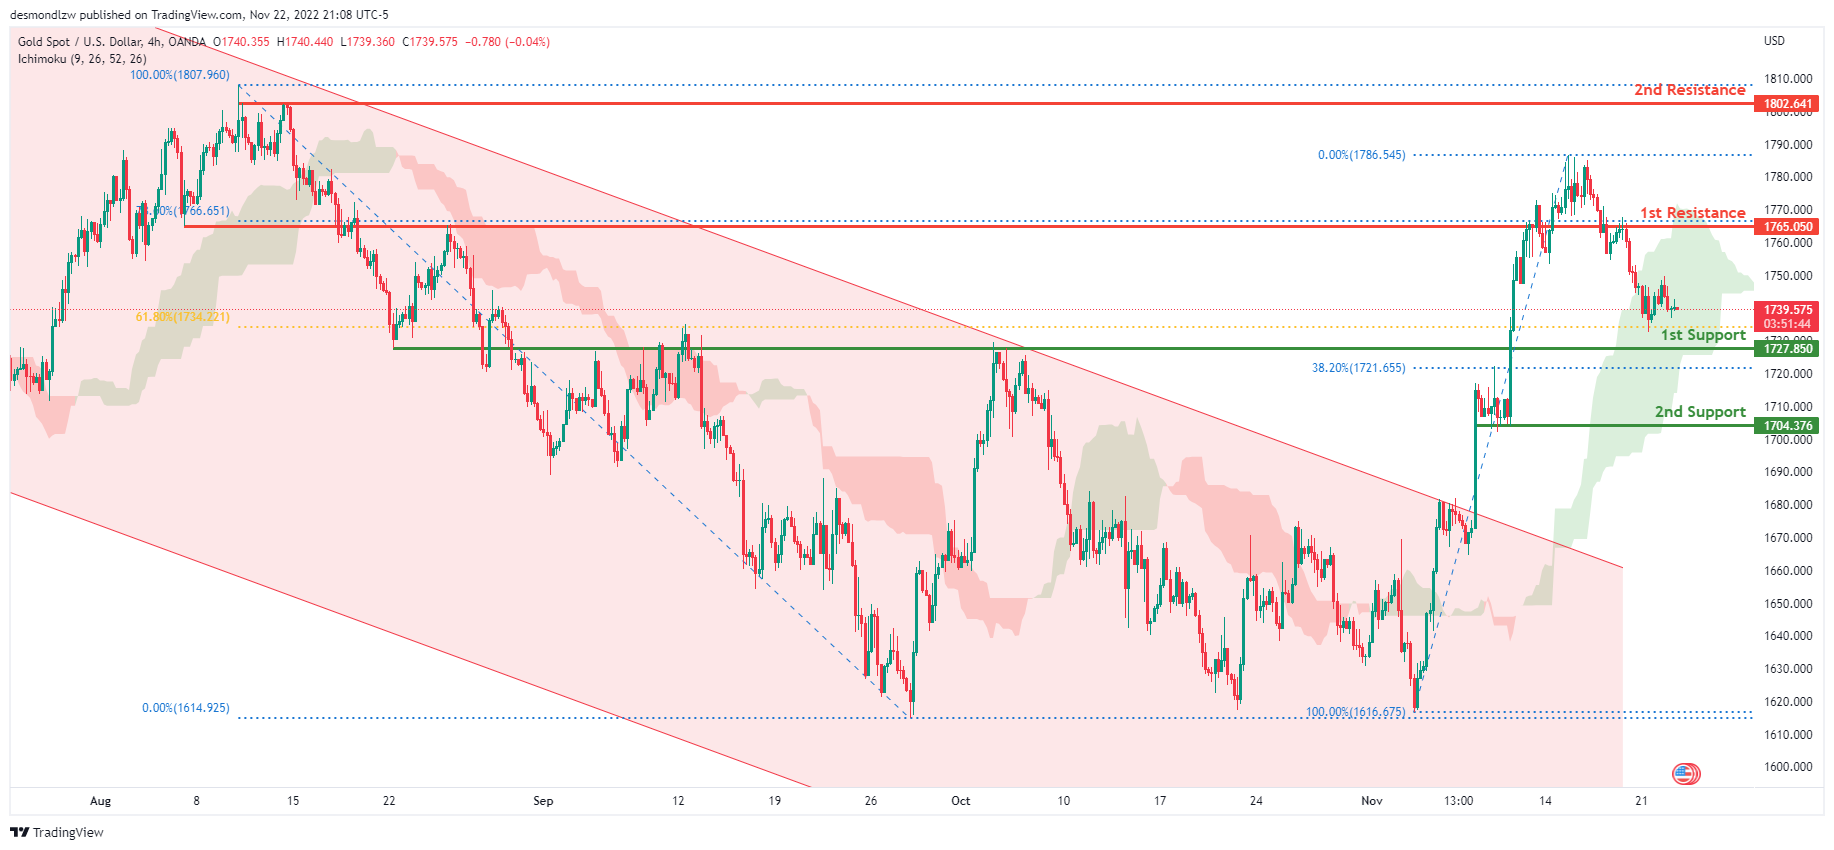
Looking at the H4 chart, my overall bias for XAUUSD is bearish due to the current price crossing below the Ichimoku cloud, indicating a bearish market. If this bearish momentum continues, expect price to possibly head back down towards the 1st support level at 1727.850, where the 38.2% and 61.8% Fibonacci lines are located.
In an alternate scenario, price could possibly head back up towards the 1st resistance at 1765.050, where the 78.6% Fibonacci line is located.
Areas of consideration:
- H4 time frame, 1st resistance at 1765.483
- H4 time frame, 1st support at 1727.850
AUD/USD:
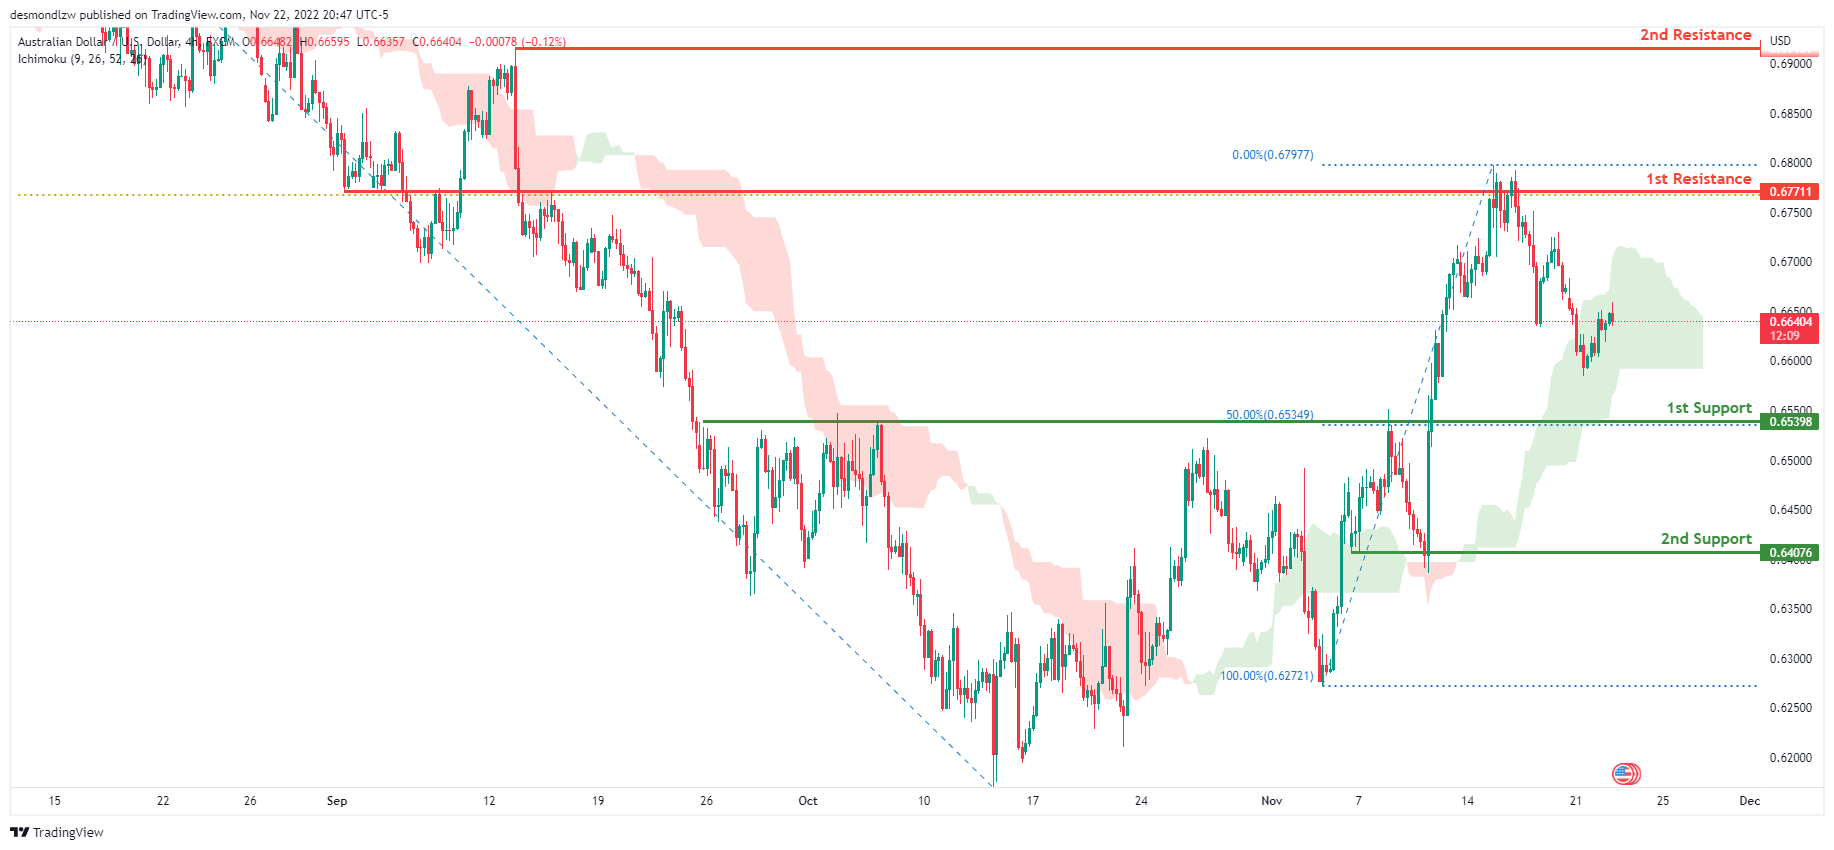
With the price crossing below the ichimoku cloud on the H4, we have a bearish bias that the price may fall to the first support level at 0.65398, which is marked by the 50% Fibonacci line. Alternatively, the price could break the first resistance at 0.67711, which is in line with the 61.8% fibonacci line, before heading towards the 2nd resistance line at 0.69161, the previous swing high.
Areas of consideration
- H4, 1st resistance at 0.67711
- H4, 2nd resistance at 0.69161
- H4, 1st support at 0.65398
NZD/USD:
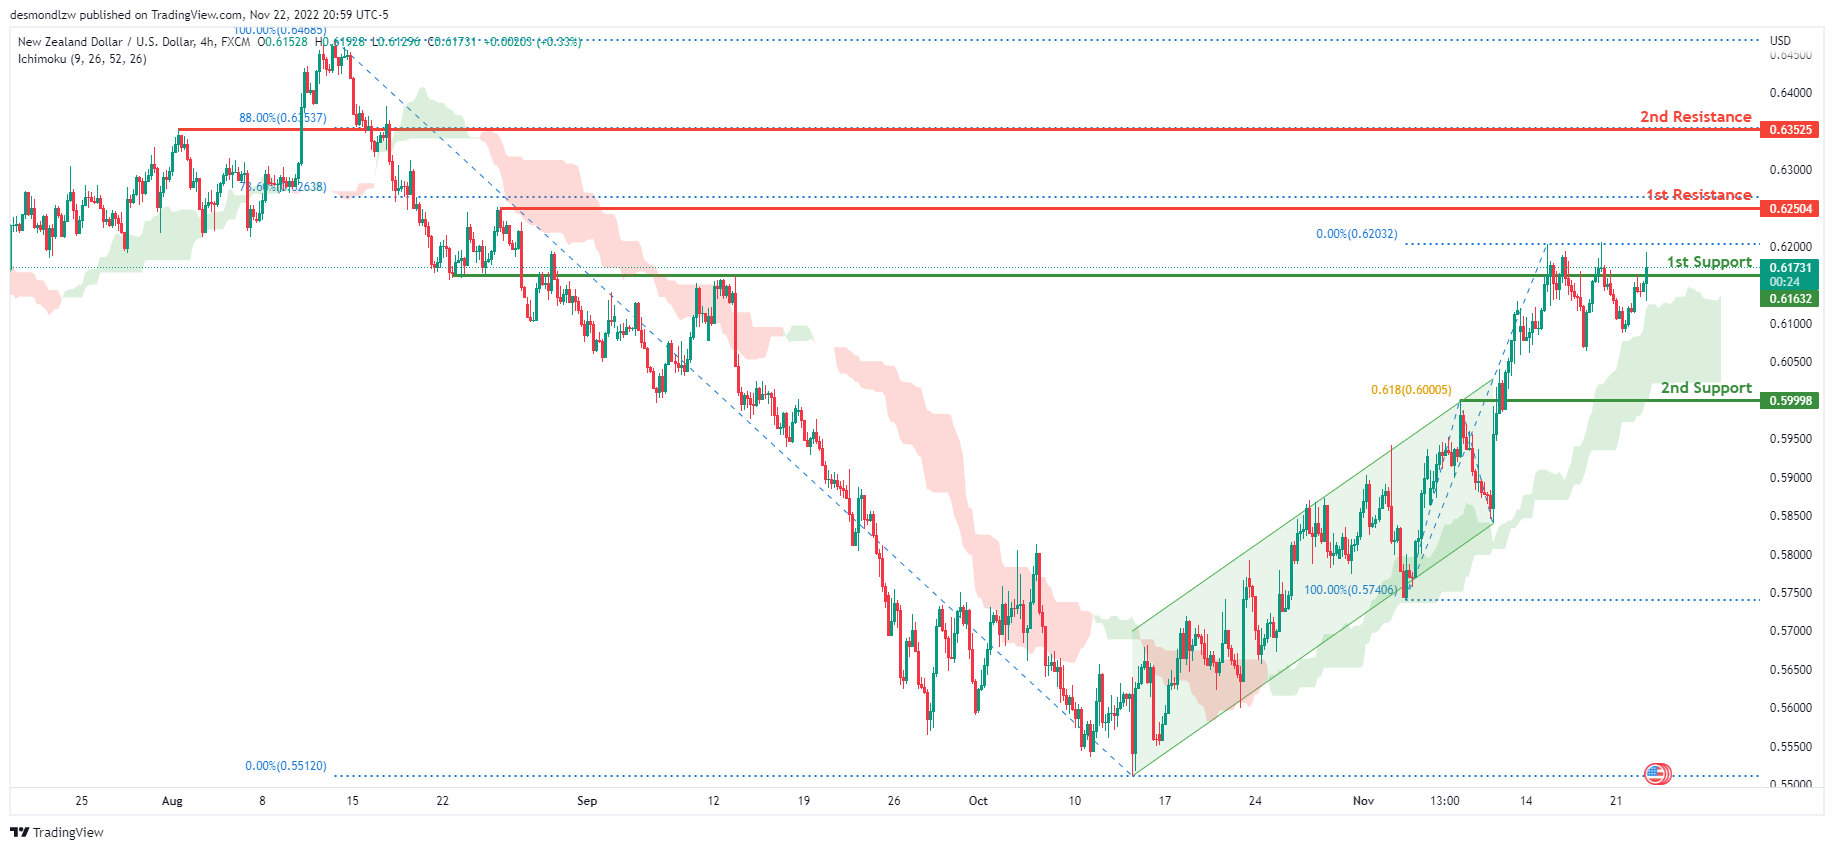
On the H4 chart, we have a bullish bias with the price moving above the Ichimoku cloud and has broken out of the ascending channel. If this bullish momentum continues, expect the price to head towards the 1st resistance line at 0.62504, where the 78.6% Fibonacci line is. Alternatively, the price may head back down and break the 1st support at 0.61632, where the previous swing high is located, before heading towards the 2nd support at 0.59998 where the 61.8% Fibonacci line is.
Areas of consideration:
- H4 time frame, 1st resistance at 0.62504
- H4 time frame, 1st support at 0.61632
- H4 time frame, 2nd support at 0.59998
USD/CAD:
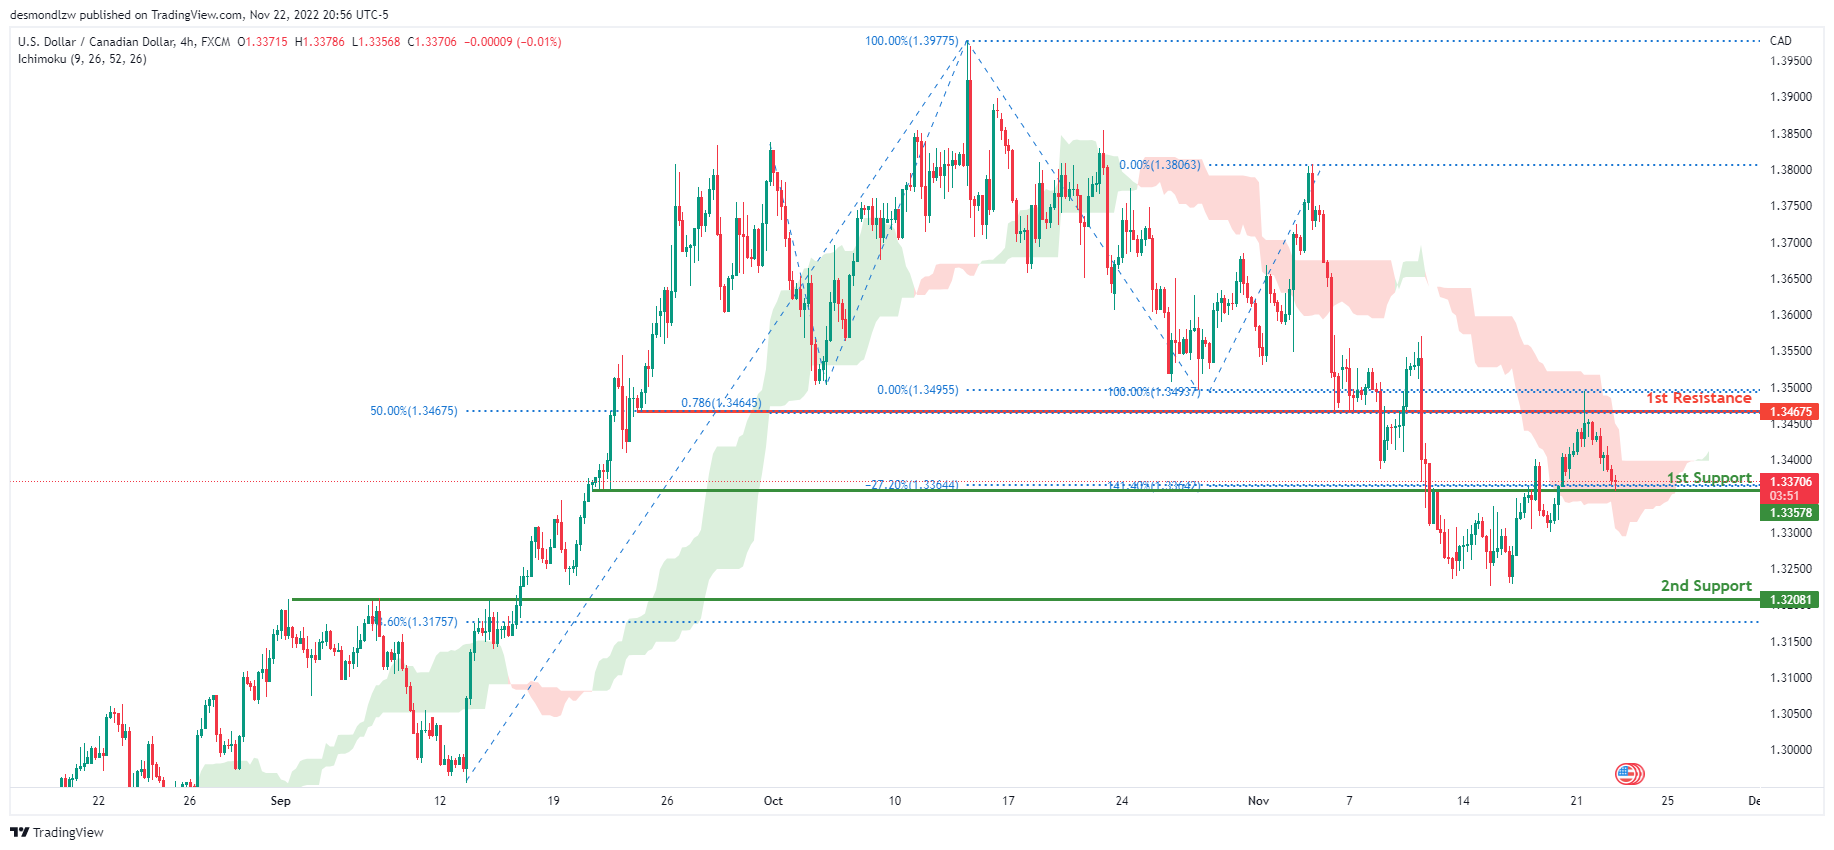
On the H4 chart, the overall bias for USDCAD is bearish. To add confluence to this, the price is crossing below the Ichimoku cloud which indicates a bearish market. If this bearish momentum continues, expect the price to break the 1st support line at 1.33578, where the -27.2% Fibonacci expansion line and 141.4% Fibonacci line is, before heading towards the 2nd support line at 1.32081 where the 78.6% Fibonacci line is located. In an alternative scenario, price could head back up to retest the 1st resistance line at 1.34675, where the 50% Fibonacci line and 78.6% Fibonacci projection line is.
Areas of consideration:
- H4 time frame, 1st resistance at 1.34675
- H4 time frame, 1st support at 1.33578
- H4 time frame, 2nd support at 1.32081
OIL:
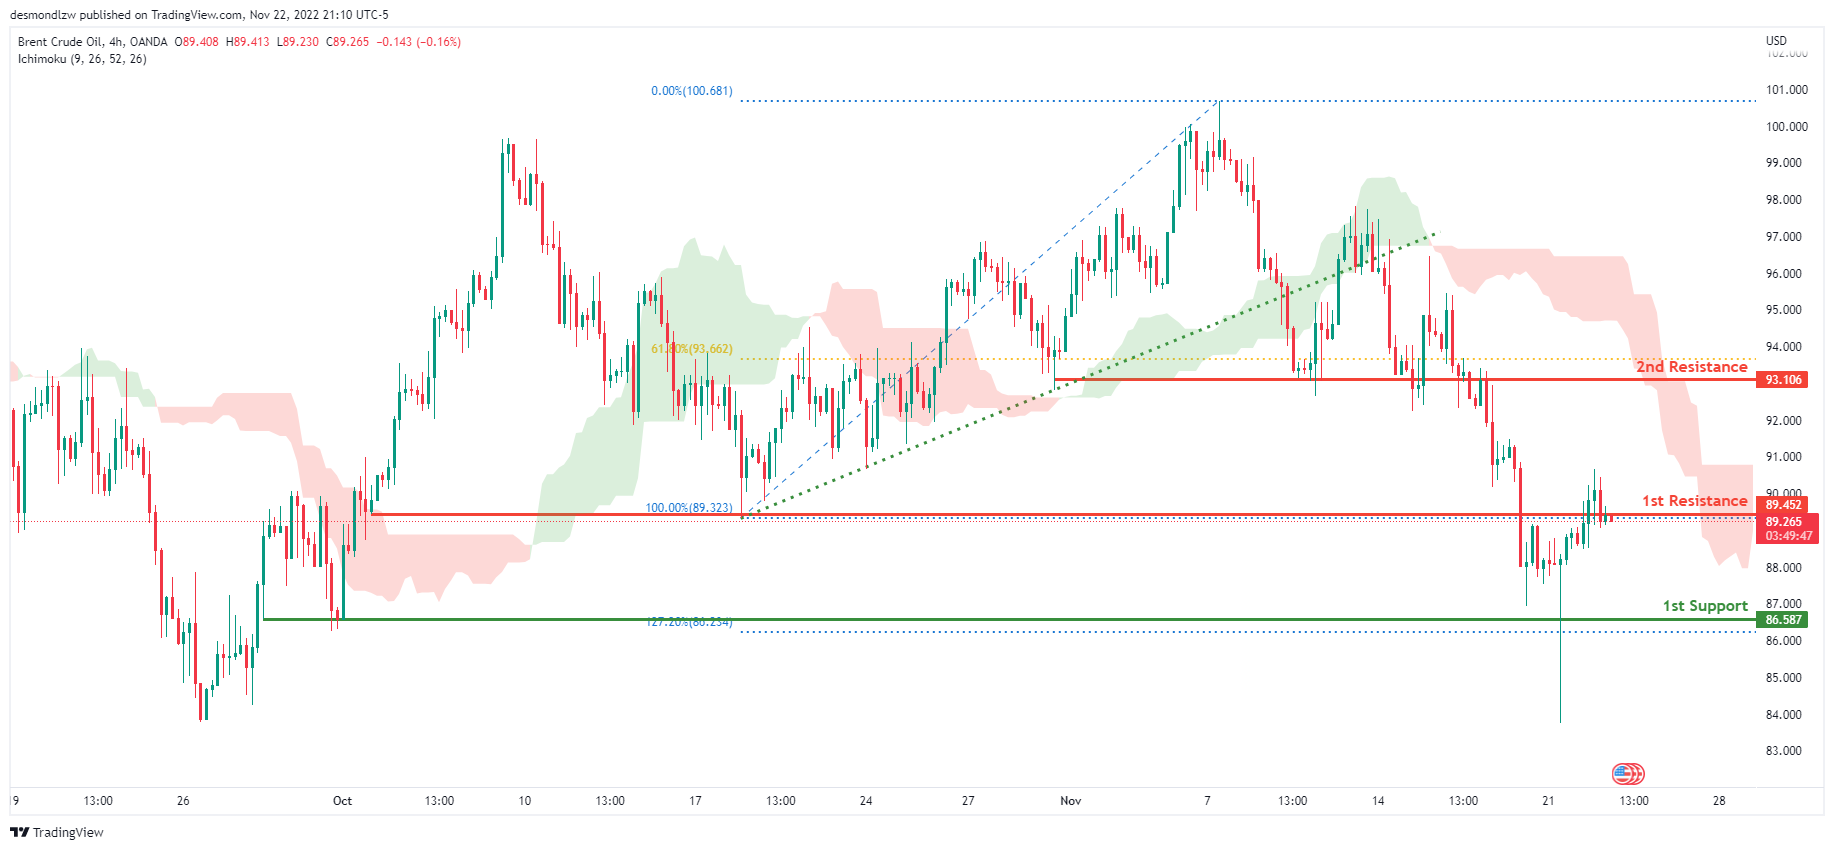
Looking at the H4 chart, my overall bias for BCOUSD is bearish due to the current price being below the Ichimoku cloud, indicating a bearish market. If this bearish momentum continues, expect price to possibly head towards the 1st support at 86.587, where the 127.2% Fibonacci extension line is located. In an alternate scenario, price could possibly break the 1st resistance level at 89.452, where the previous swing low is located, before heading towards the 2nd resistance level at 93.106, where the 61.8% Fibonacci line is.
Areas of consideration:
- H4 time frame, 1st resistance at 89.452
- H4 time frame, 2nd resistance at 93.106
- H4 time frame, 1st support at 86.587
- H4 time frame, 2nd support at 89.452
Dow Jones Industrial Average:
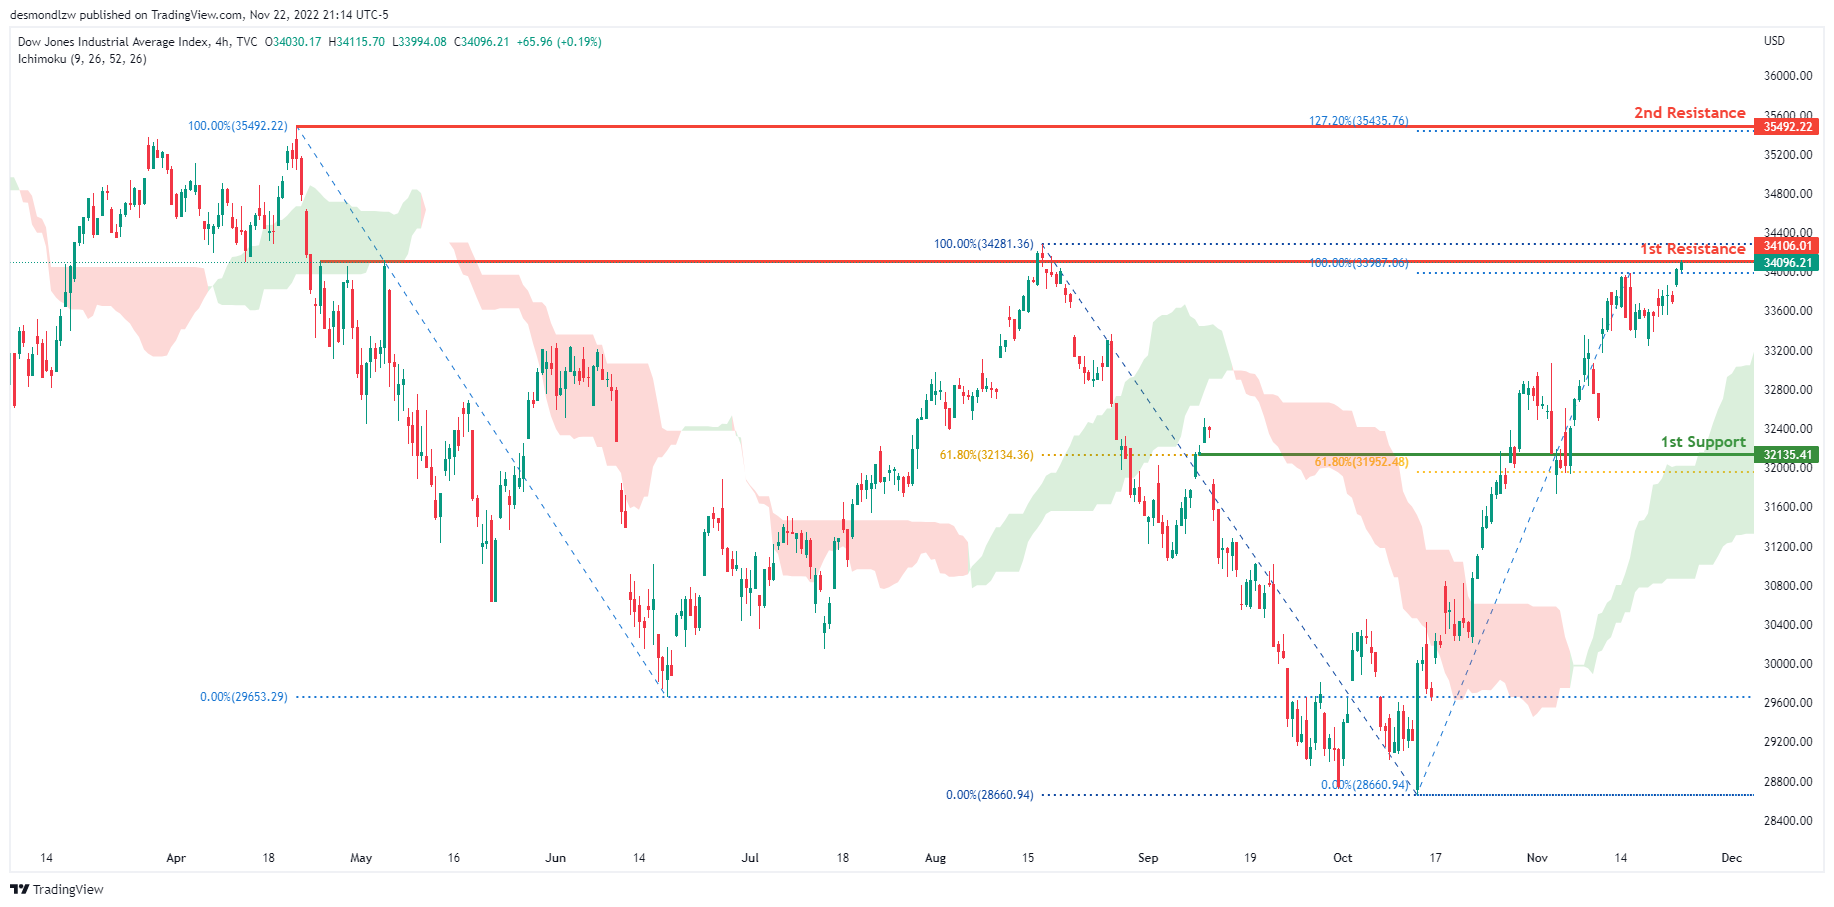
On the H4 chart, the overall bias for DJI is bullish. To add confluence to this, the price is above the Ichimoku cloud which indicates a bullish market. If this bullish momentum continues, expect the price to possibly break the 1st resistance at 34106.01 where the previous high and 100% Fibonacci line is located, before heading towards the 2nd resistance line at 35492.22, where the previous swing high and 127.2% Fibonacci extension line is. In an alternative scenario, price could head towards the 1st support line at 32135.41, where 2 of the 61.8% Fibonacci lines are located.
Areas of consideration:
- H4 time frame, 1st support at 32135.41
- H4 time frame, 1st Resistance at 34106.01
- H4 time frame, 2nd Resistance at 35492.22
DAX:
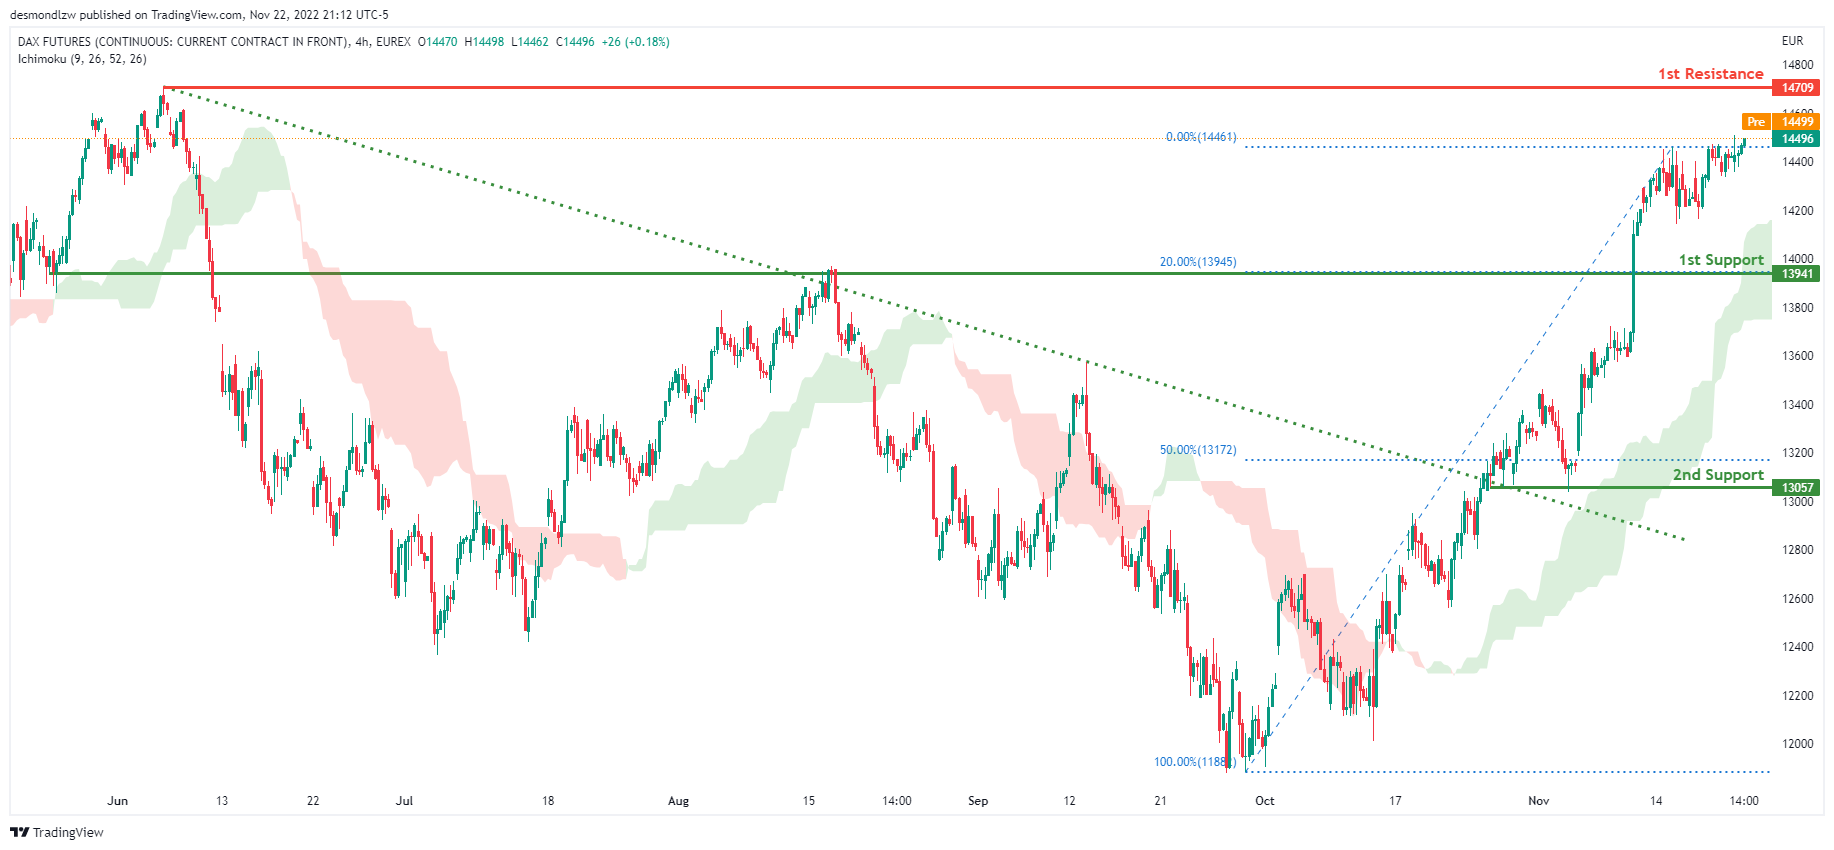
The H4 chart shows a bullish bias, with price breaking through the descending trendline and rising above the Ichimoku cloud. Price is expected to maintain its bullish momentum and rise to the first resistance level at 14709, where the previous swing high is located. Alternatively, the price could fall to the first support level at 13941, which corresponds to the 20% Fibonacci line.
Areas of consideration:
- H4 time frame, 1st resistance is at 14709
- H4 time frame, 1st support is at 13941
ETHUSD:
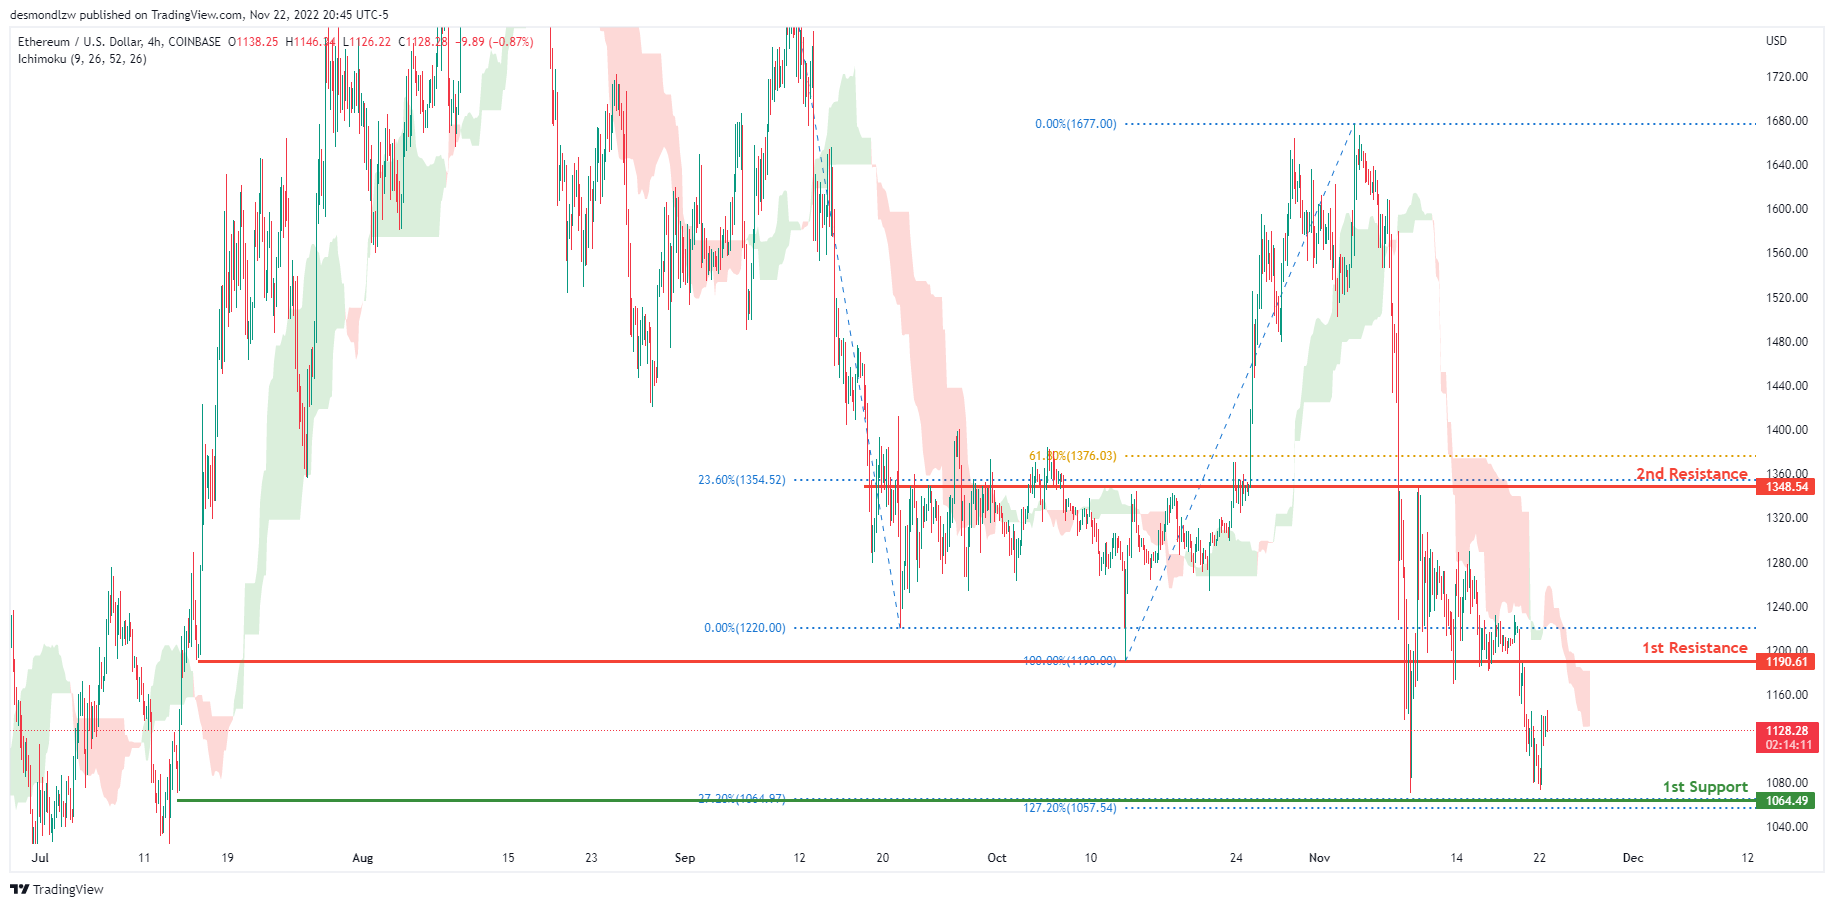
Looking at the H4 chart, my overall bias for XXX is bearish due to the current price being below the Ichimoku cloud, indicating a bearish market .If this bearish momentum continues, expect price to possibly head towards the 1st support at 1064.49, where the -27.2% Fibonacci expansion line and 127.2% Fibonacci extension line are located. In an alternate scenario, price could possibly head back up towards the 1st resistance level at 1190.61, where the previous swing low is located.
Areas of consideration:
- H4 time frame, 1st resistance of 1190.61
- H4 time frame, 1st support at 1064.49
BTCUSD:
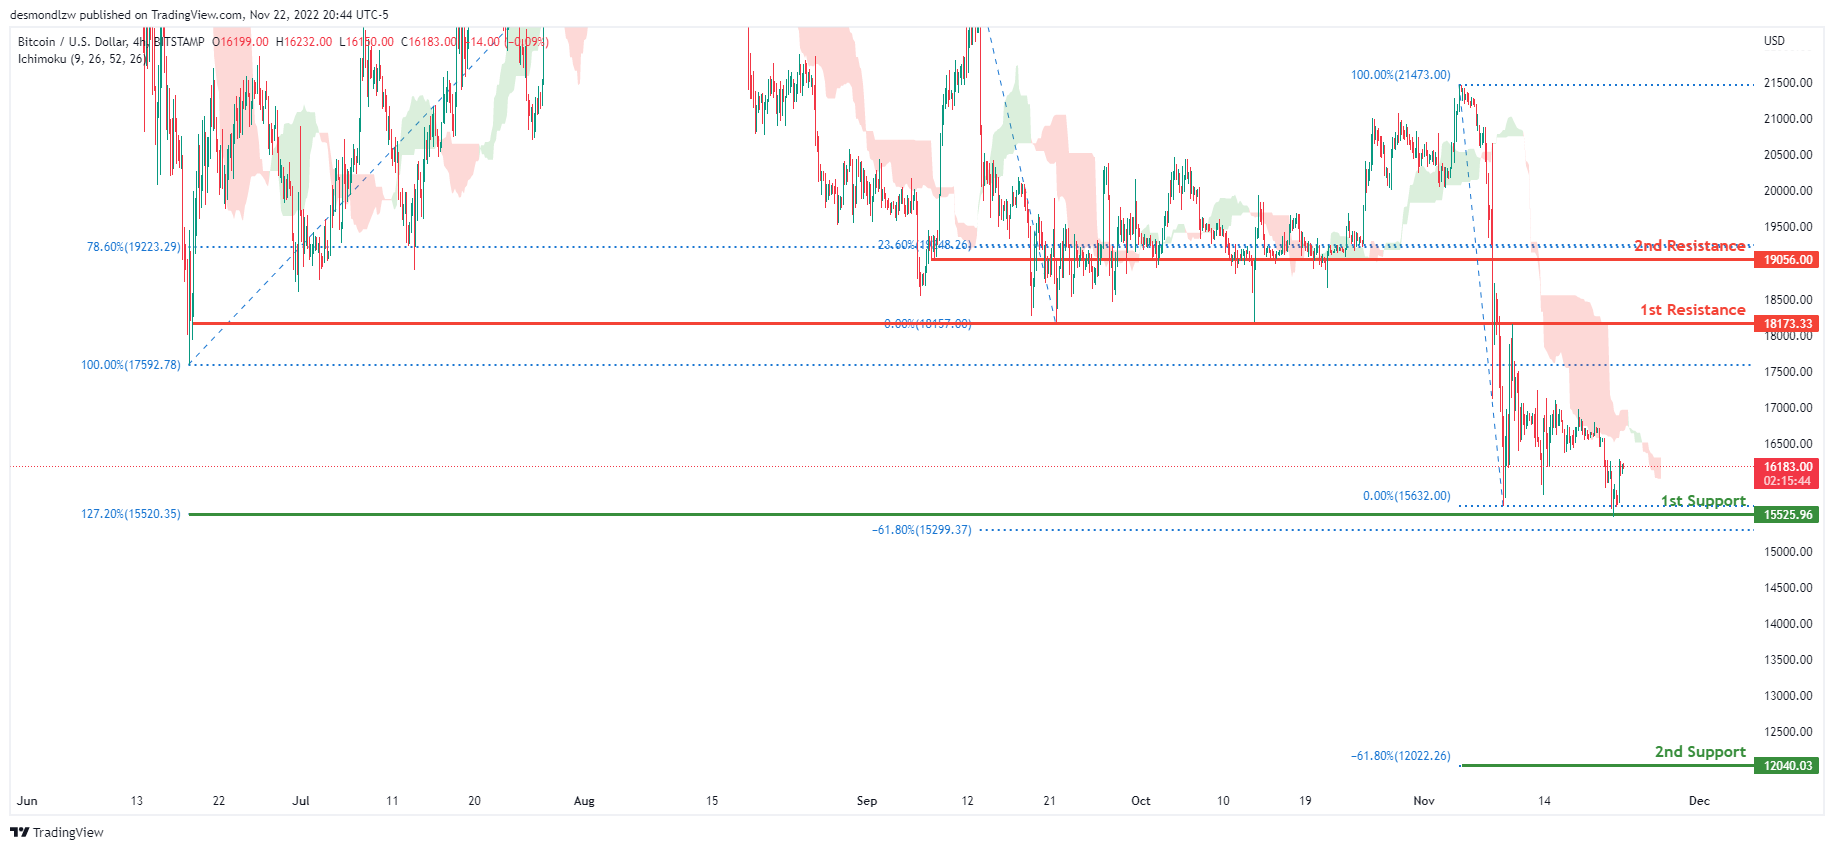
On the H4 chart, the overall bias for BTCUSD is bearish. To add confluence to this, the price is below the Ichimoku cloud which indicates a bearish market. If this bearish momentum continues, expect the price to head towards the 1st support line at 15525.96, where the 127.2% Fibonacci extension line and -61.8% Fibonacci expansion line is located. If price breaks the 1st support line, price could possibly head towards the 2nd support line at 12040.03 where the -61.8% Fibonacci expansion line is located. In an alternative scenario, price could head back up to retest the 1st resistance line at 18173.33, where the previous low and 0% Fibonacci line is located.
Areas of consideration:
- H4 time frame, 1st resistance 18173.33
- H4 time frame, 1st support at 15525.96
- H4 time frame, 2nd support at 12040.03
S&P 500:
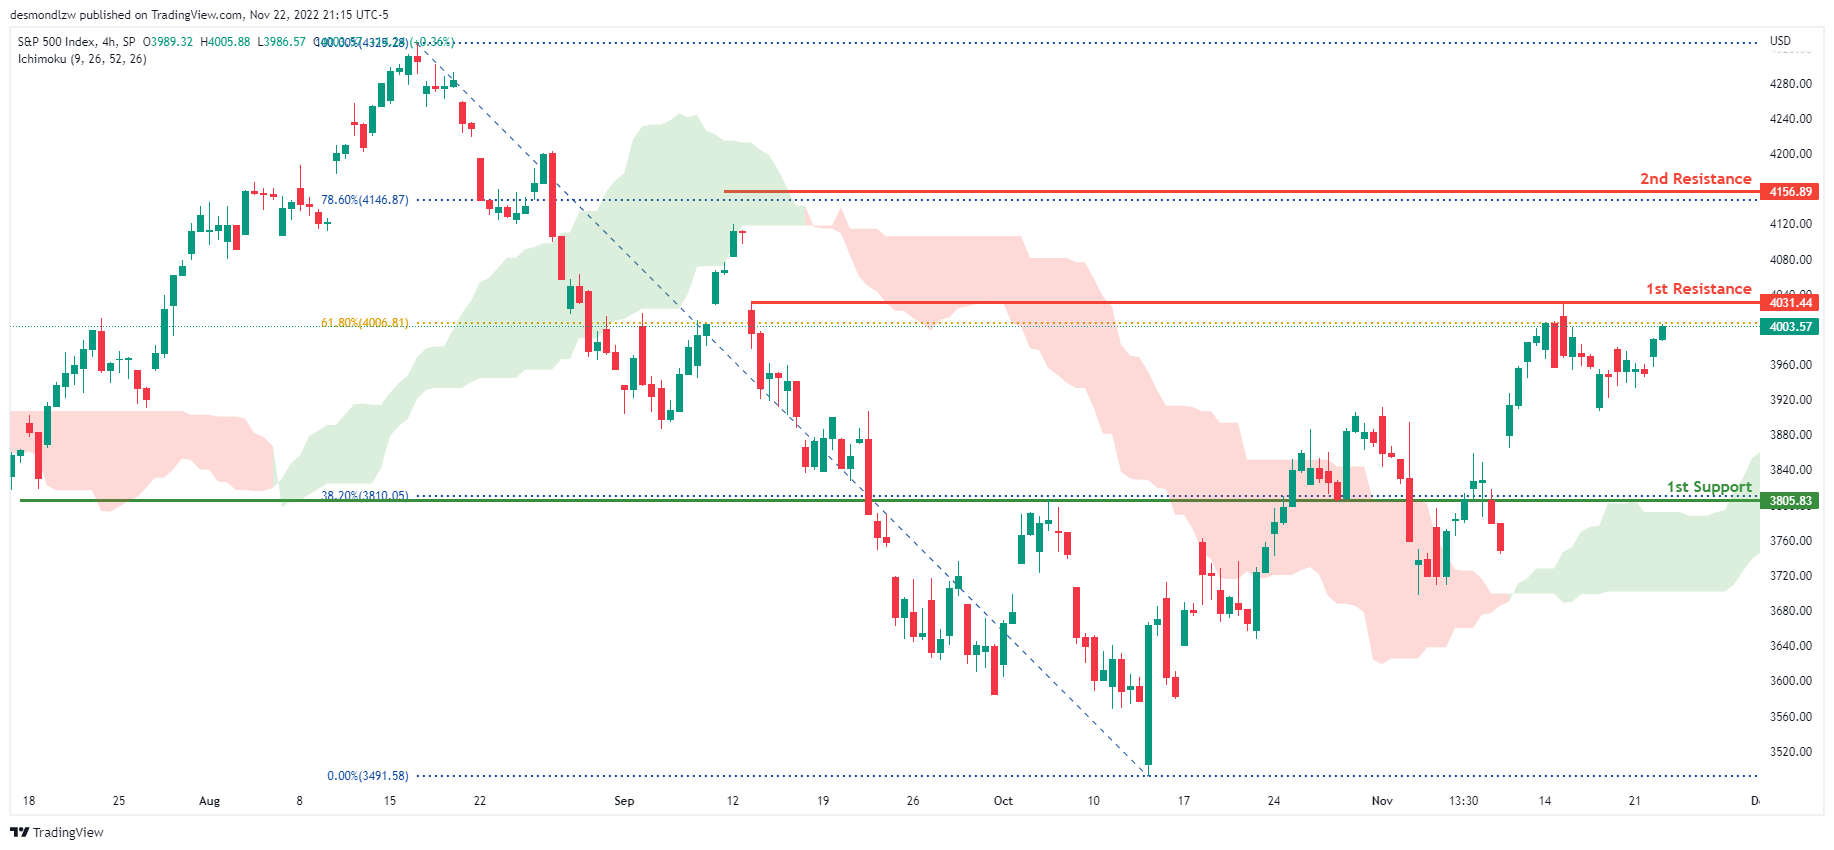
The overall bias for the S&500 on the H4 chart is bullish, with prices above the Ichimoku cloud. If the bullish momentum continues, the price will rise to the first resistance line at 4011.74, where the 61.8% Fibonacci line is located. If the first resistance line is broken, the second resistance line is at 4119.28, which is the previous swing high and the 78.6% Fibonacci line. In an alternate scenario, price could return to the first support line at 3805.83, where the 38.2% Fibonacci line is located.
Areas of consideration:
- H4 time frame, 1st support at 3805.83
- H4 time frame, 1st resistance at 4011.74
- H4 time frame, 2nd resistance at 4119.28
AUD/NZD extending decline after RBNZ
AUD/NZD is extending the decline from 1.1489 after RBNZ's rate hike today. For the near term, outlook will stay bearish as long as 1.1043 resistance holds, even in case of recovery.
In the bigger picture, whole up trend from 0.9992 (2020 low) should have completed with three waves up to 1.1489. Current down side momentum argues that fall from 1.1489 is an impulsive move. But at this point, it's viewed as a leg inside the long term sideway pattern that started in 2015. Even in such case, AUD/NZD would try to hit 61.8% retracement of 0.9992 to 1.1489 at 1.0560 before forming a bottoming.
Australia PMI composite dropped to 47.7, deteriorating demand and worsening price pressures
Australia PMI Manufacturing dropped from 52.7 to 51.5 in November, a 29-month low. PMI Services dropped from 49.3 to 47.2, a 10-month low. PMI Composite also dropped from 49.8 to 47.7, a 10-month low.
Jingyi Pan, Economics Associate Director at S&P Global Market Intelligence said:
"The latest S&P Global Flash Australia Composite PMI data revealed that the private sector economy further contracted midway into the fourth quarter, faced with deteriorating demand conditions. In particular, the service sector continued to be affected by higher interest rates and capacity constraints, leading to a sharper fall in business activity.
"That said, with price inflation further climbing in November, the pressure remains on the central bank to keep tightening monetary policy to rein in prices. This is also amid indications of solid employment growth from the PMI data.
"The mix of deteriorating demand and worsening price pressures does not bode well for the near-term outlook, and this has also been reinforced by the decline in private sector confidence in November."
RBNZ hikes 75bps to 4.25%, tightening not finished
RBNZ raises the Official Cash Rate by a record 75bps to 4.25% as widely expected. The central bank maintained that "monetary conditions needed to continue to tighten further, so as to be confident there is sufficient restraint on spending to bring inflation back within its 1-3 percent per annum target range."
During the meeting, increases of 50, 75 and 100bps were considered. But members agreed that "a larger increase in the OCR was appropriate, given the resilience of domestic spending, and the higher and more persistent actual and expected inflation outcomes."
But on the "balances of risks", a 75bps hike was "appropriate at this meeting". Members highlights that "the cumulative tightening of monetary conditions delivered to date continues to pass through to the economy via the lagged transmission to effective retail interest rates."
In the new forecasts, annual inflation is projected to rise further to 7.5% in Q4 and Q1, then stay above 5% throughout 2023. Inflation would then slowly drop back to 2.9% in Q3, 2024. Quarterly GDP is projected to contract from Q2 2023 to Q1 2024, turn flat in Q2 and Q3 2024, before returning to slight growth. OCR will continue to rise and peak at 5.5% in Q3 2023, before turning down in second half of 2024.
(RBNZ) Higher interest rates necessary
The Committee agreed that the OCR needs to reach a higher level, and sooner than previously indicated, to ensure inflation returns to within its target range over the medium term. Core consumer price inflation is too high, employment is beyond its maximum sustainable level, and near-term inflation expectations have risen.
Global consumer price inflation is broad based and remains heightened. Food and energy prices, and persistent core inflation, have combined to create very high headline inflation in many countries. Central banks are tightening monetary conditions in an effort to slow spending and reduce inflation pressure. The ongoing slowdown in global growth will affect New Zealand through both financial and trade channels, and impact on people's confidence due to uncertainty.
In New Zealand, household spending remains resilient, especially considering the rise in debt servicing costs, the fall in house prices, and low levels of consumer confidence. Employment levels are high, and income growth and household savings are supporting spending. The rebound in tourism is also supporting domestic demand.
The productive capacity of the economy is being constrained by broad-based labour shortages, and wage pressures are evident. Aggregate demand continues to outstrip New Zealand's capacity to supply goods and services, with a range of indicators continuing to signify broad-based inflation pressure.
Committee members agreed that monetary conditions needed to continue to tighten further, so as to be confident there is sufficient restraint on spending to bring inflation back within its 1-3 percent per annum target range. The Committee remains resolute in achieving the Monetary Policy Remit.
First Impressions: RBNZ Monetary Policy Statement November 2022
The Reserve Bank raised the Official Cash Rate by a record 75 basis points to 4.25% and signalled more to come, with its forecasts suggesting that a recession will be needed to rein in inflation.
RBNZ Monetary Policy Statement, November 2022
- The Reserve Bank has increased the Official Cash Rate by 75 basis points to 4.25%. The size of the move was generally expected by economists and financial markets.
- The big surprise was in the projected OCR track. The RBNZ expects the OCR will need to rise to a peak of 5.5% next year (compared to a 4.1% peak in its August forecasts).
- The RBNZ sees inflation as deeply embedded in the New Zealand economy. It now believes that a recession will be needed to bring inflation back within the 1-3% target range in the coming years.
- Even then, it has substantially upgraded its inflation forecasts compared to August, and is not expecting inflation to drop below 3% until the second half of 2024.
- The Monetary Policy Committee also discussed the possibility of a 100 basis point increase today, but settled on a 75 point increase, noting the lagged effects of past interest rate hikes.
- Our current forecast is for a 5% peak in the OCR by early next year. In our view this remains sufficient to bring inflation under control, with borrowers about to encounter substantially higher retail interest rates in the coming months.
- However, the risk is clearly for a higher peak in the near term, given the RBNZ’s inclinations.
RBNZ media release
Higher interest rates necessary
The Monetary Policy Committee today increased the Official Cash Rate (OCR) from 3.5 percent to 4.25 percent.
The Committee agreed that the OCR needs to reach a higher level, and sooner than previously indicated, to ensure inflation returns to within its target range over the medium-term. Core consumer price inflation is too high, employment is beyond its maximum sustainable level, and near-term inflation expectations have risen.
Global consumer price inflation is broad based and remains heightened. Food and energy prices, and persistent core inflation, have combined to create very high headline inflation in many countries. Central banks are tightening monetary conditions in an effort to slow spending and reduce inflation pressure. The ongoing slowdown in global growth will affect New Zealand through both financial and trade channels, and impact on people’s confidence due to uncertainty.
In New Zealand, household spending remains resilient, especially considering the rise in debt servicing costs, the fall in house prices, and low levels of consumer confidence. Employment levels are high, and income growth and household savings are supporting spending. The rebound in tourism is also supporting domestic demand.
The productive capacity of the economy is being constrained by broad-based labour shortages, and wage pressures are evident. Aggregate demand continues to outstrip New Zealand’s capacity to supply goods and services, with a range of indicators continuing to signify broad-based inflation pressure.
Committee members agreed that monetary conditions needed to continue to tighten further, so as to be confident there is sufficient restraint on spending to bring inflation back within its 1-3 percent per annum target range. The Committee remains resolute in achieving the Monetary Policy Remit.