Sample Category Title
ECB Kazaks: There’s no need to pause at the turn of the year
ECB Governing Council member Martins Kazaks said, "it's clear that interest rates will need to rise much higher to bring inflation down to the target of 2% over medium term."
"There's no need to pause at the turn of the year. The rate increases must continue into the next year -- until inflation, especially core inflation, shows a visible slowdown," he said.
"In my view, recession in the euro area is a baseline scenario, but so far it's likely to be relatively shallow and brief," Kazaks said. "And hence insufficient to break the backbone of inflation persistence."
Swiss CPI slowed to 3.0% yoy in Oct, core CPI down to 1.8% yoy
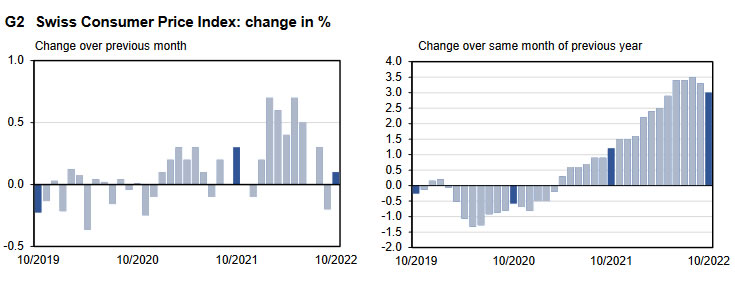
Swiss CPI rose 0.1% mom in October, below expectation of 0.2% mom. Core CPI (excluding fresh and seasonal products, energy and fuel) was flat at 0.0% mom. Domestic products prices dropped -0.1% mom. Imported products prices rose 0.4% mom. Goods prices rose 0.4% mom while services produces dropped -0.2% mom.
Annually, CPI slowed from 3.3% yoy to 3.0% yoy, below expectation of 3.2% yoy. Core CPI slowed form 2.0% yoy to 1.8% yoy. Domestic products prices slowed from 1.8% yoy to 1.7% yoy. Imported product prices slowed from 7.8% yoy to 6.9% yoy. Goods inflation slowed from 5.9% yoy to 5.7% yoy. Services inflation slowed form 1.2% yoy to 0.9% yoy.
GBP/JPY: Will the Bulls Have Enough Strength to Complete the Cycle Wave y Near 184.74?
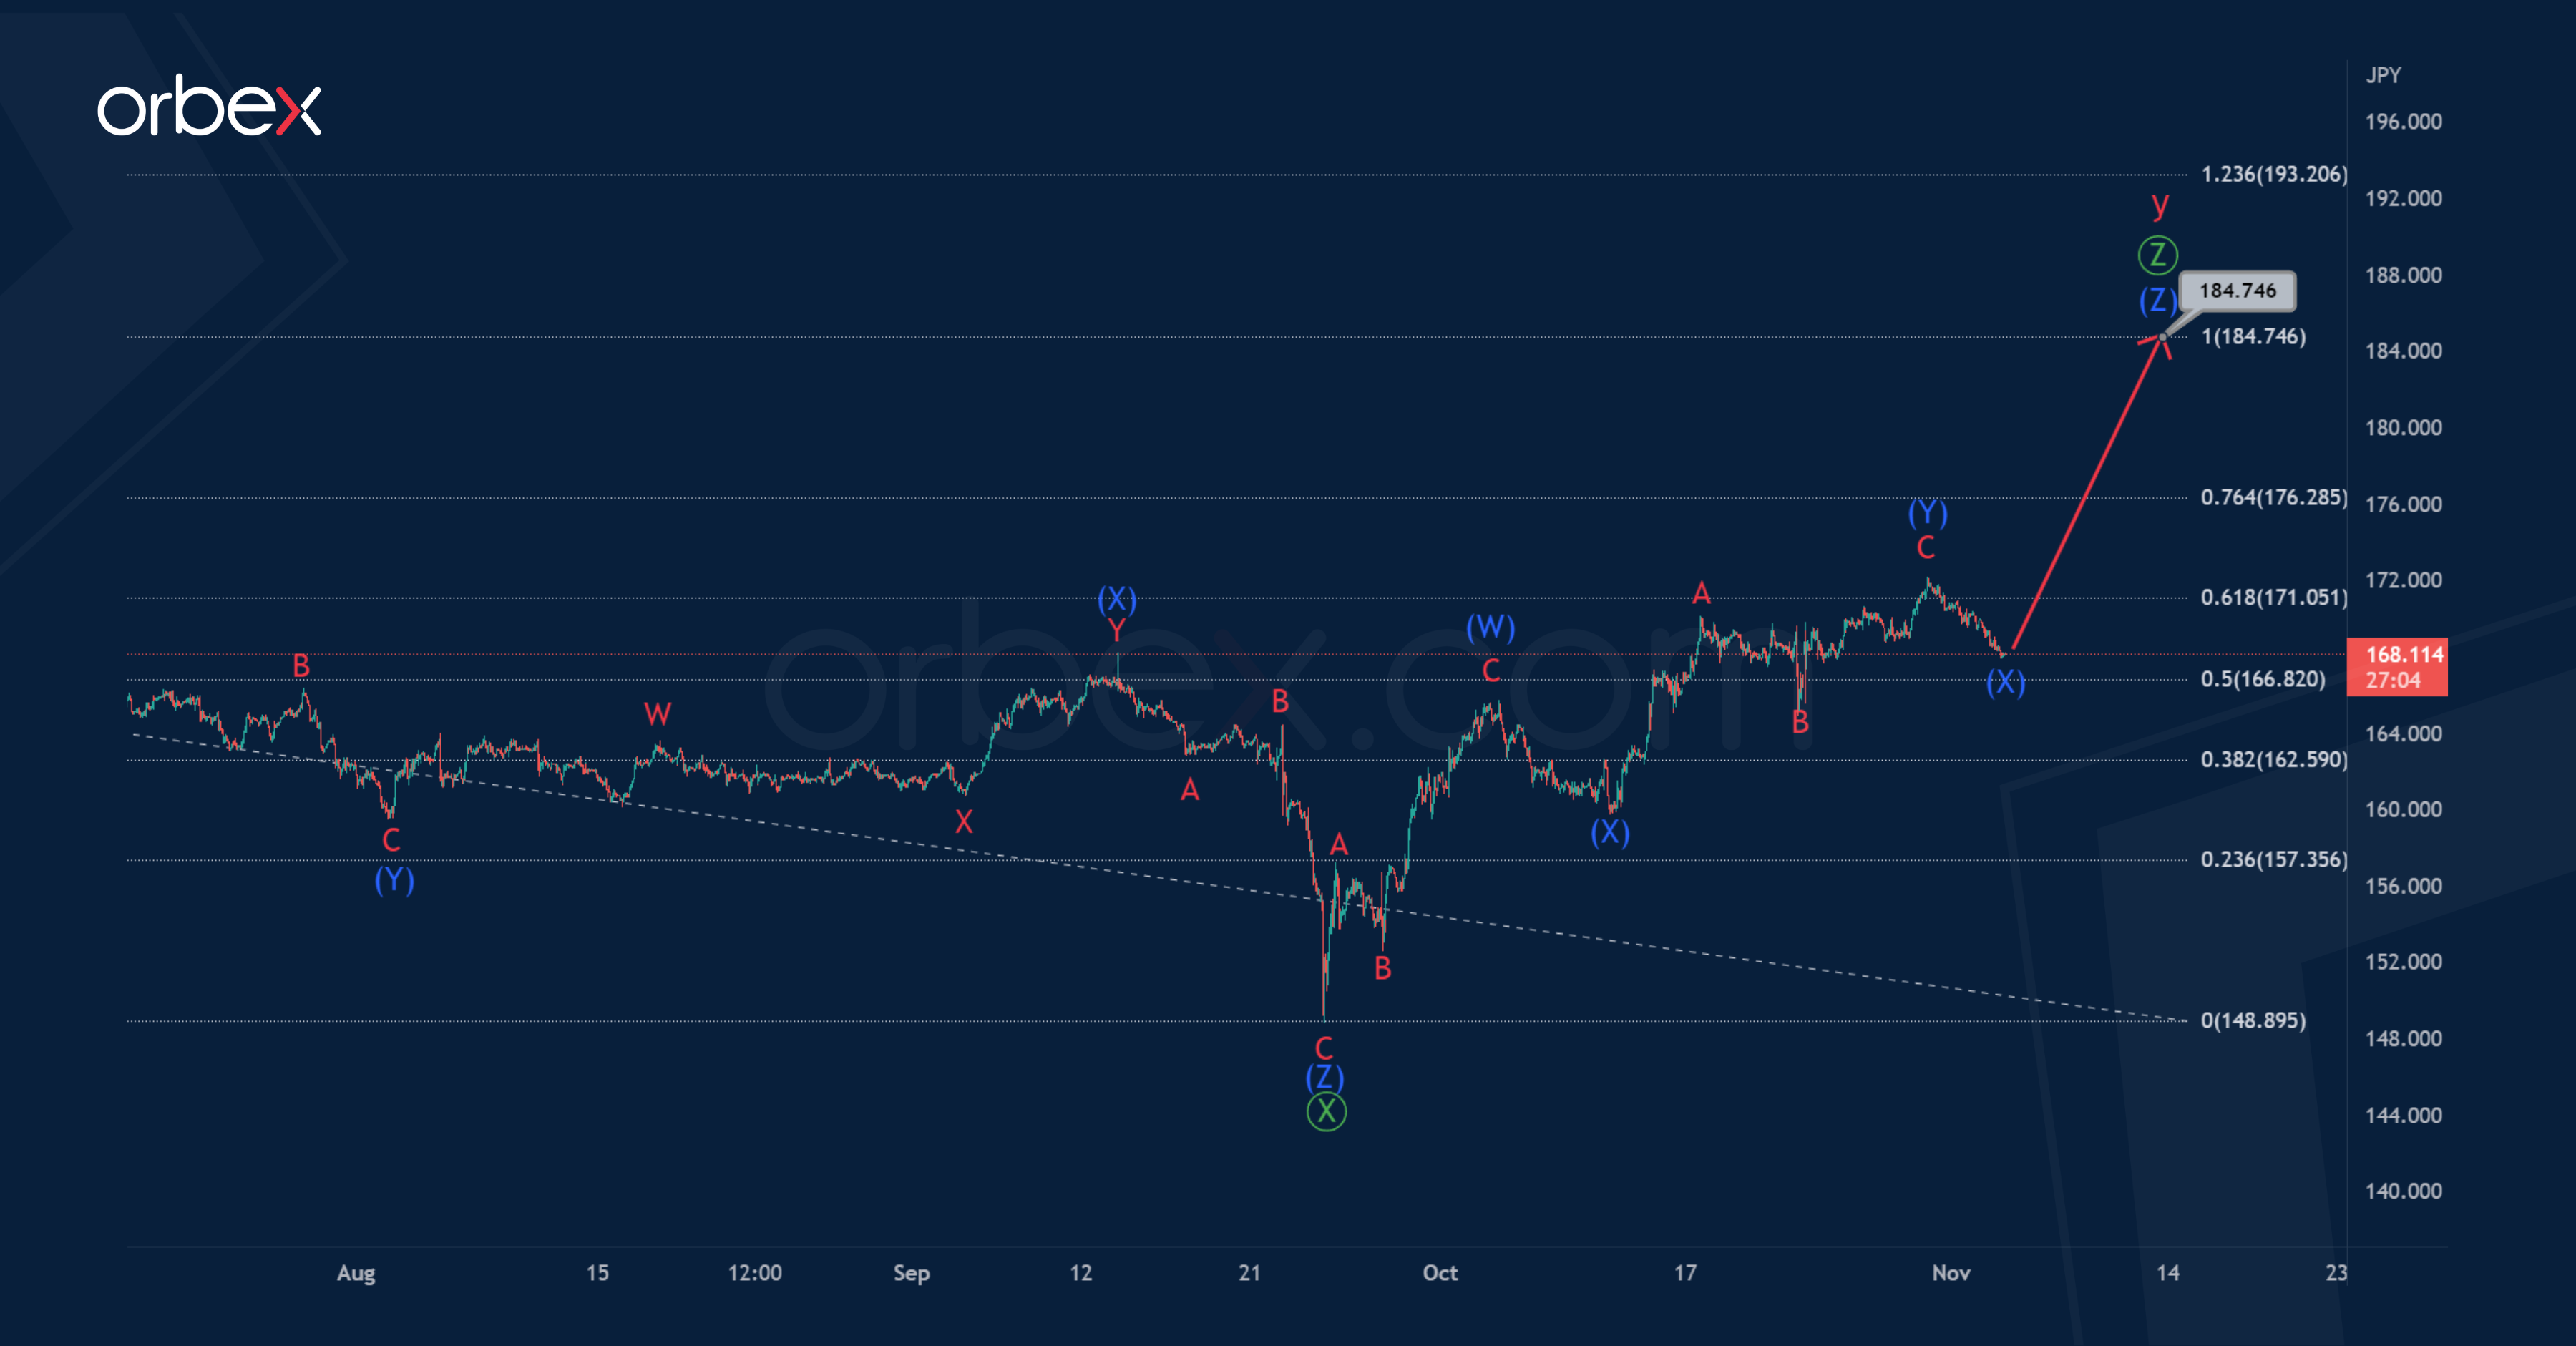
According to the current chart, it can be assumed that the GBPJPY pair forms a global corrective trend taking the form of a double zigzag. On the 1H timeframe, the final part of this trend is visible - the actionary wave y of the cycle degree.
It seems that the wave y takes the form of a triple zigzag of the primary degree, which may soon be fully completed. After the end of the second intervening wave, which took the form of a triple combination, the price began to move up.
Most likely, the wave takes the form of a triple zigzag, in which four parts look finished. In the next coming trading weeks, growth is expected within the final intermediate wave (Z).
The completion of the entire wave is possible near 184.74. At that level, wave will be equal to wave.
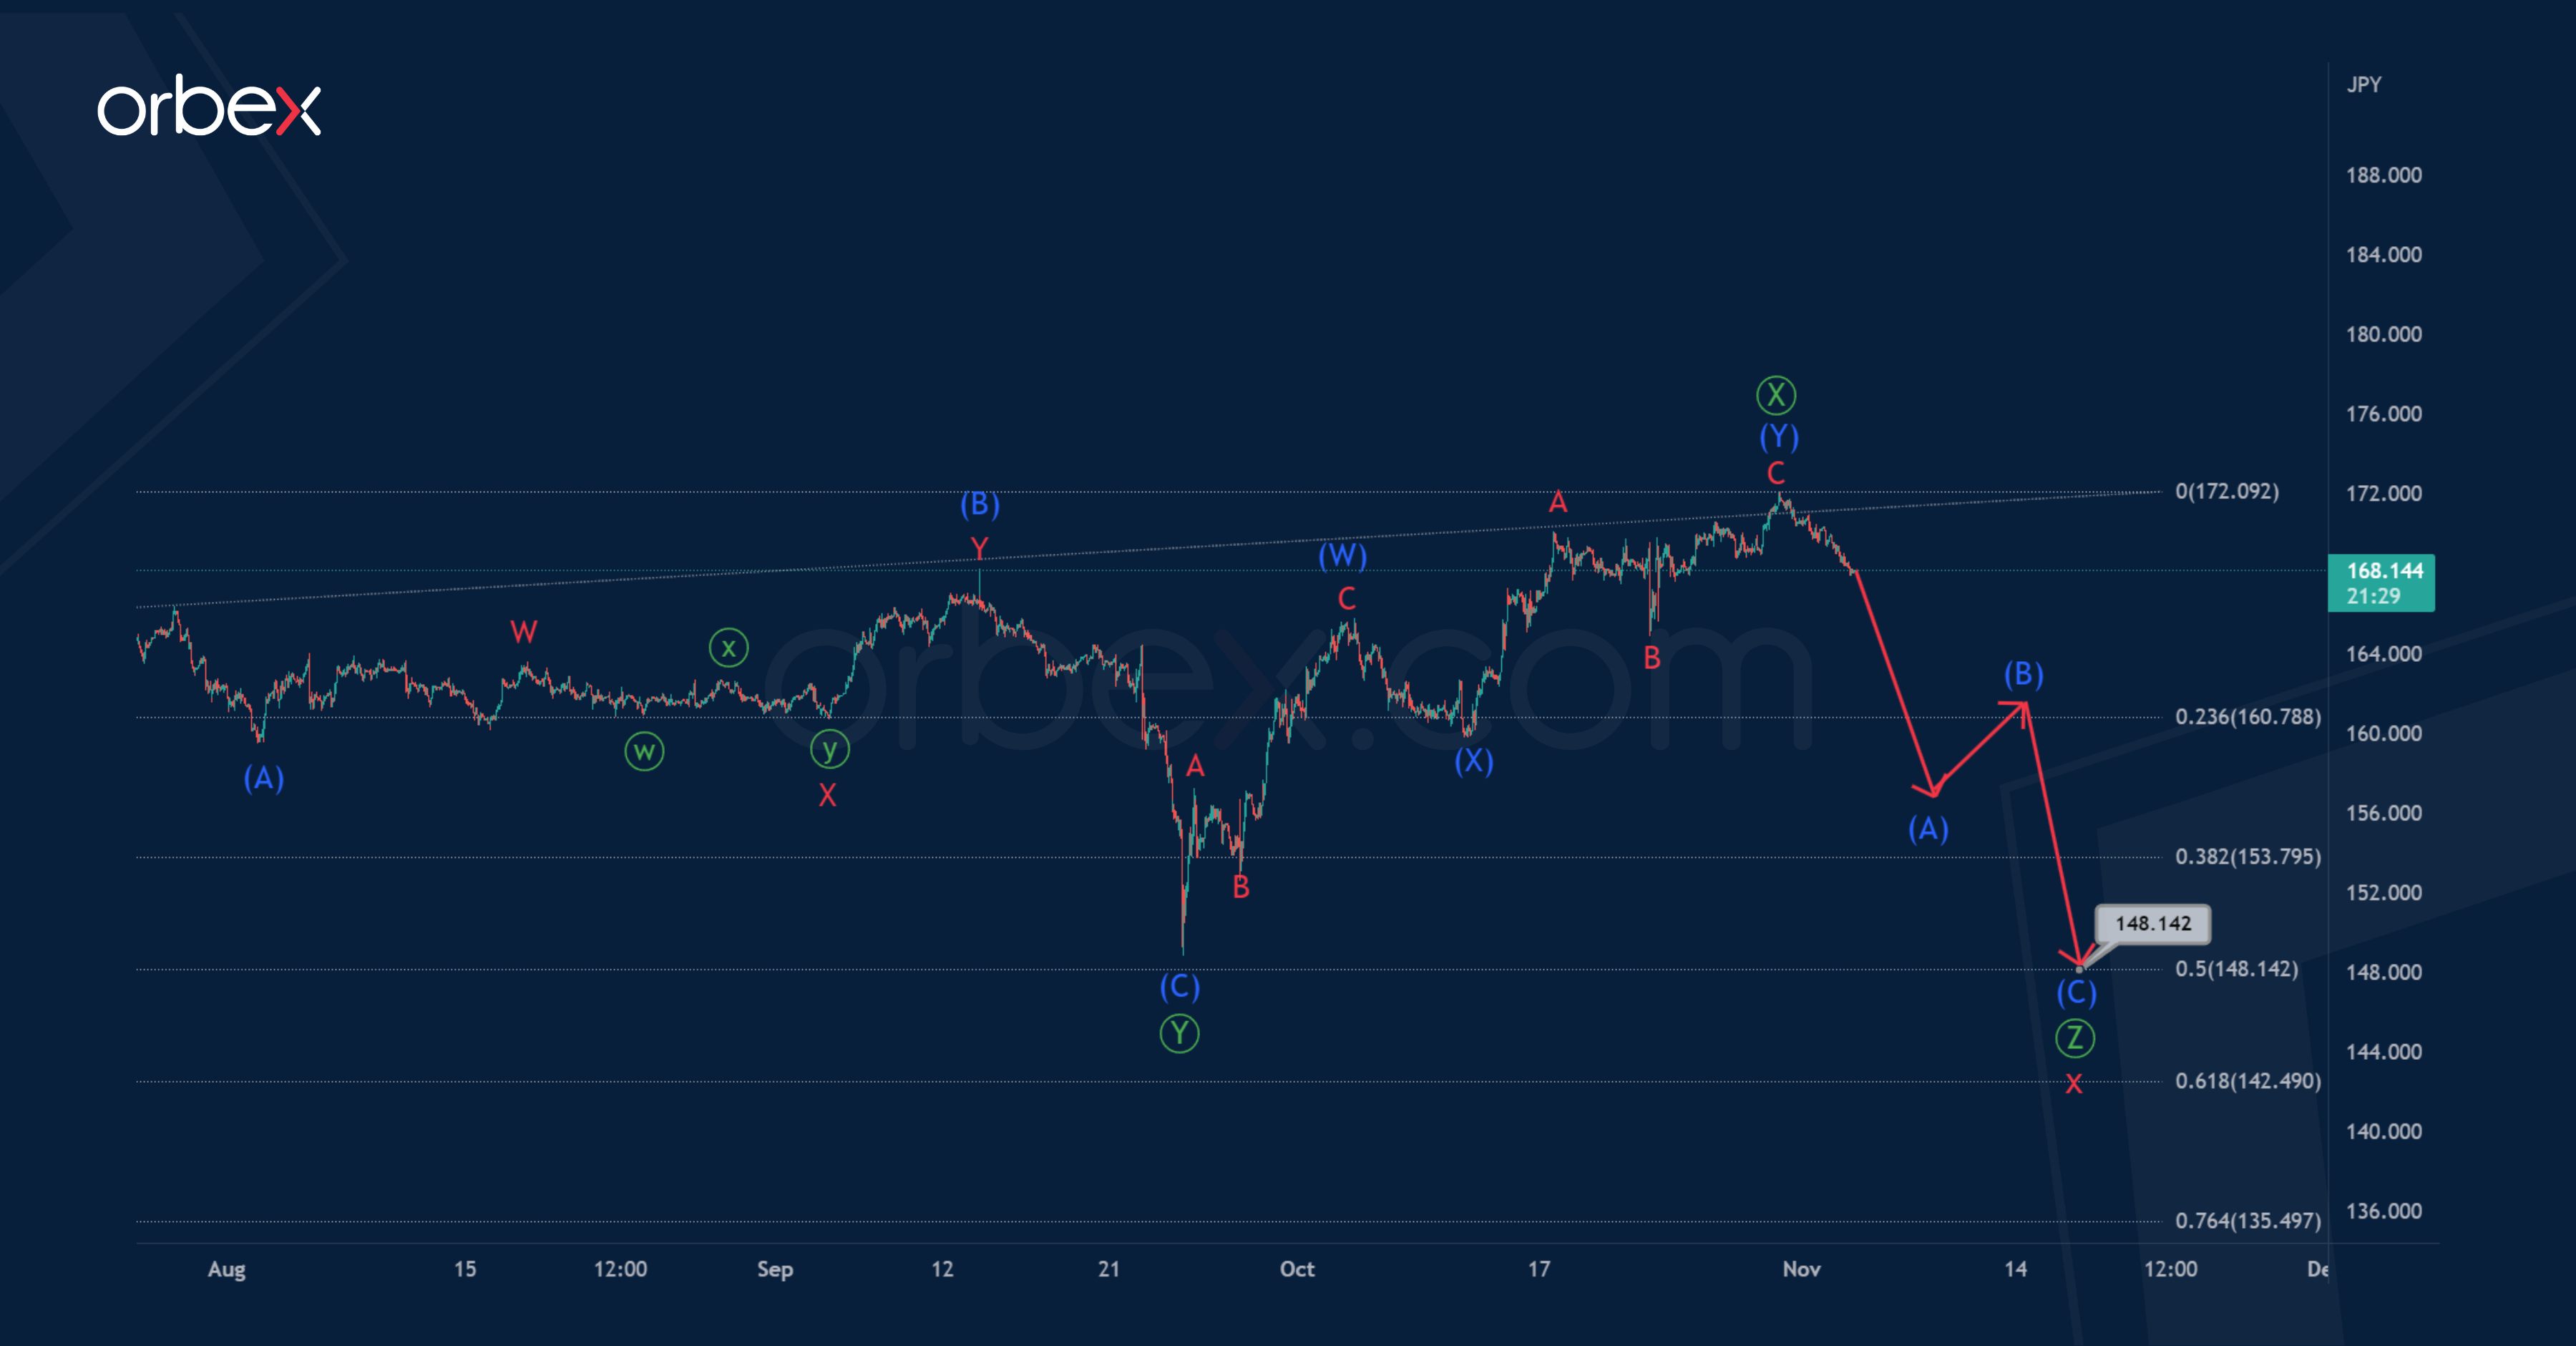
In the second variant, the market builds not a double, but a triple zigzag of the cycle degree w-x-y- x-z. And now its fourth part is being formed, that is, the intervening wave x. This wave, judging by its structure, may take the form of a triple zigzag.
It is assumed that the first four parts of the primary correction pattern are fully completed. That is, the sub-waves.
Perhaps in the near future, the market will fall in the last wave to 148.14. At that level, wave x will be at 50% along the Fibonacci lines of actionary wave y.
An approximate scheme of possible future movement is shown on the chart.
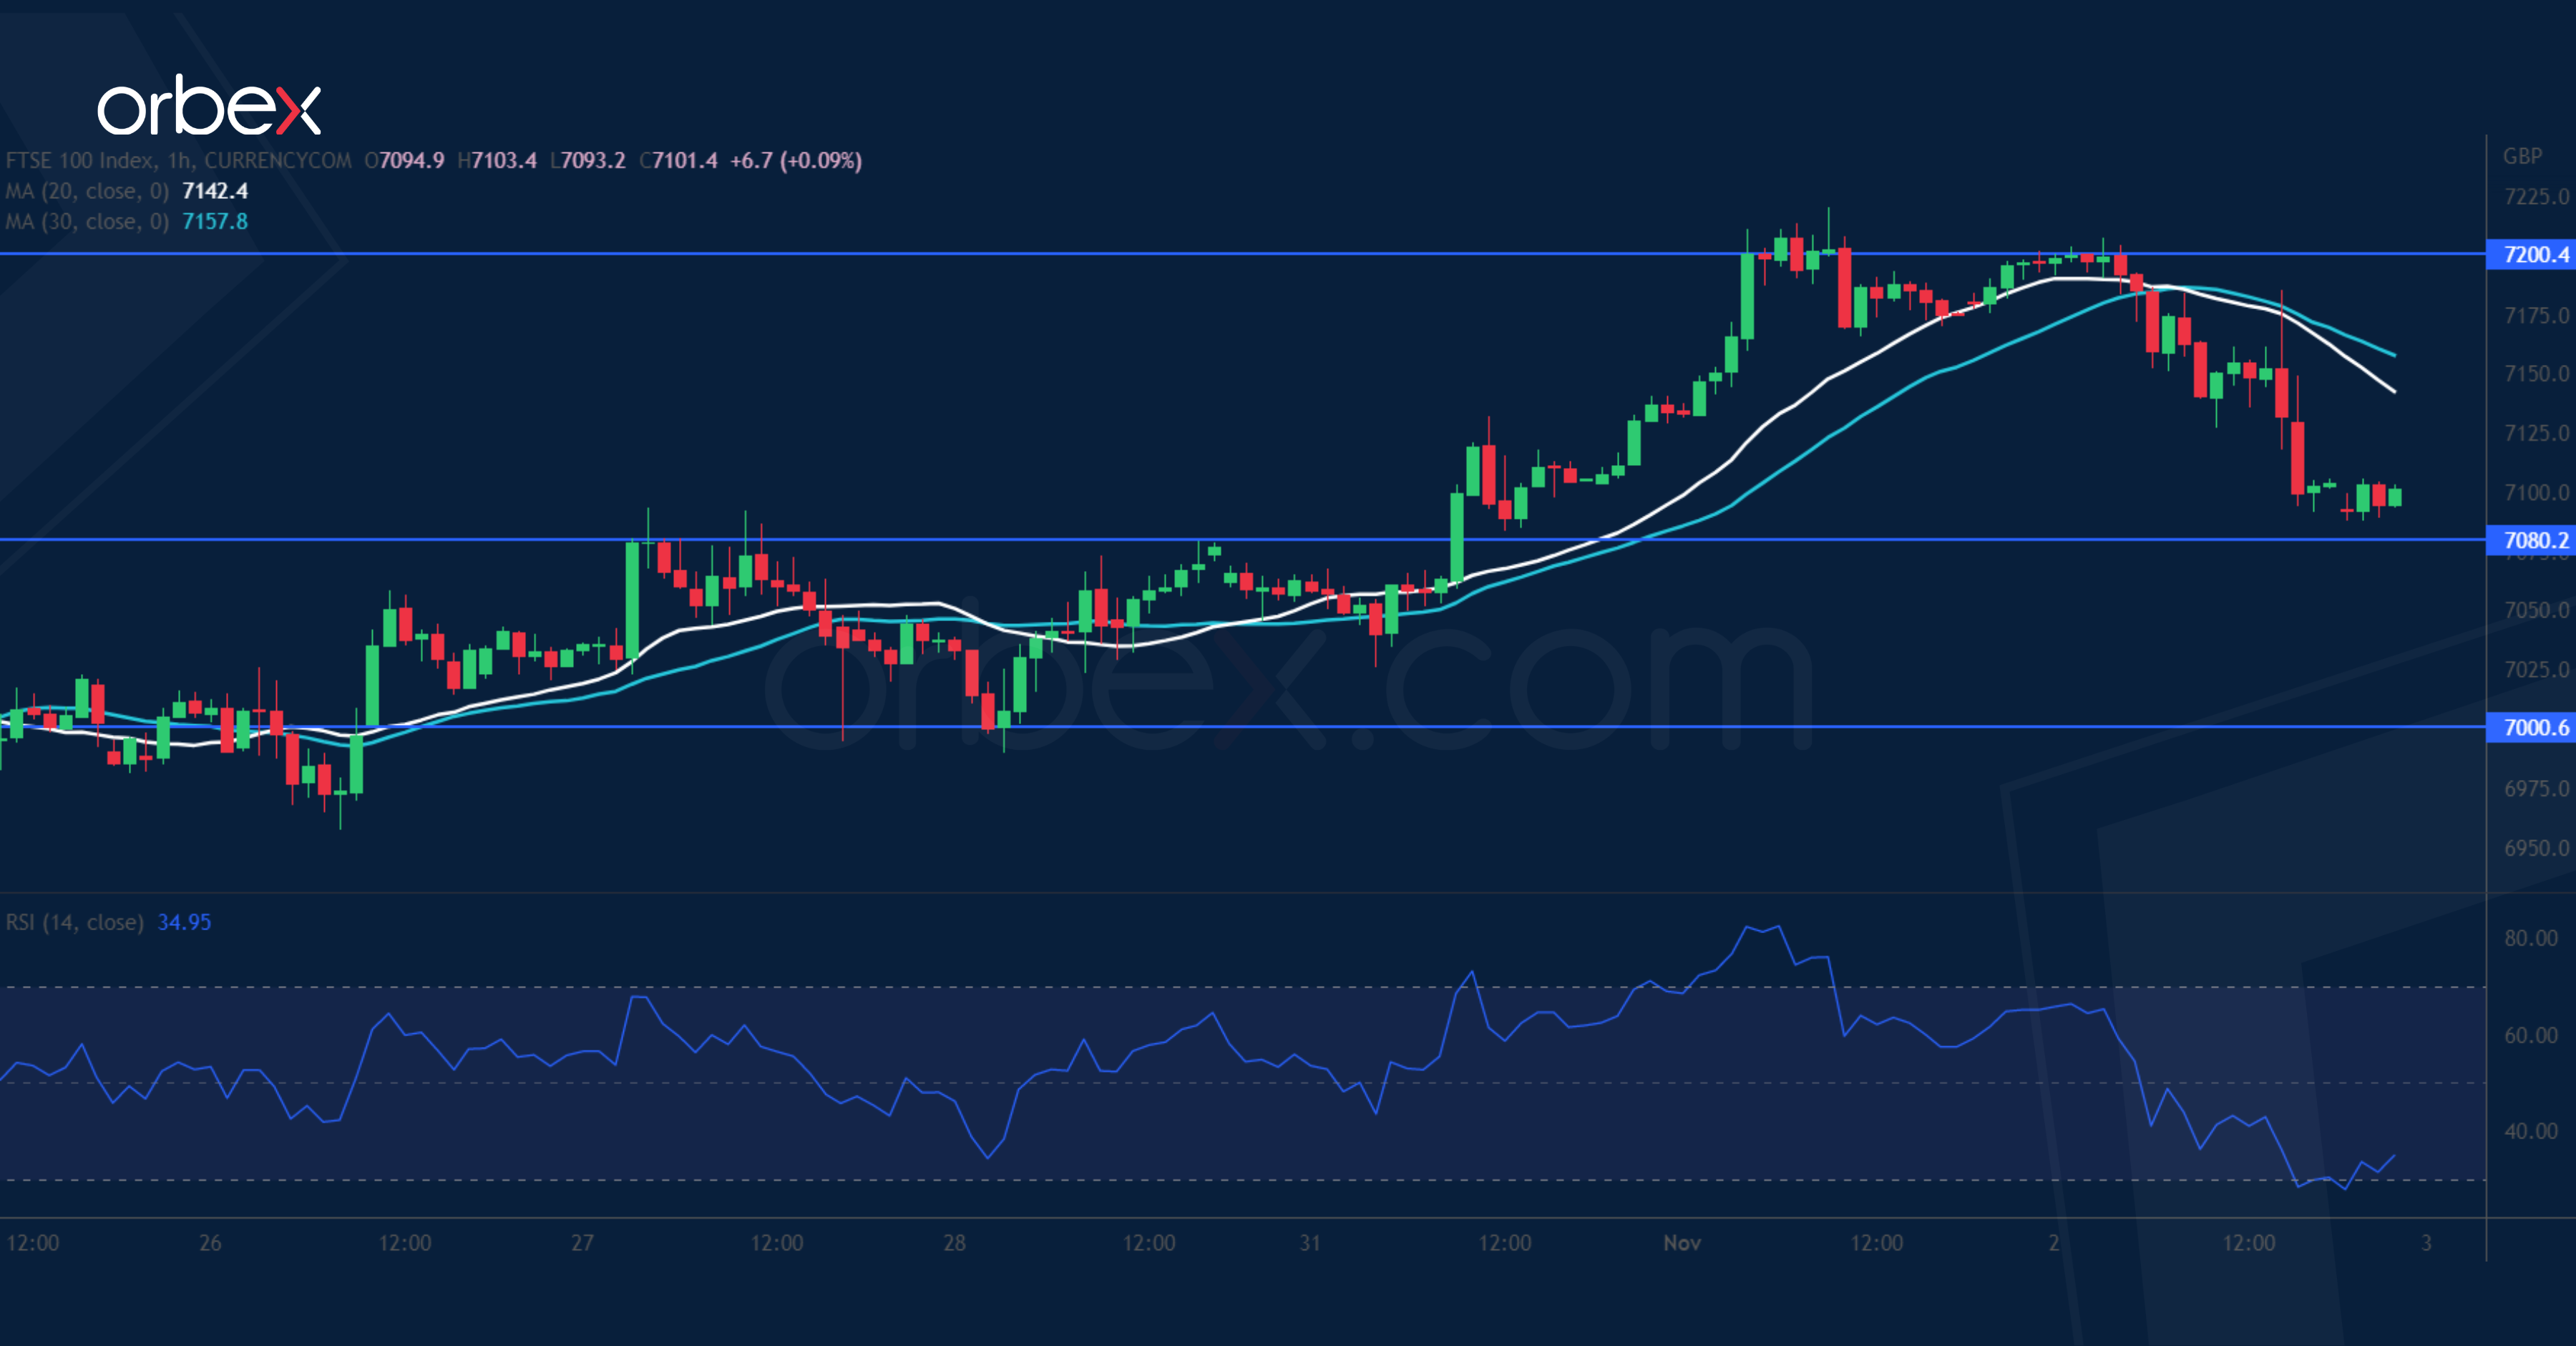
UK 100 Struggles for Support
Equities turned south after the Fed sees a pause in tightening as premature. The FTSE reversed its course at a former support (7200) on the daily chart. The recent rally could use some breathing room after it broke above the daily resistance at 7100. After the RSI swung back into oversold territory, 7080 is the first level to gauge the strength of follow-up interests. The psychological level of 7000 would be an important support to keep the bulls interested. 7200 is a fresh peak and a bullish breakout would carry the index to 7330.
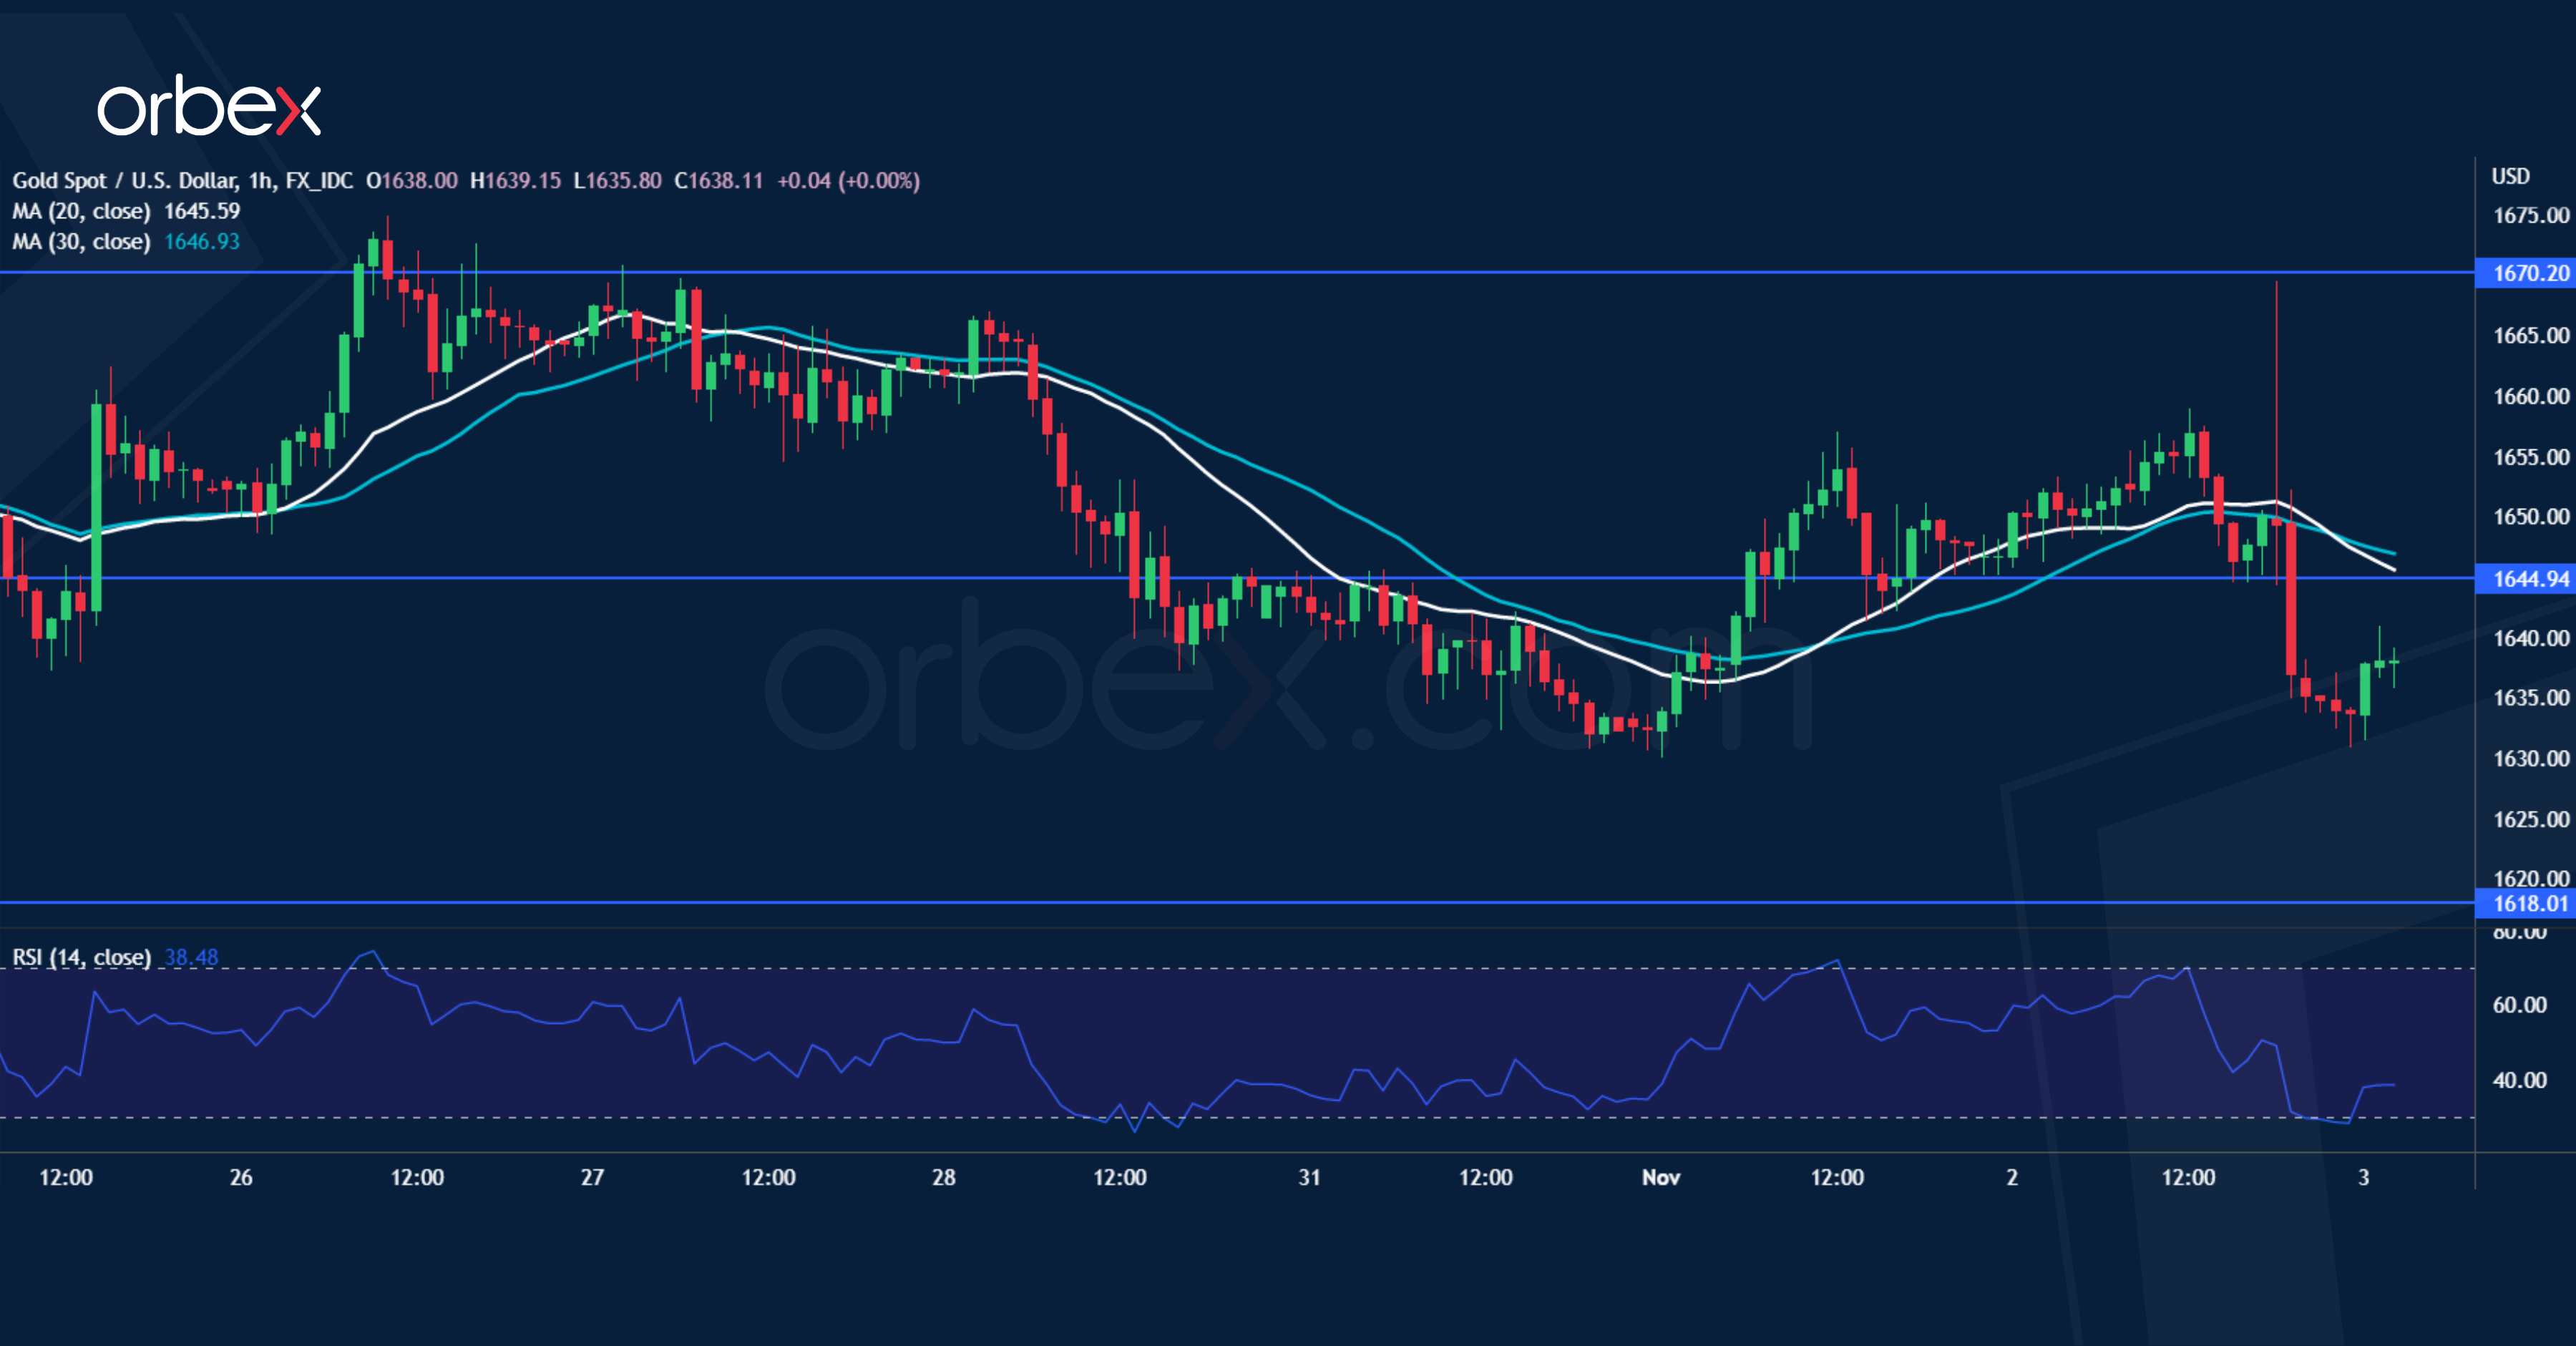
XAU/USD Hits Resistance
Gold softened after the US dollar regained strength post-FOMC. After the price gave up all the gains from its rally in early October, the latest rebound met stiff selling pressure near the support-turned-resistance 1670. A long bearish wick suggests a rejection of this level. As wrong-footed traders scramble for the exit, 1618 is key in keeping the precious metal afloat. Its break would signal a bearish continuation in the days to come. 1645 is a fresh obstacle where the bears could be looking to double down on the prevailing pessimism.
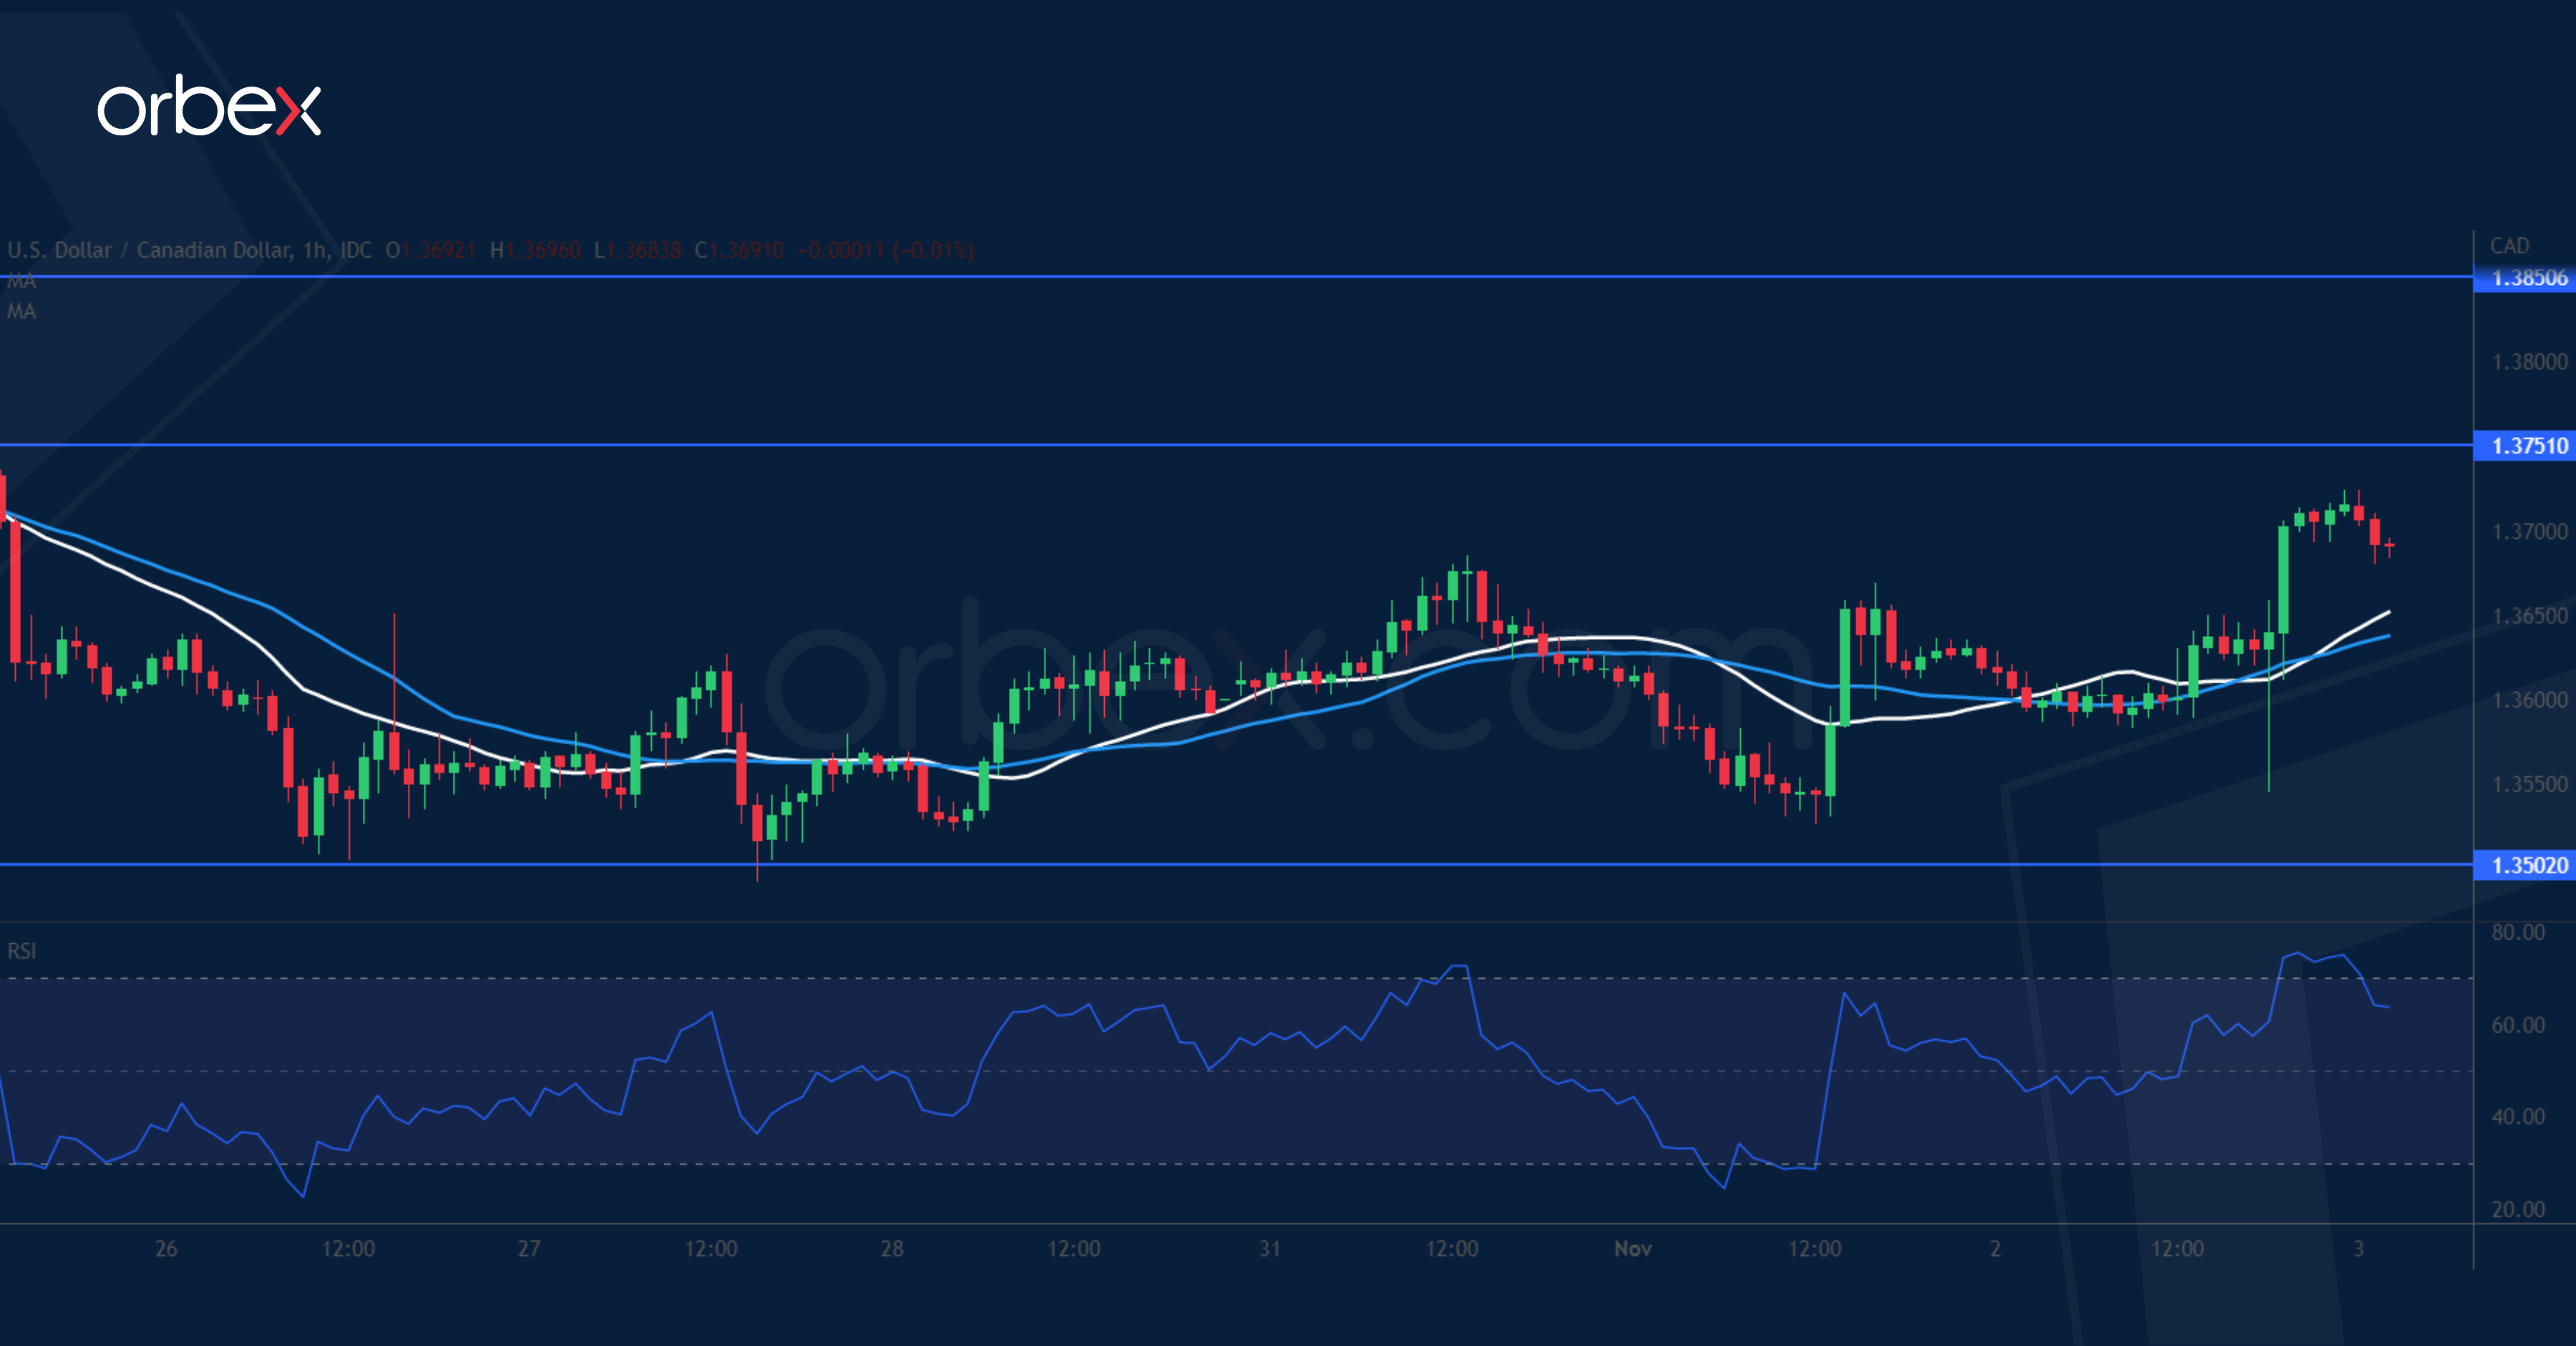
USD/CAD Finds Strong Support
The US dollar recovered after the Fed cautioned that rates could go higher than expectations. The rally has come to a halt in May 2020’s consolidation area. A combination of profit-taking and fresh selling has weighed on short-term sentiment. A tentative break below the daily support 1.3500 has put the bulls under pressure. A bearish breakout would force them to bail out and trigger a deeper correction below 1.3300. 1.3750 is the first resistance and the bulls will need to clear 1.3850 before the uptrend could resume.
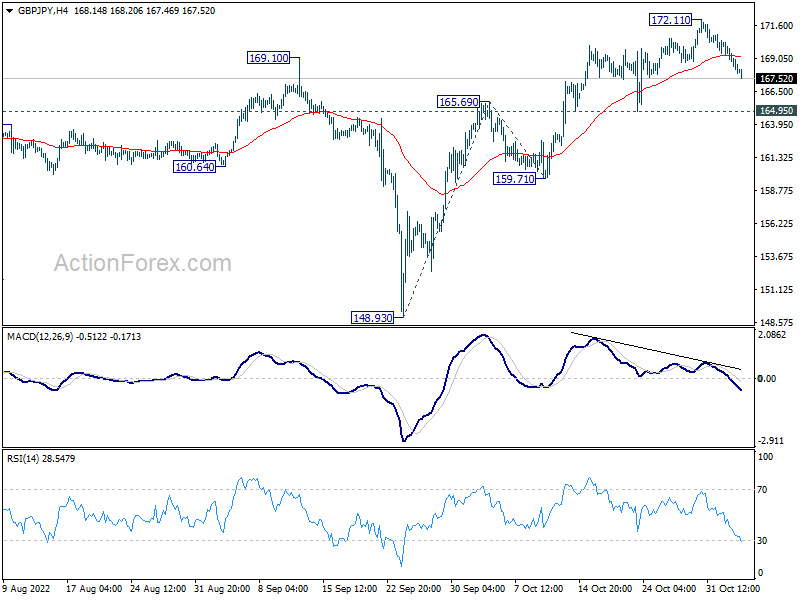
GBP/JPY Daily Outlook
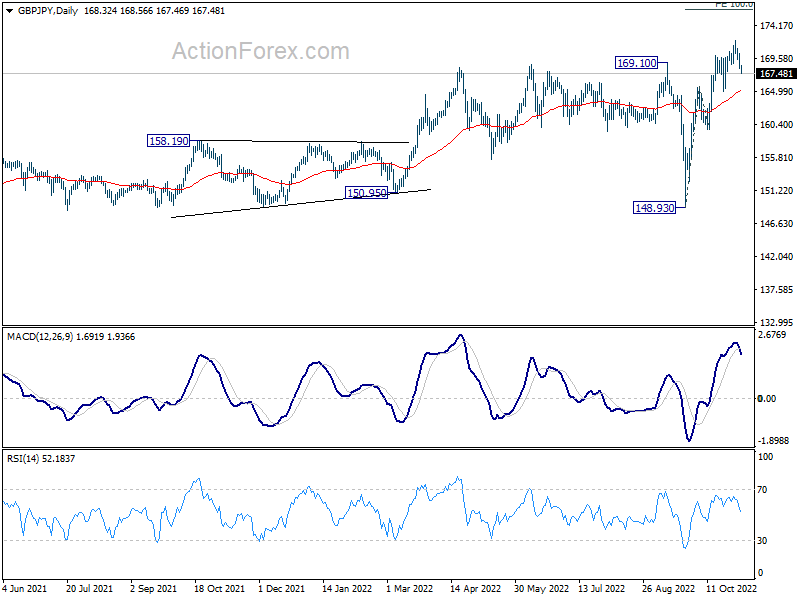
Daily Pivots: (S1) 167.75; (P) 169.05; (R1) 169.78; More...
No change in GBP/JPY's outlook and intraday bias remains neutral for consolidation below 172.11. Downside of retreat should be contained above 164.95 support to bring another rally. Break of 172.11 will resume larger up trend and target 100% projection of 148.93 to 165.69 from 159.71 at 176.47 next.
In the bigger picture, up trend from 123.94 (2020 low), as part of the trend from 122.75 (2016 low) is still in progress. Further rise would be seen to 161.8% projection of 122.75 to 156.59 (2018 high) from 123.94 at 178.69. This will now remain the favored case as long as 148.93 support holds.
EUR/JPY Daily Outlook
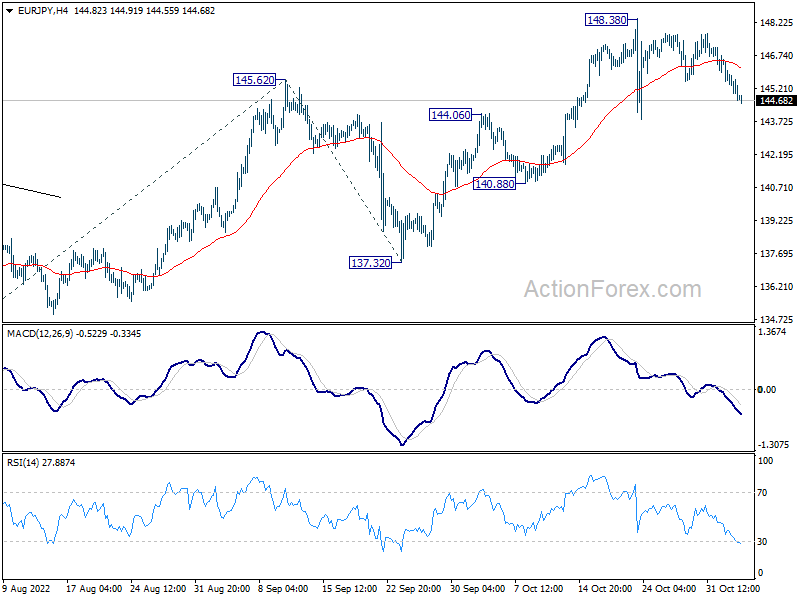
Daily Pivots: (S1) 144.63; (P) 145.60; (R1) 146.17; More....
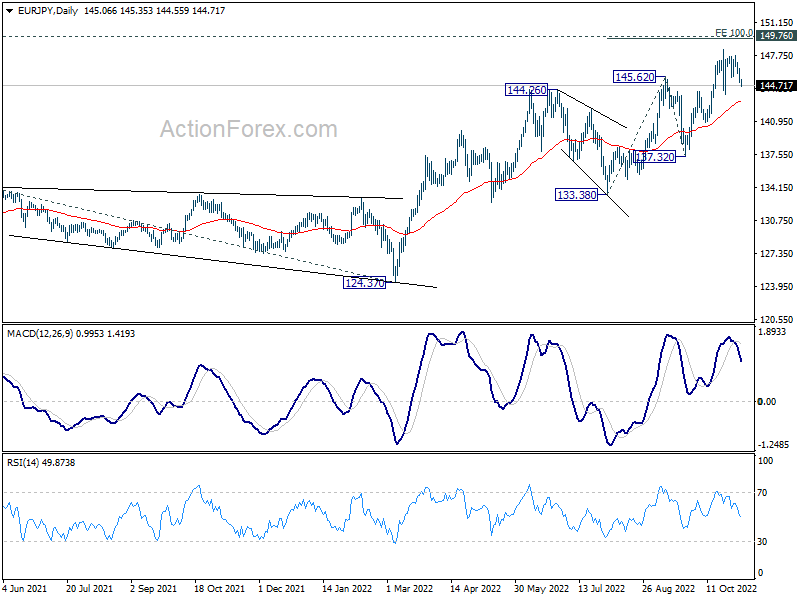
EUR/JPY is staying in consolidation from 148.38 and intraday bias remains neutral at this point. In case of deeper fall, downside should be contained 140.88/144.06 support zone to bring another rally. Break of 148.38 will resume larger up trend to 100% projection of 133.38 to 145.62 from 137.32 at 149.56, which is close to 149.76 long term resistance.
In the bigger picture, the up trend from 114.42 (2020 low) is still in progress for 149.76 (2014 high). Decisive break there will pave the way to 161.8% projection of 114.42 to 134.11 from 124.37 at 156.22. This will now remain the favored case as long as 137.32 support holds.
EUR/GBP Daily Outlook
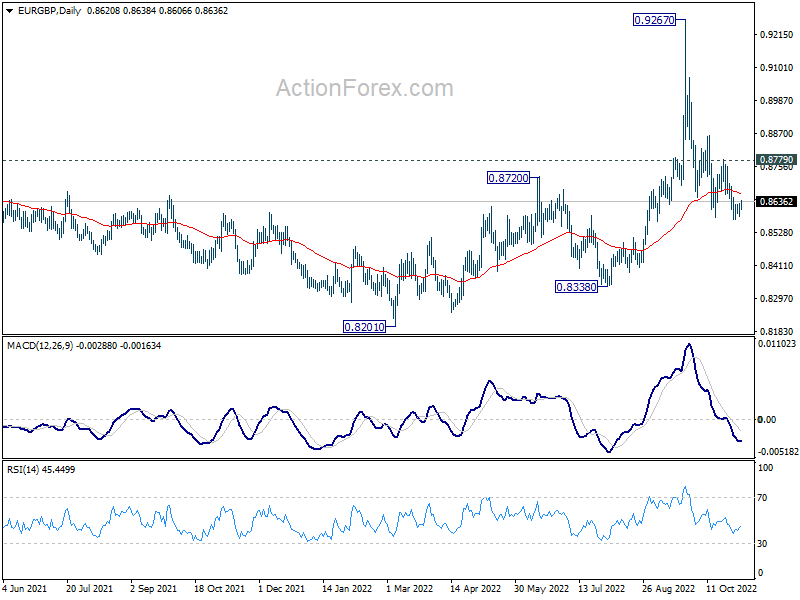
Daily Pivots: (S1) 0.8591; (P) 0.8611; (R1) 0.8636; More...
Intraday bias in EUR/GBP is turned neutral first but further decline is expected with 0.8779 resistance intact. Break of 0.8570 will resume the fall from 0.9267 and target 0.8201/8388 support zone. However, break of 0.8770 will turn bias back to the upside for 0.8869 resistance and above.
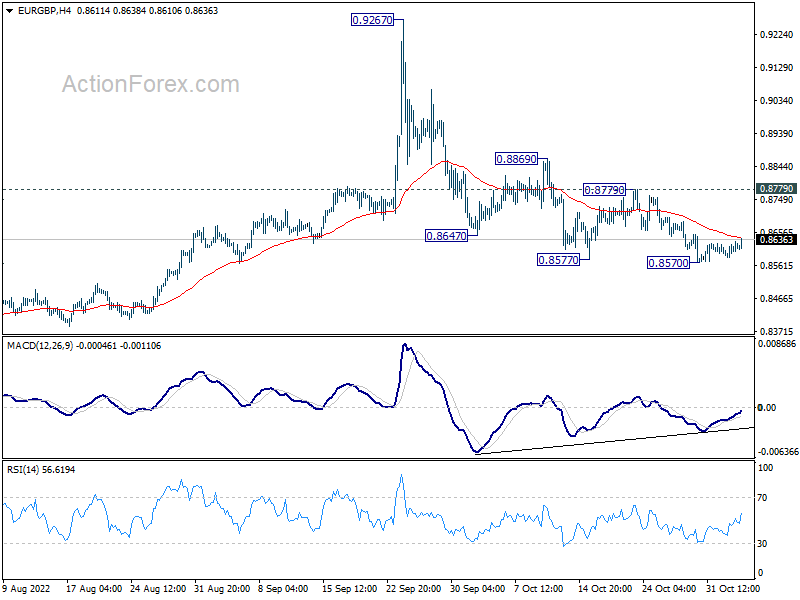
In the bigger picture, current development suggests that fall from 0.9267 is a down leg inside long term range pattern. Deeper fall could be seen towards 0.8201/8338 support zone. But strong support should be seen there to bring reversal.
EUR/AUD Daily Outlook
Daily Pivots: (S1) 1.5372; (P) 1.5427; (R1) 1.5509; More...
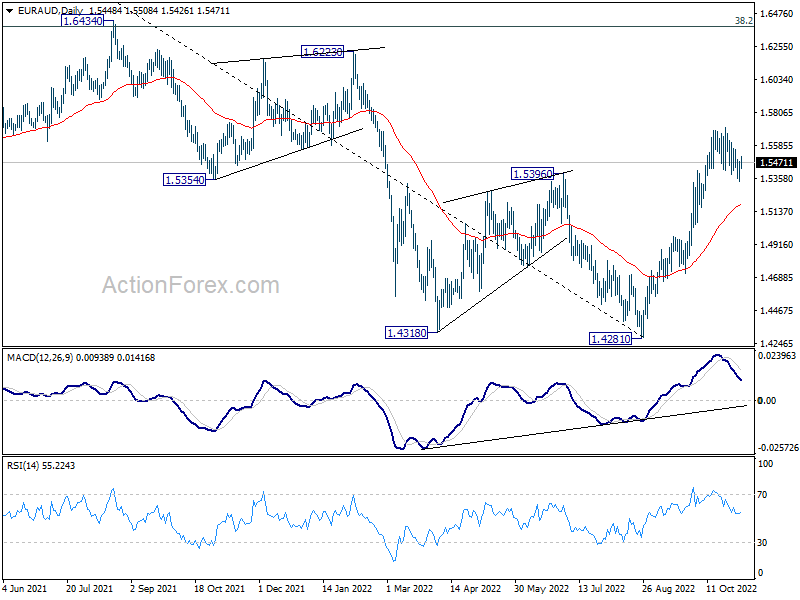
EUR/AUD is extending the consolidation from 1.5704 and intraday bias remains neutral for the moment. Deeper decline cannot be ruled out. But downside should be contained by 55 day EMA (now at 1.5191) to bring rebound. On the upside, break of 1.5704 will resume the rally from 1.4281.
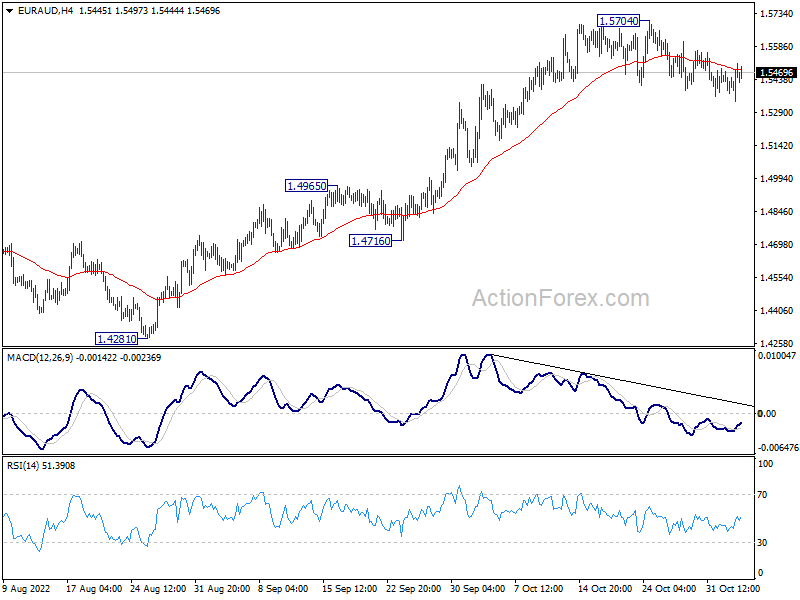
In the bigger picture, a medium term bottom should be in place at 1.4281, on bullish convergence condition in daily MACD. Further rise would be seen back to 1.6434 key resistance next. Break of 1.4965 resistance turned support is needed to indicate reversal. Otherwise, further rally will remain in favor.