Sample Category Title
AUD/USD Daily Report
Daily Pivots: (S1) 0.6221; (P) 0.6289; (R1) 0.6348; More...
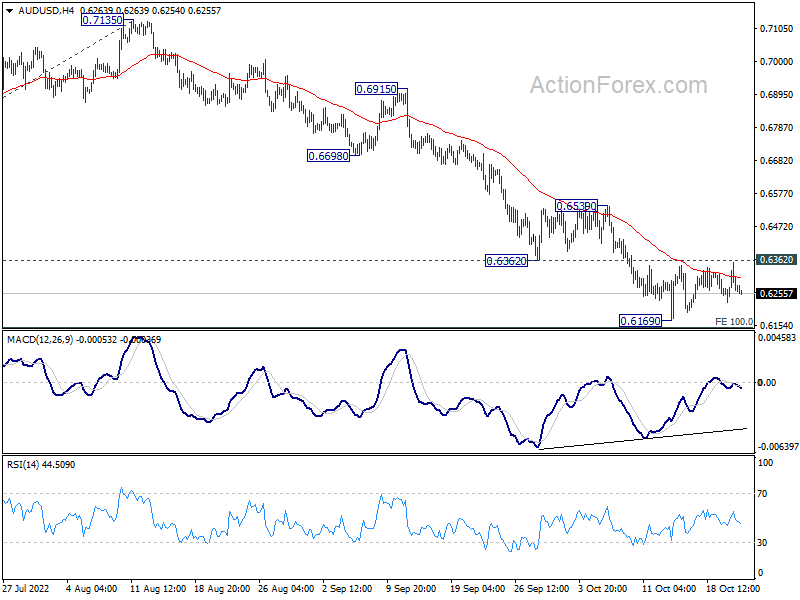
Range trading continues in AUD/USD and intraday bias stays neutral. Further decline is expected with 0.6362 support turned resistance intact. Firm break of 100% projection of 0.7660 to 0.6680 from 0.7135 at 0.6155 will target 138.2% projection at 0.5781. Nevertheless, break of 0.6362 will indicate short term bottoming, on bullish convergence condition in 4 hour MACD, and bring stronger rebound back to 0.6539 resistance.
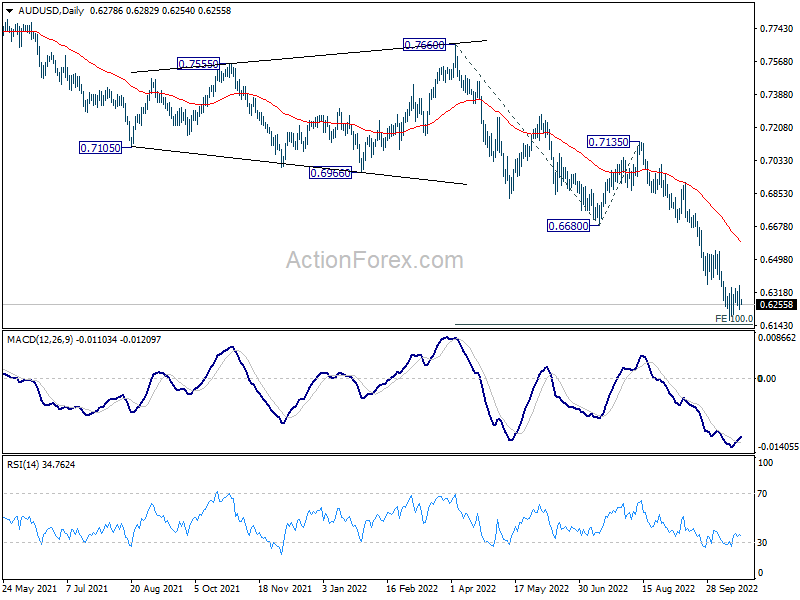
In the bigger picture, down trend form 0.8006 (2021 high) is expected to continue as long as 0.6680 support turned resistance holds. Next target is 0.5506 low. Medium term momentum will now be closely monitored to gauge the chance of break of 0.5506.
EUR/USD Daily Outlook
Daily Pivots: (S1) 0.9748; (P) 0.9797; (R1) 0.9838; More...
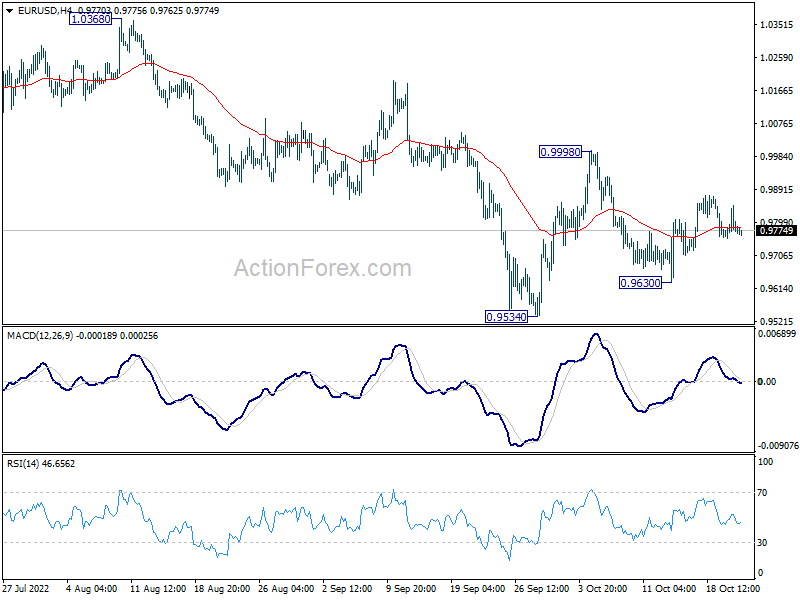
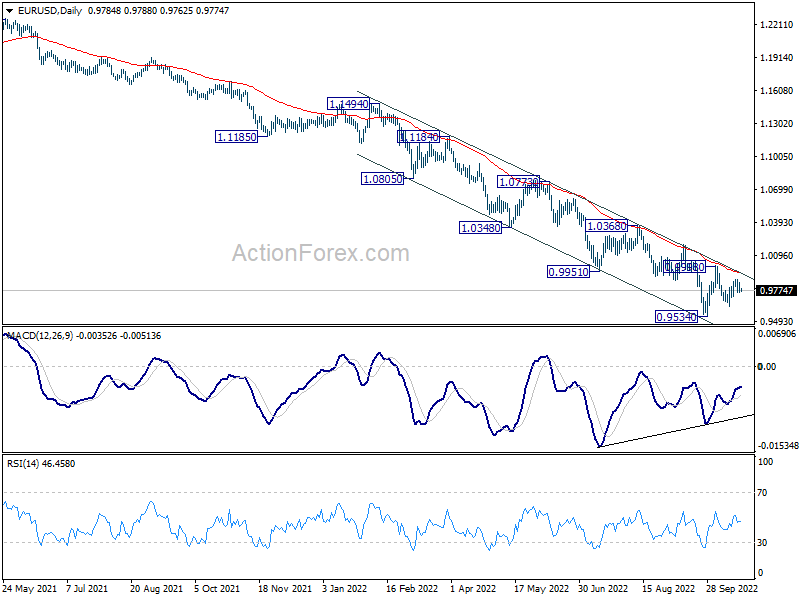
Intraday bias in EUR/USD remains neutral as range trading continues. Deeper decline is expected with 0.9998 resistance intact. Below 0.9630 will bring retest of 0.9534 low first. Firm break there will resume larger down trend. However, break of 0.9998 will confirm short term bottoming and turn bias back the upside for stronger rebound.
In the bigger picture, down trend from 1.6039 (2008 high) is still in progress. Next target is 100% projection of 1.3993 to 1.0339 from 1.2348 at 0.8694. In any case, break of 0.9998 resistance is needed to be the first sign of medium term bottoming. Otherwise, outlook will stay bearish even with strong rebound.
GBP/USD Daily Outlook
Daily Pivots: (S1) 1.1162; (P) 1.1249; (R1) 1.1327; More...
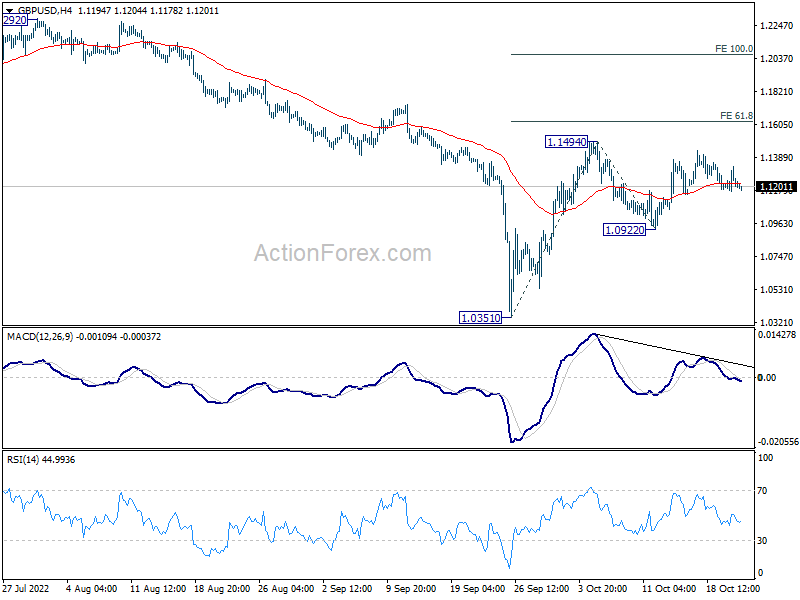
Intraday bias in GBP/USD remains neutral for the moment. On the upside, break of 1.1494 will resume the rise from 1.0351 to 61.8% projection of 1.0351 to 1.1494 from 1.0922 at 1.1628. On the downside, below 1.0922 will turn bias back to the downside for 1.0351 low instead.
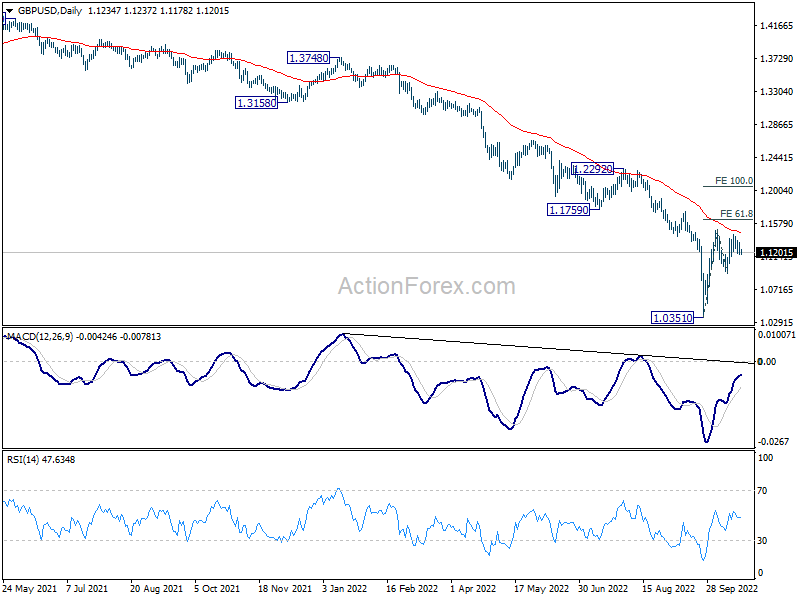
In the bigger picture, fall from 1.4248 (2018 high) is resuming long term down trend from 2.1161 (2007 high). Next target is 100% projection of 2.1161 to 1.3503 from 1.7190 at 0.9532. There is no scope of a medium term rebound as long as 1.1759 support turned resistance holds.
USD/CHF Daily Outlook
Daily Pivots: (S1) 0.9995; (P) 1.0032; (R1) 1.0069; More...
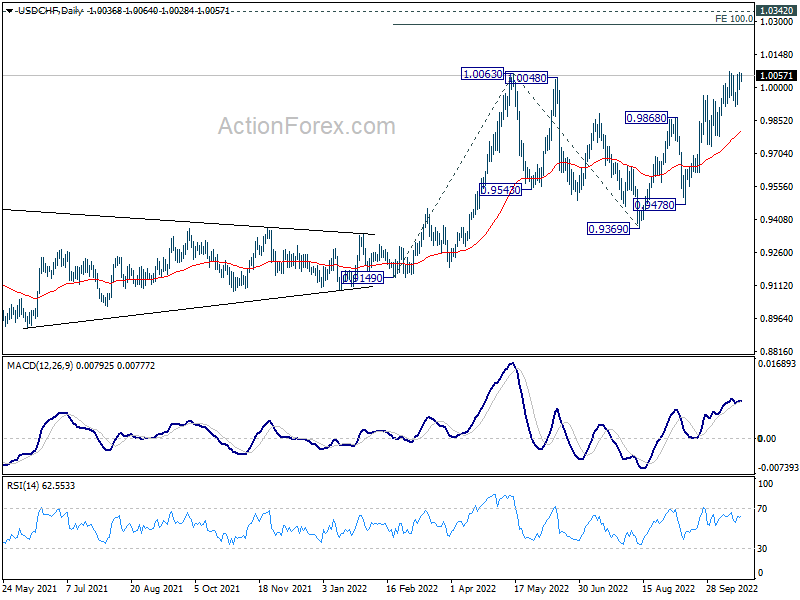
USD/CHF is still bounded in range below 1.0072 and intraday bias stays neutral. On the upside, break of 1.0072, and sustained trading above 1.0063, will confirm larger up trend resumption. Next target is 1.0283 projection level. However, break of 0.9914 support will indicate rejection by 1.0063, and turn bias back to the downside for 0.9779 support first.
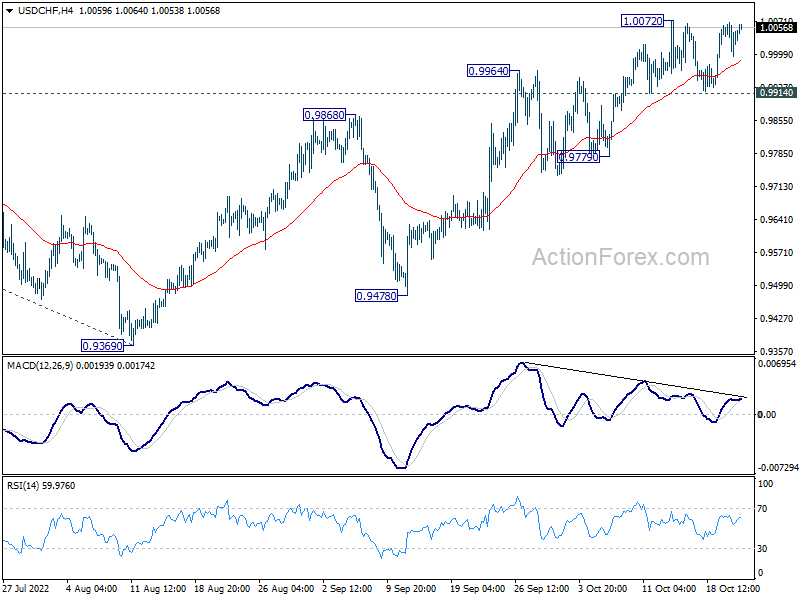
In the bigger picture, current development suggests that up trend from 0.8756 (2021 low) is still in progress. Sustained break of 1.0063 will target 100% projection of 0.9149 to 1.0063 from 0.9369 at 1.0283, and then 1.0342 (2016 high). For now, this will remain the favored case as long as 0.9369 support holds, even in case of deep pull back.
Elliott Wave View: Gold Could Shine A Bit In The Next Days
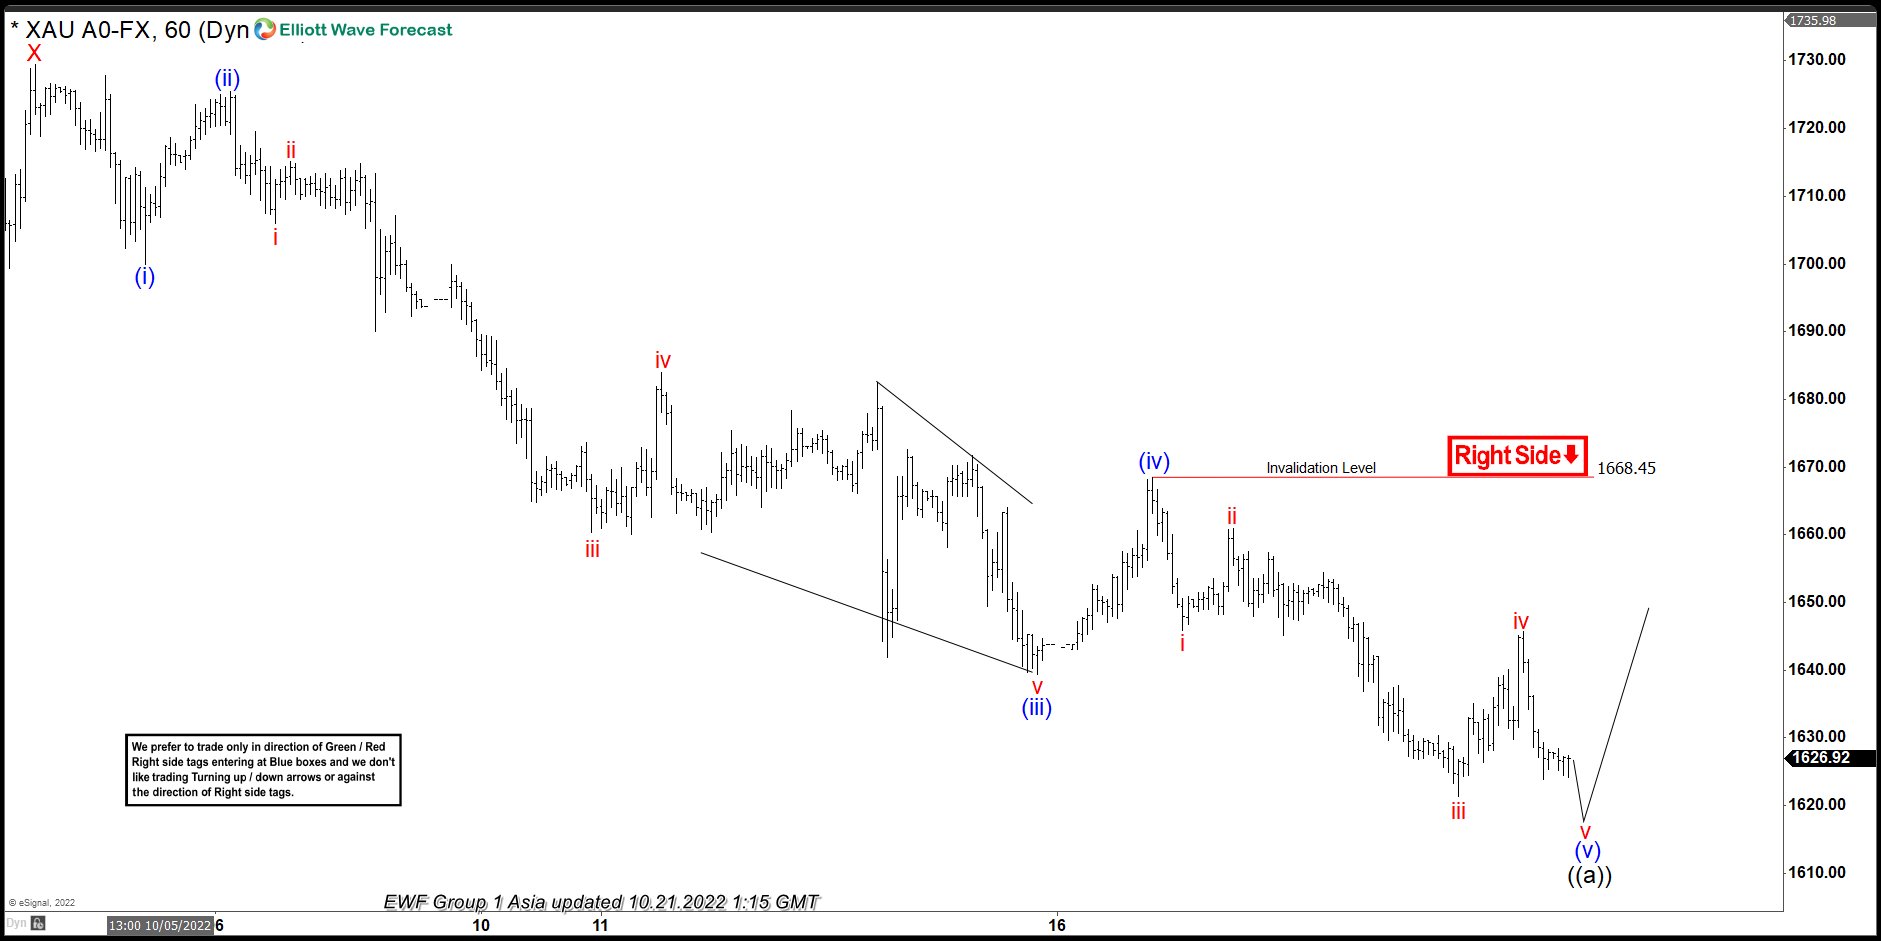
Short term Elliott Wave view on Gold (XAUUSD) continued with bearish momentum from 10.04.2022 high calling for further downside. Decline from 10.04.2022 high is unfolding in 3 waves to complete a double correction. Down from 10.04.2022 high, wave (i) ended at 1700.00 and rally in wave (ii) ended at 1725.78. Then XAUUSD resumes the drop as wave (iii). Internal subdivision has 5 waves in lesser degree. The 60 minutes chart below shows the internal subdivision of wave (iii).
Down from wave (ii), wave i ended at 1705.81 and correction in wave ii ended at 1715.00. Down from wave ii, wave iii finished at 1660.32 and wave iv bounce completed at 1683.78. Wave (iii) decline ended at 1639.24 and wave (iv) ended at 1668.45. Final leg lower wave (v) of ((a)) is in progress and it should end soon. We are expecting more low to complete wave (v) and wave ((a)). When the impulse has completed, we look for a with the bounce in 3, 7 or 11 swings higher as wave ((b)) that should fail to resume with the downtrend again. A break of 1668.45 should confirm that gold is already in wave ((b)).
GOLD 60 Minutes Elliott Wave Chart
Technical Outlook and Review
USD/JPY:
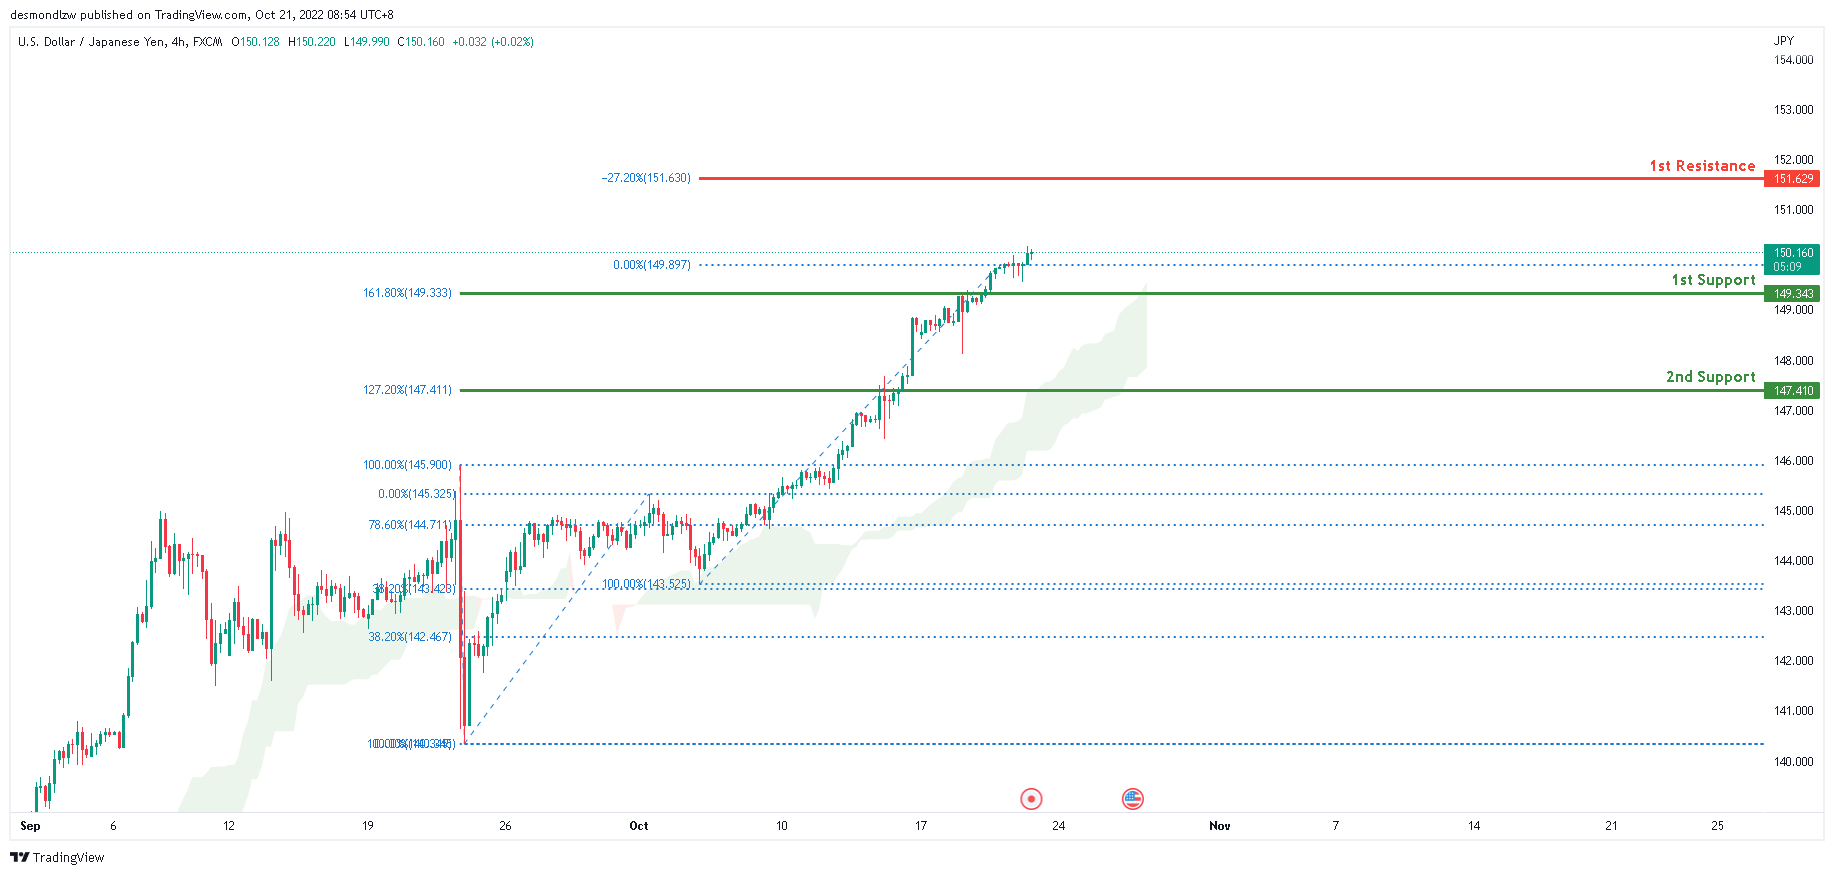
The current general bias for USDJPY on the H4 chart is bullish. To add to this bias, the price is currently trading above the Ichimoku cloud, indicating a bullish market. Price has maintained its strong bullish momentum and crossed the key level at 150.00 with price currently above the 1st support at 149.313 where the 161.8% Fibonacci extension is located. If this strong bullish momentum continues, expect price to continue towards the 1st resistance at 151.629 where the -27.2% Fibonacci expansion is located.
Areas of consideration:
- H4 time frame, 1st resistance at 151.629
- H4 time frame, 1st support at 149.313
DXY:
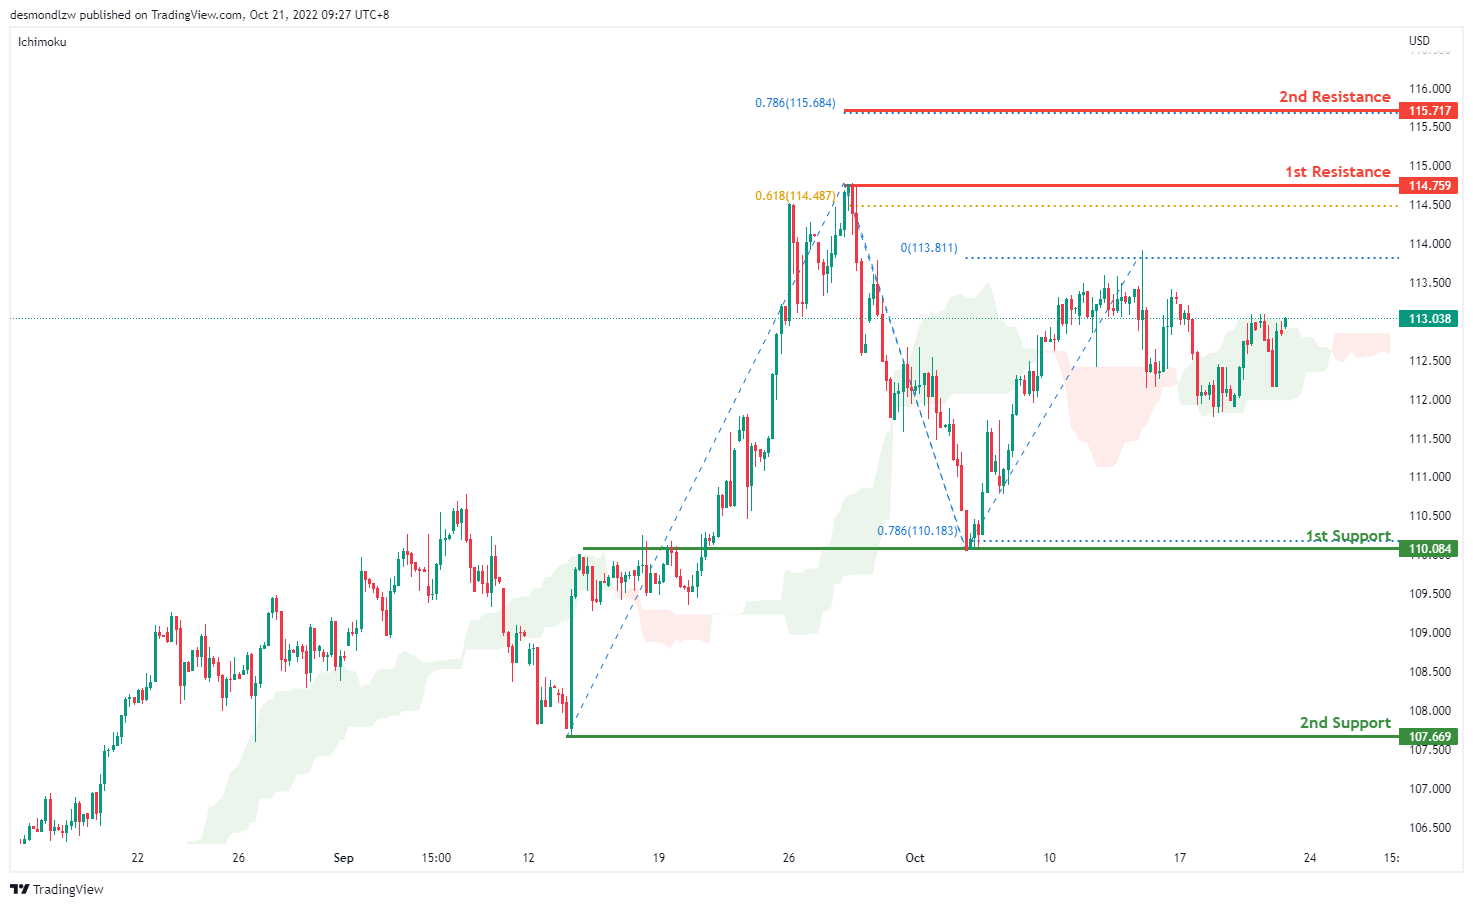
On the H4 chart, prices failed to break the ichimoku cloud and are moving in an ascending trend signalling bullish momentum. if bullish momentum continues it will bring price to 114.759 and if it breaks this level, bullish momentum will carry price to 115.717 where the 78.6% projection. Alternatively prices can move towards the first support at 110.084 where the swing low sits. if it breaks this level, bearish momentum will bring price to second support at 107.669.
Areas of consideration:
- H4 time frame, 1st resistance at 114.759
- H4 time frame, 1st support at 110.084
EUR/USD:
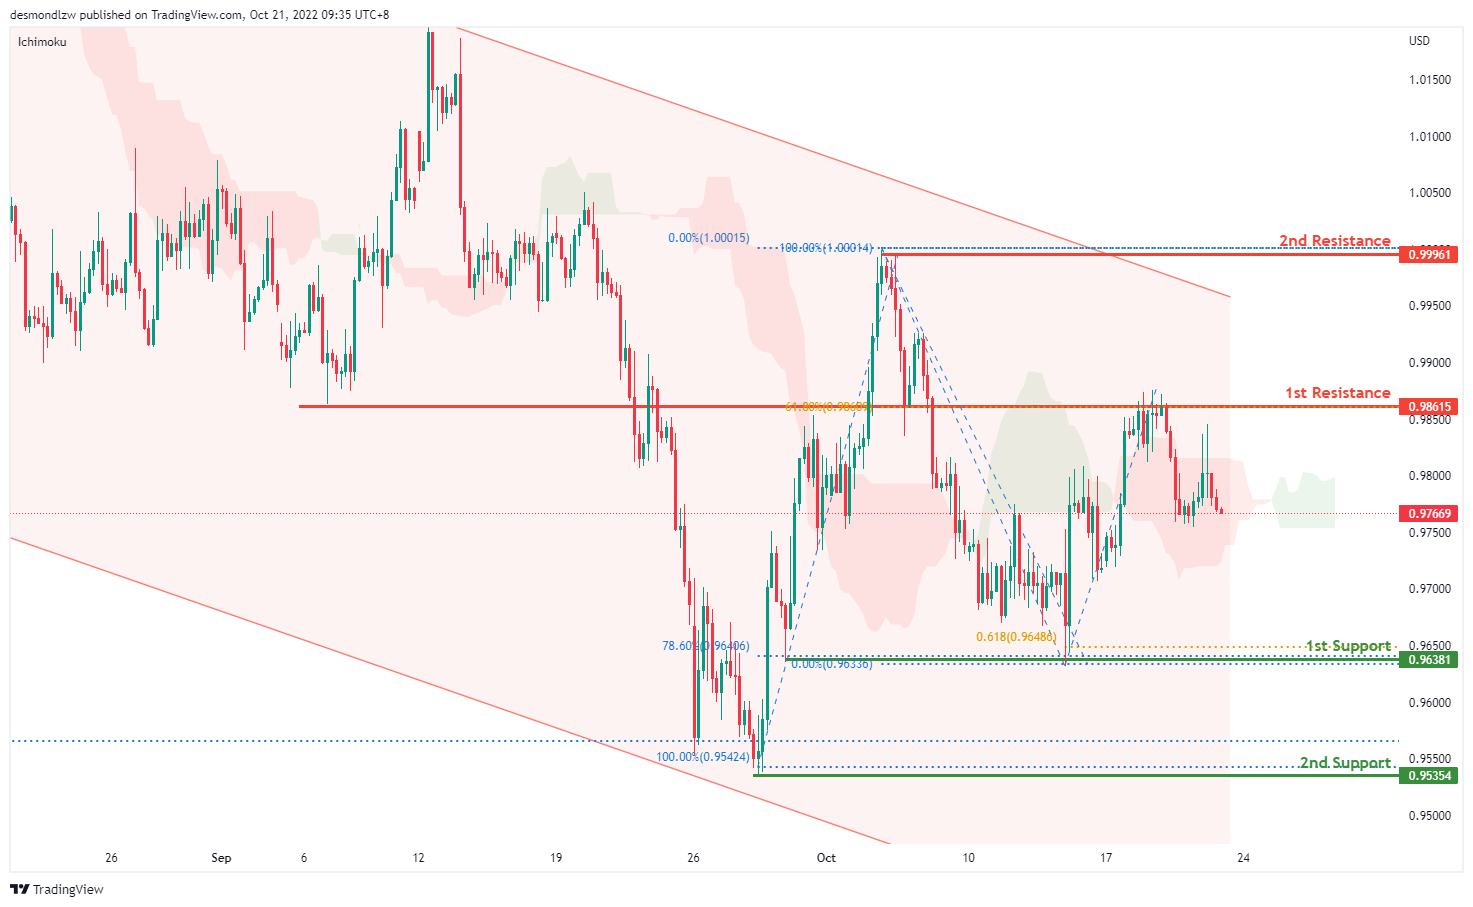
On the H4, price is moving within the descending trendline in a descending manner, with the price moving below ichimoku cloud- we are still overall bearish biased. Price has pulled back slightly and it looks like bearish momentum might bring price to 0.9695 where the 78.6% retracement sits. if it breaks this level, price would test the second support at 0.9535 where the swing low and 161.8% extension sit. Alternatively, price might test the first resistance at 0.9861 w here the 78.6% retracement sits. If price breaks this level, it may test the second resistance at 0.9996, where the previous swing high sits.
Areas of consideration :
- H4 1st resistance at 0.9861
- H4 2nd resistance at 0.9996
GBP/USD:
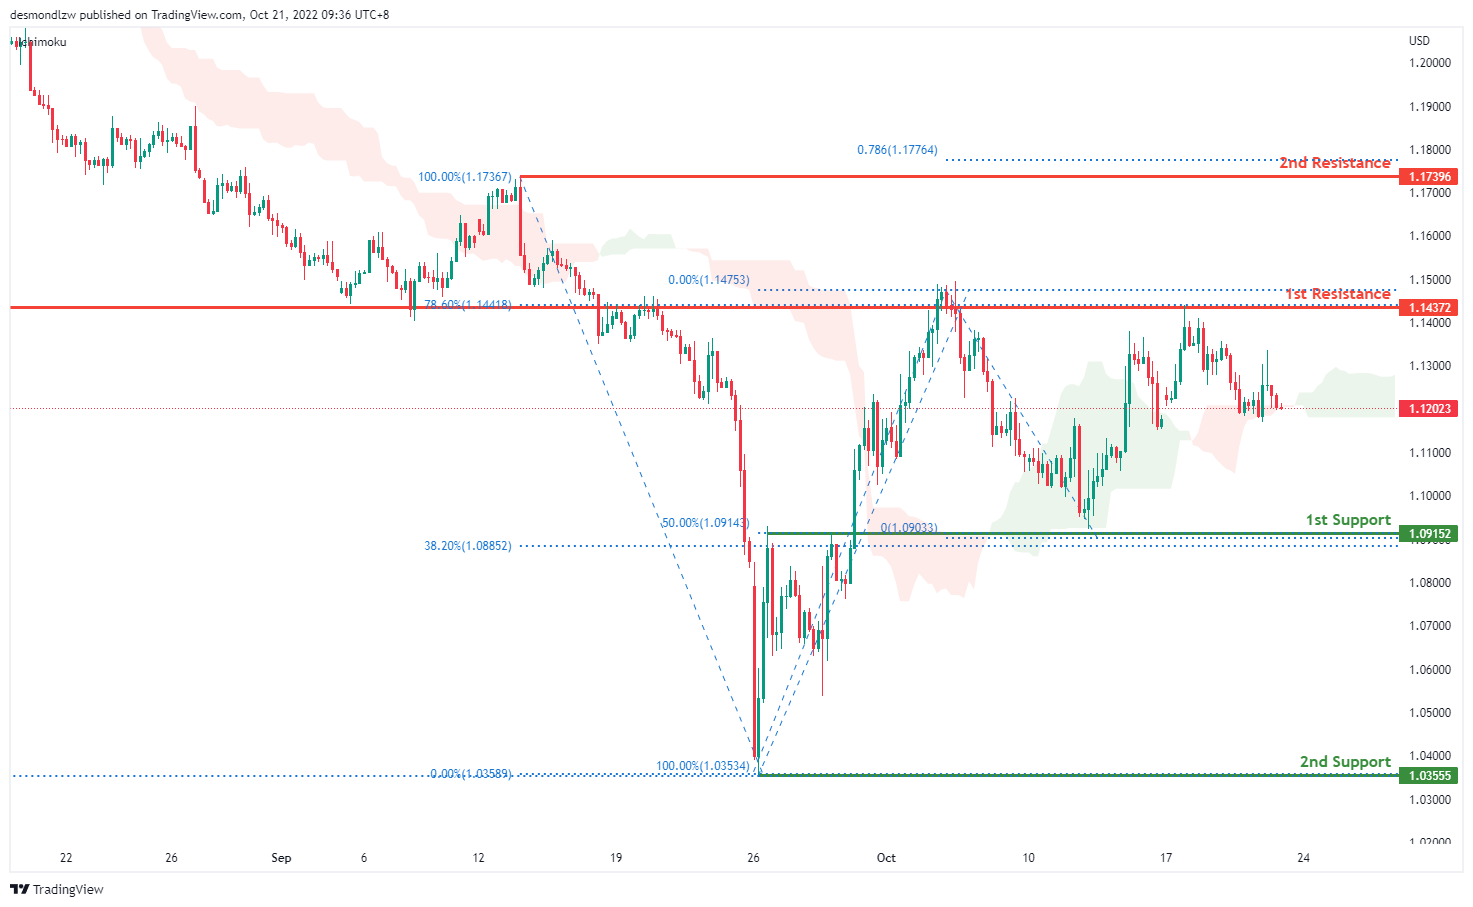
On the H4, price has rejected the resistance and is moving in a descending trend hence we are slightly bearish bias- price looks like its moving toward the first support at 1.0915 where the 50% retracement sits, bearish momentum will bring price to the second support at 1.0355 where the previous swing low sits. Alternatively, price could test the first resistance at 1.1437 where the 78.6% retracement and overlap resistance sit. If it breaks this level, it should test the second resistance at 1.1739.
Areas of consideration:
- H4 1st support at 1.0915
- H4 1st resistance at 1.1437
USD/CHF:
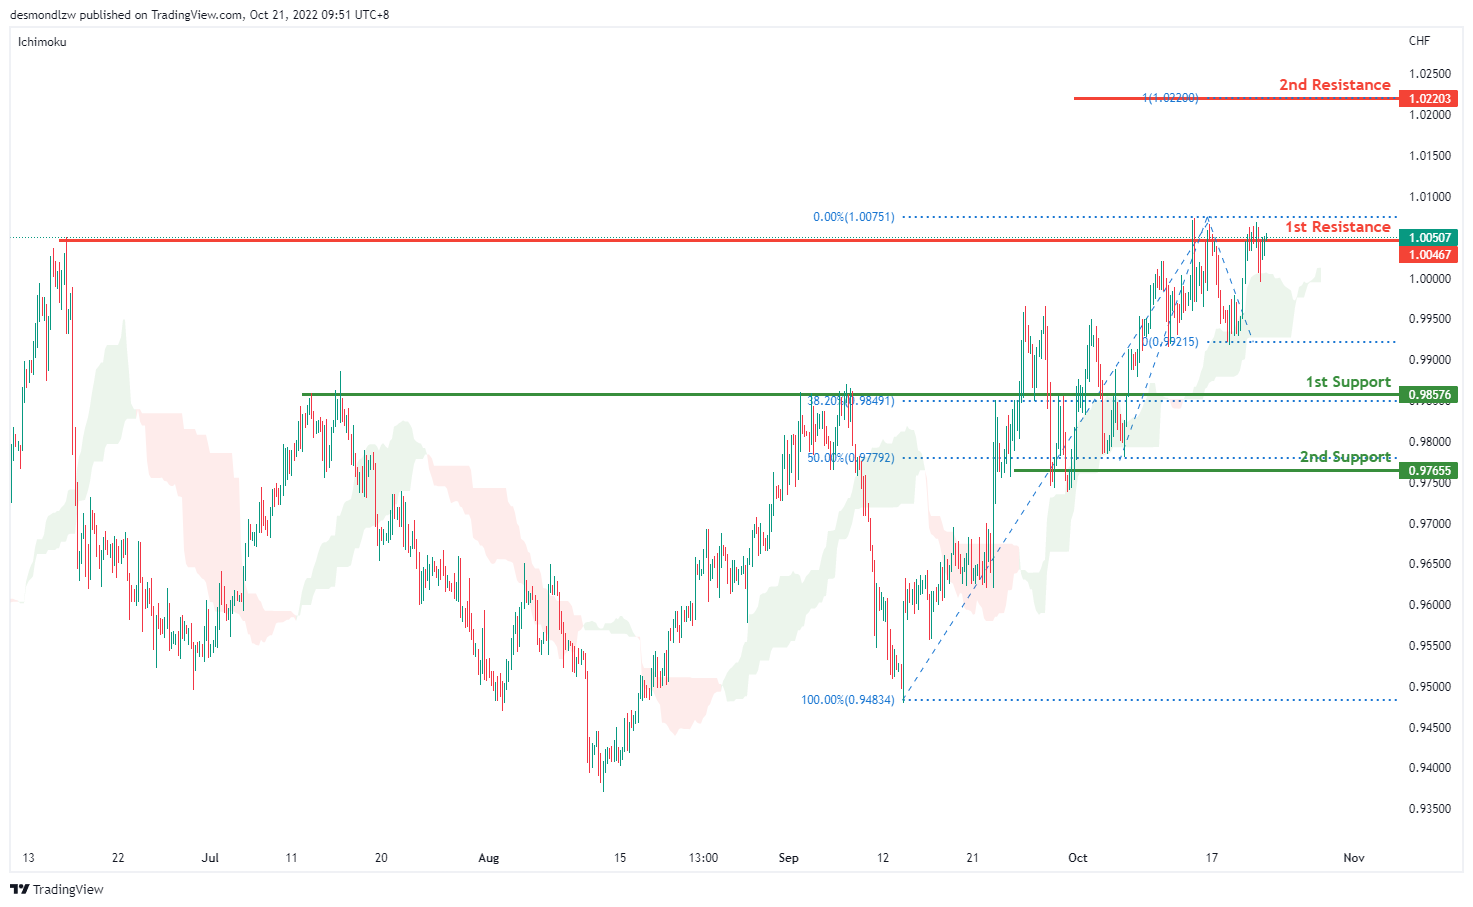
USDCHF is in a strong bullish trend on the H4 chart. Price is trading above the Ichimoku cloud signalling a bullish trend. Price is testing the first resistance at 1.0050 where the previous swing high sits. Bullish momentum could potentially drive prices up to 1.0220. Alternatively, bearish momentum could bring price to test the first support at 0.9857 where the overlap support and 38.2% retracement sits then the second support at 0.9766 where the 50% retracement sits
Areas of consideration
- H4 1st support at 0.9857
- H4 1st resistance at 1.0050
XAU/USD (GOLD):
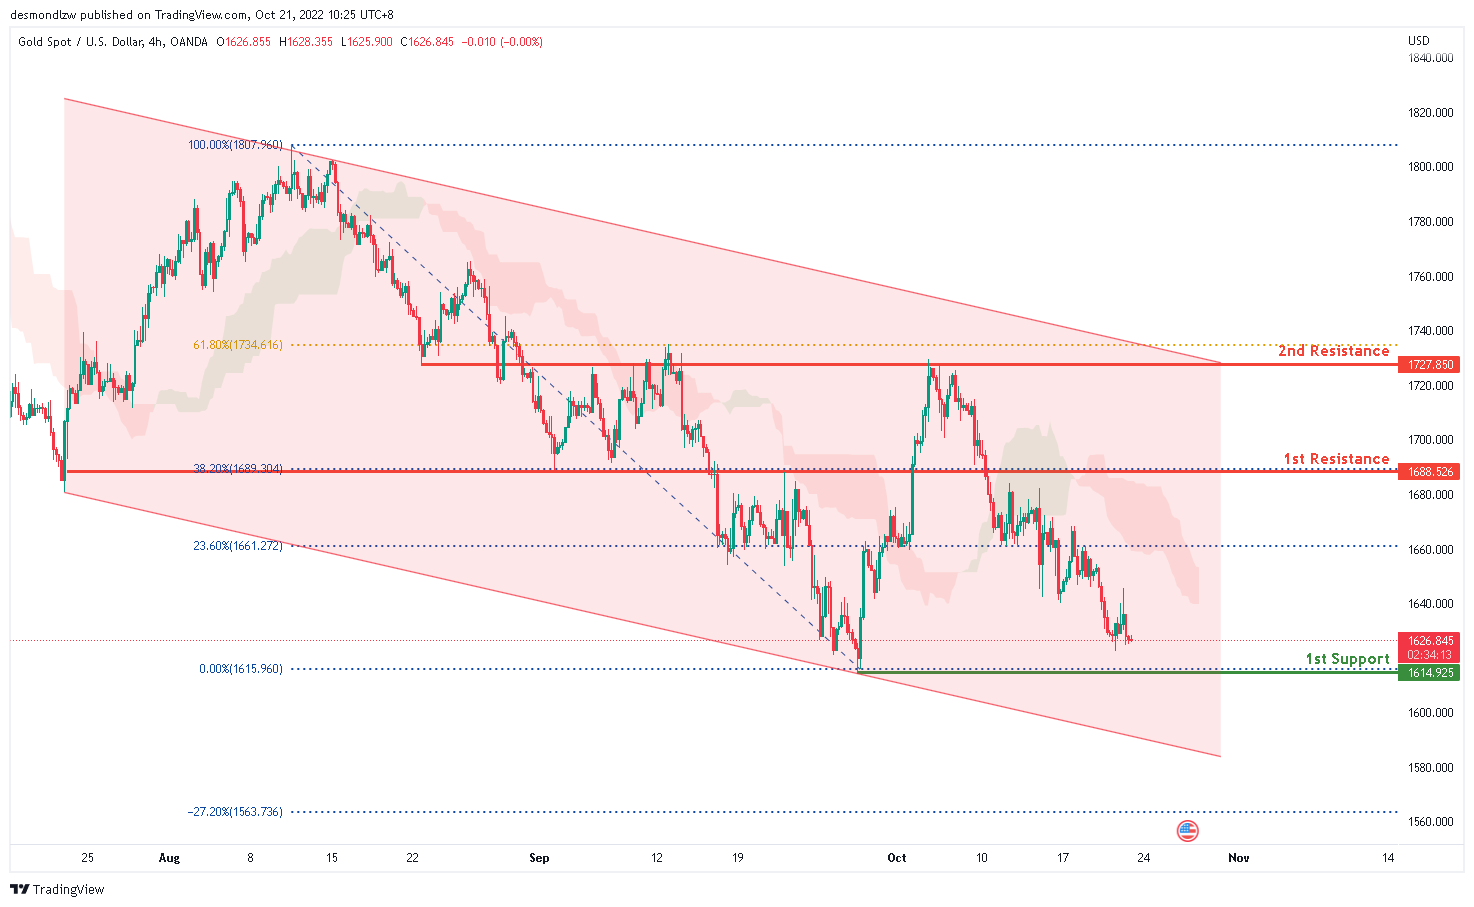
On the H4 chart, the overall bias for XAUUSDis bearish. To add confluence to this, price is below the Ichimoku cloud which indicates a bearish market. Overnight, price has continued it’s bearish momentum downwards. Expecting price to reach the 1st support at 1614.925 where the previous low and 0% Fibonacci line is located.
Areas of consideration:
- H4 time frame, 1st support at 1614.925
- H4 time frame, 1st resistance at 1688.526
AUD/USD:
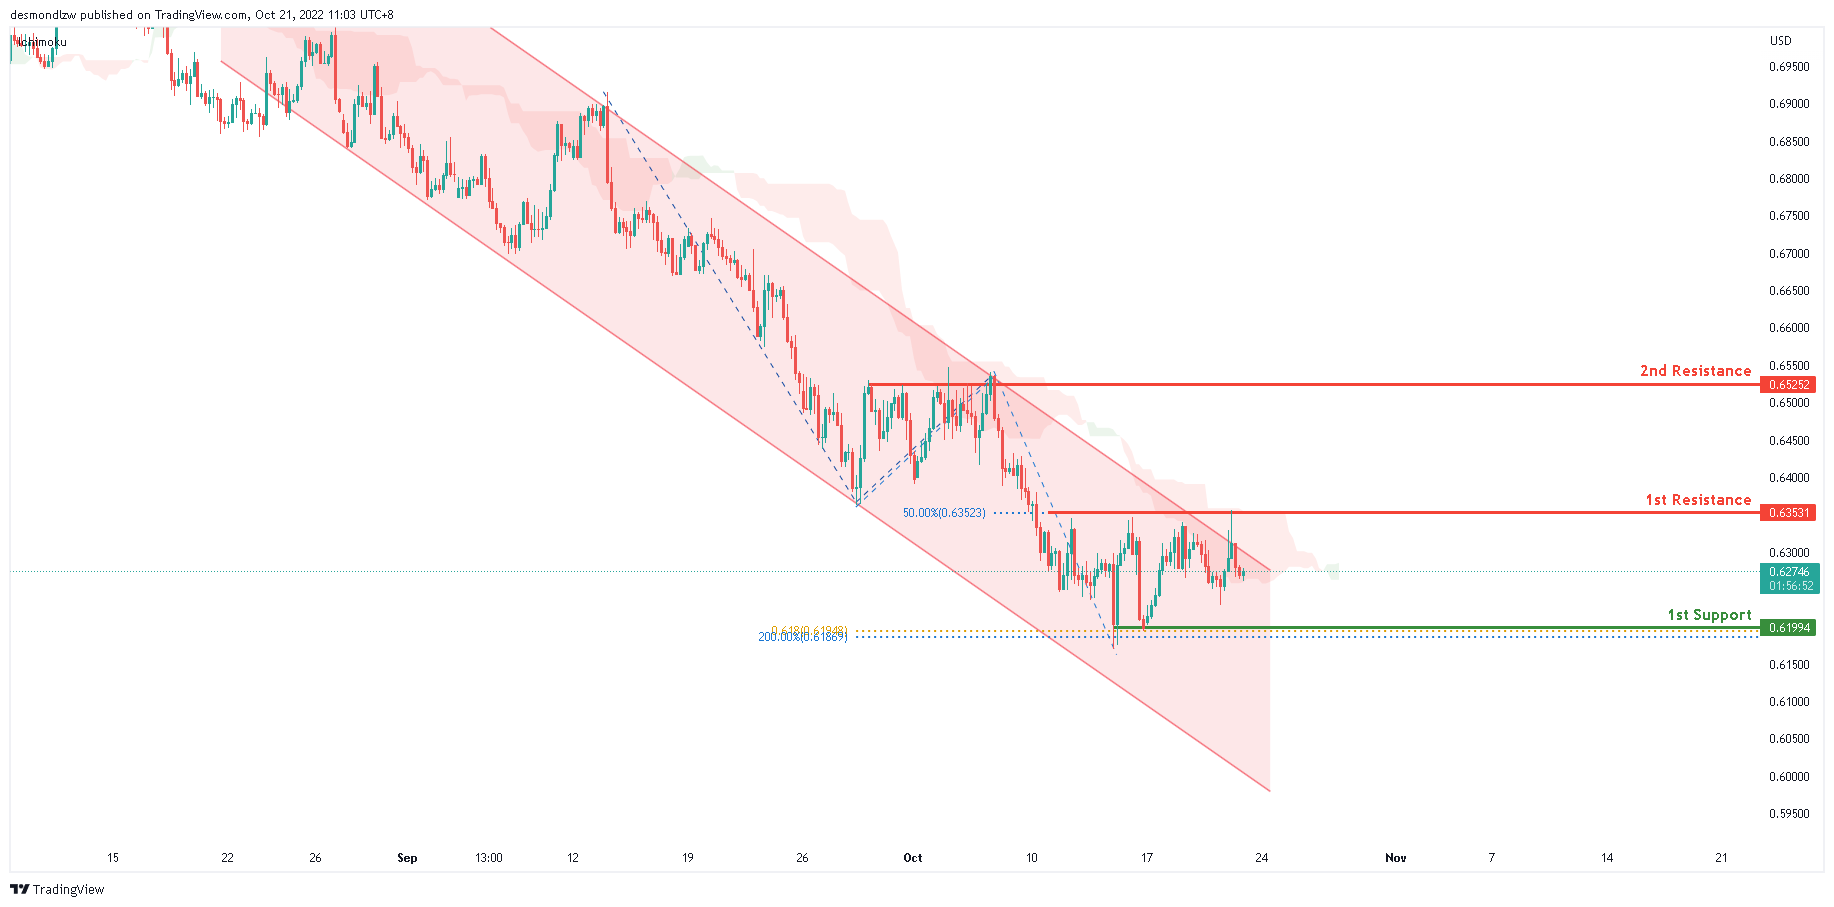
On the H4, the price is dropping from the 1st resistance at 0.63411, with the price is below the descending channel and ichimoku cloud. Overnight, price tested the 1st resistance line at 0.63531 where the 50% Fibonacci line is located. We can expect the price test the 1st support at 0.61921, where the previous swing low, 61.8% fibonacci projection and 200% fibonacci extension are.
Areas of consideration
- H4, 1st resistance at 0.63411
- H4, 1st support at 0.61921
NZD/USD:
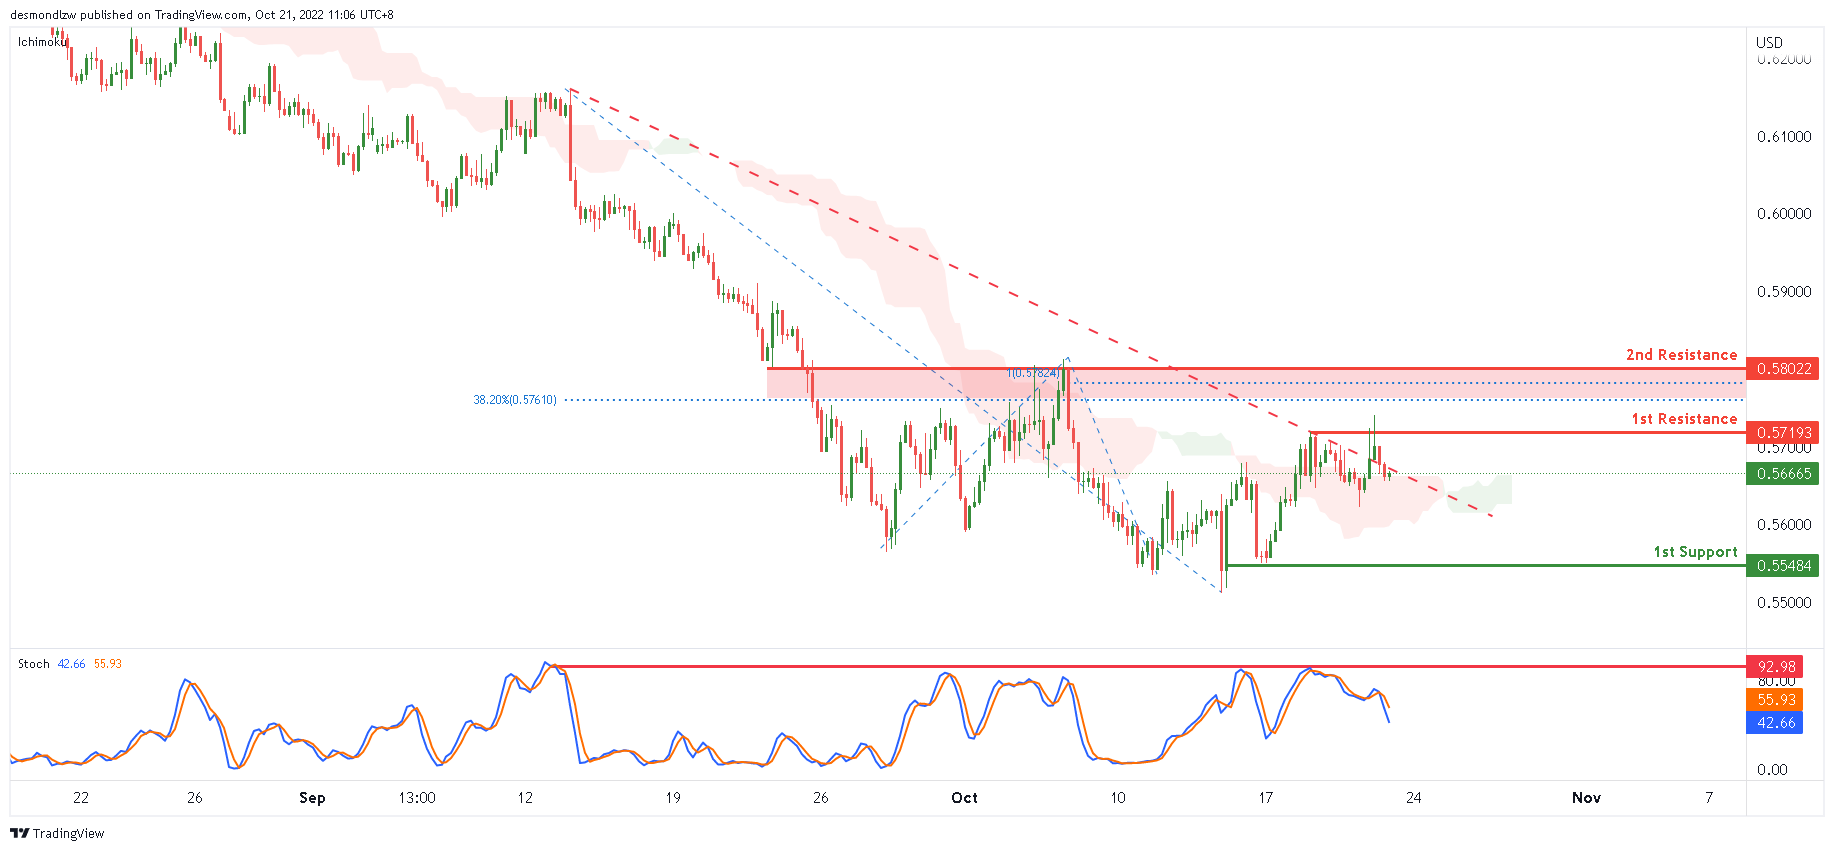
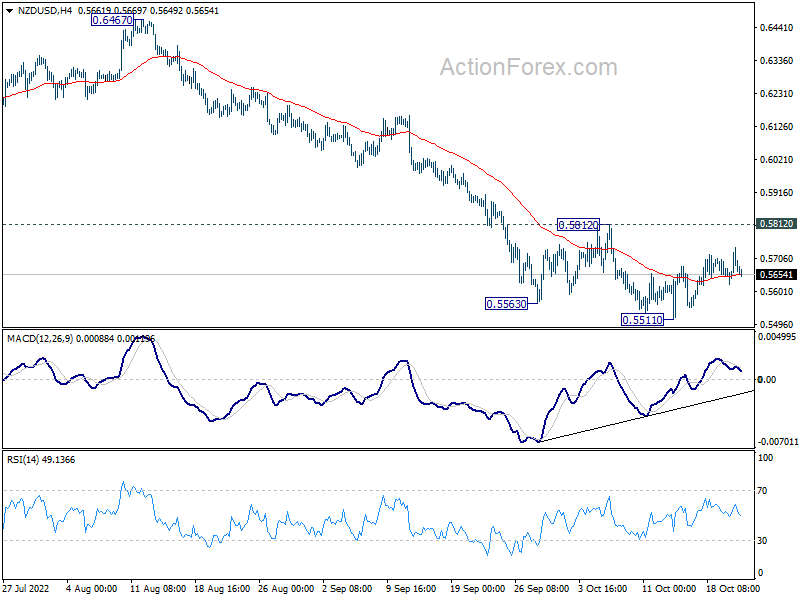
On the H4 chart, the overall bias for NZDUSD is bearish. To add confluence to this, price is below the Ichimoku cloud which indicates a bearish market. However, price is above the Ichimoku cloud which might indicate a short term bullish market. Expecting price to possibly break above the 1st resistance at 0.57193 and possibly head towards the 2nd resistance at 0.58022 where the 38.2% Fibonacci line, 100% Fibonacci projection line and previous high are located.
Areas of consideration:
- H4 time frame, 1st resistance at 0.57193
- H4 time frame, 1st support at 0.55484
USD/CAD:
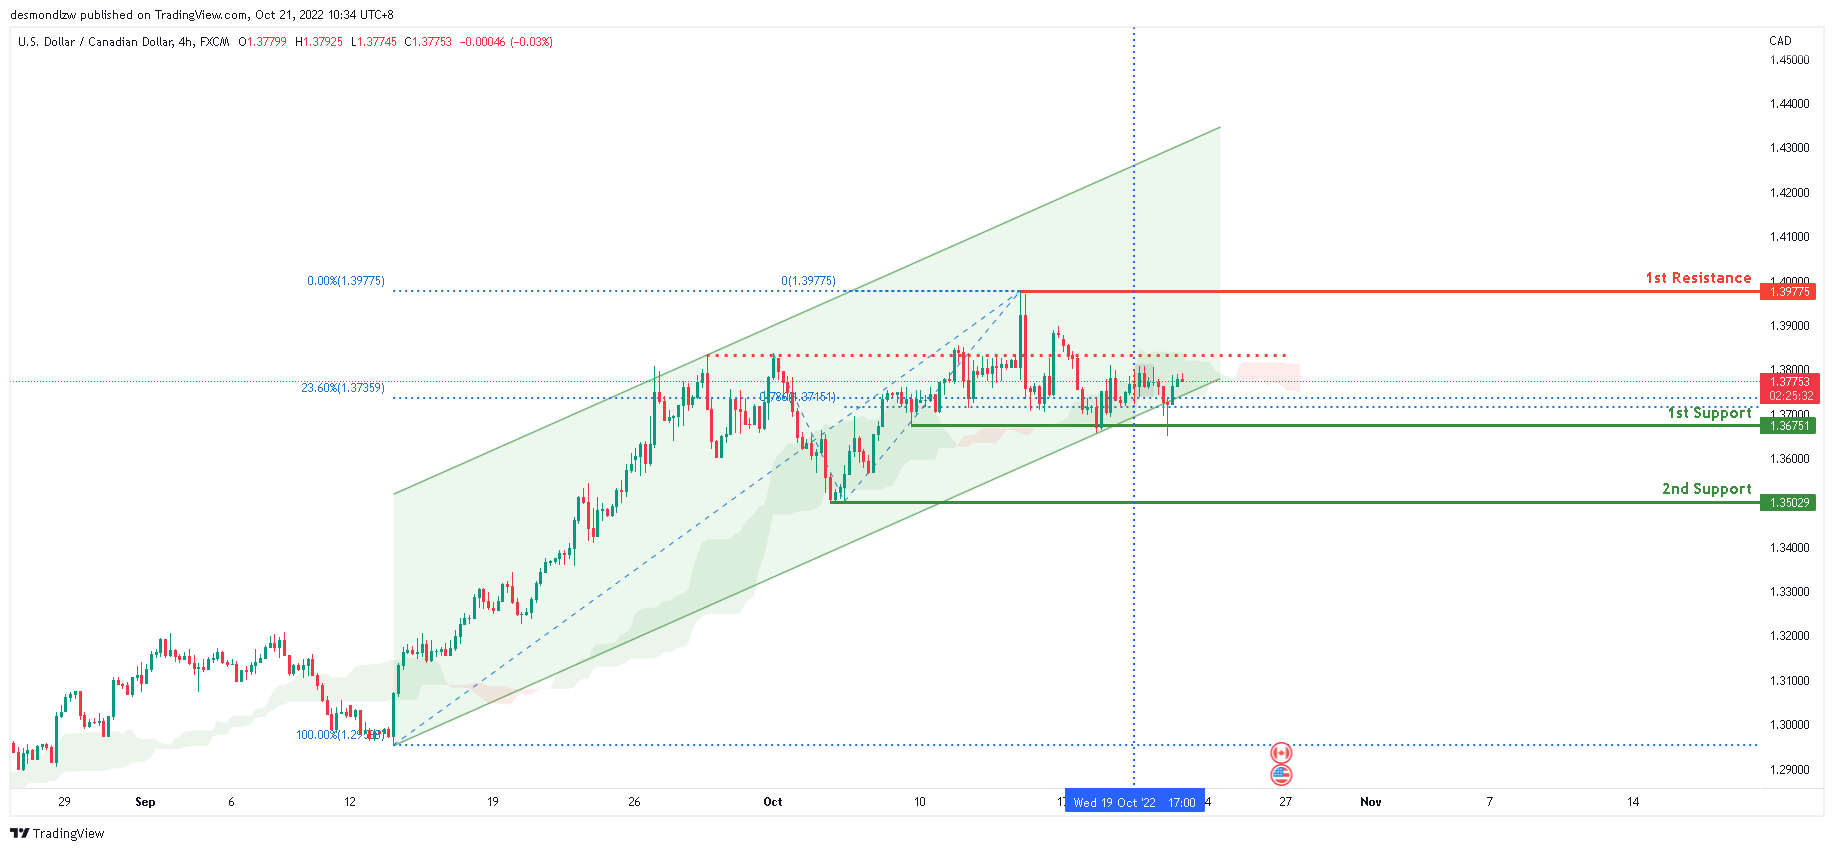
The overall bias for USDCAD on the H4 chart is bullish. Price had a weak bearish momentum overnight with price tapping onto the 1st support at 1.36751 where the 23.6% fibonacci line and 78.6% Fibonacci projection line is located.. If the bullish trend continues, price might head towards the first resistance level at 1.3967, where the previous high is located.
Areas of consideration:
- H4 time frame, 1st resistance at 1.3967
- H4 time frame, 1st support at 1.3675
OIL:
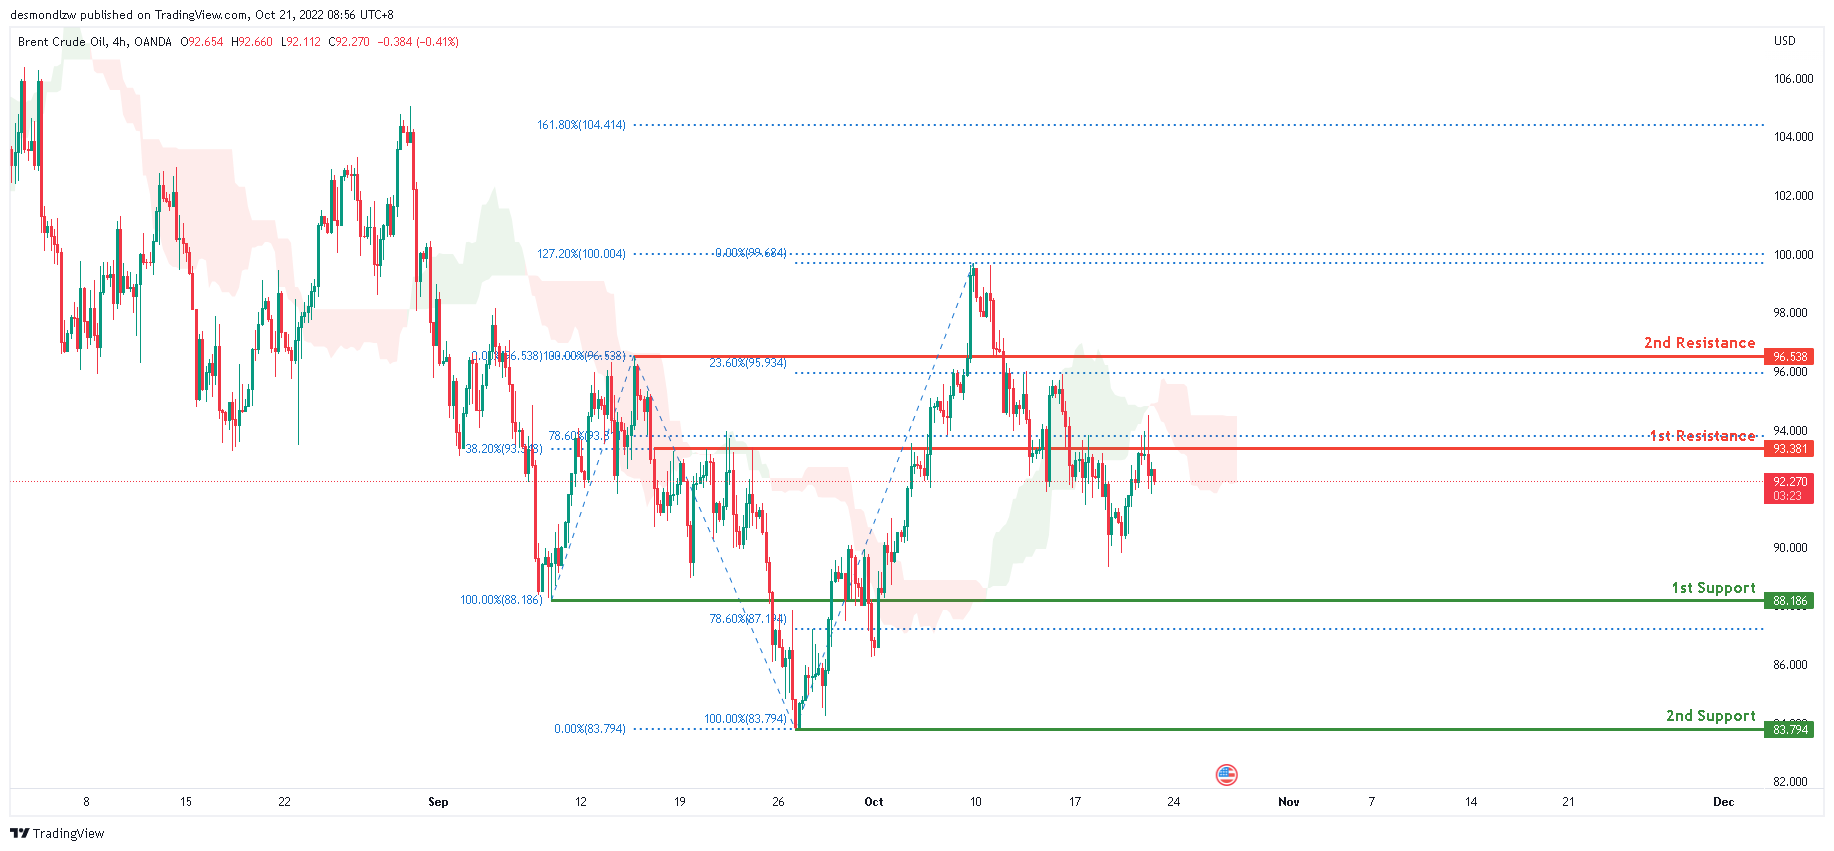
Looking at the H4 chart, the current overall bias for Oil is bearish. To add confluence to this bias, the price is currently below the Ichimoku cloud which indicates a bearish market. Overnight, it gained bullish momentum breaking past the 1st resistance line at 93.381 where the 38.2% and 78.6% Fibonacci lines are located before going back underneath it. Expect the price to head towards the 1st support at 88.186 where the 100% and 78.6% Fibonacci lines are located if this bearish momentum continues.
Areas of consideration:
- H4 time frame, 1st resistance at 93.381
- H4 time frame, 1st support at 88.186
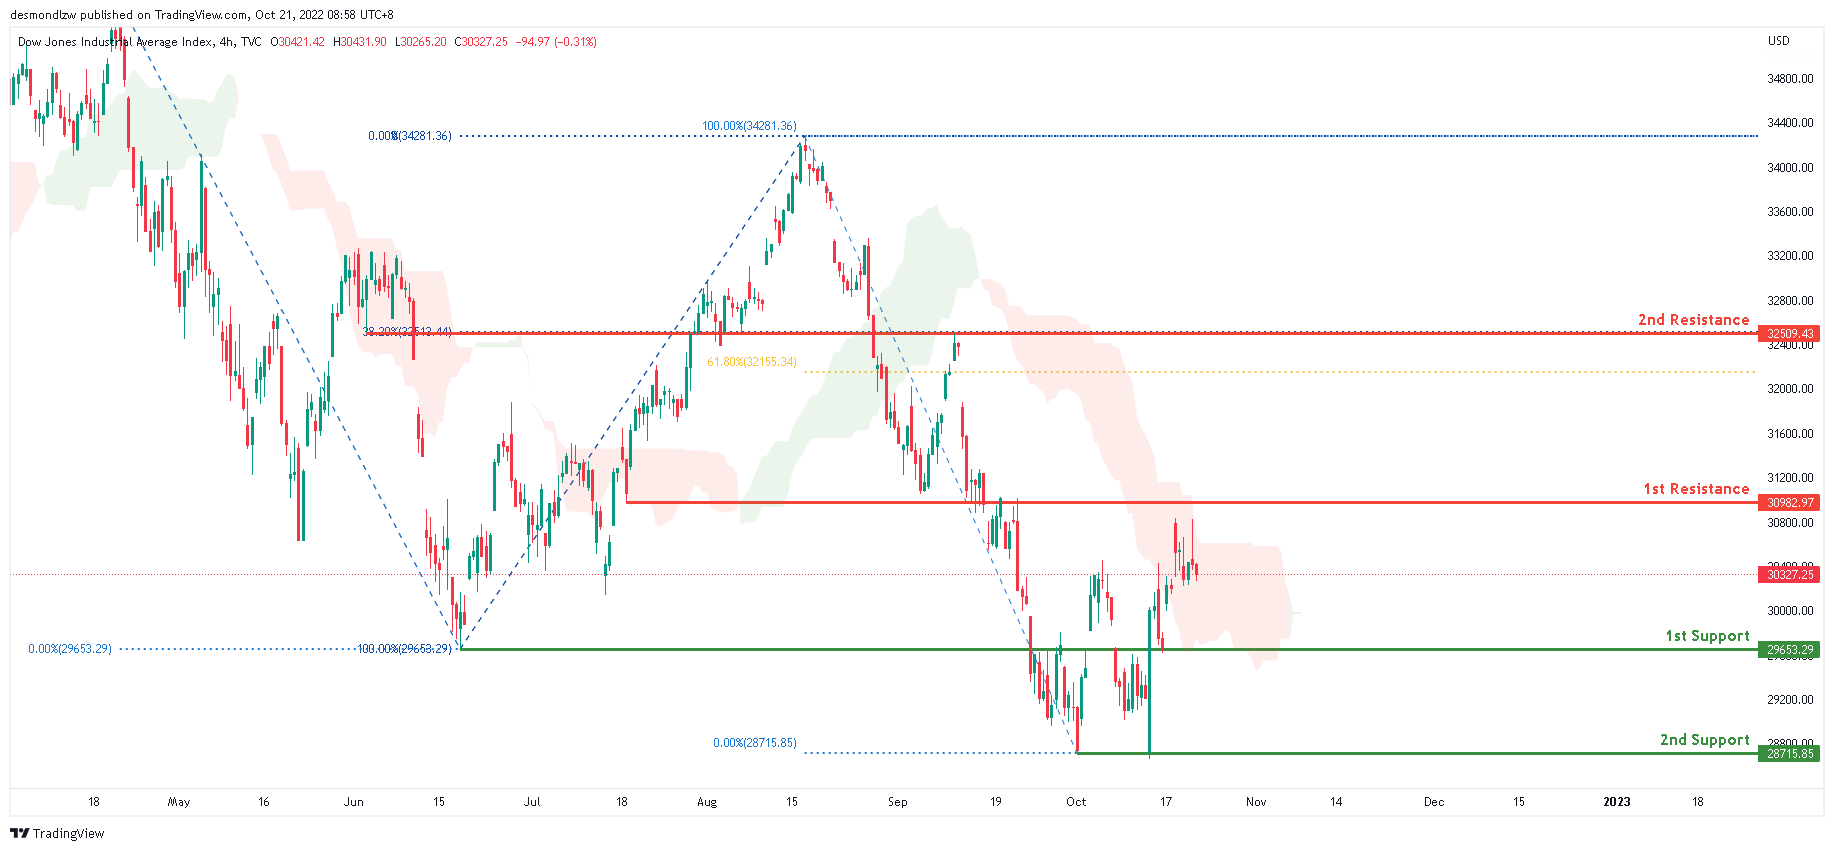
Dow Jones Industrial Average:
According to the H4 chart, DJI now has a bearish overall bias. Price consolidated between 30827 and 30231 overnight. Expect the price to potentially move toward the first resistance at 30982.97, where the 38.2% Fibonacci line is placed, if this short-term bullish momentum persists.
Areas of consideration:
- H4 time frame, 1st support at 29653.29
- H4 time frame, 2nd support at 28715.85
- H4 time frame, 1st Resistance at 30982.97
DAX:
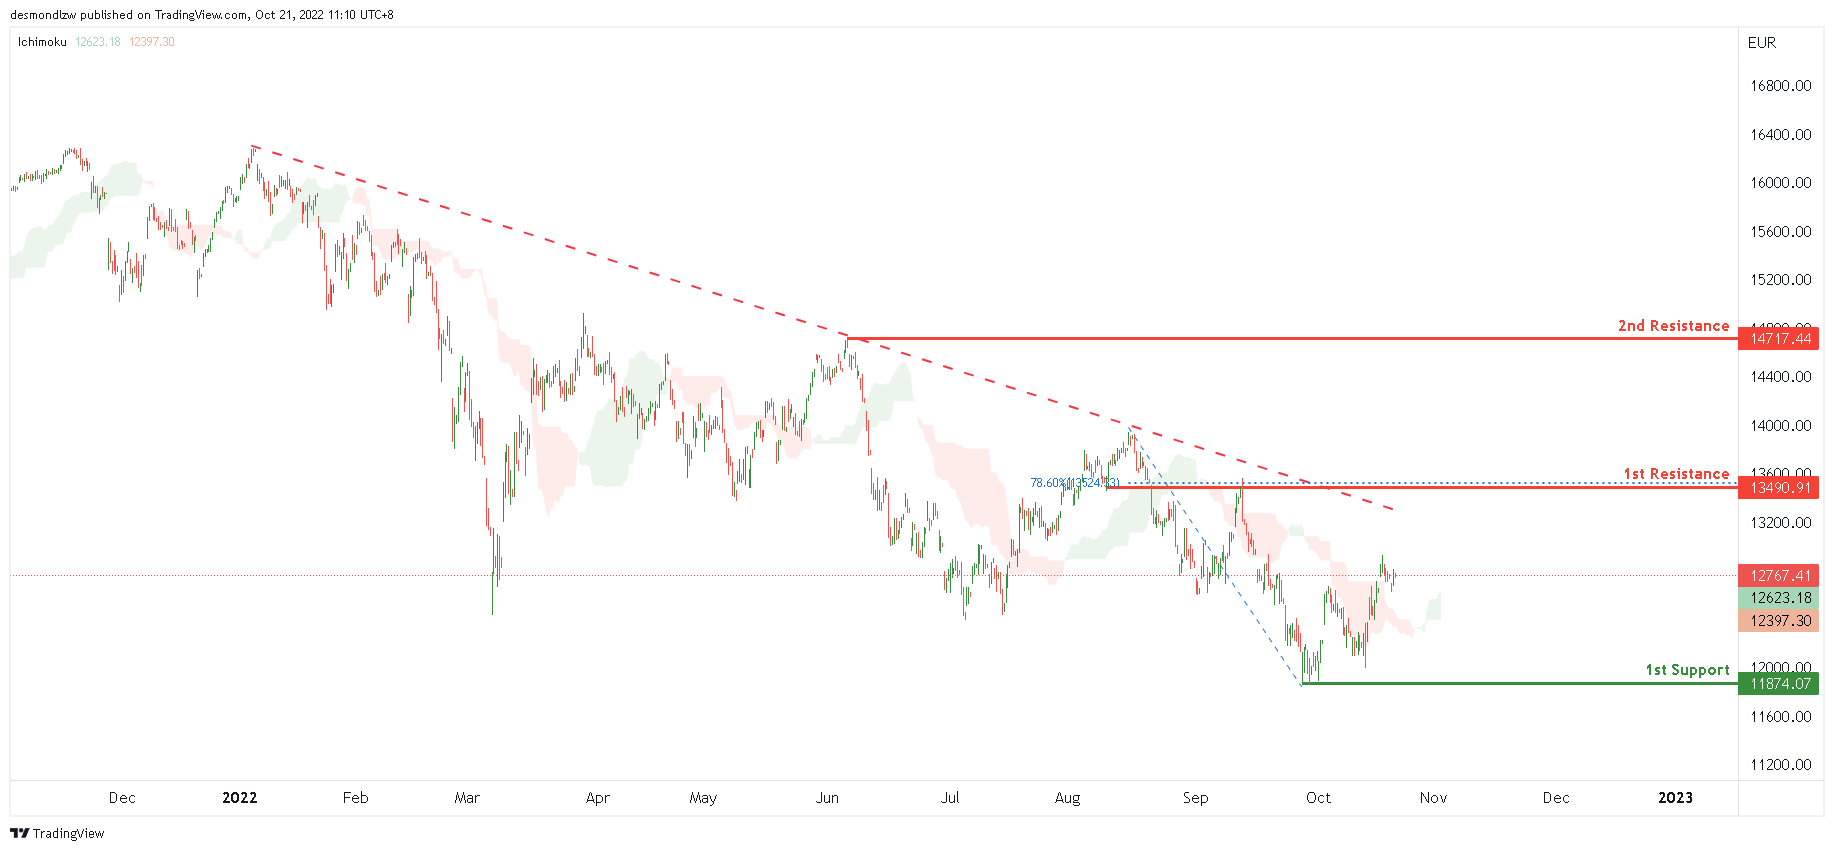
On the H4 chart, the overall bias for DAX is bearish. However, price has now closed above the Ichimoku cloud which indicates a change to bullish market momentum. Expecting price to possibly continue this bullish momentum and head towards the 1st resistance at 13490.91, where the 78.6% Fibonacci line is located.
Areas of consideration:
- H4 time frame, current price
- H4 time frame, 1st resistance at 12668.06
ETHUSD:
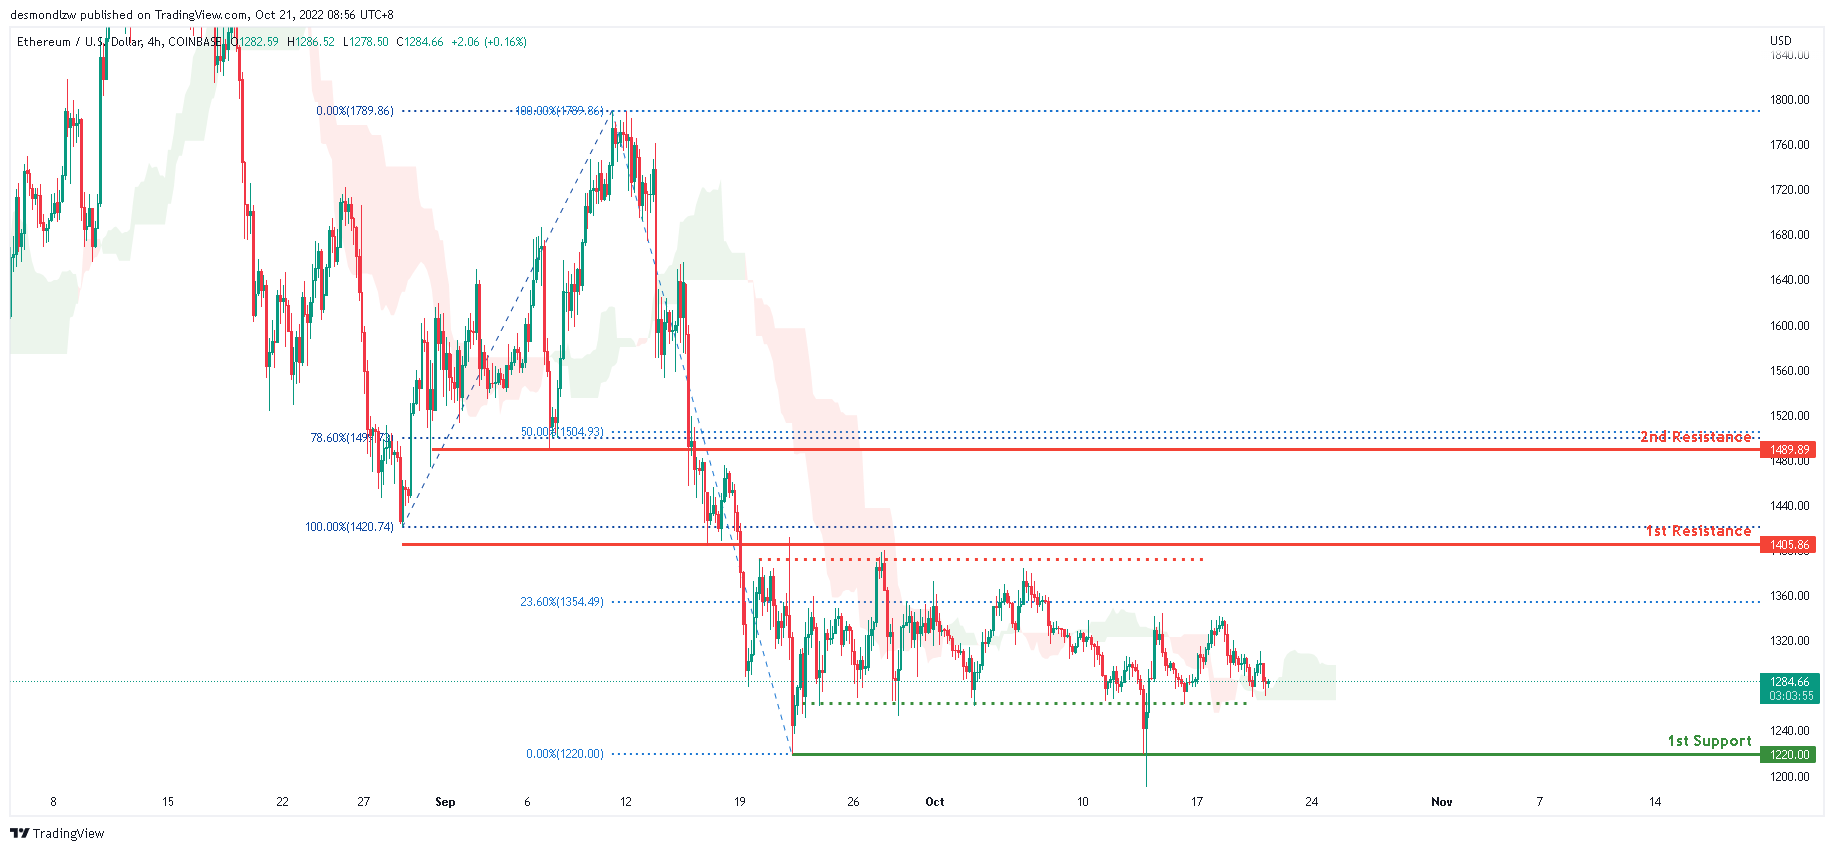
Looking at the H4 chart, the current overall bias for ETHUSD is bearish. However overnight, price has closed above the Ichimoku cloud which might indicate a short term bullish momentum. For the past 1 month, price has been consolidating between the 1st resistance at 1405.86 and 1st support at 1405.86. Expecting price to continue consolidating in this area with no clear signs of direction.
Areas of consideration:
- H4 time frame, 1st resistance of 1405.86
- H4 time frame, 1st support at 1220.00
BTCUSD:
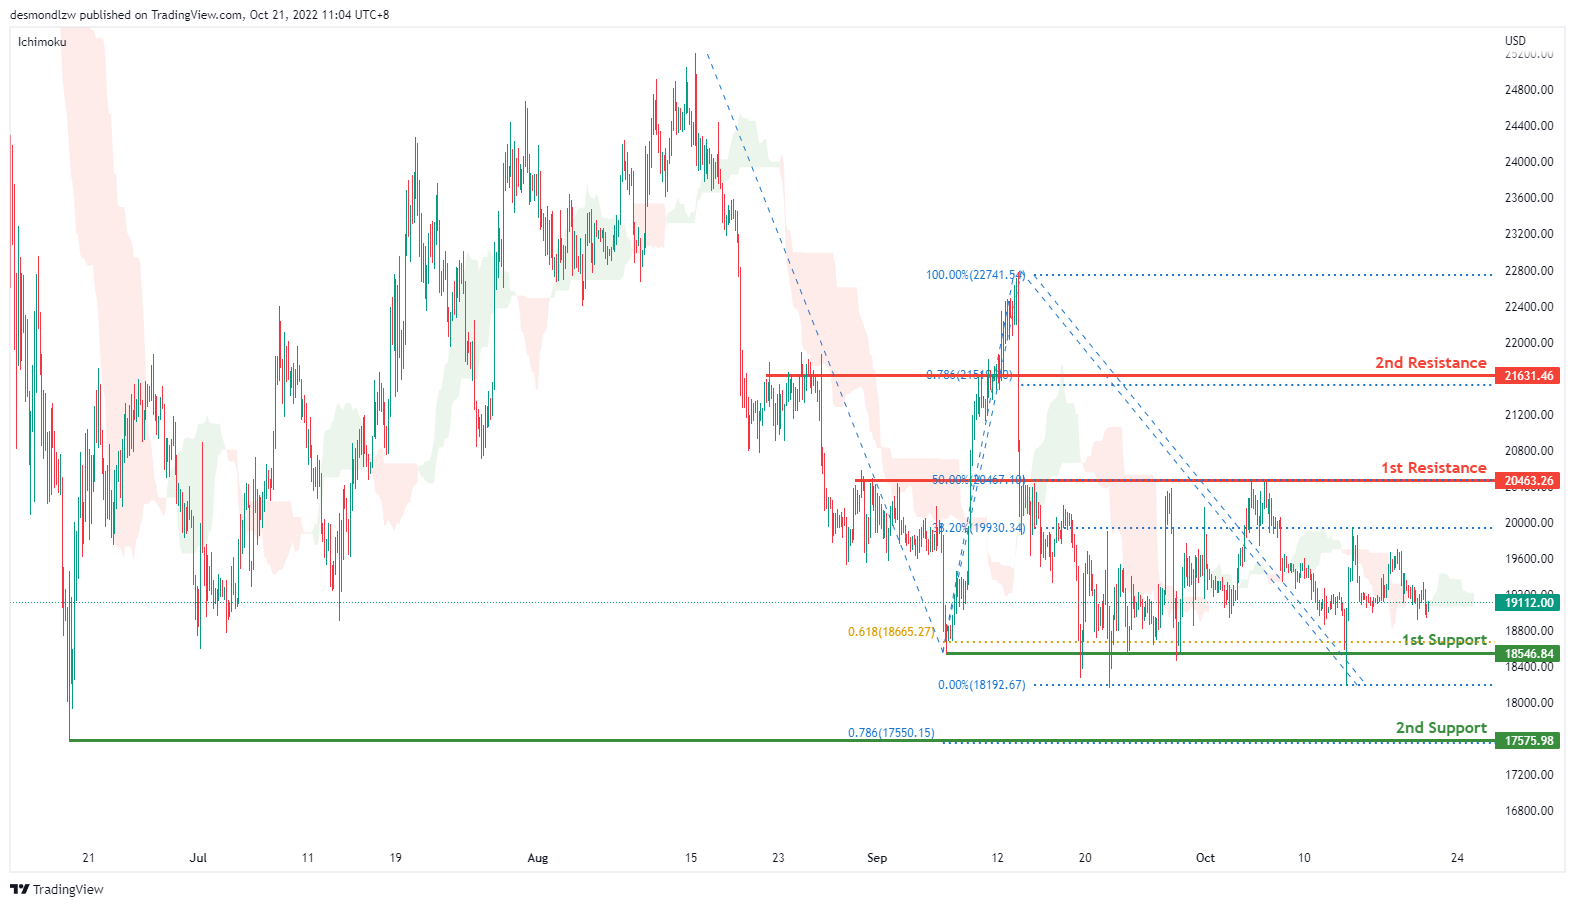
On the H4, price is crossing ichimoku cloud, and Stoch is dropping from the resistance, we have a bearish bias that the price may drop to the 1st support at 18546.84, which is in line with the previous swing lows and if the 1st support is broken, the 2nd support is at 17575.98, where the previous swing low and 78.6% retracement is. Alternatively, the price may rise to the 1st resistance at 20427.26, where the overlap resistance and 50% fibonacci retracement are then the second resistance at 21631.46
Areas of consideration:
- H4 time frame, 1st resistance 20463.26
- H4 time frame, 1st support at 18546.84
S&P 500:
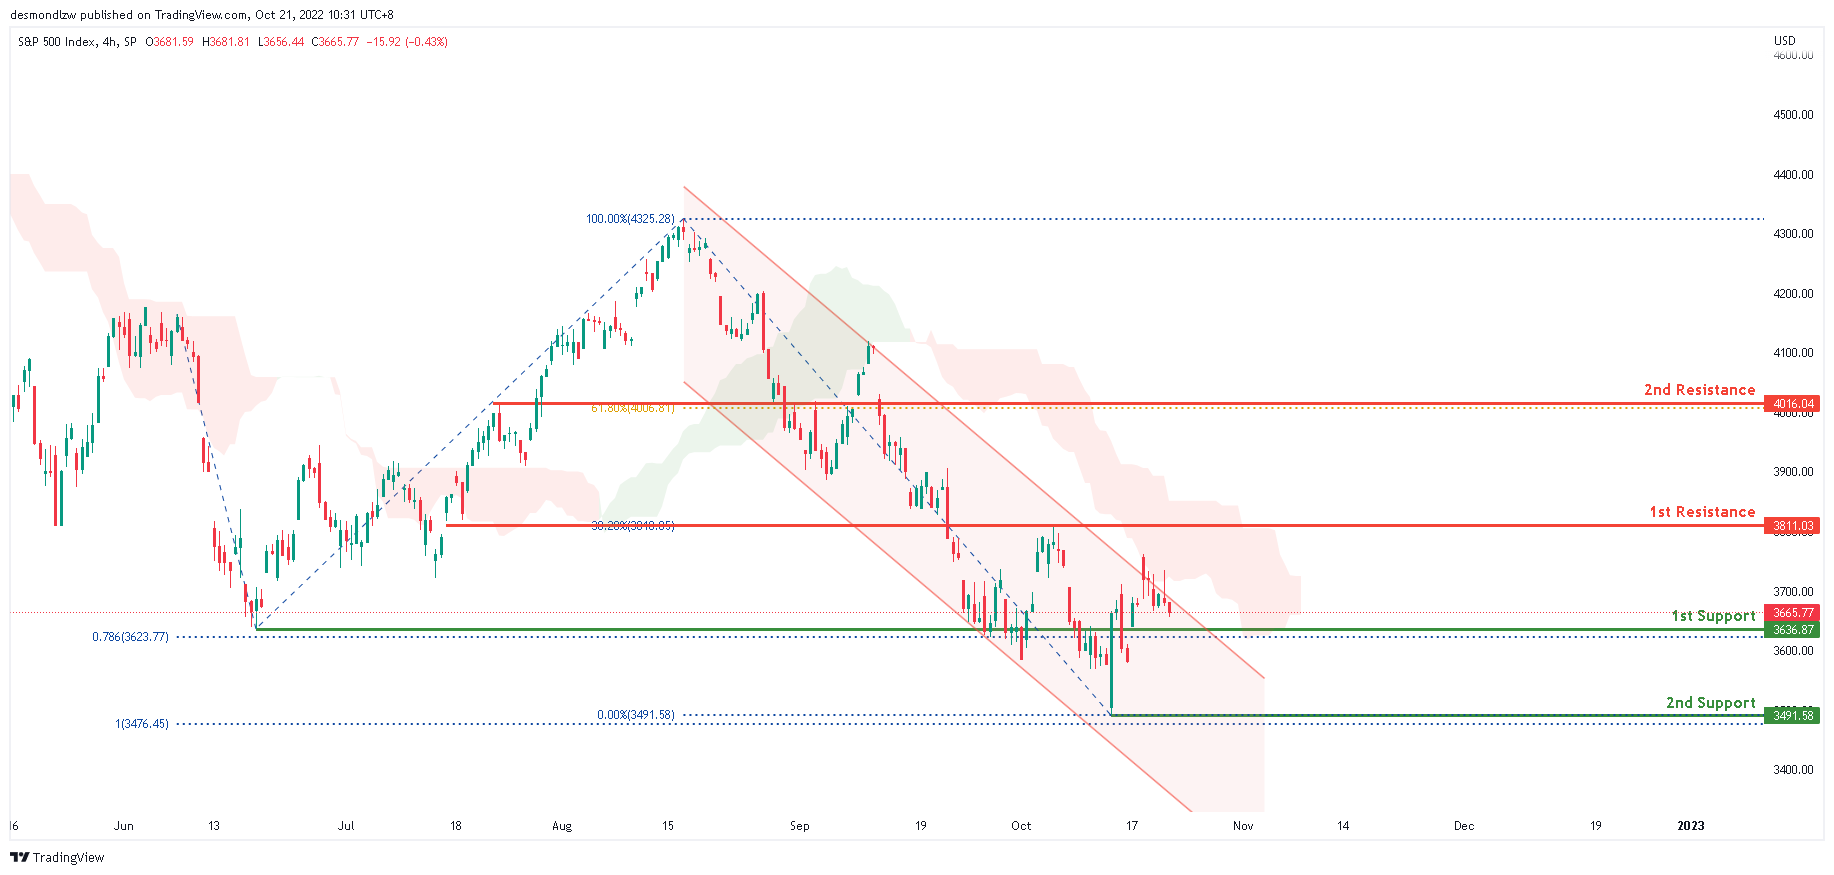
Based on the H4 chart, the S&P500 is still within the bearish channel, with the overall bias to be bearish. To add confluence to this, price is below the Ichimoku cloud which indicates a bearish market. Overnight, price has continued it’s bearish momentum downwards with price expected to tap onto the 1st support at 3636.87 where the 78.6% Fibonacci projection line is located.
Areas of consideration:
- H4 time frame, 1st support at 3492.42
- H4 time frame, 1st resistance at 3800
- H4 time frame, 2nd resistance at 4007.45
USD/JPY Daily Outlook
Daily Pivots: (S1) 149.71; (P) 150.00; (R1) 150.44; More...
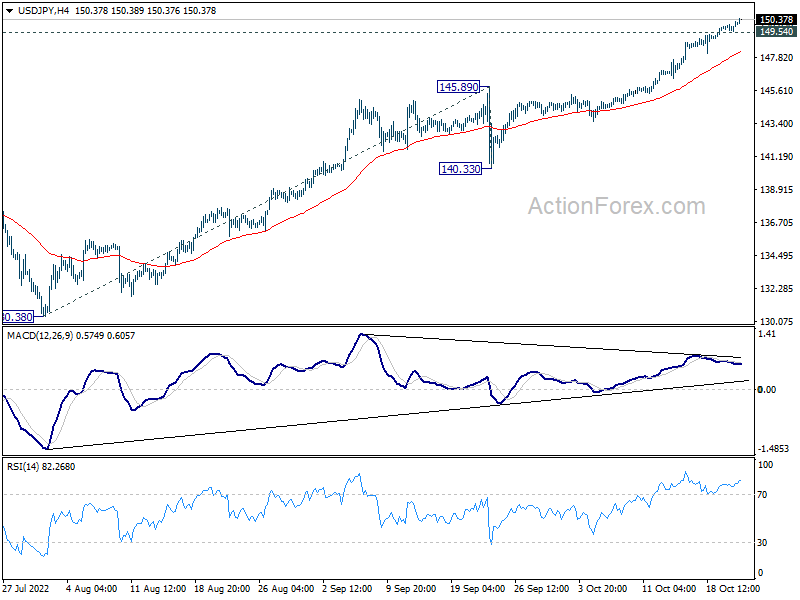
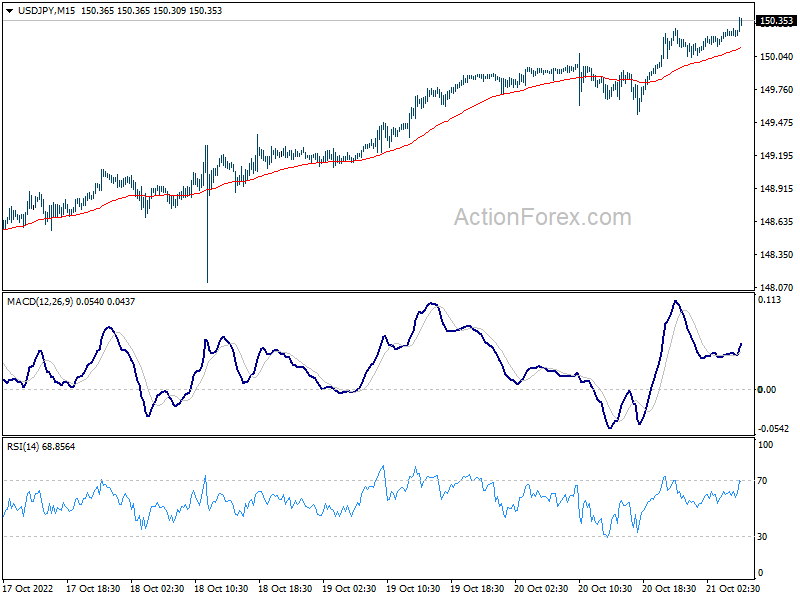
USD/JPY's rally continues today and stays above 150 handle, without clear sign of intervention by Japan. Intraday bias stays on the upside. Current up trend would target 100% projection of 130.38 to 140.33 from 145.89 at 155.84 next. On the downside, break of 149.54 minor support will turn intraday bias neutral and bring consolidations But near term outlook will remain bullish as long as 145.89 resistance turned support holds.
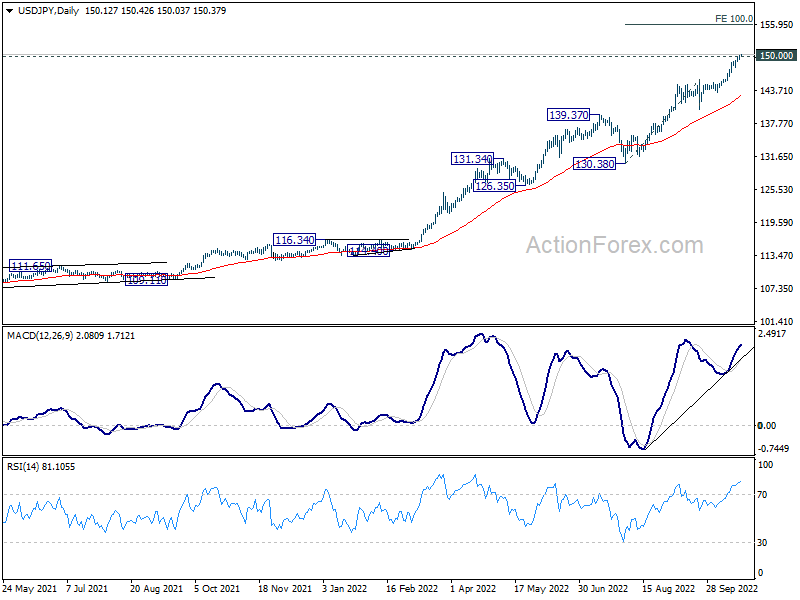
In the bigger picture, up trend from 101.18 is still in progress, as part of the whole up trend from 75.56 (2011 low). 147.68 (1998 high) was already met and there is no clearly sign of topping yet. In any case, break of 140.33 support is needed to be the first sign of medium term topping. Otherwise, further rise is in favor to next target at 160.16 (1990 high).
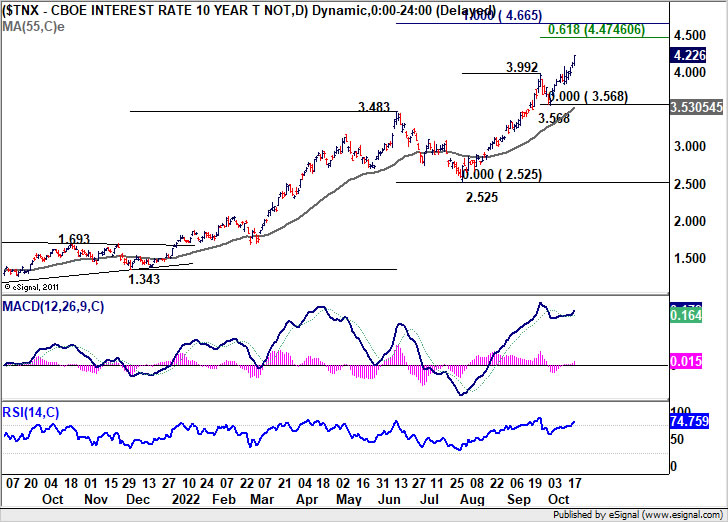
Dollar Standing Above 150 Against Yen, 10-Yr Yield Above 4.2
Yen remains the biggest loser for the week even though Japan has stepped up with the rhetorics against "speculations". Dollar is standing above 150 level against Yen for now, without clear sign of actual intervention. The pair is supported by 10-year yield which broke above 5.2 handle. Nevertheless, thanks to stabilization in overall market sentiment, the greenback is also among the weakest together with Swiss Franc. Commodity currencies are the winner for now. Sterling is a touch weaker against Euro, having little reaction to the continuous political chaos in the UK, while both are mixed.
Technically, it should be emphasized that the recoveries in Aussie, Kiwi and Loonie are so far weak, and don't warrant trend reversal. The key near term levels included 0.6362 resistance in AUD/USD, 0.5812 resistance in NZD/USD, and 1.3501 support in USD/CAD. As long as these level holds, selloffs in the three will more likely resume than not.
In Asia, at the time of writing, Nikkei is down -0.30%. Hong Kong HSI is down -0.17%. China Shanghai SSE is up 0.50%. Singapore Strait Times is down -1.07%. Japan 10-year JGB yield is up 0.0004 at 0.254. Overnight, DOW dropped -0.30%. S&P 500 dropped -0.80%. NASDAQ dropped -0.61%. 10-year yield rose 0.099 to 4.226.
Fed Harker: Interest will be well above 4% by year-end
Philadelphia Fed President Patrick Harker said yesterday, "We are going to keep raising rates for a while. Given our frankly disappointing lack of progress on curtailing inflation, I expect we will be well above 4% by the end of the year."
"Sometime next year, we are going to stop hiking rates. At that point, I think we should hold at a restrictive rate for a while to let monetary policy do its work," he said. "It will take a while for the higher cost of capital to work its way through the economy. After that, if we have to, we can tighten further, based on the data."
Fed Cook: Ongoing rate hikes required to bring inflation down
Fed Governor Lisa Cook said, "Inflation is too high, it must come down and we will keep at it until the job is done. This likely will require ongoing rate hikes and then keeping policy restrictive for some time."
"Policy must be based on whether we see inflation actually falling in the data, rather than just in forecasts. Policy should remain focused on restoring price stability, which will also set the foundation for a sustainably strong labor market," she said.
Japan Suzuki: We are confronting speculators strictly
Japan stepped up verbal intervention as USD/JPY breaks above 150 level. Finance Minister Shunichi Suzuki warned today, "we are confronting speculators strictly."
Yet, when asked if Yen was under attack by speculators, Suzuki said, "it's inappropriate for me to comment on such a question under the current circumstances."
Regarding BoJ policy, he said, "I'm not in a position to comment anything concrete. We'll strive to maintain fiscal discipline with a major target of achieving primary budget surplus in fiscal 2025."
Japan CPI core rose to 3% yoy in Sep
Japan headline CPI was unchanged at 3.0% yoy in September, below expectation of 3.1% yoy. CPI core (all items ex-fresh food) accelerated from 2.8% yoy to 3.0% yoy, matched expectations. CPI core-core (all items ex-fresh food and energy) accelerated from 1.6% to 1.8% yoy, below expectation of 2.0% yoy.
CPI core has now exceeded BoJ's target for the 6th straight months, and hit the highest level since 1991 (excluding the effect of the 2014 sales tax hike). CPI core-core was also at the highest level since 2015. Yet, BoJ is seeing inflation as mostly driven by imports rather than domestic price pressures. This could be reflected in the 5.6% yoy rise in goods prices, and the sluggish 0.2% yoy rise in services prices.
NZ exports rose 37.% yoy in Sep, imports rose 16% yoy
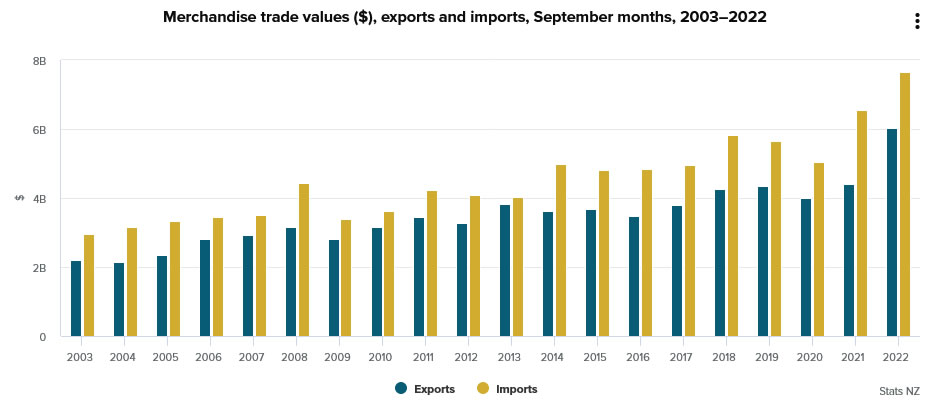
New Zealand good exports rose 37% yoy or NZD 1.6B to NZD 6B in September. Goods imports rose 16% yoy or NZD 1.1B to NZD 7.6B. Monthly trade balance reported a deficit of NZD -1.6B.
Exports to all major trading partners were up, including China (+31% yoy), Australia (+33% yoy), USA (+13% yoy), EU (+21% yoy), and Japan (+42% yoy).
Imports from all major trading partners rose, except EU, including China (+20% yoy), EU (-5.3% yoy), Australia (+11% yoy), USA (+26% yoy), and Japan (+14% yoy).
Looking ahead
UK retail sales data is the main focus in European session. Later in the day, Canada will also release retail sales and new housing price index. Eurozone will release consumer confidence.
USD/JPY Daily Outlook
Daily Pivots: (S1) 149.71; (P) 150.00; (R1) 150.44; More...
USD/JPY's rally continues today and stays above 150 handle, without clear sign of intervention by Japan. Intraday bias stays on the upside. Current up trend would target 100% projection of 130.38 to 140.33 from 145.89 at 155.84 next. On the downside, break of 149.54 minor support will turn intraday bias neutral and bring consolidations But near term outlook will remain bullish as long as 145.89 resistance turned support holds.
In the bigger picture, up trend from 101.18 is still in progress, as part of the whole up trend from 75.56 (2011 low). 147.68 (1998 high) was already met and there is no clearly sign of topping yet. In any case, break of 140.33 support is needed to be the first sign of medium term topping. Otherwise, further rise is in favor to next target at 160.16 (1990 high).
Economic Indicators Update
| GMT | Ccy | Events | Actual | Forecast | Previous | Revised |
|---|---|---|---|---|---|---|
| 21:45 | NZD | Trade Balance (NZD) Sep | -1615M | -1413M | -2447M | -2625M |
| 23:01 | GBP | GfK Consumer Confidence Oct | -47 | -52 | -49 | |
| 23:30 | JPY | National CPI Core Y/Y Sep | 3.00% | 3.00% | 2.80% | |
| 06:00 | GBP | Retail Sales M/M Sep | -0.50% | -1.60% | ||
| 06:00 | GBP | Retail Sales Y/Y Sep | -5.00% | -5.40% | ||
| 06:00 | GBP | Retail Sales ex-Fuel M/M Sep | -0.30% | -1.60% | ||
| 06:00 | GBP | Retail Sales ex-Fuel Y/Y Sep | -5% | |||
| 06:00 | GBP | Public Sector Net Borrowing (GBP) Sep | 12.3B | 11.1B | ||
| 12:30 | CAD | New Housing Price Index M/M Sep | 0.20% | 0.10% | ||
| 12:30 | CAD | Retail Sales M/M Aug | 0.20% | -2.50% | ||
| 12:30 | CAD | Retail Sales ex Autos M/M Aug | % | -3.10% | ||
| 14:00 | EUR | Eurozone Consumer Confidence Oct P | -30.3 | -28.8 |
Japan Suzuki: We are confronting speculators strictly
Japan stepped up verbal intervention as USD/JPY breaks above 150 level. Finance Minister Shunichi Suzuki warned today, "we are confronting speculators strictly."
Yet, when asked if Yen was under attack by speculators, Suzuki said, "it's inappropriate for me to comment on such a question under the current circumstances."
Regarding BoJ policy, he said, "I'm not in a position to comment anything concrete. We'll strive to maintain fiscal discipline with a major target of achieving primary budget surplus in fiscal 2025."
NZ exports rose 37.% yoy in Sep, imports rose 16% yoy
New Zealand good exports rose 37% yoy or NZD 1.6B to NZD 6B in September. Goods imports rose 16% yoy or NZD 1.1B to NZD 7.6B. Monthly trade balance reported a deficit of NZD -1.6B.
Exports to all major trading partners were up, including China (+31% yoy), Australia (+33% yoy), USA (+13% yoy), EU (+21% yoy), and Japan (+42% yoy).
Imports from all major trading partners rose, except EU, including China (+20% yoy), EU (-5.3% yoy), Australia (+11% yoy), USA (+26% yoy), and Japan (+14% yoy).