Sample Category Title
ETHUSD Rangebound after Decline Pauses
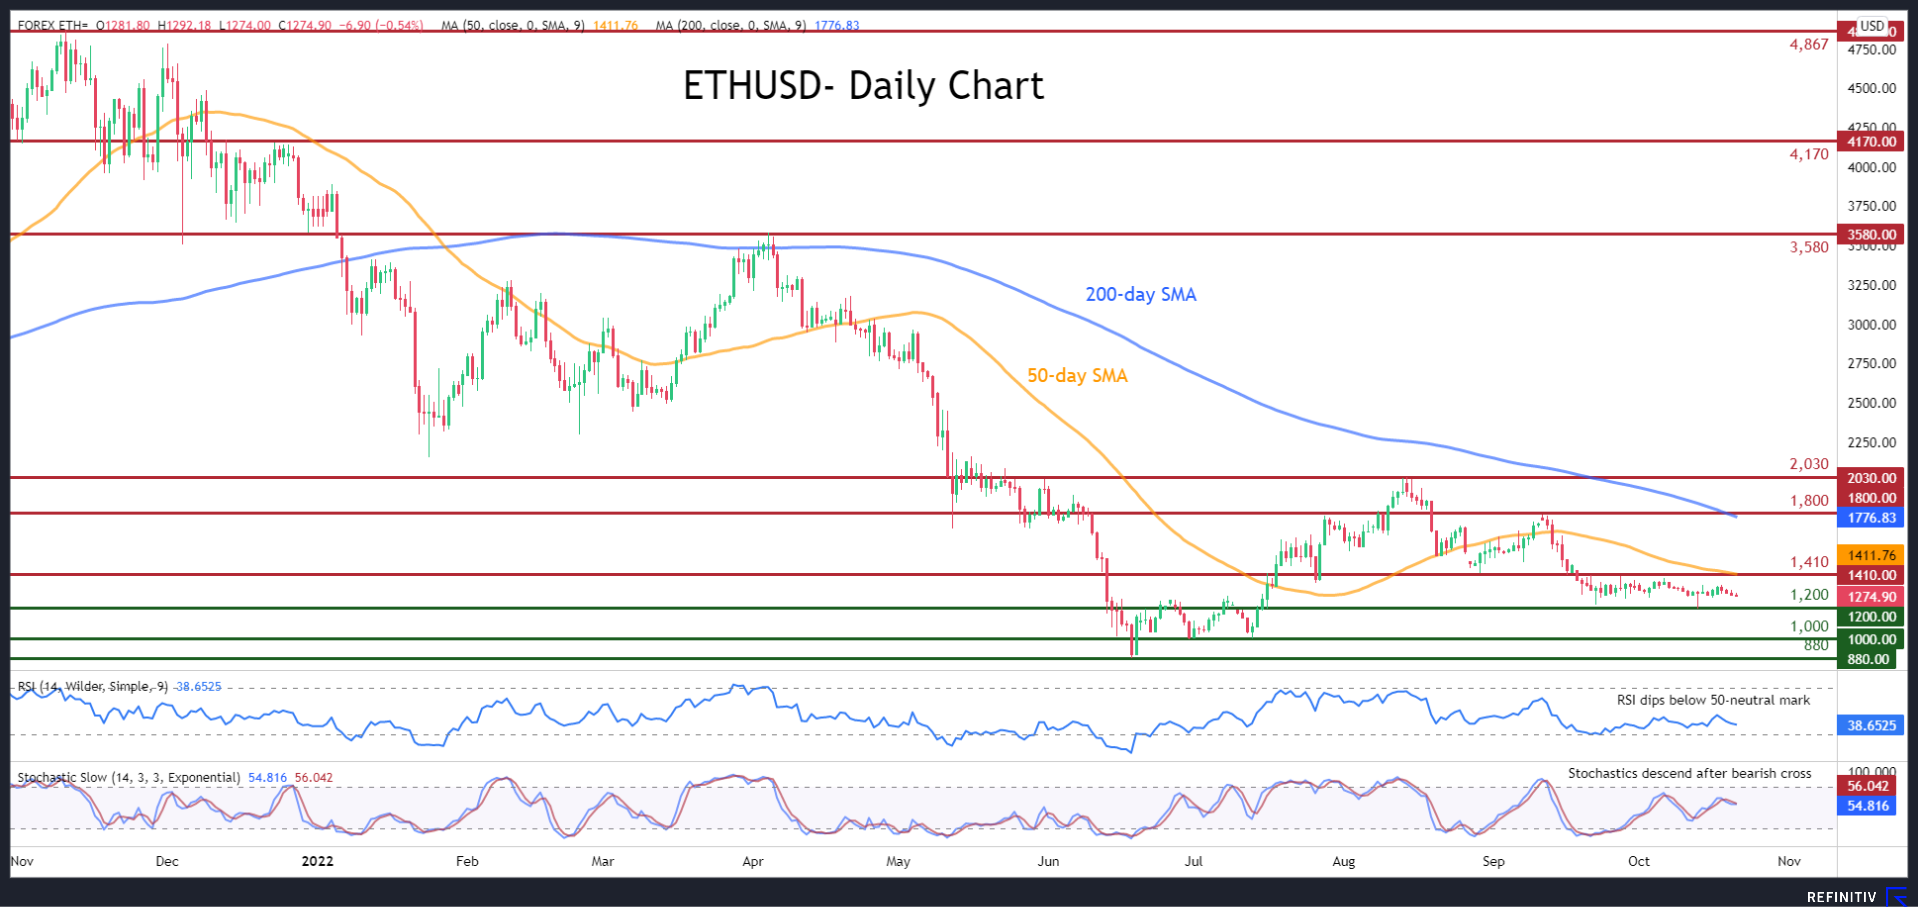
ETHUSD has been trending downwards since mid-August when the price failed to surpass the 2,030 mark. Even though Ethereum experienced an acceleration of its decline following the successful completion of the Merge in mid-September, it has been trading within a tight range during the past month.
The momentum indicators currently suggest that near-term risks remain tilted to the downside. Specifically, the RSI is declining beneath its 50-neutral mark, while the stochastic oscillator is descending after posting a bearish cross.
Should selling pressures intensify, the price could initially test the recent support of 1,200. Sliding beneath that floor, the spotlight may turn to the crucial 1,000 psychological mark. A decline below the latter might trigger a retreat towards the 2022 low of 880.
On the flipside, bullish actions could meet immediate resistance at 1,410, which is the upper boundary of the recent sideways pattern and overlaps with the 50-day simple moving average (SMA). Piercing this threshold, the price could ascend towards the recent peak of 1,800 before the spotlight turns to the trend reversal point of 2,030.
In brief, ETHUSD appears to be in a consolidation mode, waiting for developments that could provide fresh directional impetus. A break above or below its tight range is likely to be followed by a significant move in the same direction.
Natural Gas Futures Set for Big Weekly Loss; Outlook Threatened
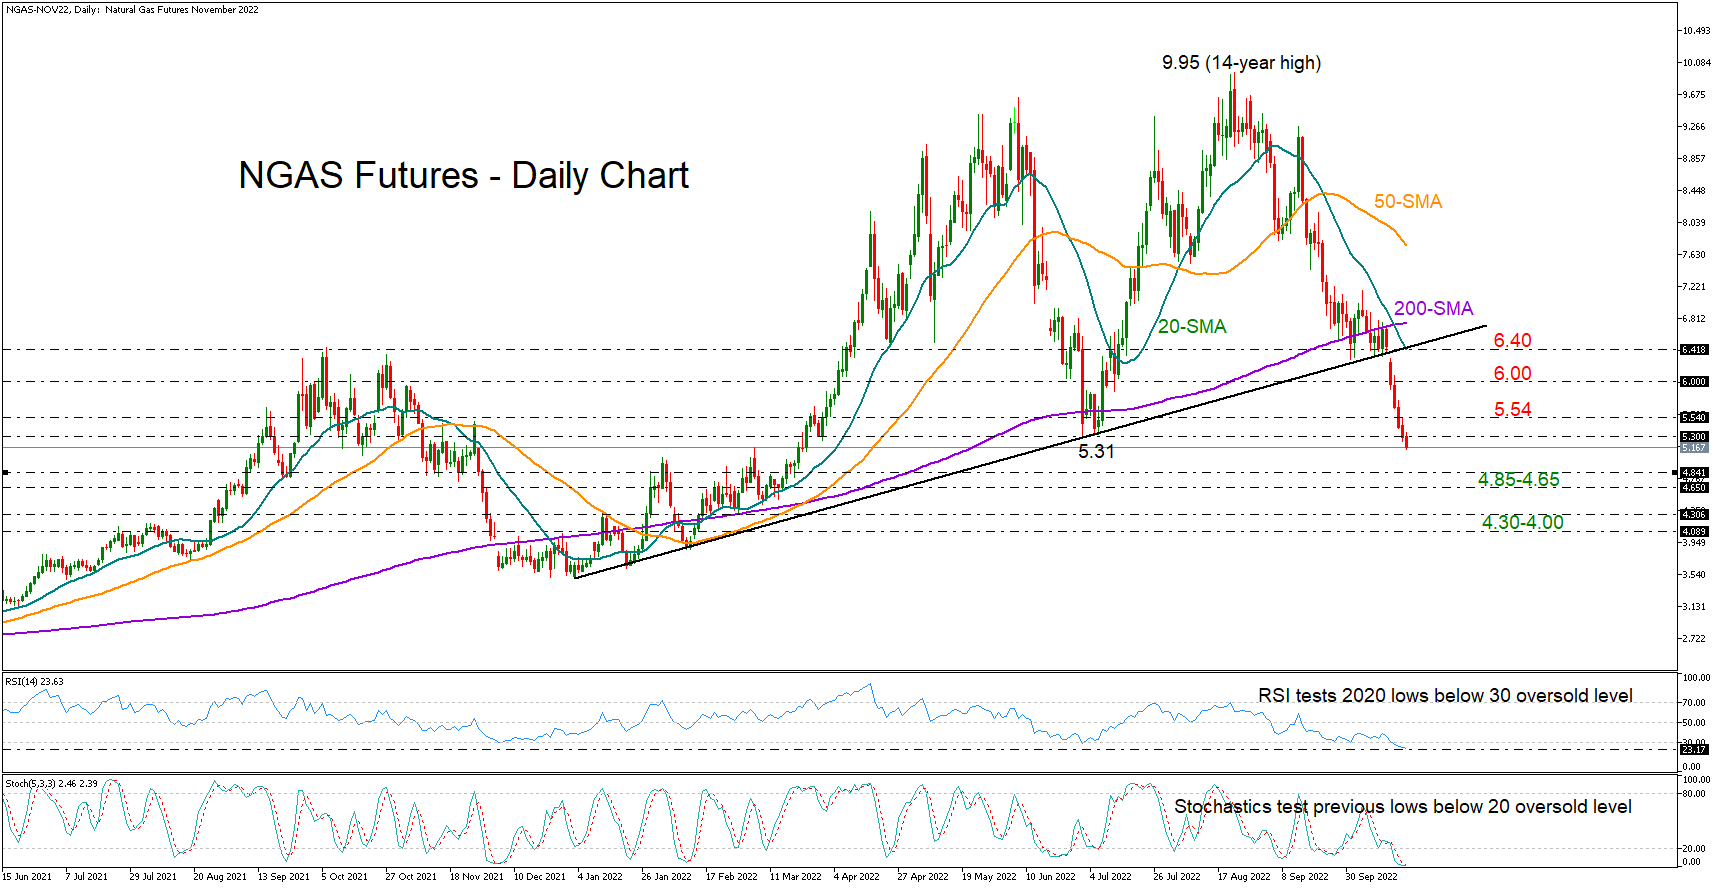
Natural gas futures (November delivery) are on track for their biggest weekly loss since June after the negative gap below the 2022 support trendline exacerbated the seven-week sell-off.
The bears are currently looking to downgrade the medium-term outlook to negative below June's floor of 5.31. If they succeed, all the attention will turn to the crucial 4.85-4.65 region, where the price peaked several times over the past decade. Should downside pressures persist, support could next occur within the 4.30-4.00 constraining area.
Alternatively, an upside reversal may initially retest Thursday's bar of 5.54 before heading for the 6.00 round level. Even higher, the 20-day simple moving average (SMA) and the broken ascending trendline at 6.40 could prevent any extensions towards the 200-day SMA at 6.75.
Note that the RSI has dipped in the oversold zone, testing its 2020 low, while the stochastics oscillator is also fluctuating near its previous lows in the oversold territory, both increasing the odds for a bullish correction or some stabilization.
In the big picture, a sharp rally is required above the 10 number to put the market back on the positive trajectory. Though, that almost looks impossible to happen in the near term as the price is currently trading far below that threshold.
In short, natural gas futures are exposed to an outlook deterioration in the short- and medium-term timeframes. If the price fails to set a foothold around 5.30, the downtrend could gain extra legs.
Canadian Dollar Dips ahead of Retail Sales
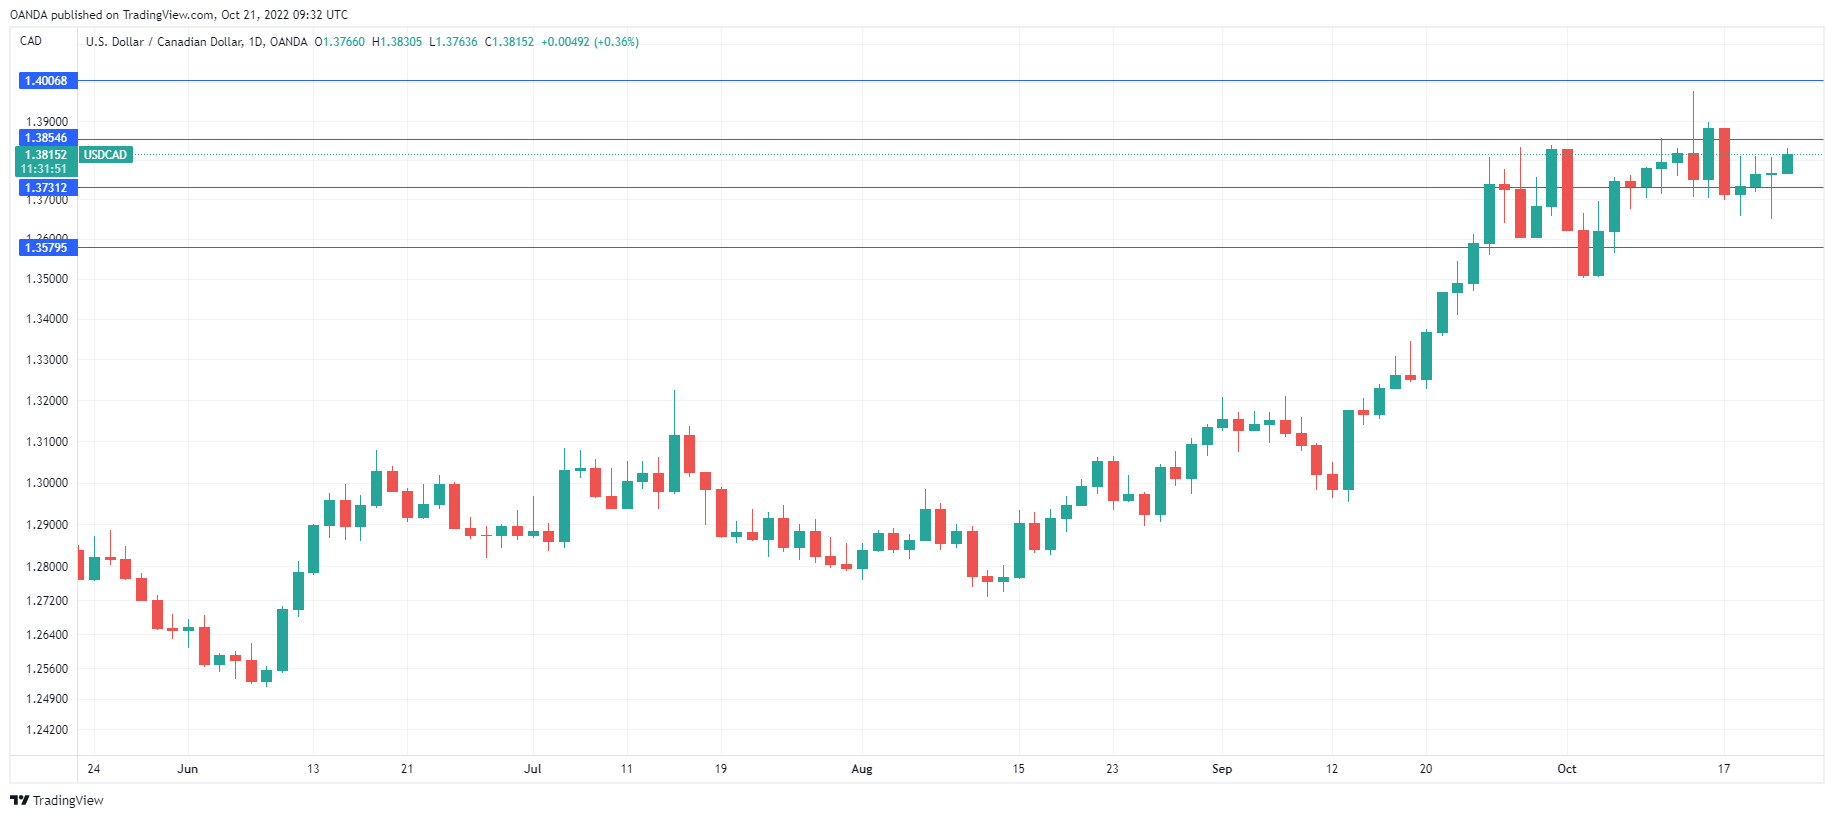
The Canadian dollar is in negative territory today, as the US dollar is higher against the major currencies. In the European session, USD/CAD is trading at 1.3827, up 0.45%.
Canada retail sales expected to improve
Canada releases retail sales for August later today. The July data was weak, with retail sales at -2.5% and core retail sales at -3.1%. The consensus for August stands at 0.4% for the headline reading and 0.2% for core retail sales. The July release was the first decline for both indicators in seven months, and another decline would raise concerns about the strength of consumer spending, a key driver of economic activity.
Inflation remains high and is still the Bank of Canada’s number one priority. Headline inflation ticked lower to 6.9% in September, down from 7.0% in August. Still, the reading was higher than the consensus of 6.8%. Core inflation remains even more stubborn and rose unexpectedly to 6.0%, up from 5.8% and above the forecast of 5.6%.
The inflation report takes on added significance as the Bank of Canada meets next week. Policy makers are virtually certain to raise rates, but by how much? The rise in core inflation was not a surprise for the central bank, as most BoC core inflation indicators are around 6% and have not shown any signs of peaking. The takeaway from this week’s inflation data bolsters the case for a 75 basis point hike, with inflation remaining stubbornly high.
The Fed has given no signals that it plans to ease up on rate hikes anytime soon, and this hawkish stance was reaffirmed by Philadelphia Federal Reserve President Patrick Harker on Thursday. Harker said that higher interest rates had failed to curb inflation, and the Fed would have to continue raising rates, which he said will be “well above” 4% by the end of the year. Currently, the benchmark is at 3.25%, with the Fed holding its next meeting on November 2nd.
USD/CAD Technical
- 1.3854 and 1.4005 are the next resistance lines
- There is support at 1.3731 and 1.3580
Aussie Falls on Fed’s Harker’s Comments
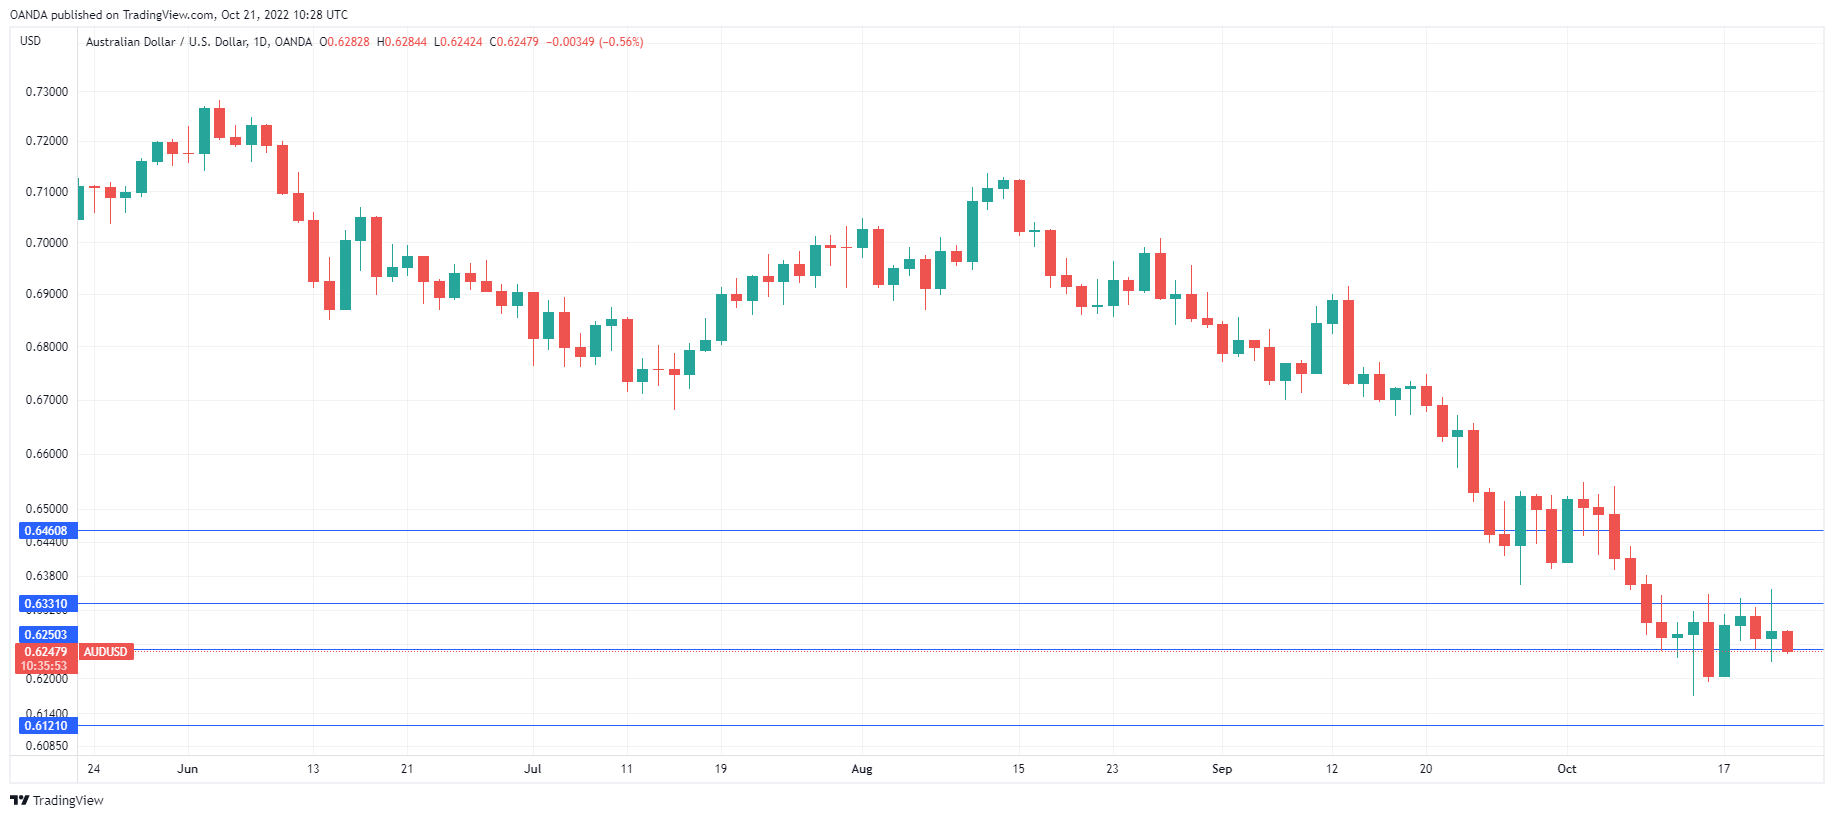
AUD/USD has dropped lower today and is trading at 0.6252, down 0.43%.
Fed expected to remain aggressive
The Federal Reserve has signalled that it plans to remain hawkish, as the relentless battle with spiralling inflation continues. This aggressive stance was reaffirmed by Philadelphia Federal Reserve President Patrick Harker on Thursday. Harker stated that higher interest rates had failed to curb inflation, and the Fed would have to continue raising rates “for a while”. He added that rates would be “well above” 4% by the end of the year. Currently, the benchmark is at 3.25%, with the Fed holding its next meeting on November 2nd.
The markets have received the Fed’s message loud and clear, and have priced in a 0.75% hike at the November 2nd meeting and in December. The Fed has already raised rates by 0.75% at three straight meetings, and the steep rate-tightening cycle is set to continue, which is good news for the strong US dollar.
Australia released September’s employment report on Thursday, which indicated that the labour market remains robust. The economy added 13,300 full-time jobs, with a decline of 12,400 part-time jobs. This follows a superb gain of 55,000 jobs in August. The strong labour market has allowed the Reserve Bank of Australia to hike rates in order to combat inflation, but the central bank has eased up on tightening.
The RBA surprised the markets with a small rate hike of 0.25% at its October meeting, which was smaller than expected. At the meeting, the RBA noted that inflation remains too high, but the modest rate hike fits in with that the central bank’s projection that inflation will peak in early 2023. The RBA meets on November 1st, a few days after the September inflation report, which will likely be a major factor in the RBA’s rate decision. The markets have priced in 0.25% increases at the November and December meetings.
AUD/USD Technical
- AUD/USD continues to test support at 0.6250. The next support level is 0.6121
- There is resistance at 0.6331 and 0.6460
GBPJPY Consolidates After Hitting 6½-Year High
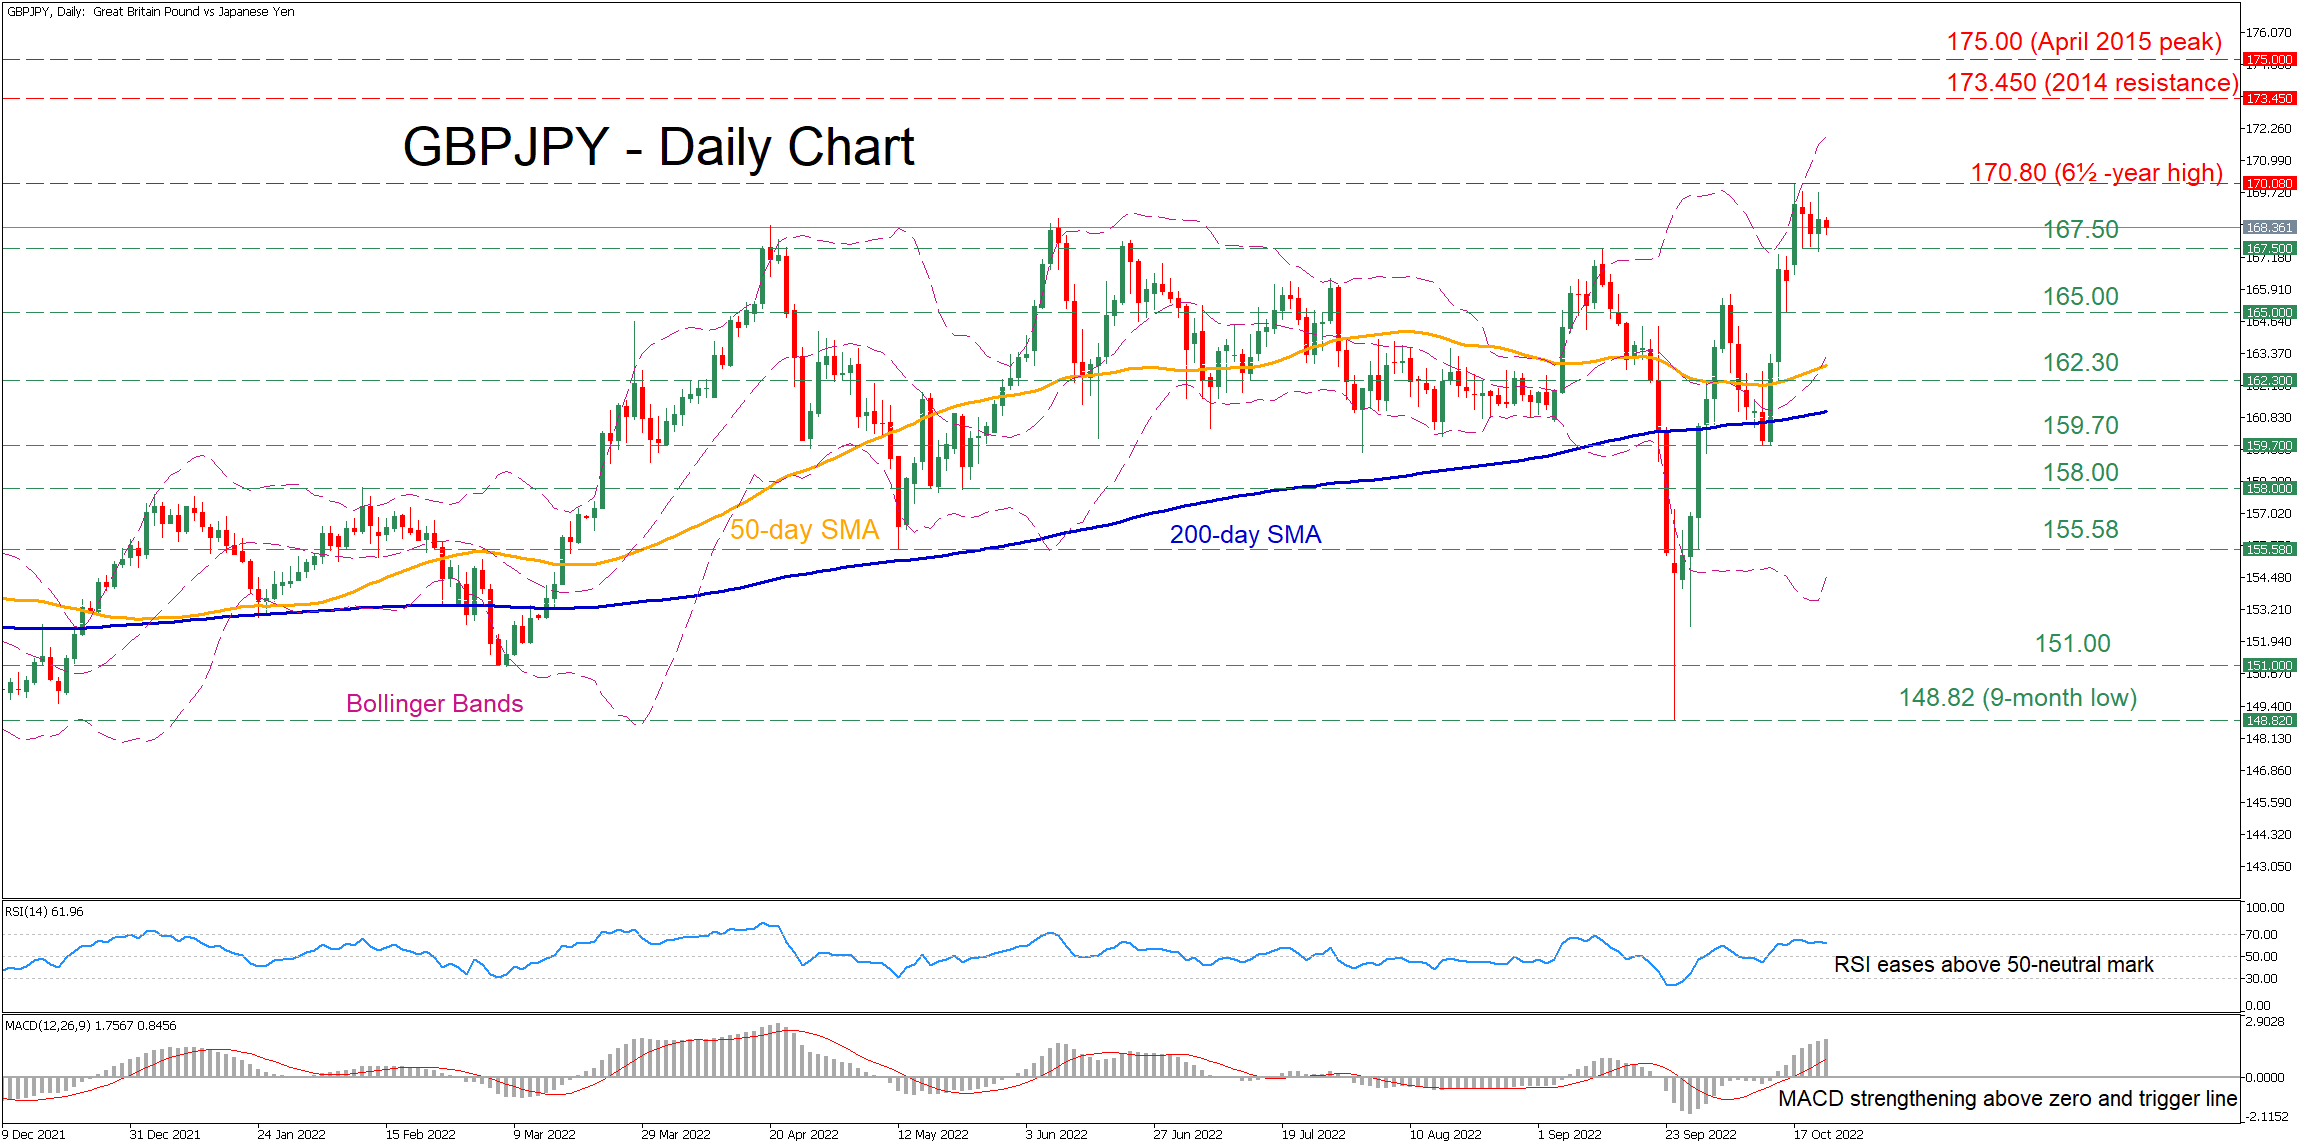
GBPJPY has experienced some large moves in the short term, with the price losing around 10% before recovering back and forming a fresh 6½-year high of 170.80. Nevertheless, the pair has been trading sideways in the last few daily sessions, waiting for developments that could provide fresh directional impetus.
The short-term oscillators currently suggest that bullish forces remain in control. Specifically, the RSI is hovering above its 50-neutral mark, while the MACD histogram is strengthening above its red signal line in the positive territory.
Should the buying interest intensify, the pair could challenge the 6½-year peak of 170.80. Conquering this barricade, the price would edge higher to form fresh multi-year highs, where the crucial 2014 resistance region of 173.50 could curb further advances. Even higher, the spotlight may turn to the April 2015 peak of 175.00.
To the downside, if the positive momentum wanes and the price drifts lower, the recent support of 167.50 might act as the first line of defence. Sliding beneath that floor, the bears could aim for 165.00 before the 162.30 hurdle comes under examination. A break below the latter may set the stage for the October low of 159.70.
Overall, GBPJPY has been trading within a tight range after its latest advance paused, but near-term risks remain tilted to the upside. Therefore, a close above its latest multi-year peak is needed to verify the continuation of the uptrend.
USDCAD Trapped Below 1.3800; Uptrend Intact
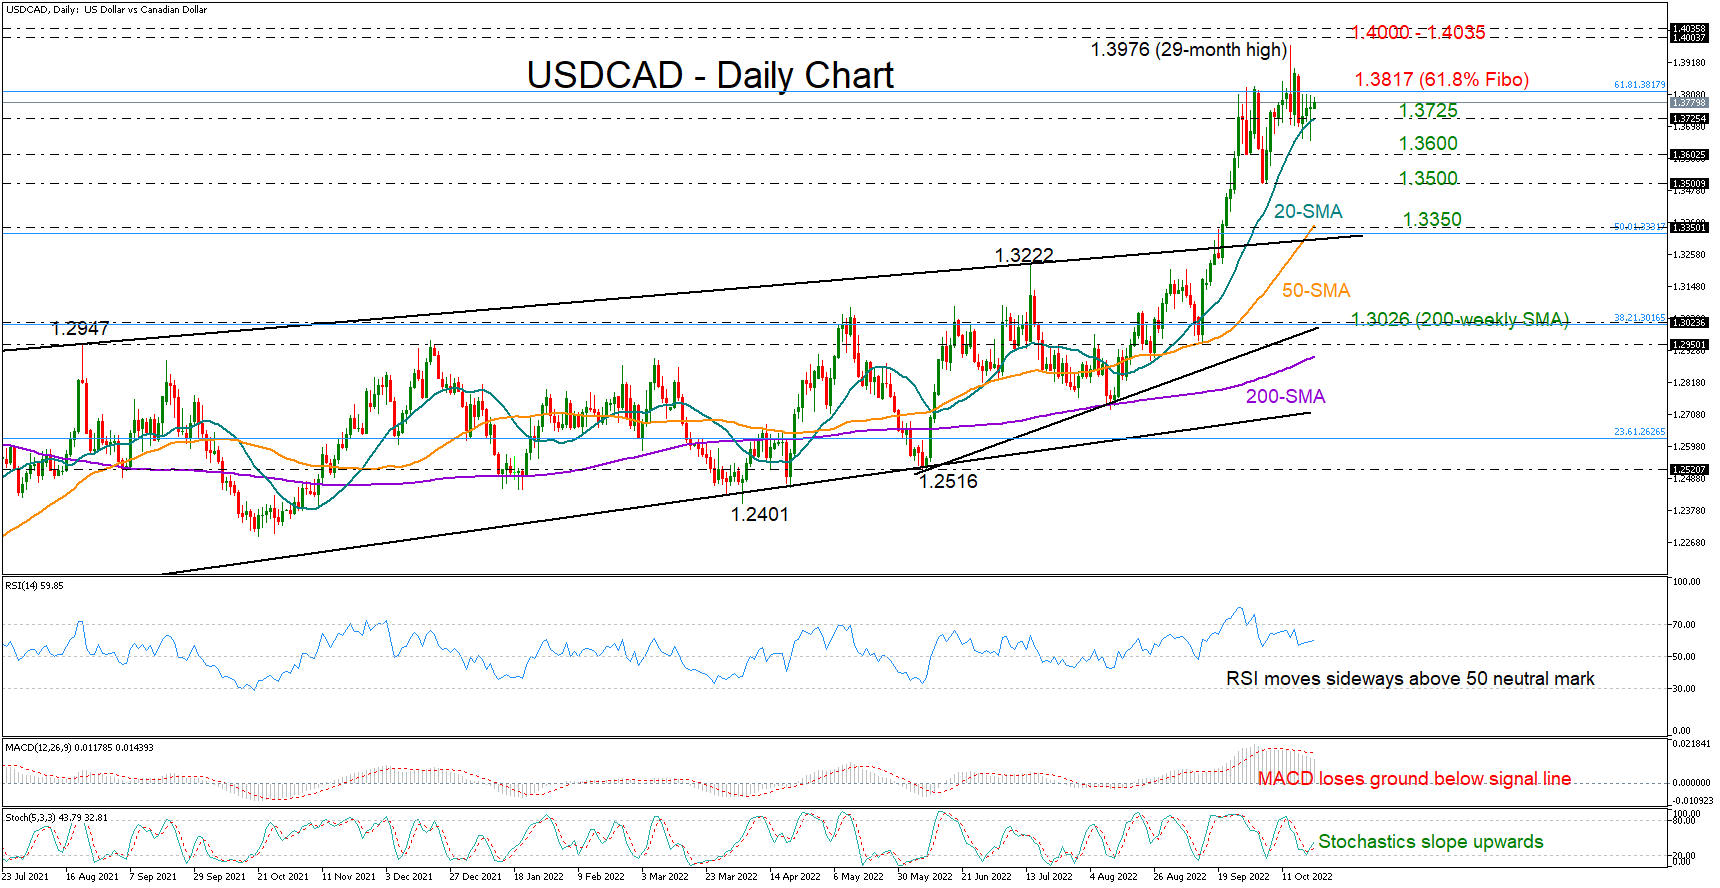
USDCAD has partially recovered Monday’s pullback as the 1.3800 level proved hard to overcome during the week, limiting bullish moves.
Although the RSI and the MACD reflect some caution as the former is lacking direction in the bullish area, and the latter keeps decelerating below its red signal line, the positive trend is still intact above the 20-day simple moving average (SMA).
If the bulls manage to pierce through the 1.3800 level, where the 61.8% Fibonacci retracement of the 1.4667-1.2006 downtrend is located, the price could accelerate towards the 1.4000-1.4035 region taken from March-May 2020. Breaching that wall too, the next stop could be the 1.4140 barrier.
In the bearish scenario, where the price closes below the 20-day SMA at 1.3725, immediate support could develop around the 1.3600 level. Even lower, the 1.3500 psychological mark may attempt to block any declines towards the 50-day SMA and the 50% Fibonacci of 1.3330.
In summary, the focus is on the 1.3800 round level, a break of which is expected to reduce negative risks, triggering the next leg higher in USDCAD.
Yen Steady as Inflation Hits 31-Year High
Core CPI hits 3.0%
Inflation in Japan continues to rise. Core CPI rose to 3.0% YoY in September, its highest level since August 1991. This was up from 2.8% in August and marks the sixth consecutive month that the indicator has been above the Bank of Japan’s target of 2 per cent. The 3.0% figure matched the consensus, and the response of the Japanese yen has been muted.
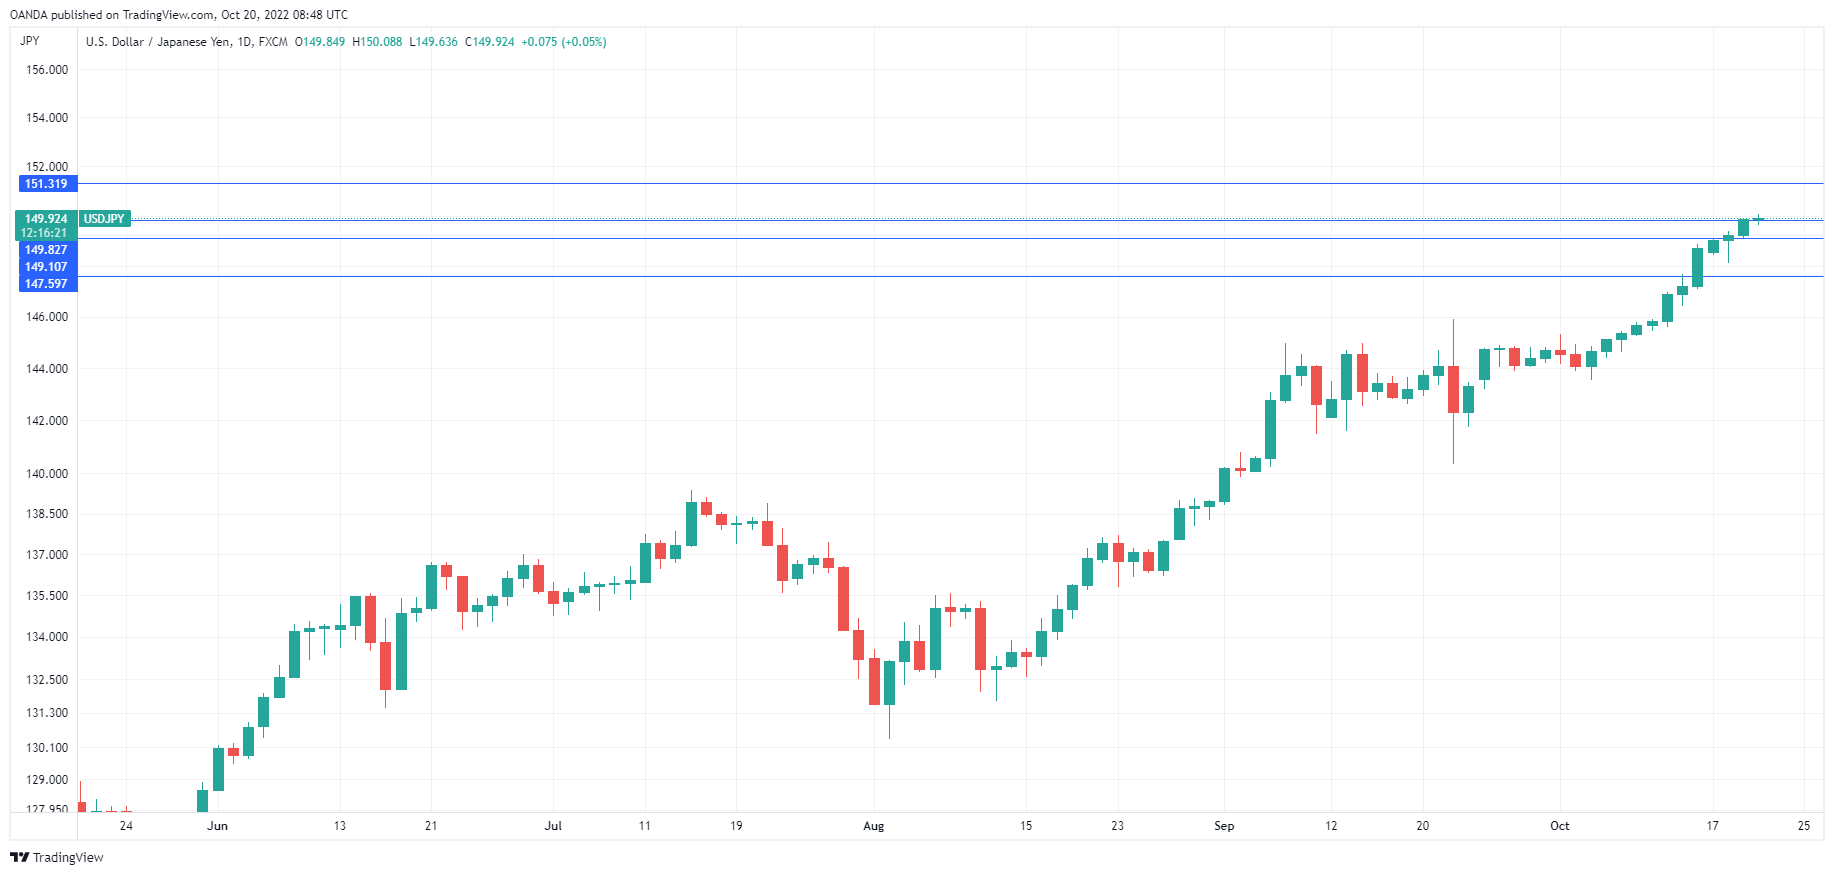
The yen breached the symbolic 150 level on Thursday for the first time since August 1990, and barring another intervention from the Ministry of Finance (MOF), the downturn will likely continue. Finance Minister Shunichi said on Thursday that “excessive volatility in the currency markets must not be tolerated” and the government “remains committed to taking firm action against these moves.” This has all been heard before and these warnings are increasingly falling on deaf ears. The MOF did back up its rhetoric with action last month and intervened when the yen breached 145. The bold move did little to slow down the currency’s slide, however, and here we are at the 150 level.
The Bank of Japan isn’t showing much interest in the yen’s fall, as it is committed to an ultra-loose policy in order to stimulate the weak economy. Governor Kuroda said on Wednesday that the yen’s rapid fall was “undesirable”, only to step in with an emergency bond-buying package the very next day in order to cap yields on Japanese government bonds. With moves like these, it’s hard to take Kuroda’s remarks about the yen seriously. Kuroda has insisted that the Bank will not alter its monetary policy until it is convinced that inflation is not transitory, and as we saw with other major central banks, that could take a long, long time.
USD/JPY Technical
- USD/JPY is testing monthly resistance at 150.27. Next, there is resistance at 1.5132
- There is support at 149.27 and 147.58
Nasdaq 100 Seeks Support
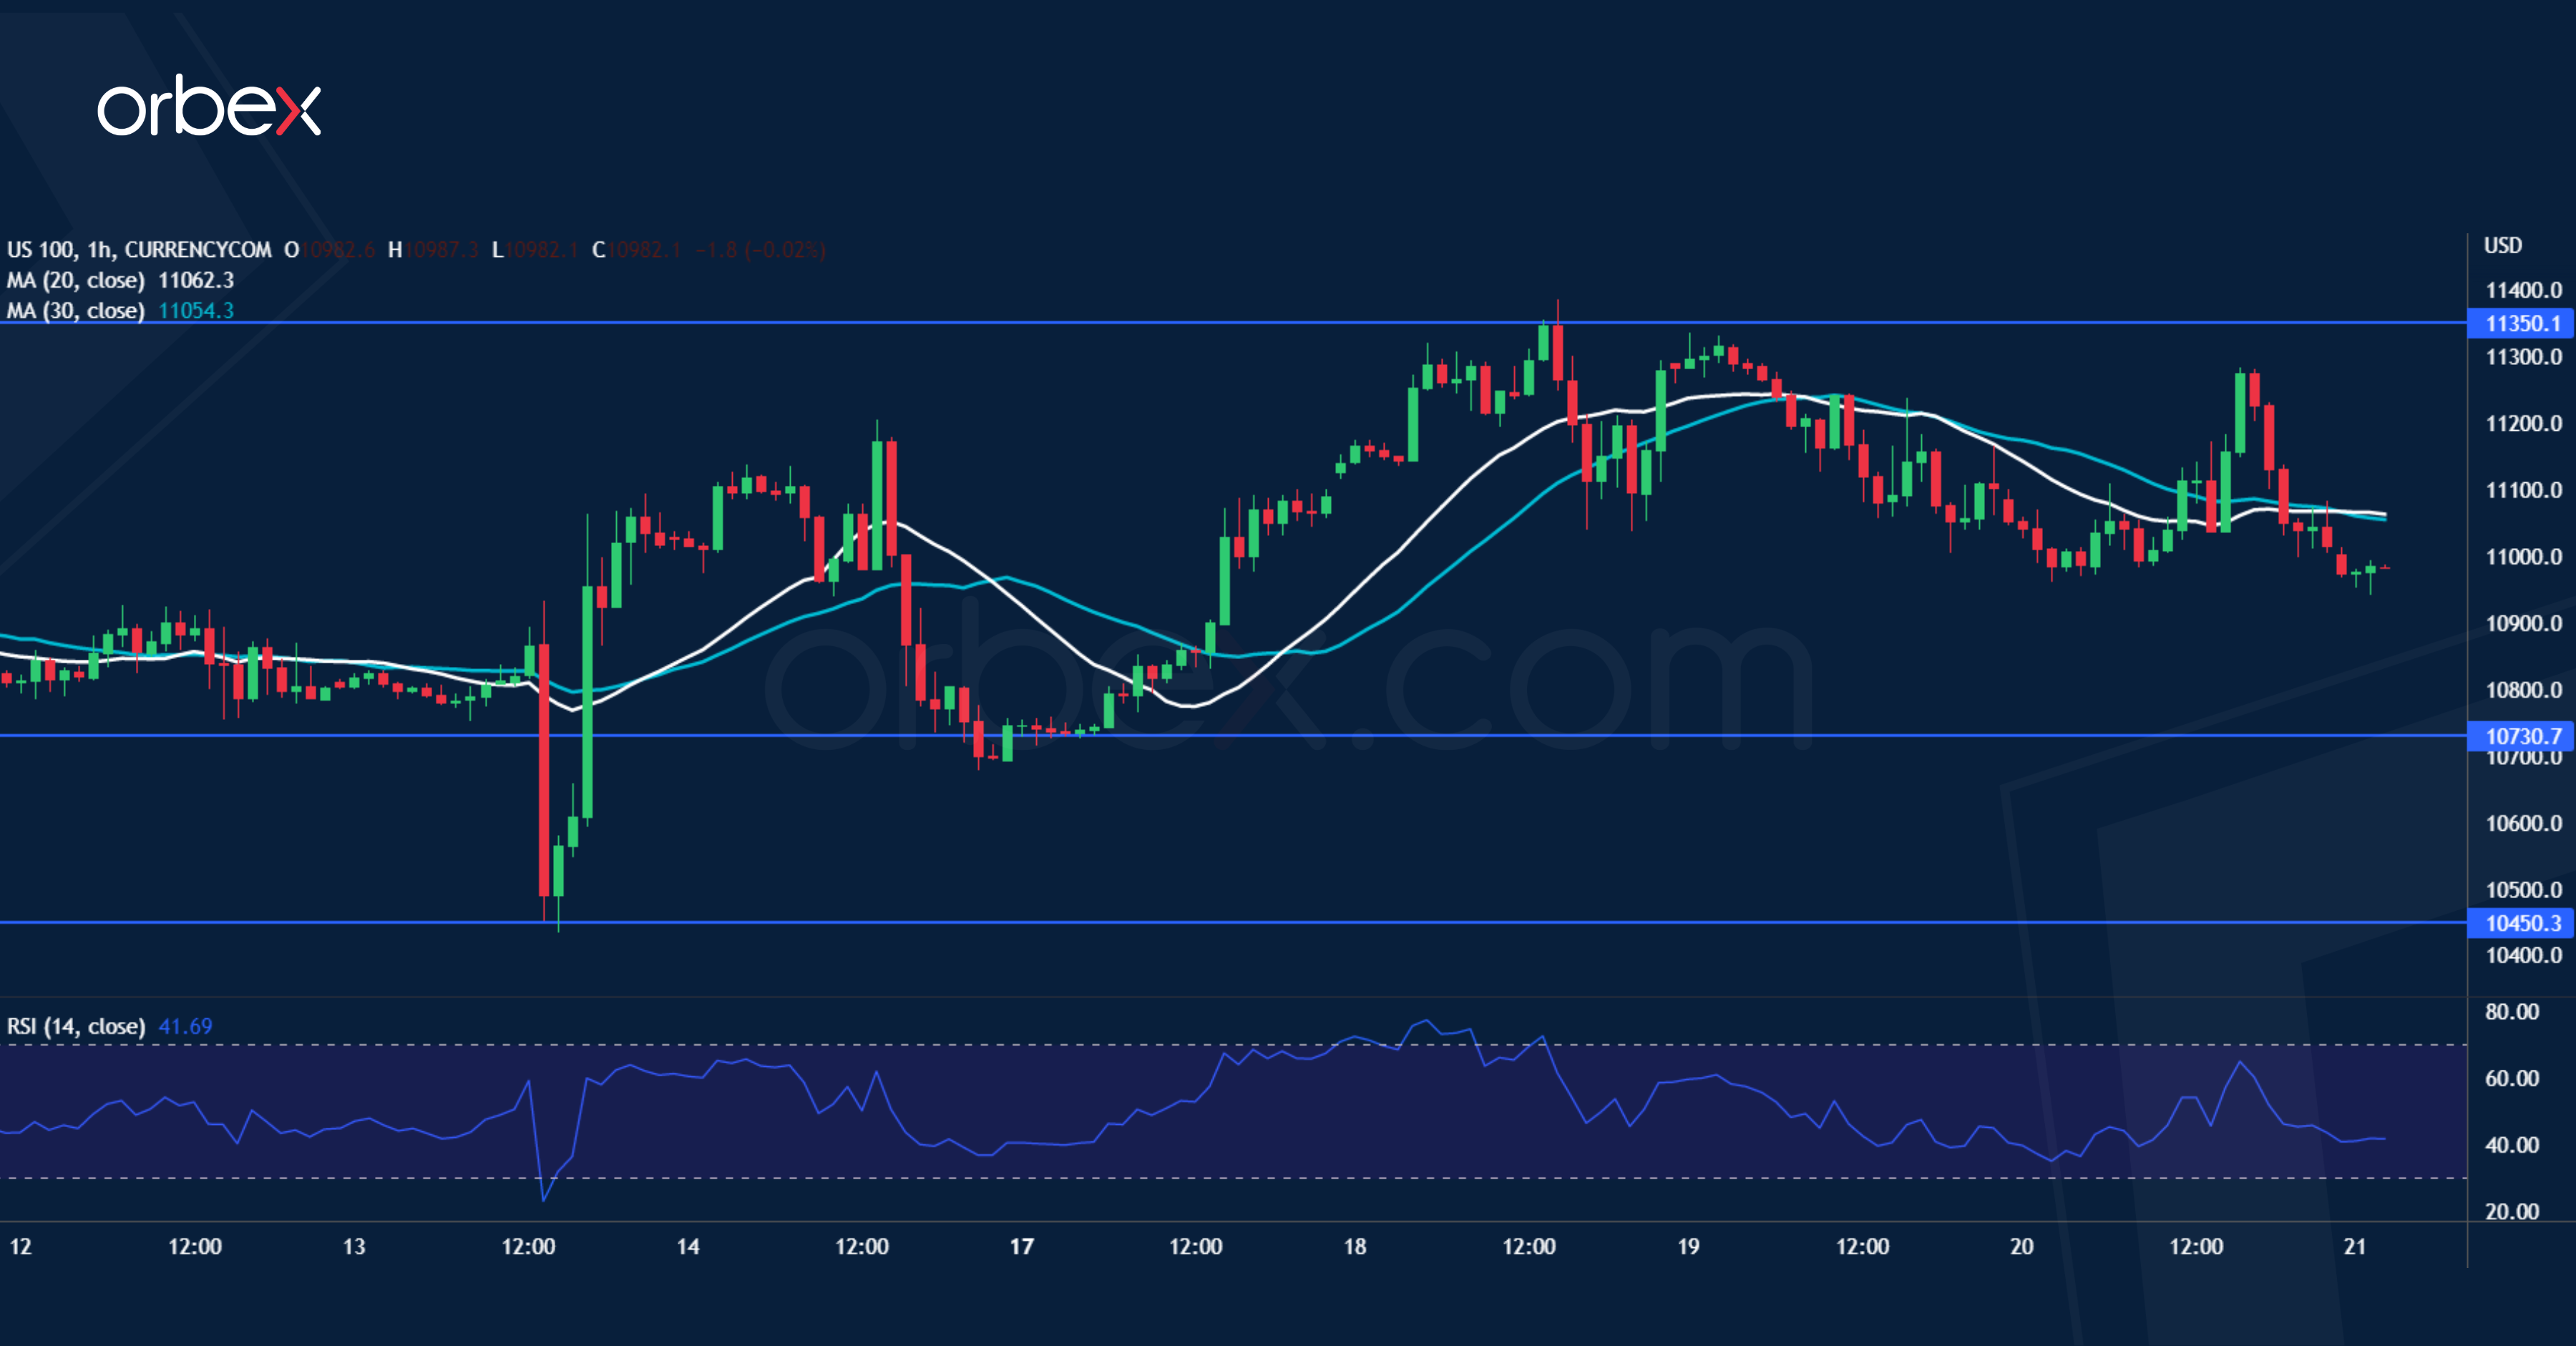
The Nasdaq 100 softened after Fed officials said the central bank would keep raising rates. The price action is struggling to claw back its previous losses. The latest bounce has met stiff selling pressure in the supply zone around 11350 next to the 30-day moving average. 10730 is an important support to keep the current rebounce relevant. 11650 would be the target should the bulls manage to hold onto their gains, putting an extended recovery within reach. However, a bearish breakout could trigger a sell-off below 10450.
EUR/GBP Tests Resistance
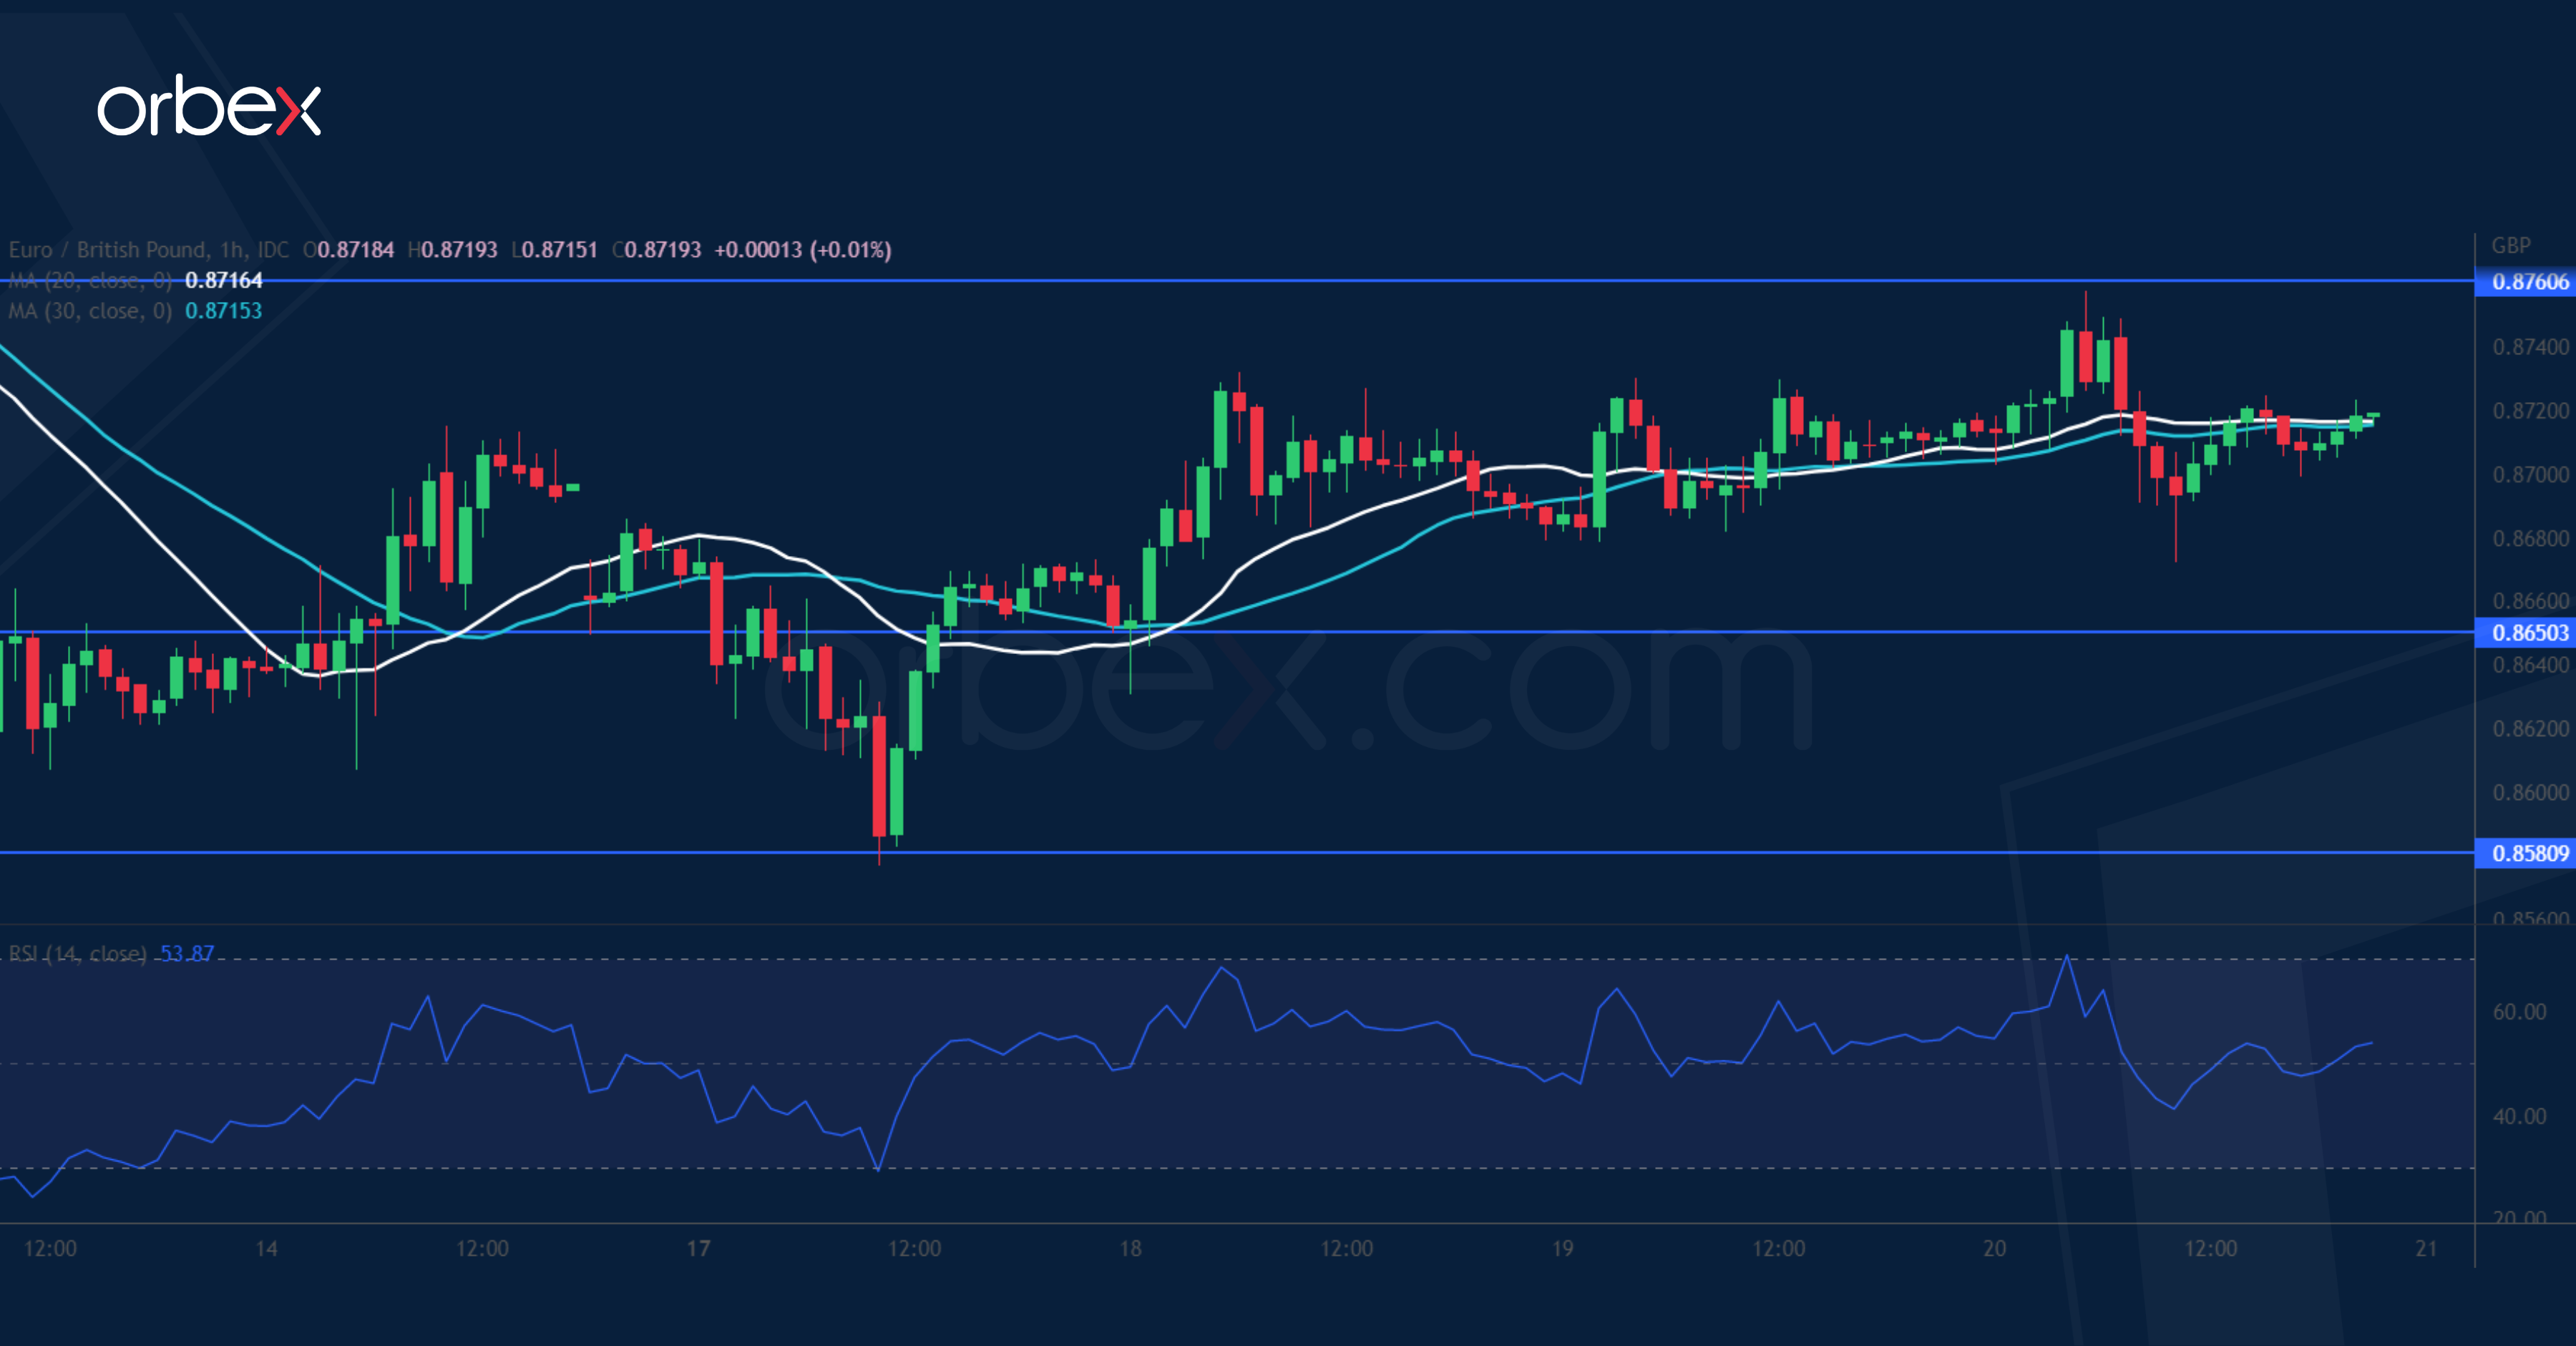
The pound whipsawed after Truss announced her resignation as Britain’s prime minister. The euro has found support at the base (0.8580) of a bullish breakout in early September. The support-turned-resistance at 0.8760 is the first obstacle and its breach would lift offers to 0.8850, a major resistance before a full-blown recovery could materialise. The RSI’s overbought condition has limited the buying pressure, and 0.8650 is a fresh zone for accumulation. Further down, a fall below 0.8580 would invalidate the month-long rally.
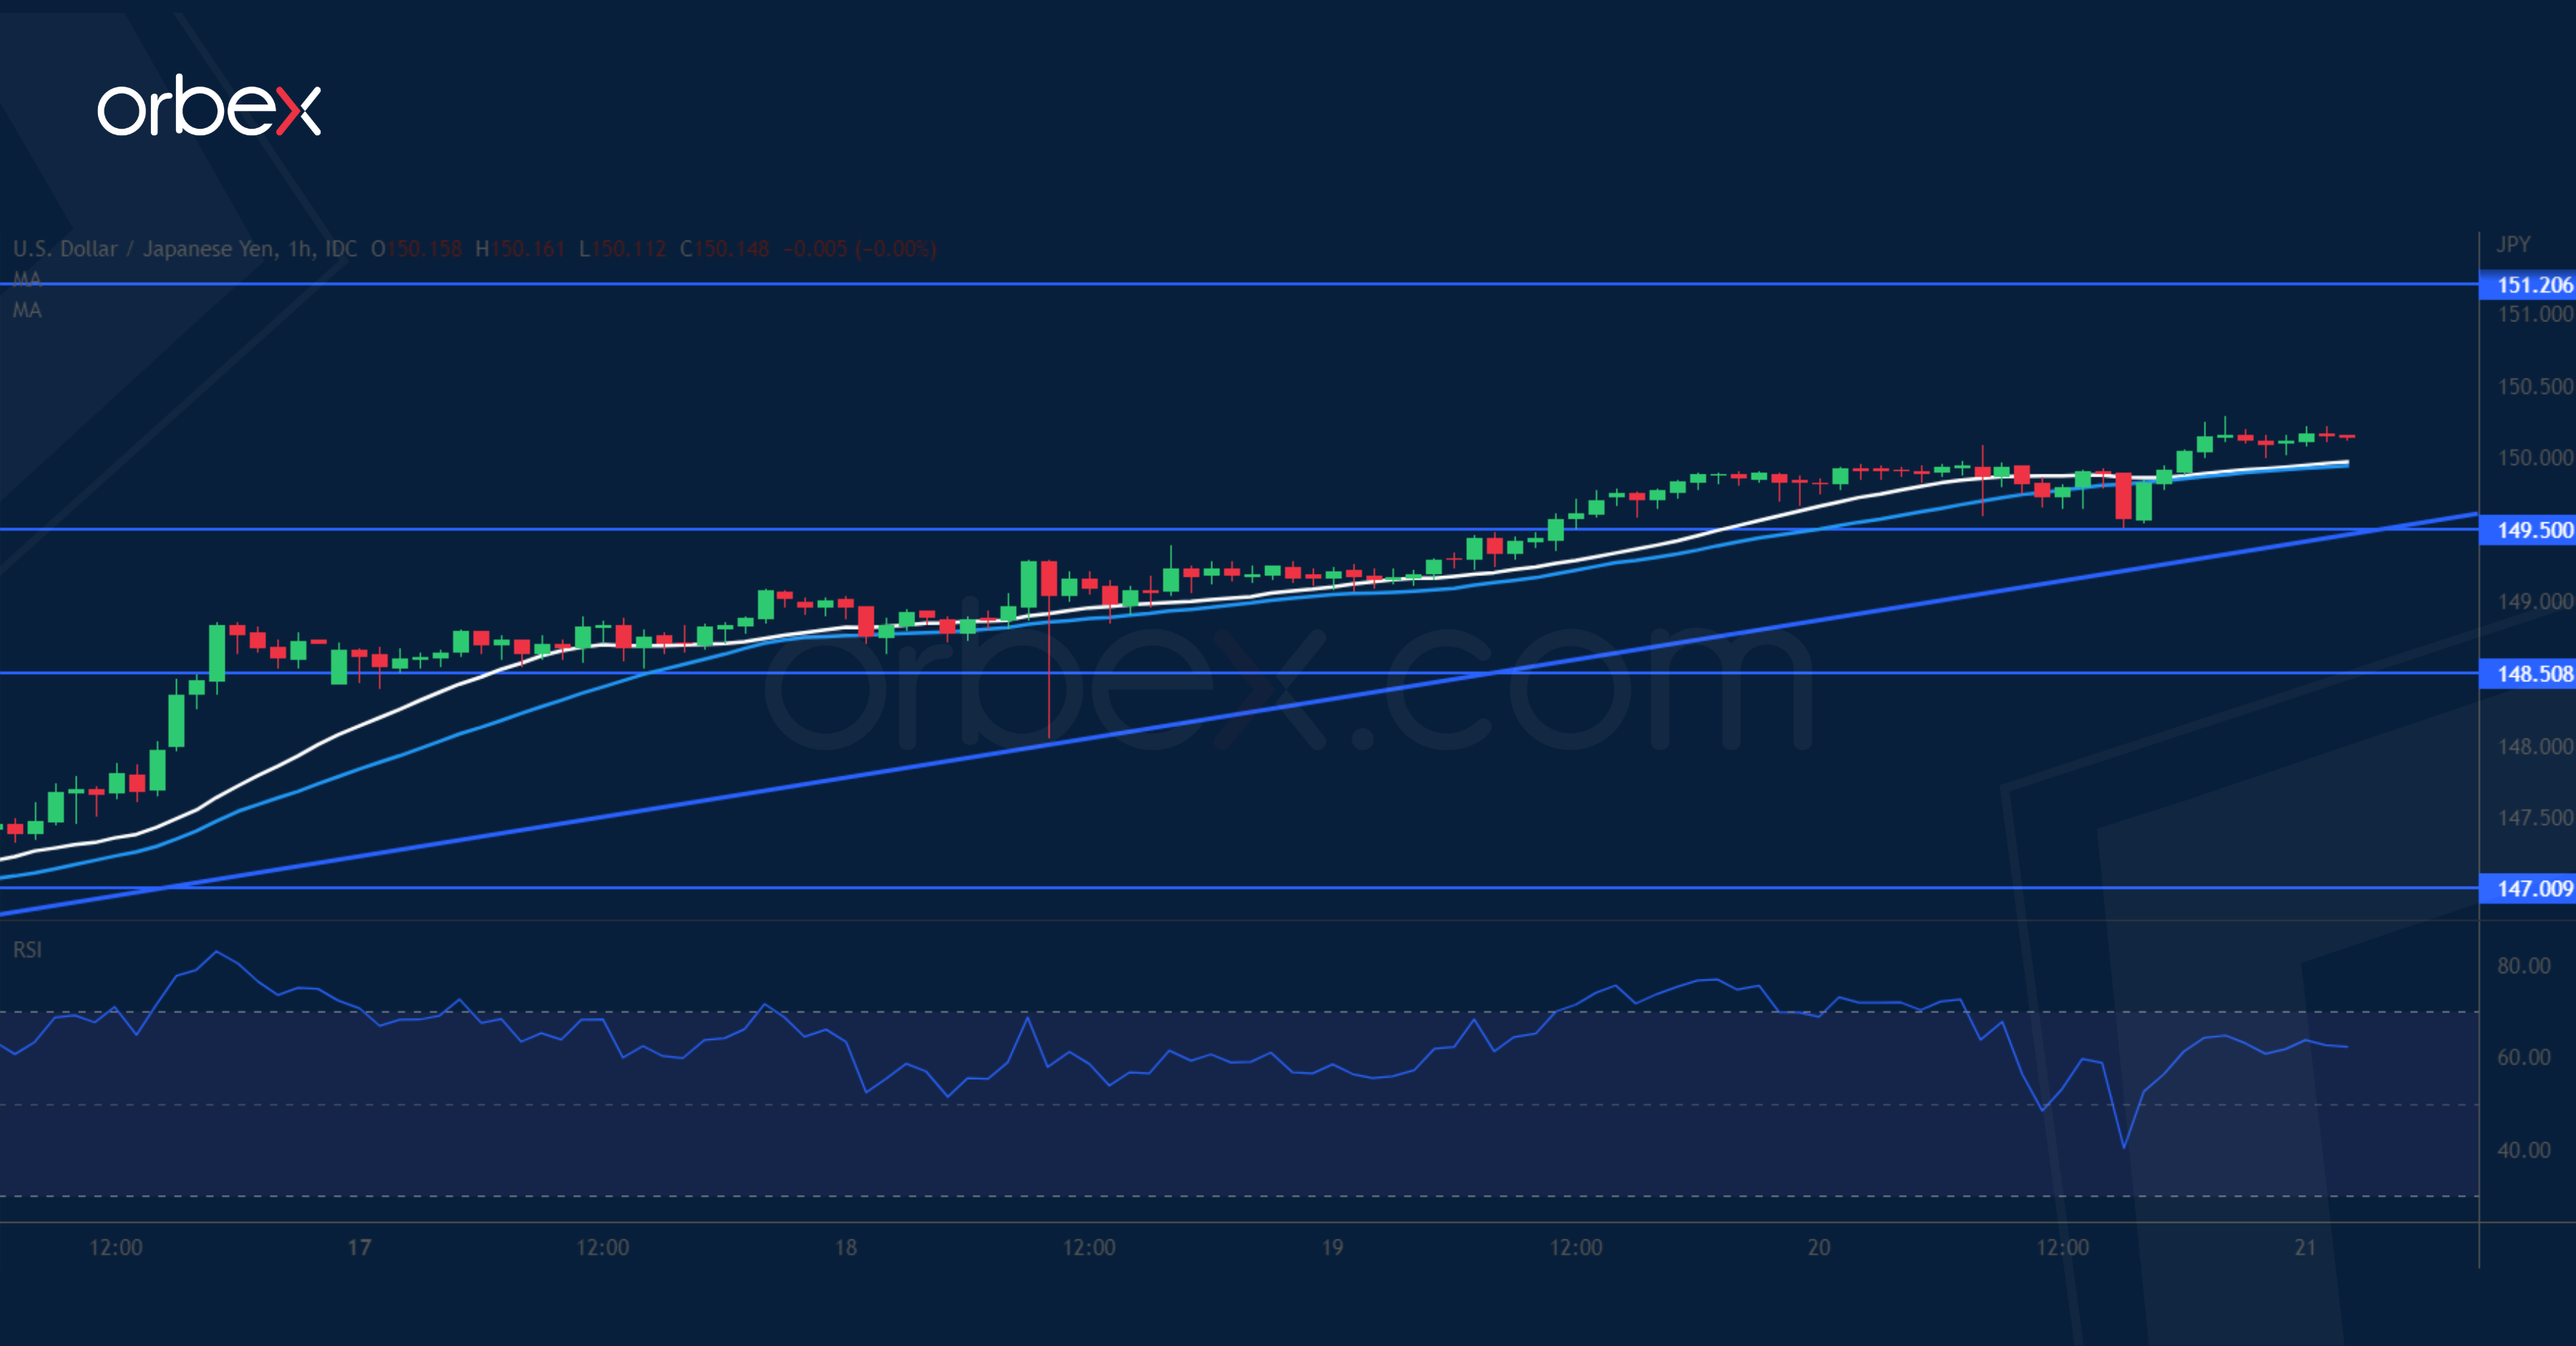
USD/JPY Grinds Rising Trendline
The Japanese yen slips over rumours of an intervention once again by the authorities. The pair has been climbing along a rising trendline after it broke above the previous high at 145.80. As the price clears the psychological level of 150.00, the bullish continuation could carry the greenback to August 1990’s high at 151.20. Though the overextension may have prompted some buyers to take chips off the table. 149.50 on the trendline is the first level to gauge buyers’ interest in case of a pullback.