

Sample Category Title
UK Data Unlikely to Offer Much Relief to Sterling Amid Economic Storm
The latest employment numbers out of the UK will hit the markets on Tuesday and Wednesday will see the release of the monthly GDP readings. Both are due at 06:00 GMT. Following the growing political and economic uncertainty of recent weeks, the question investors are asking is no longer about whether or not there will be a recession, but rather, how deep will it be. Yet, with so much gloom already priced in, can the pound enjoy a small boost if the data actually impress?
Truss knocks investors’ confidence in UK economy
It's been a turbulent few weeks for the British economy as new Prime Minister Liz Truss has had a terrible start to her premiership. Her energy package was overshadowed by the Queen’s death and her chancellor’s mini budget sparked a global market panic instead of shoring up investor confidence as hoped. But even before those events, the pound had been on shaky ground as the months of political turmoil leading up to Boris Johnson’s ousting had investors worried about who was steering the ship whilst the cost-of-living crisis was unfolding.
However, even after some calm was restored and the government had to do a rethink on some of the policies it announced in the budget, there is a lot of angst about the direction Truss is taking the country. Reports suggest that some of the savings Chancellor Kwasi Kwarteng wants to achieve to help pay for the controversial big tax cuts are by raising benefits below the rate of inflation. This would mean a cut in real terms for those relying on benefits as their main source of income and is something that is causing divisions within the Conservative party.
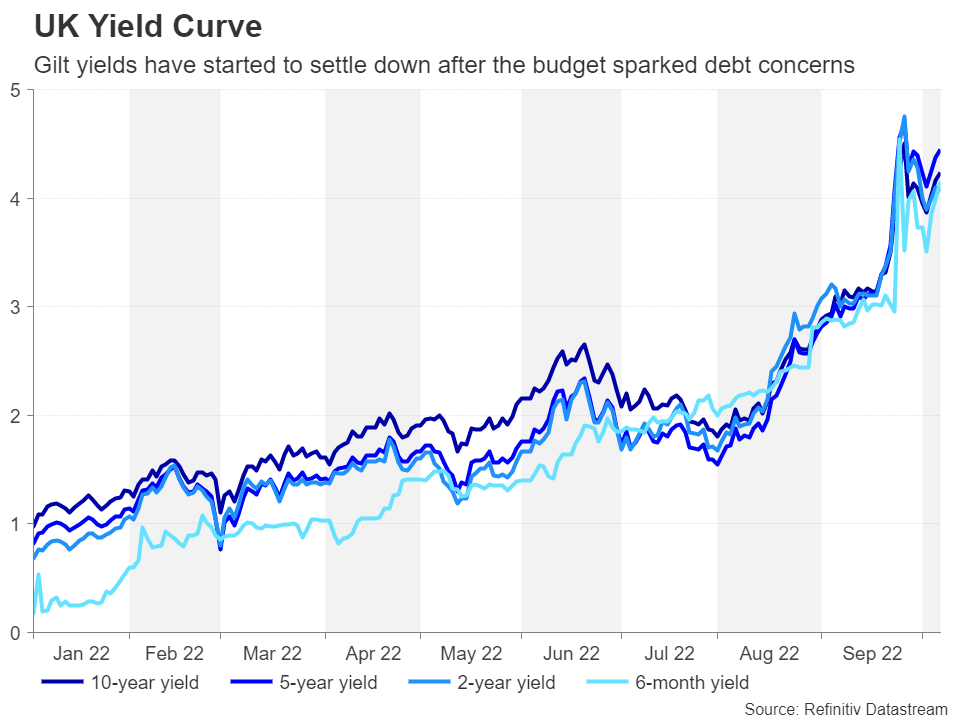
Truss’s decision to block a nationwide campaign on energy saving that was intended to reduce demand ahead of the winter has also raised eyebrows about her judgement. With Kwarteng not expected to reveal more details about how the government will manage the UK’s soaring national debt until October 31 and the Federal Reserve in America maintaining its ultra-hawkish policy stance, there’s not a lot of love going in the pound’s direction lately.
On the verge of a recession
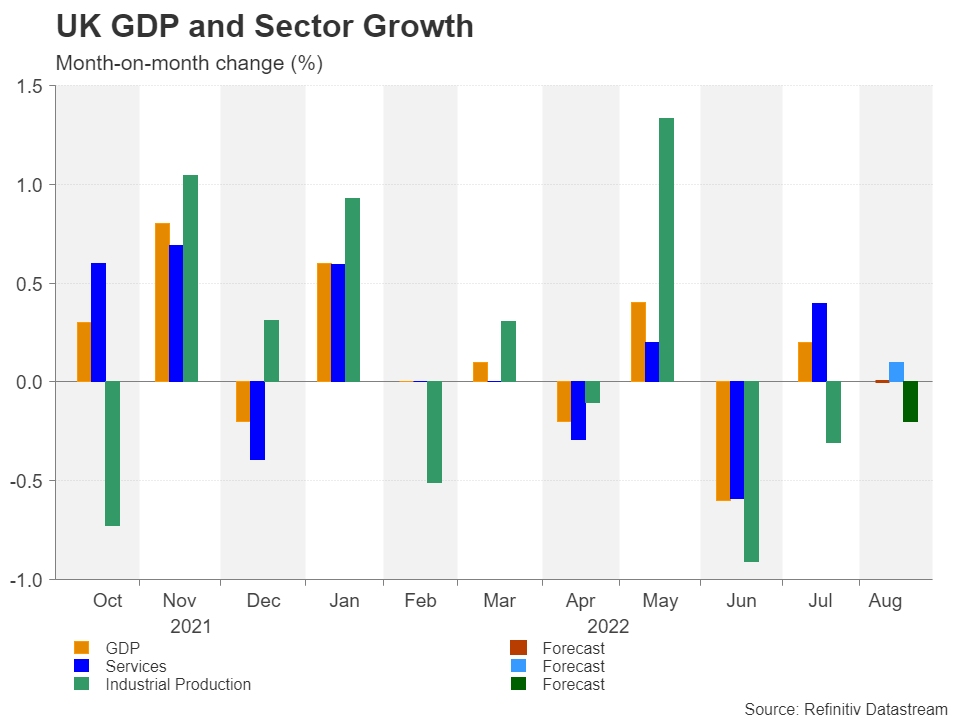
Having said all that, the recent economic data haven’t been as bad as some of the headlines would imply. Most notably, the GDP estimate for the second quarter was revised up from the initial reading of -0.1% q/q to +0.2%, easing fears that the economy was already in recession. However, there’s still a high probability that the UK will enter a recession in the fourth quarter as the economy is expected to contract in the current quarter. After expanding by 0.2% m/m in July, GDP is forecast to have been flat in August, Wednesday’s data will likely show. The September figure is almost certain to be worse, however, due to the country coming to a standstill for the Queen’s funeral.
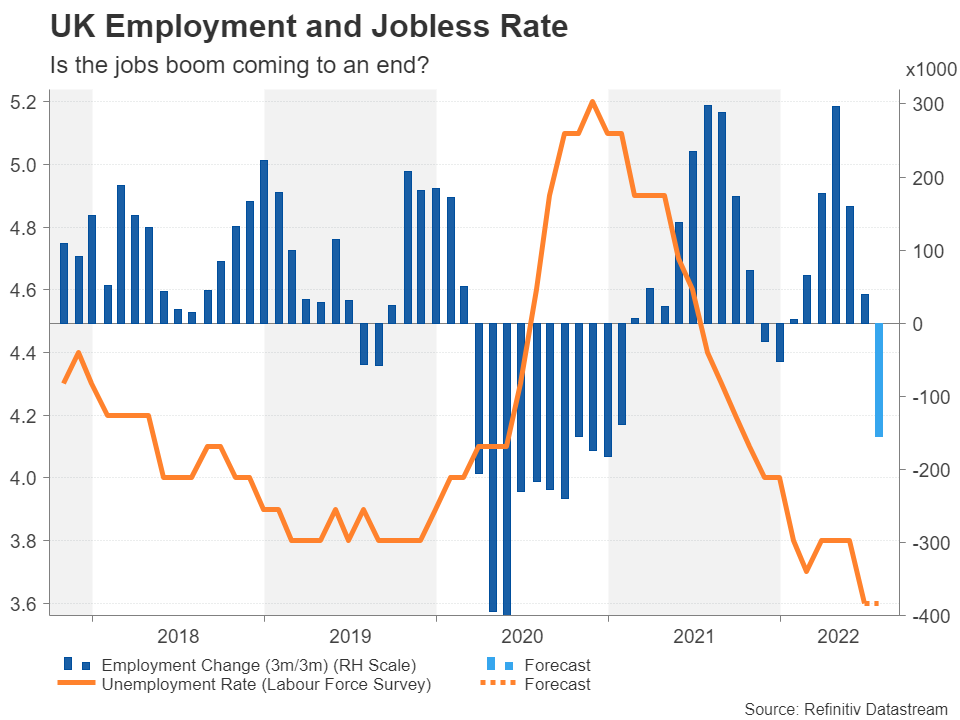
One bright spot has been the tight labour market, but even that could be losing steam as there are some signs that hiring has slowed in recent weeks. Employment is projected to have fallen by a whopping 155k in the three months to August in Tuesday’s report, following a gain of 40k in the prior three months. The unemployment rate, though, is expected to stay unchanged at 3.6%. Interestingly, growth in average weekly earnings is forecast to accelerate from 5.5% to 5.9% y/y, underscoring the fact that some of the slowdown in hiring could be attributed to the lack of available workers.
Pound is under pressure again
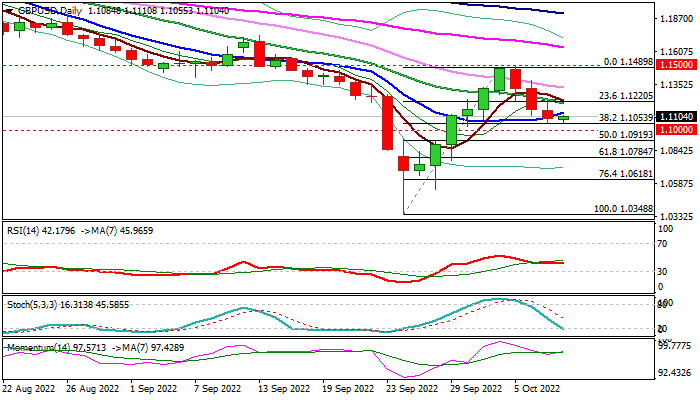
The pound has gotten off the new week on the backfoot, slipping below the 38.2% Fibonacci retracement level of $1.1112 of the September-August down selloff. After originally acting as support, the 38.2% Fibonacci has turned into an immediate resistance level. Any positive surprise in this week’s releases could help cable recover above it. But there are plenty of obstacles. The 20-day moving average (MA) stands at $1.1205, the 50% Fibonacci is at $1.1338, and the 50-day MA is approaching the 61.8% Fibonacci at $1.1563. Any short-term bounce is unlikely to have enough strength to overcome the 50-day MA, at least not before Kwarteng’s fiscal plan at the end of the month.
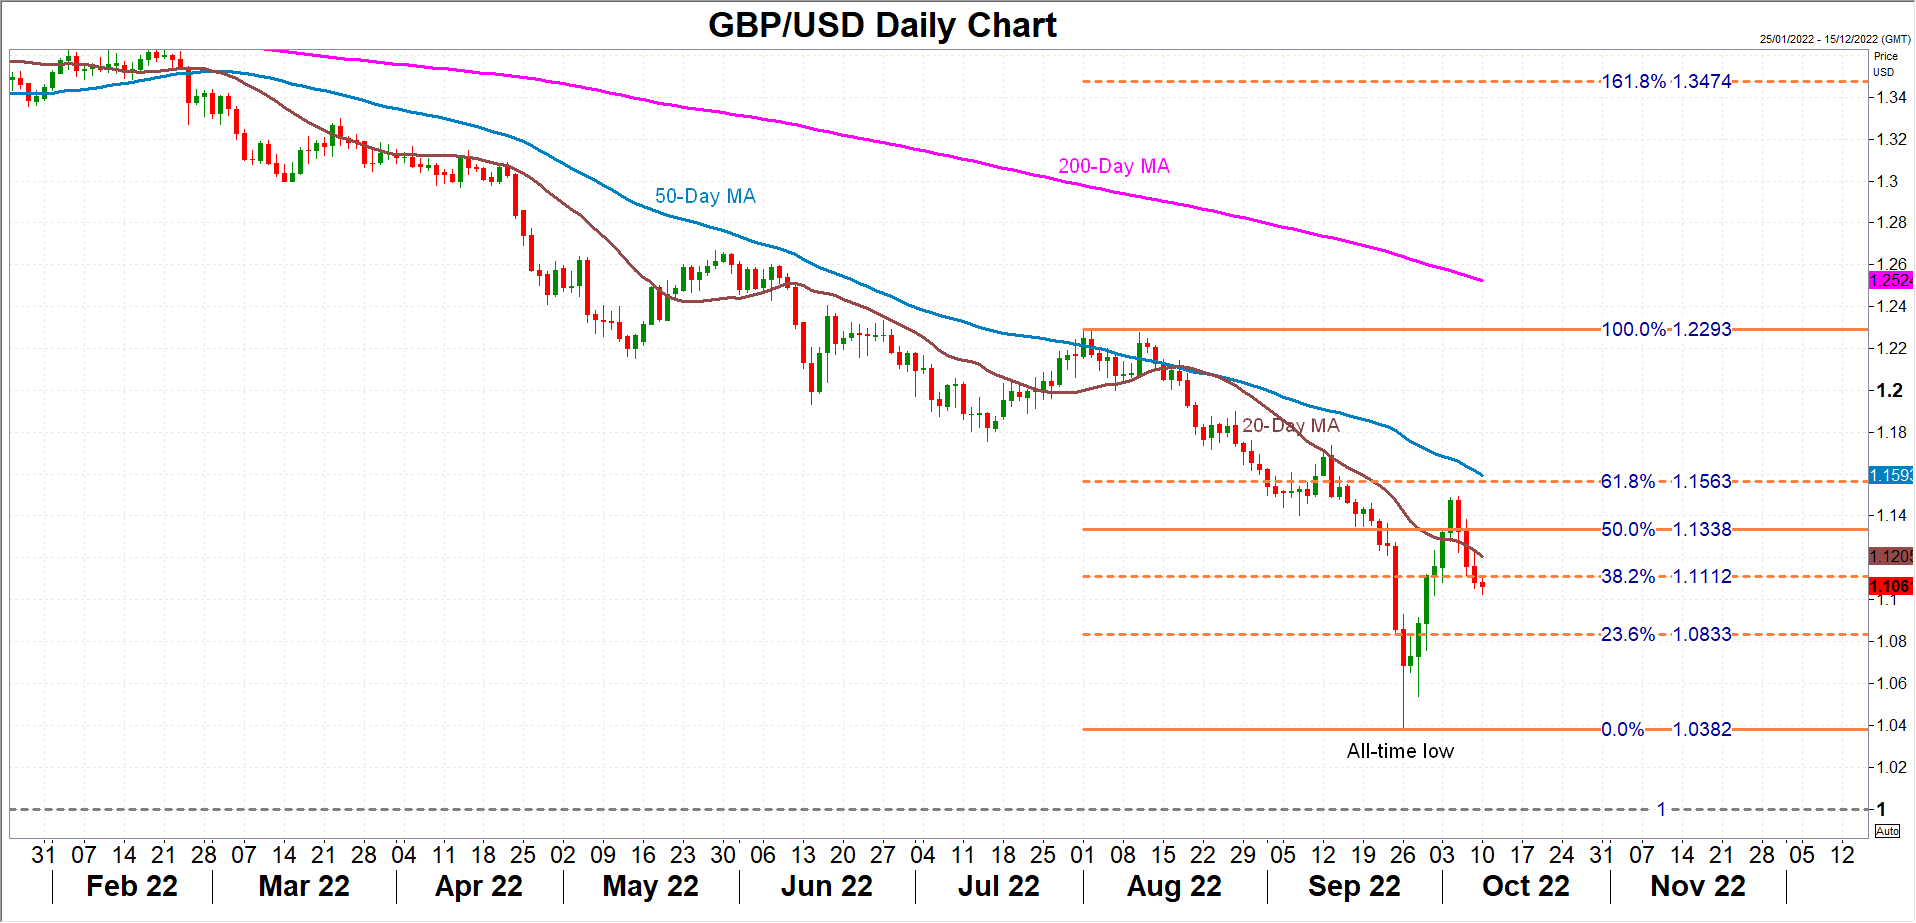
In the meantime, if the current slide picks up further negative momentum, the 23.6% Fibonacci of $1.0833 is the only thing standing in the way of the all-time low of $1.0382.
The Bank of England’s emergency bond-buying scheme, which was launched to calm the gilt market following the budget whiplash, put a floor under sterling’s slide. But the daily operations will cease at the end of the week, increasing the risk of a return to volatility in both the bond and currency markets from any worrisome headlines about the economy.
UK Employment and GDP Outlook
Markets are still digesting the repercussions of the Chancellor's "mini-budget". In the latest move, the BOE increased the amount of authorized buybacks through TECRF facility. That's the intervention launched to shore up the pound in the wake of the announcement of financial reforms. Despite a rebound in the later part of September, cable has resumed its longer-term downward trend against the dollar. However, that has been aided in large part by the unexpected drop in the US unemployment rate, which increased the bets that the Fed would raise rates by 75bps at its next meeting.
Now, the main concern surrounding the budget appears to be the uncertainty. In that situation, the market often assumes the worst. As presented, the budget appears to increase spending (which is pro-inflationary), while reducing taxes (which questions the financial stability of the government). The combined response is to expect the BOE to hike rates more aggressively to fend off the expected increase in inflation.
Bringing things back to reality
Depending on how the "mini-budget" is financed, however, it could allay many of those concerns. The problem is that the key "detail" won't be available until the end of November, and the BOE will have to decide at their next meeting before that. It also opens questions of just how well planned this plan was, since the long wait is ostensibly to figure out where to get the financing for the spending. It doesn't inspire confidence that the government is issuing a plan to increase spending and cut taxes without having first ironed out where the financing for that will come from.
In the meantime, there is rampant speculation that the government will cut government expenditures on a wide range of services, from pensions to government employment. That makes investors nervous, and likely would lead to even less popularity of an already unpopular government. The Labour Party, already leading in the polls, would be expected to radically change the financial situation.
Getting the data in hand
Government spending is included in GDP measures, meaning that if one of the ways to balance the budget is to reduce government outlays, it would put downward pressure on the leading measure of economic growth. Last quarter GDP was revised in the final reading to be barely positive at 0.2%, from a flash reading of -0.1%.
On Wednesday, the UK reports August GDP, which is expected to come in at -0.1% compared to +0.2% in July. The BOE has warned that a recession is coming, and now traders are focused on the September data to see if Q3 will be the start of that.
Employment figures
On Tuesday, the UK will release September Claimant Count numbers, which are expected to show a relatively modest increase to 10K from 6.6K. Remember that the higher the number, the more negative it is for the markets, since it accounts for the number of people seeing unemployment assistance.
The total employed figure from the rolling three months to July is also released at the same time, but is unlikely to move the markets despite a surprising forecast. The expected significant drop in employment is due to a technicality, of the unusually high number in April rolling off.
Fed Evans sees interest rate above 4.5% early next year
Chicago Fed President Charles Evans said, "we can bring inflation down relatively quickly while also avoiding a recession." He pointed to Fed's projections that unemployment rate will rise form current 3.5% to 4.4% by the end of next year. Core inflation will dropped from August's 6.2 to 2.8% then.
That's a "pretty good looking soft landing," he said. "While this does represent a noticeably softer labor market when compared with today's, these certainly are not recession-like numbers."
Evans saw federal funds rising to "a bit above 4.5%" early next year, then "remaining at this level for some time."
Gold Price Moved into a Short-Term Bearish Zone Below $1,715
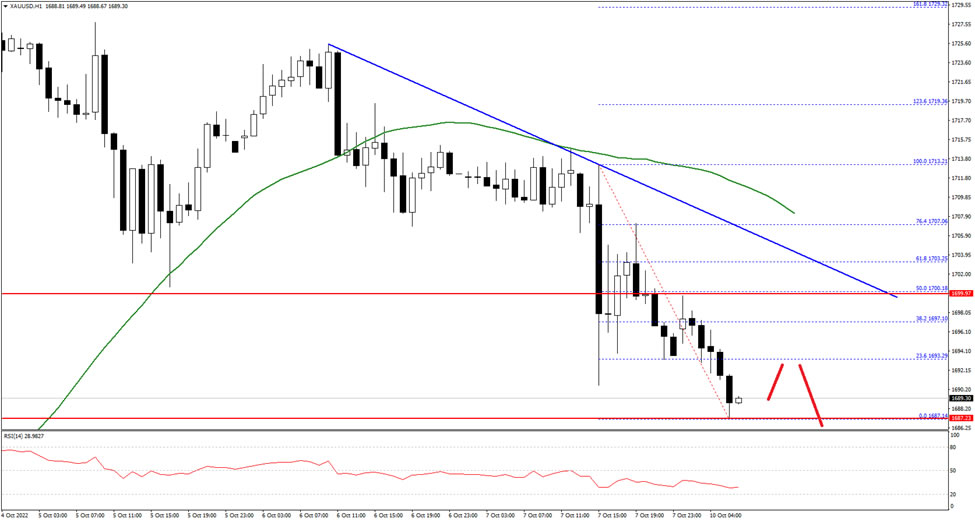
Gold price started a downside correction from the $1,730 zone against the US Dollar. The price declined below the $1,715 level to move into a short-term bearish zone.
The pair even declined below the $1,700 level and the 50 hourly simple moving average. A low was formed near $1,687 and the pair is now consolidating losses. On the downside, the price is holding the $1,685 support zone.
The next major support is near the $1,680 level, below which the price might decline towards the $1,665 support level in the near term. Any more losses might call for a test of $1,650 on FXOpen.
On the upside, the first major resistance is near the $1,695 level. The next main resistance could be near the $1,700 level and a connecting bearish trend line on the hourly chart, above which the price could start another steady increase.
WTI Oil: Bulls Face Strong Headwinds from Falling Daily Cloud
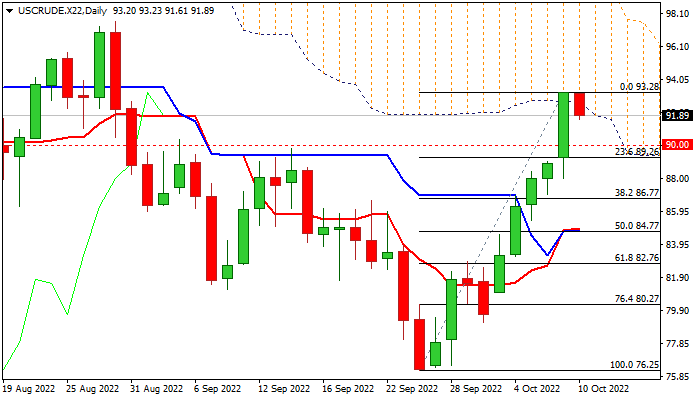
WTI oil price eases in early Monday, following strong acceleration on Friday and last week’s 15% advance (the biggest weekly rally since the last week of February).
Traders start to collect profits as daily studies are overbought and Friday’s rally penetrated falling thick daily cloud, which provides strong resistance.
The oil was strongly boosted by the OPEC+ decision last week to cut production by 2 million barrels per day, in already tight market and despite the US strongly opposing such move, as high oil prices ahead of mid-term election in the US, would disappoint voters.
On the other side, persisting worries of China’s economic slowdown that would negatively impact a global demand, warn that the latest acceleration may lose traction
Supportive technical factors for oil were formation of reversal pattern and a bear-trap on weekly chart, though weekly studies are still mixed and lack stronger direction signal.
Overstretched daily indicators and falling cloud weigh on near-term action, with first scenario of a shallow correction finding support at $90/$89.26 (psychological / Fibo 23.6% of $76.25/$93.28) that would keep bulls intact for fresh penetration into daily cloud (cloud base lays at $92.70) and extension towards next pivotal barrier at $94.36 (Fibo 38.2% of $123.65/$76.25).
Caution on break of these levels that would risk drop towards the lower pivot at $86.77 (Fibo 38.2% of $76.25/$93.28).
Res: 92.70; 93.28; 94.36; 95.72.
Sup: 91.00; 90.00; 89.26; 88.49.
EURUSD Retreats after Rebound Falters
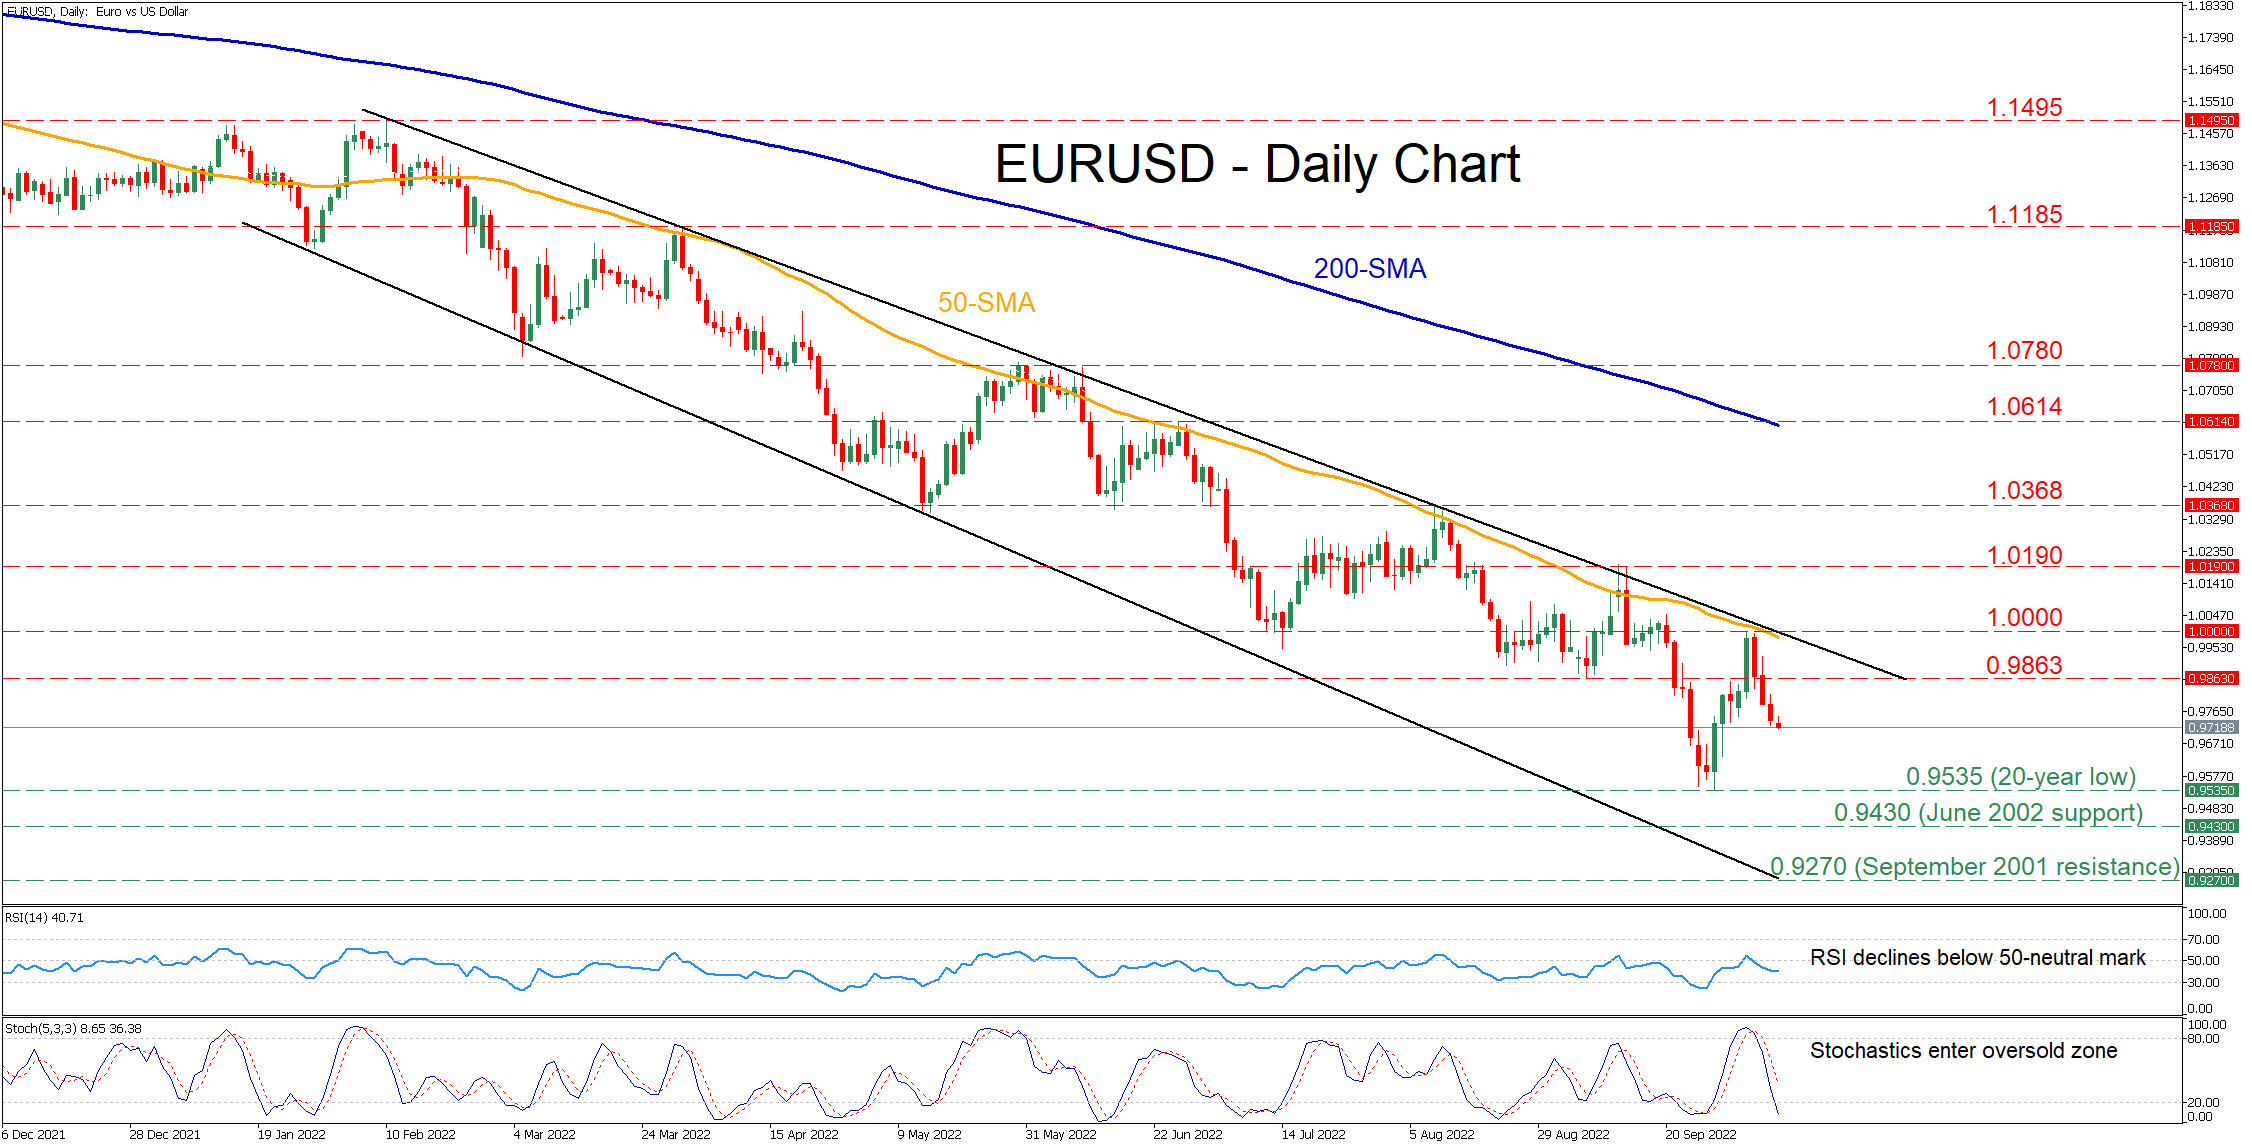
EURUSD has been losing ground since the beginning of the year, creating a clear structure of lower highs and lower lows within a descending channel. Although the pair managed to post a moderate rebound after finding its feet at the 20-year low of 0.9430, it quickly retraced back as the 50-day simple moving average (SMA) curbed the upside.
The momentum indicators currently suggest that the negative near-term bias is strengthening. Specifically, the RSI is declining below its 50-neutral mark, while the stochastic oscillator has retreated into the 20-oversold territory.
Should selling pressures persist, the price could initially test the 20-year low of 0.9535. If that floor collapses, the June 2002 support of 0.9430 may then provide downside protection. Failing to halt there, the September 2001 resistance of 0.9270 might prove to be the next tough barrier for the bears to overcome.
On the flipside, bullish actions could propel the price towards the August low of 0.9863, which could now act as resistance. Conquering this barricade, the spotlight may turn to parity, which is considered a crucial psychological mark by markets. Even higher, the bulls could aim for 1.0190 before the August peak of 1.0368 comes under examination.
In brief, it seems that a new round of weakness has started for EURUSD, with the price declining towards its recent lows. For that bearish sentiment to reverse, the price needs to clearly break above its descending trendline.
USDJPY Retains Bullish Outlook
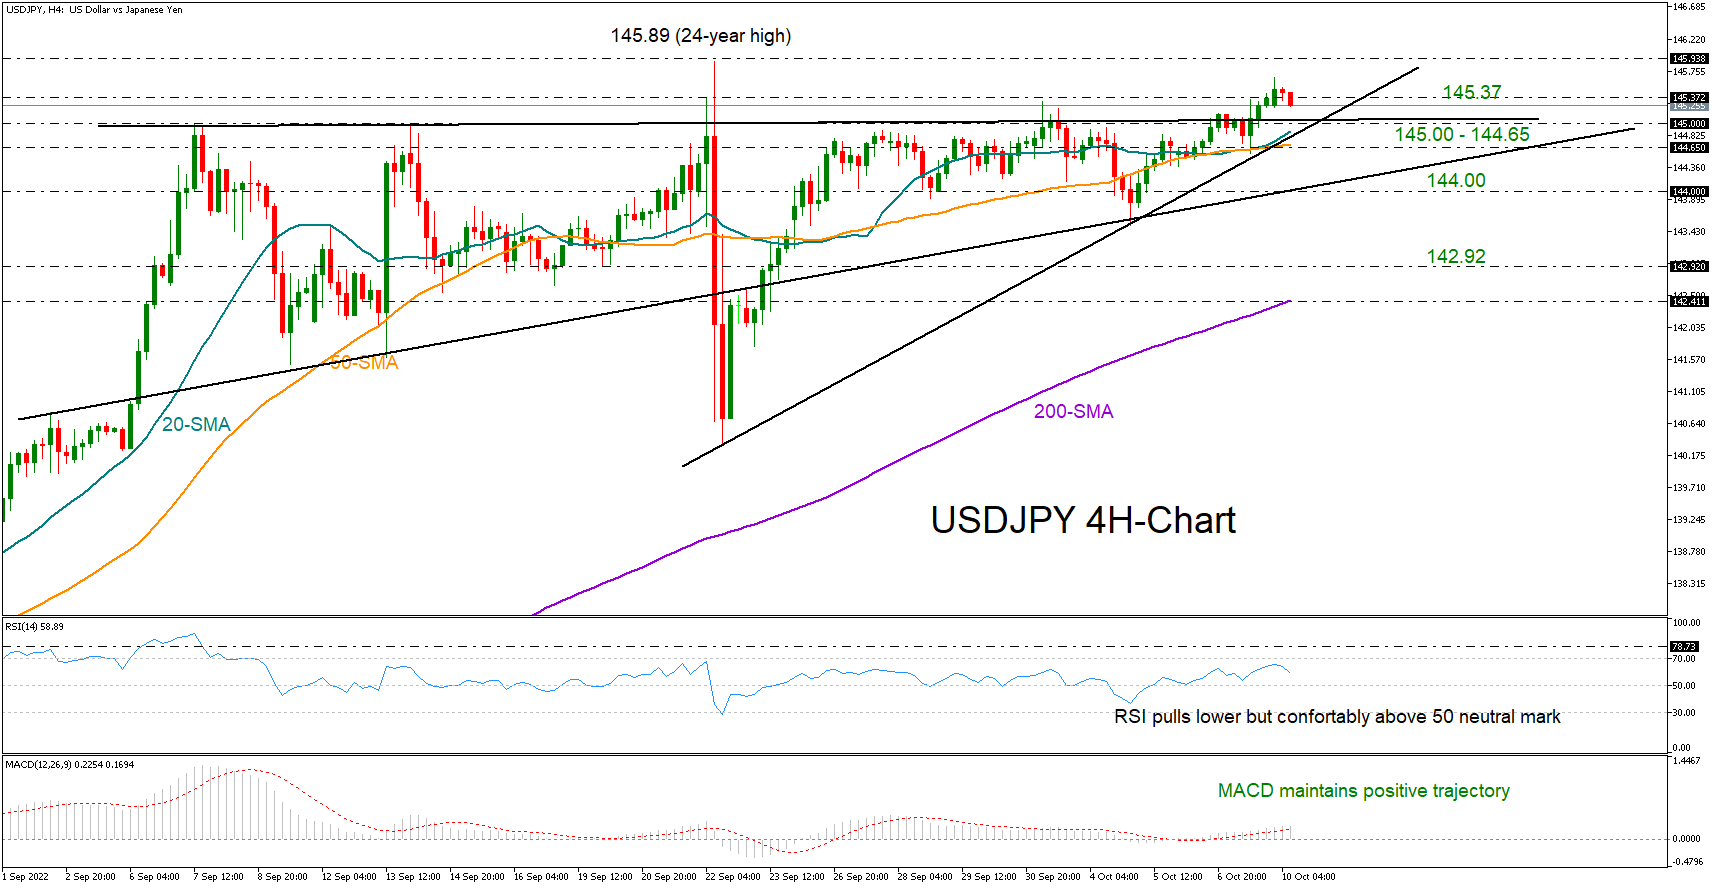
USDJPY inched slightly lower to retest Friday’s constraints in the four-hour chart after stretching its gains moderately up to 145.66 – the highest in almost three weeks.
Previously, the pair closed marginally above an ascending triangle, raising confidence that the bullish trend could see further continuation. That could preserve the buying the dip mentality in the near term. Besides, with the MACD and the RSI maintaining a positive trajectory within the bullish area, and the 20-day simple moving average (SMA) avoiding a bearish intersection with the 50-day SMA, upside movements are more likely than negative ones.
If the price sets a strong foothold around the September 22 high of 145.37, the bulls may push again towards the 24-year high of 145.89. A decisive break higher could give the green light for a quick advance towards the 1998 top of 147.71. Beyond the latter, the next obstacle could develop somewhere between 149 and 150.
In the event the price keeps moving lower, the 145.00 – 144.65 zone, which includes the 20- and 50-day SMAs, as well as the ascending trendline drawn from the low of 140.34, could protect buying interest. Failure to bounce here may confirm additional losses to 143.90, where a constraining line from early September is currently positioned. Should that floor collapse as well, the 143.00 support area may next attract attention ahead of the 200-day SMA.
All in all, USDJPY seems to have more room for improvement despite slightly retracing its gains over the past couple of hours. Traders may wait for a successful rebound within the 145.00 – 144.65 region before they engage in more buying.
GBP/USD Outlook: Bears Taking a Breather above Fibo Support at 1.1053
Cable starts the week in a quiet mode and holding within a narrow range above 1.1053 (Fibo 38.2% of 1.0348/1.1489 upleg / last Friday’s low) where the strong fall in past three days found temporary footstep.
Near-term structure was weakened on quick pullback after a double upside rejection at 1.1500 zone, as the pair was down 3.3 on Wed/Fri drop.
Solid US labor data last Friday added to expectations for another Fed’s big rate increase next month, contributing to weak near-term sentiment.
Daily studies show moving averages in bearish setup and strong negative momentum, although oversold stochastic is slowing bears for now.
Upticks should stay capped by falling 20DMA (1.1208) to keep near-term bears off 1.1500 zone in play, however, clear break of 1.1053 Fibo level and psychological 1.10 support is needed to signal bearish continuation and expose target at 1.0784 (Fibo 61.8% of 1.0348/1.1489).
Res: 1.1137; 1.1208; 1.1327; 1.1383.
Sup: 1.1053; 1.1000; 1.0919; 1.0784.
EUR/USD: The Last Leg of the Bullish Correction IV Could Have Just Begun
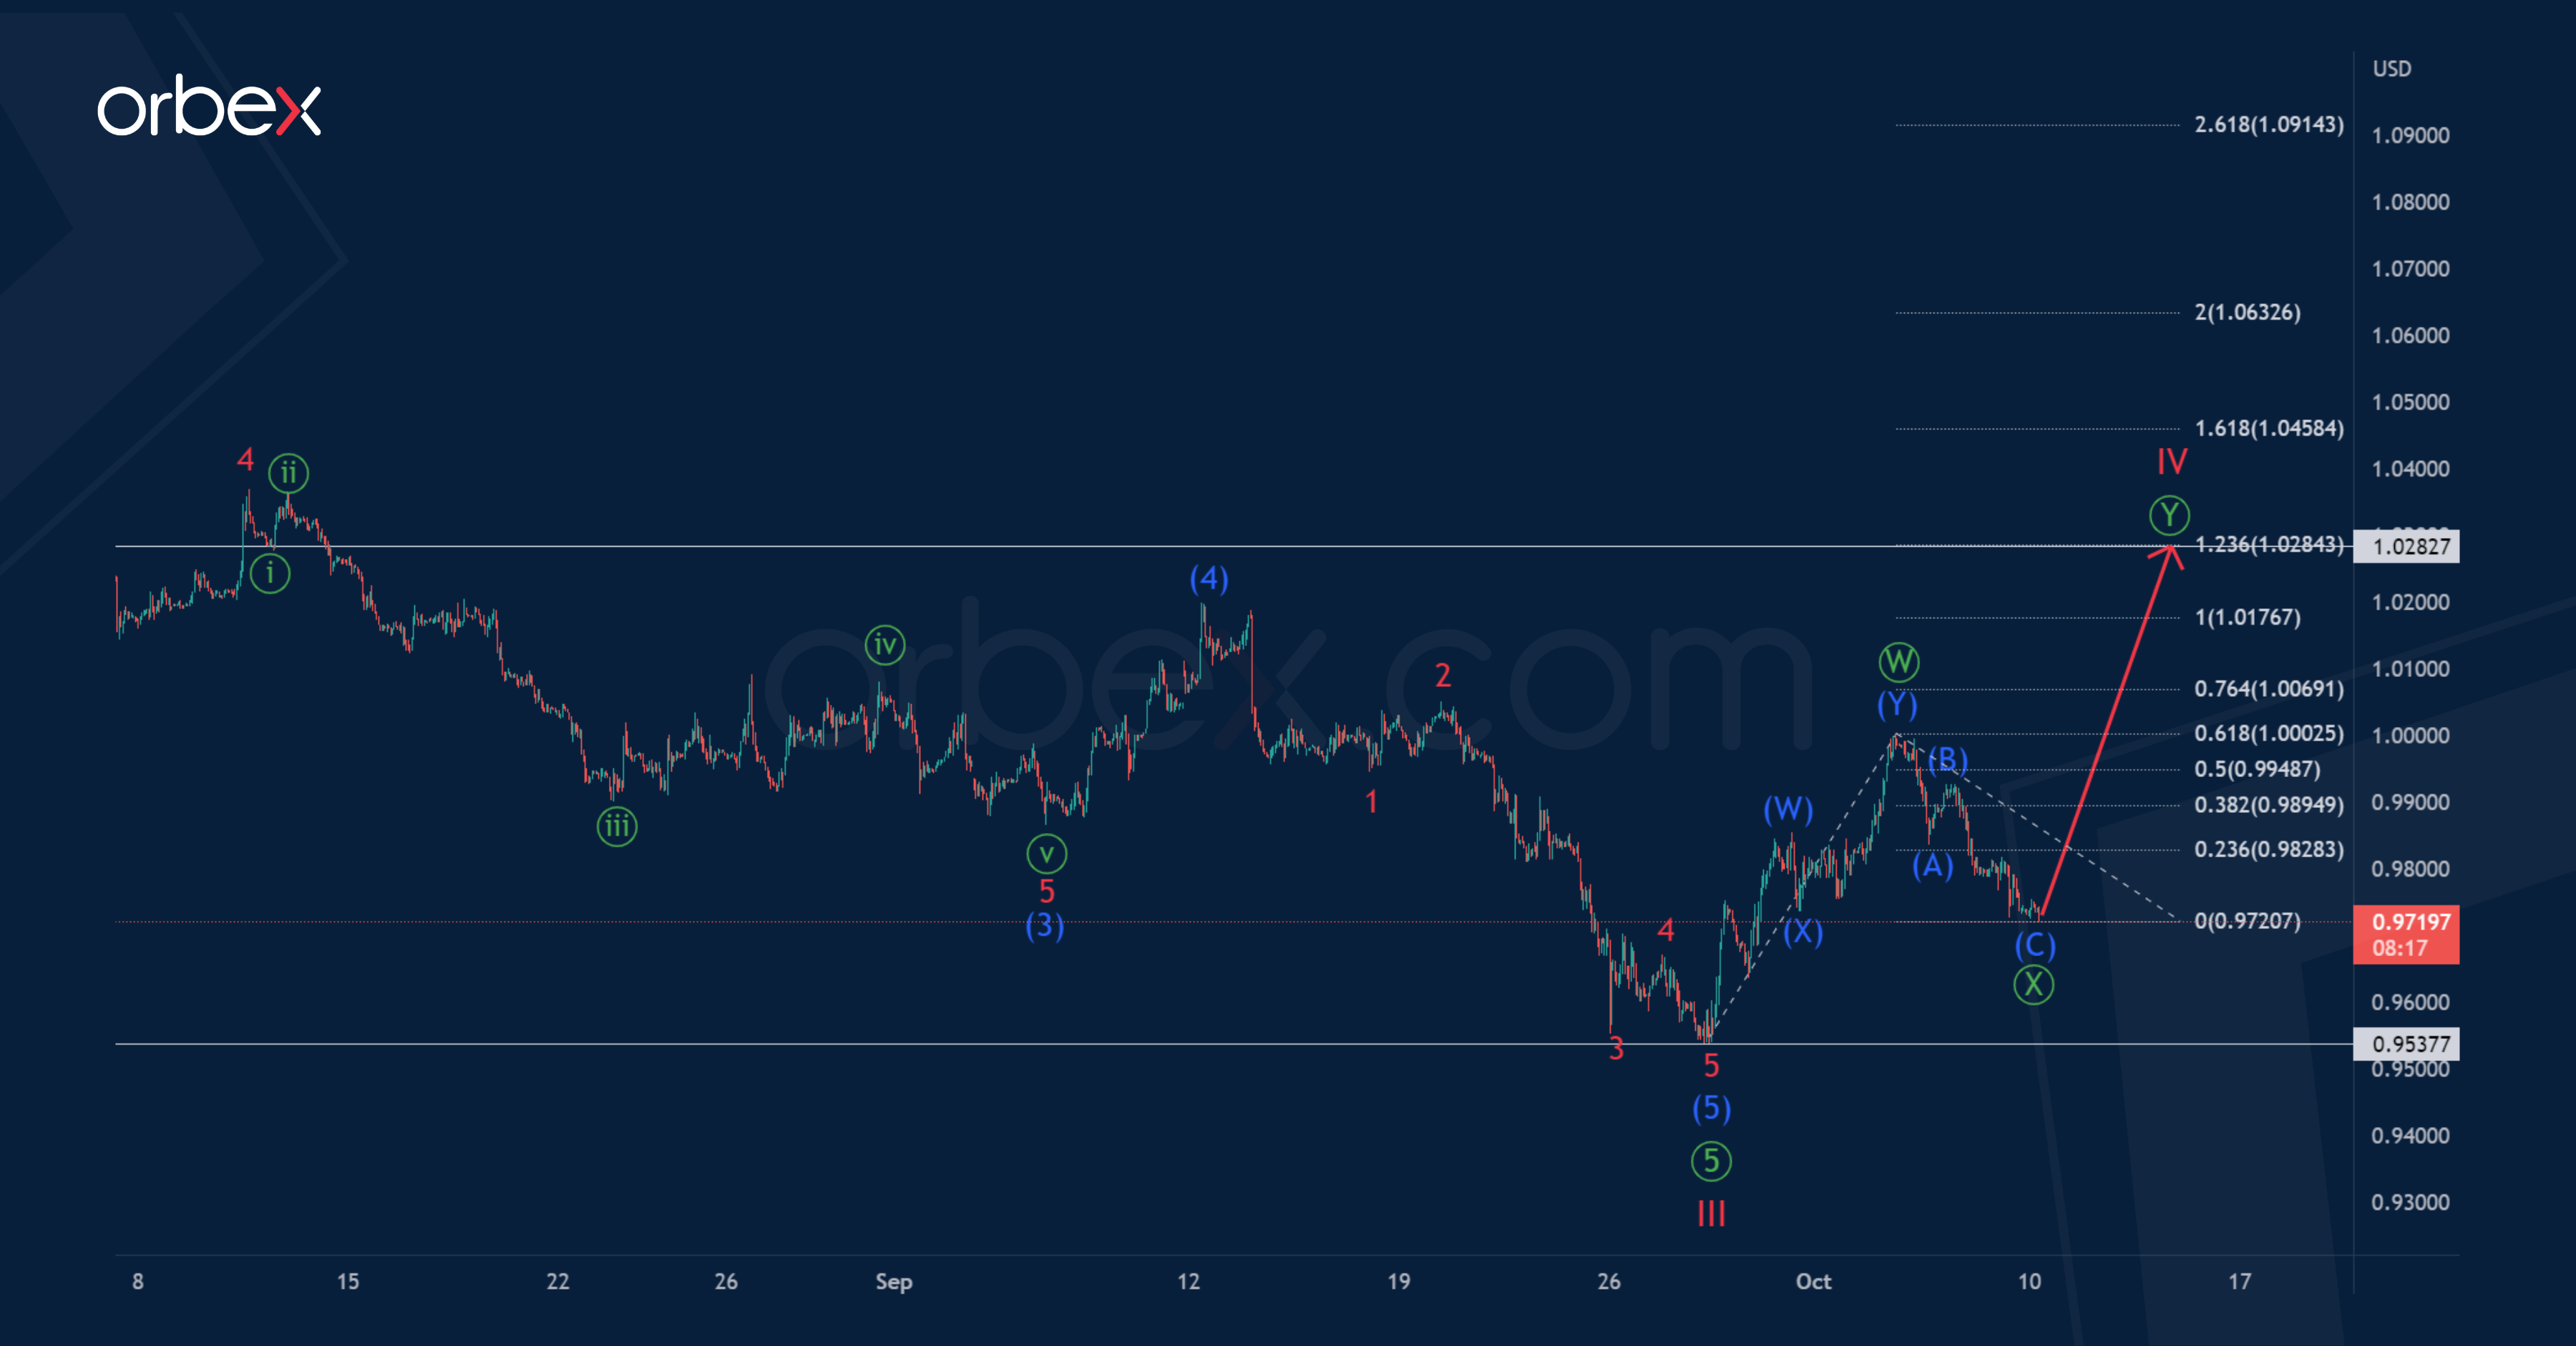
In the long term, the EURUSD currency seems to be forming a bearish cycle impulse, which consists of five main sub-waves I-II-III-IV-V.
Most likely, the cycle impulse sub-wave III was fully completed, after which the formation of the horizontal correction IV began. This correction is similar to a double zigzag consisting of primary sub-waves Ⓦ-Ⓧ-Ⓨ.
The primary sub-waves Ⓦ and Ⓧ look complete. The development of the last sub-wave is expected in the near future. Its end is expected at 1.0282. At that level, wave Ⓨ will be at 123.6% of first actionary wave Ⓨ.
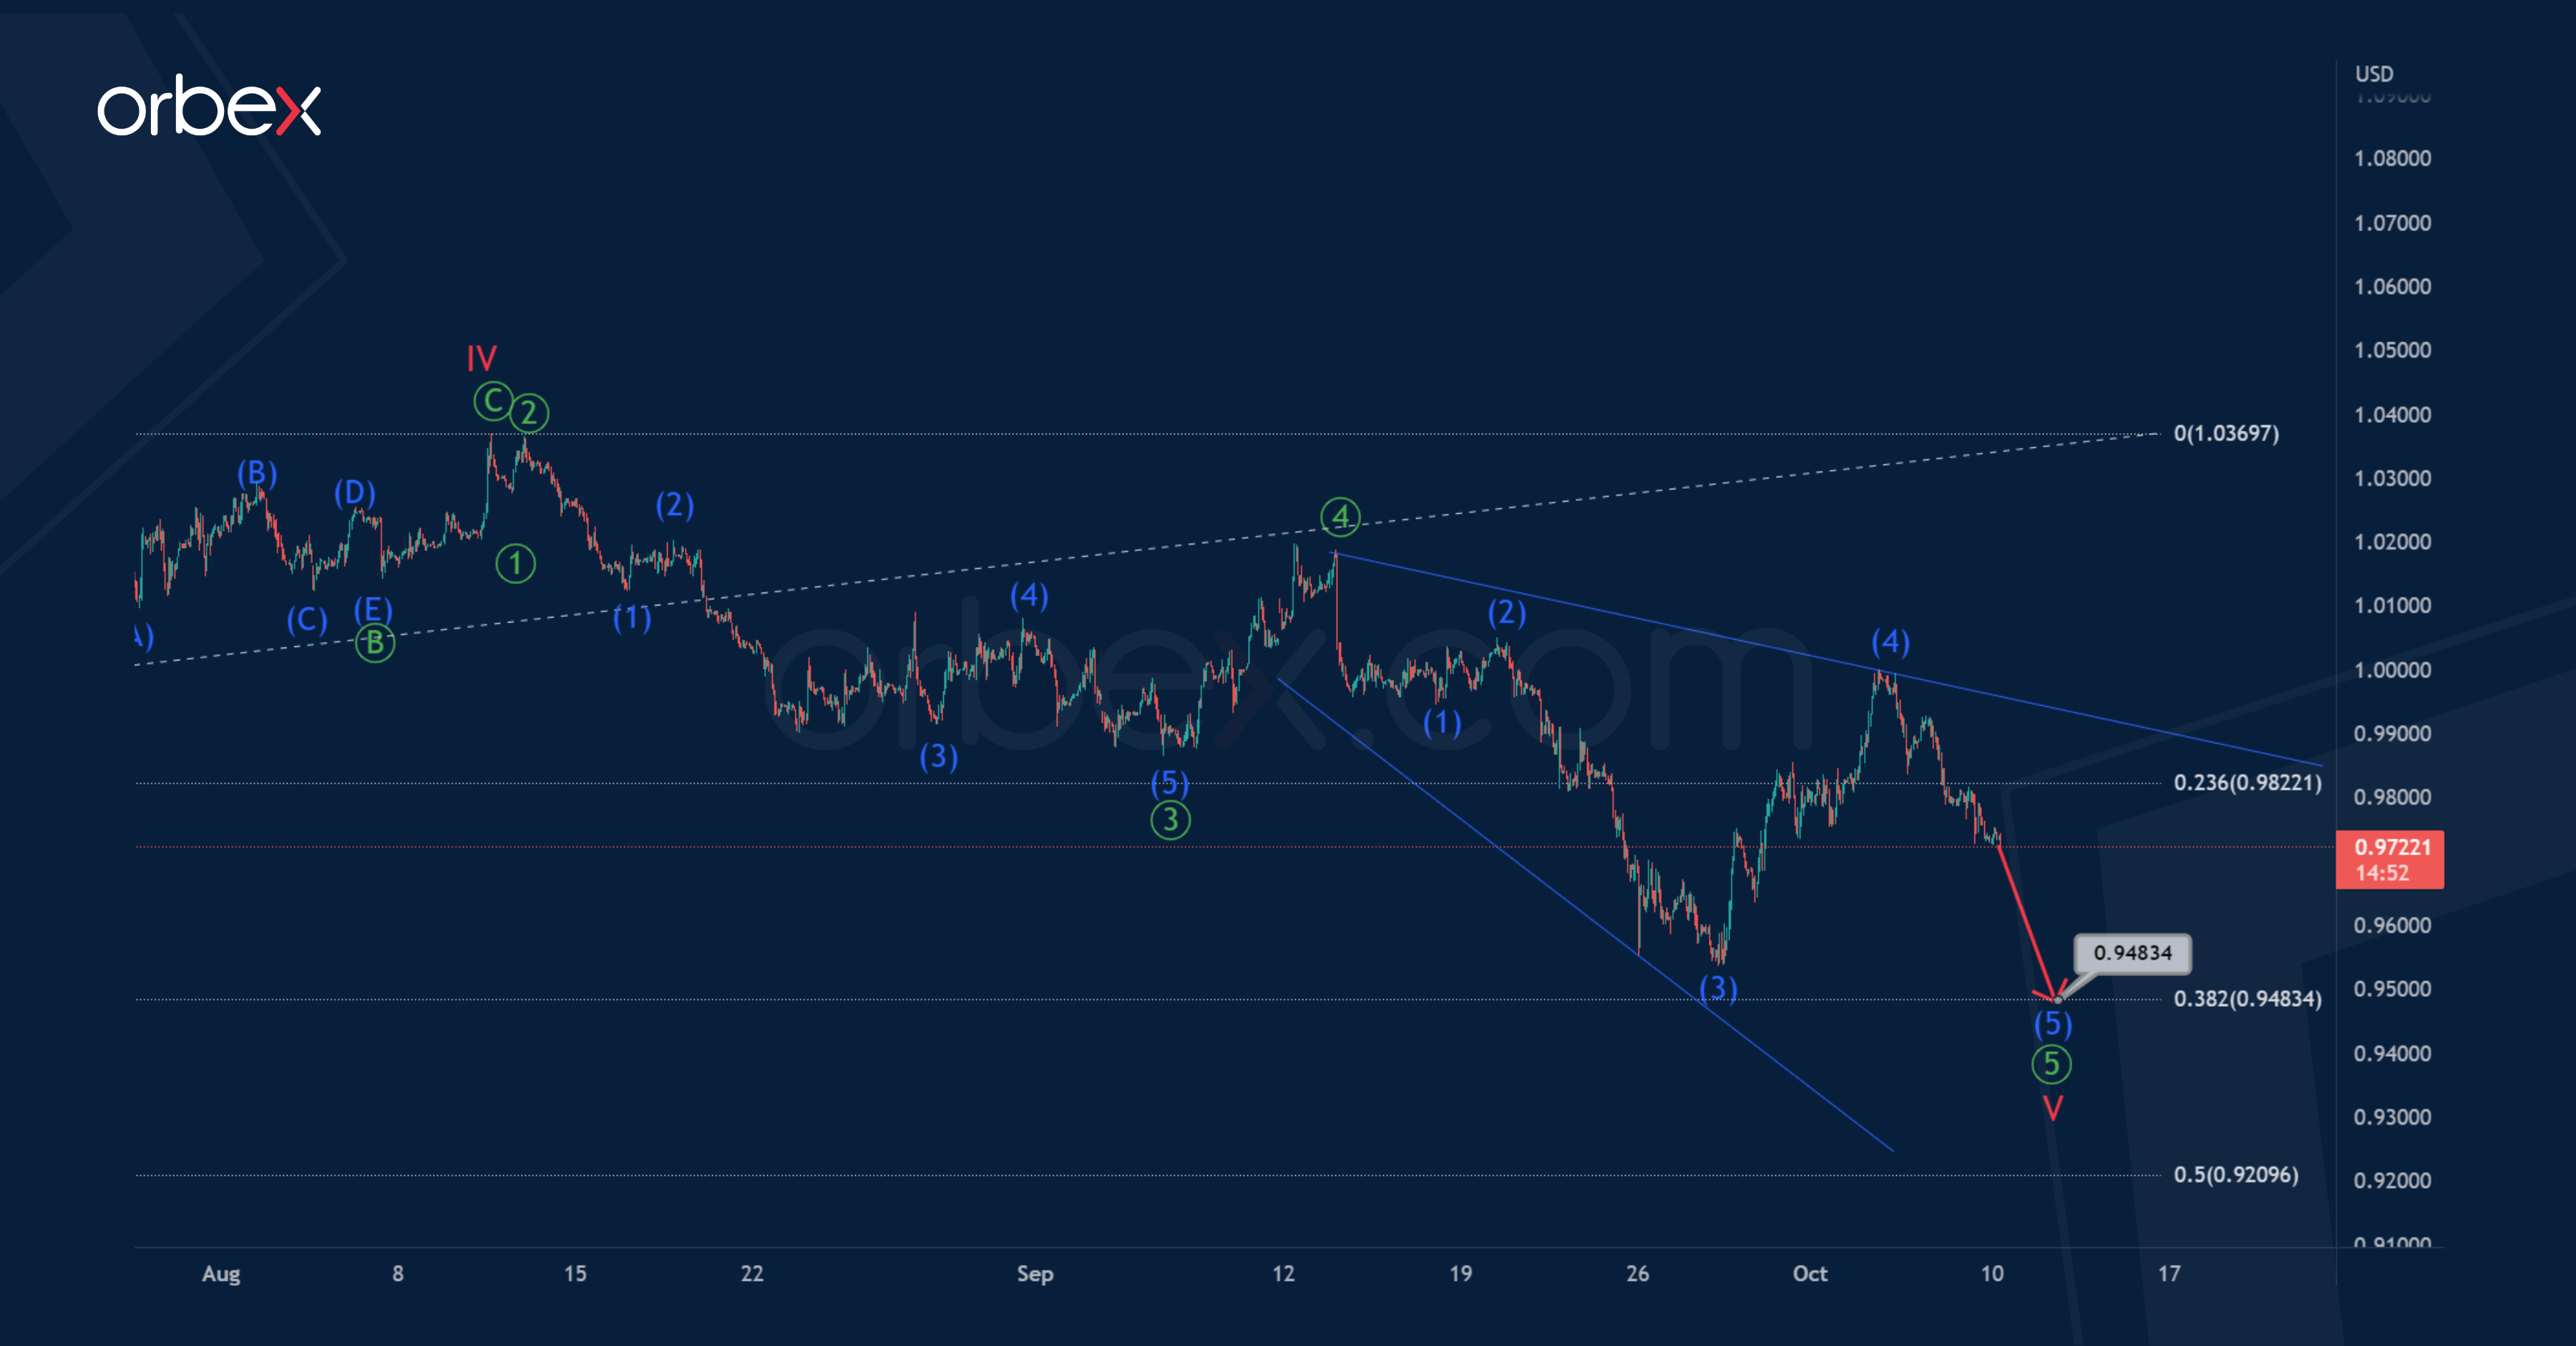
According to the alternative, the cycle correction IV has been completed and it is a standard zigzag Ⓐ-Ⓑ-Ⓒ.
In the last section of the chart, we can notice the development of the last leg of the cycle wave V, which takes the form of a primary impulse ①-②-③-④-⑤.
The last fifth of this impulse, that is, the sub-wave ⑤, most likely takes the form of an ending diagonal. We see that the correction sub-wave (4) has gone above the end of the correction sub-wave (1).
In the near future, the market is expected to decline in the sub-wave (5) to 0.948. At that level, the entire cycle wave V will be at 38.2% of wave III.
ECB Villeroy: Takes 2 to 3 years to bring inflation back to target
ECB Governing Council member Francois Villeroy de Galhau said the central bank is engaged in bringing down inflation to 2% target in "two to three years" time. "It is a very strong signal the central bank sends to all economic players that we will bring down inflation to the target", he said.
Another Governing Council member Mario Centeno said, "normalization of monetary policy is absolutely necessary and desired." But he added, that "policy normalization must be gradual... A policymaker cannot become a factor of instability".